2
RESEARCH METHODOLOGY
44
5
MARKET OVERVIEW
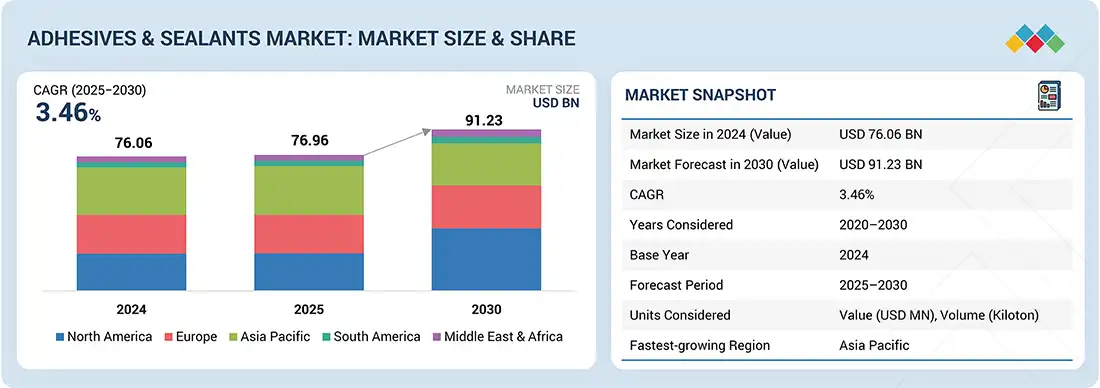
Global adhesive market surges, driven by construction, medical demand, and hybrid resin innovation.
62
5.2.1.1
Growth of building & construction industry
5.2.1.2
Increased demand for adhesives in medical industry
5.2.1.3
Growth in appliance industry
5.2.2.1
Stringent environmental regulations in North America and Europe
5.2.2.2
Technological limitations in adhesives industry
5.2.3.1
Investments in emerging markets of Asia Pacific
5.2.3.2
Increased industrial activity due to globalization
5.2.3.3
Development of hybrid resins for manufacturing high-performance adhesives
5.2.4.1
Regulatory compliance
5.3
PORTER'S FIVE FORCES ANALYSIS
5.3.1
THREAT OF NEW ENTRANTS
5.3.2
THREAT OF SUBSTITUTES
5.3.3
BARGAINING POWER OF BUYERS
5.3.4
BARGAINING POWER OF SUPPLIERS
5.3.5
INTENSITY OF COMPETITIVE RIVALRY
5.4
MACROECONOMIC INDICATOR
5.4.2
GDP TRENDS AND FORECAST
5.4.3
TRENDS OF GLOBAL CONSTRUCTION INDUSTRY
6
INDUSTRY TRENDS
Navigate emerging industry disruptions with strategic insights into supply chain and pricing dynamics.
71
6.1
SUPPLY CHAIN ANALYSIS
6.3
INVESTMENT AND FUNDING SCENARIO
6.4
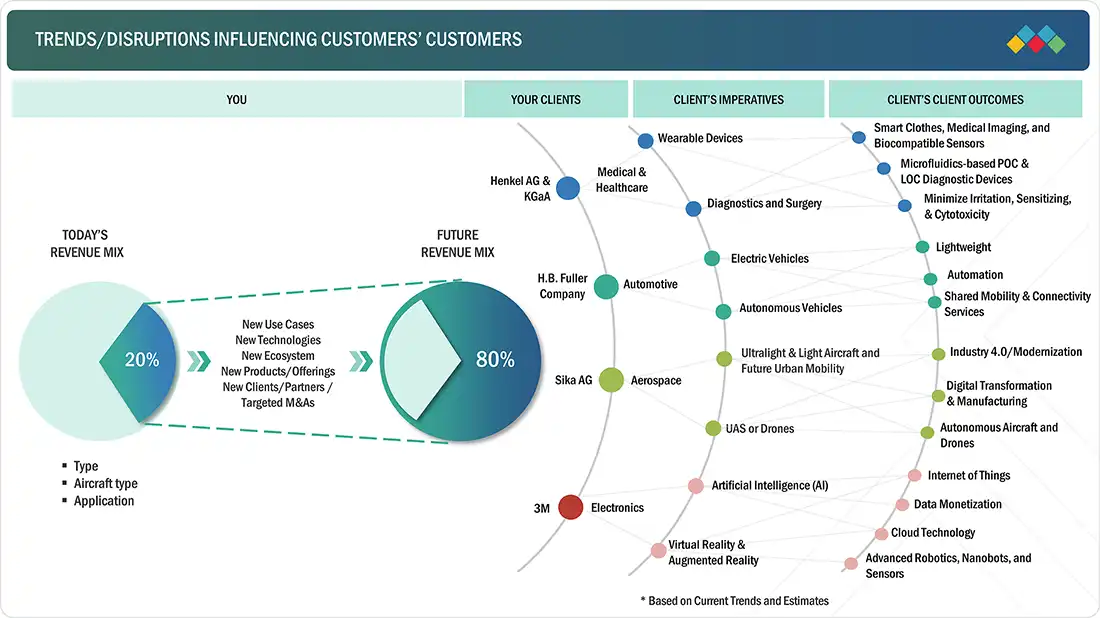
TRENDS AND DISRUPTIONS IMPACTING CUSTOMER BUSINESS
6.5
KEY STAKEHOLDERS & BUYING CRITERIA
6.5.1
KEY STAKEHOLDERS IN BUYING PROCESS
6.6.1
PRICE RANGE OF ADHESIVES OFEERED BY KEY PLAYERS, BY APPLICATION
6.6.2
PRICING RANGE OF ADHESIVES OFFERED BY KEY PLAYER, BY APPLICATION, 2024
6.6.3
PRICE RANGE OF SEALANTS OFFERED BY KEY PLAYERS, BY APPLICATION
6.6.4
PRICING RANGE OF SEALANTS OFFERED BY KEY PLAYER, BY APPLICATION, 2024
6.6.5
AVERAGE SELLING PRICE TREND OF ADHESIVES, BY REGION, 2022–2030
6.6.6
AVERAGE SELLING PRICE TREND OF SEALANTS, BY REGION, 2022–2030
6.7.1
IMPORT SCENARIO (HS CODE 3506)
6.7.2
EXPORT SCENARIO (HS CODE 3506)
6.8.1
REGULATIONS AND STANDARDS
6.8.2
REGULATORY BODIES, GOVERNMENT AGENCIES, AND OTHER ORGANIZATIONS
6.10.1.4
Reactive & others
6.10.2
COMPLEMENTARY TECHNOLOGIES
6.10.2.1
Curing technology
6.10.2.2
Sustainability technology
6.10.2.3
Testing & quality control technologies
6.11
KEY CONFERENCES & EVENTS IN 2024–2025
6.12.4
JURISDICTION ANALYSIS
6.13
IMPACT OF 2025 US TARIFF – ADHESIVES & SEALANTS MARKET
6.13.3
PRICE IMPACT ANALYSIS
6.13.4
IMPACT ON COUNTRY/REGION
6.13.5
IMPACT ON END-USE INDUSTRIES:
6.14
IMPACT OF AI/GEN AI ON ADHESIVES & SEALANTS MARKET
7
ADHESIVES & SEALANTS MARKET, BY TYPE
Market Size & Growth Rate Forecast Analysis to 2030 in USD Million and Kilotons | 12 Data Tables
101
7.2.1
RAPID INDUSTRIALIZATION AND DIVERSE APPLICATIONS DRIVING ADHESIVES MARKET GROWTH
7.3.1
INCREASING URBANIZATION AND INDUSTRIALIZATION BOOST SEALANTS INDUSTRY
8
ADHESIVES MARKET, BY TECHNOLOGY
Market Size & Growth Rate Forecast Analysis to 2030 in USD Million and Kilotons | 123 Data Tables
107
8.2
WATER-BASED ADHESIVES
8.2.1
ASIA PACIFIC TO BE FASTEST-GROWING MARKET FOR WATER-BASED ADHESIVES
8.2.2
PVA EMULSION ADHESIVES
8.2.3
ACRYLIC POLYMER EMULSION ADHESIVES
8.2.4
VAE EMULSION ADHESIVES
8.2.5
SBC LATEX ADHESIVES
8.2.6.1
Polyurethane dispersion adhesives
8.2.6.2
Water-based rubber adhesives
8.3
SOLVENT-BASED ADHESIVES
8.3.1
STRINGENT GOVERNMENT REGULATIONS TO RESTRICT USE OF SOLVENT-BASED ADHESIVES
8.3.2
POLYURETHANE ADHESIVES
8.3.4
CHLOROPRENE RUBBER (CR) ADHESIVES
8.3.5
POLYVINYL ACETATE (PVA) ADHESIVES
8.3.6
POLYAMIDE ADHESIVES
8.3.7
SYNTHESIZED RUBBER ADHESIVES
8.4.1
FAST-SETTING SPEED AND RELATIVELY LOWER COST DRIVING DEMAND FOR HOT-MELT ADHESIVES
8.4.2
ETHYLENE-VINYL ACETATE (EVA) ADHESIVES
8.4.3
STYRENIC BLOCK COPOLYMER (SBC) ADHESIVES
8.4.4
METALLOCENE POLYOLEFIN (MPO) ADHESIVES
8.4.5
POLYOLEFIN ADHESIVES
8.4.6
AMORPHOUS POLY-ALPHAOLEFIN (APAO) ADHESIVES
8.4.7.2
Polyurethane (PUR)
8.4.7.3
Other Resin Types
8.5.1
FASTEST-GROWING ADHESIVE TECHNOLOGY DURING FORECAST PERIOD
8.5.2
POLYURETHANE-BASED ADHESIVES
8.5.3
EPOXY-BASED ADHESIVES
8.5.4.1
Polysulfide adhesives
8.5.4.2
Modified acrylate & methyl methacrylate (MMA) adhesives
8.5.4.3
Cyanoacrylate adhesives
8.5.4.4
Anaerobic adhesives
8.5.4.5
Formaldehyde-based (reactive-based) adhesives
8.5.4.10
Natural and bio-based adhesives
9
ADHESIVES MARKET, BY APPLICATION
Market Size & Growth Rate Forecast Analysis to 2030 in USD Million and Kilotons | 44 Data Tables
161
9.2.1
HIGH DEMAND FOR FLEXIBLE PACKAGING TO DRIVE MARKET
9.3
BUILDING & CONSTRUCTION
9.3.1
DEVELOPMENT OF SMART CITIES AND MEGAPROJECTS TO DRIVE GROWTH
9.4.1
GROWTH OF FURNITURE INDUSTRY TO DRIVE MARKET
9.5
AUTOMOTIVE & TRANSPORTATION
9.5.1
ADVANCEMENTS IN ELECTRIC VEHICLES TO FUEL DEMAND FOR ADHESIVES
9.6.1
INCREASING DEMAND FOR LOW-STRENGTH AND DURABLE ADHESIVES TO DRIVE MARKET
9.7.1
RISING DEMAND FOR ATHLETIC FOOTWEAR TO DRIVE MARKET
9.8.1
WIDE USE OF ADHESIVES IN MANUFACTURING SECTOR TO BOOST MARKET
9.9.1
NEW TRENDS AND TECHNOLOGICAL INNOVATIONS TO FUEL MARKET
9.10.1
GROWING USE OF SILICONE ADHESIVES TO DRIVE MARKET
10
SEALANTS MARKET, BY RESIN TYPE
Market Size & Growth Rate Forecast Analysis to 2030 in USD Million and Kilotons | 32 Data Tables
182
10.2.1
BETTER FLEXIBILITY AND LONGER SHELF LIFE TO DRIVE DEMAND
10.3.1
HIGH DEMAND IN AUTOMOTIVE APPLICATIONS TO DRIVE MARKET
10.4.1
INCREASING APPLICATION IN AUTOMOBILES TO DRIVE MARKET
10.5.1
GROWING USE IN CONSTRUCTION SECTOR TO DRIVE MARKET
10.6.1
INCREASING DEMAND FOR INSULATING GLASS SEALANTS TO DRIVE MARKET
10.7.1
HIGHER STABILITY AGAINST OXIDATION TO FUEL DEMAND
11
SEALANTS MARKET, BY APPLICATION
Market Size & Growth Rate Forecast Analysis to 2030 in USD Million and Kilotons | 20 Data Tables
199
11.2
BUILDING & CONSTRUCTION
11.2.1
INVESTMENTS IN NEW CONSTRUCTION AND INFRASTRUCTURE TO DRIVE MARKET
11.3
AUTOMOTIVE & TRANSPORTATION
11.3.1
WIDE USE IN RADIATORS AND AUTOMOTIVE COMPONENTS TO DRIVE DEMAND FOR SEALANTS
11.4.1
RISING DEMAND FOR SEALANTS FOR HOUSEHOLD USE TO DRIVE MARKET
12
ADHESIVES & SEALANTS MARKET, BY REGION
Market Size & Growth Rate Forecast Analysis to 2030 in USD Million and Kilotons | 232 Data Tables
210
12.2.1.1
Increasing private and residential construction to drive market
12.2.2.1
Surge in construction projects to foster market growth
12.2.3.1
New constructions in residential segment to drive market
12.3.1.1
Electric mobility revolution to increase demand for adhesives & sealants in automotive industry
12.3.2.1
Growth of construction sector to drive market
12.3.3.1
Development of affordable houses and renewable energy infrastructure to foster market growth
12.3.4.1
Developments in medical industry to support market growth
12.3.5.1
Recovery of construction and automotive industries to drive market
12.3.6.1
Rapid urbanization and increasing purchasing power to boost market
12.4.1.1
Foreign investments to drive market
12.4.2.1
Government initiatives for economic growth to boost market
12.4.3.1
Growth of tourism sector to boost market
12.4.4.1
Growth in automotive and building construction industries to fuel demand
12.4.5.1
Economic stability and rising establishment of end-use industries to fuel market
12.4.6.1
Rise in automobile manufacturers to drive market
12.4.7
REST OF ASIA PACIFIC
12.5.1.1
Rising investment from government to drive market
12.5.2.1
Increase in population and improved economic conditions to drive demand
12.5.3
REST OF SOUTH AMERICA
12.6
MIDDLE EAST & AFRICA
12.6.1.3
Rest of GCC Countries
12.6.2
REST OF MIDDLE EAST & AFRICA
13
COMPETITIVE LANDSCAPE
Discover strategic moves and market dominance of key players shaping the competitive landscape.
312
13.2
KEY PLAYER STRATEGIES/RIGHT TO WIN
13.3
MARKET SHARE ANALYSIS, 2024
13.5
COMPANY EVALUATION MATRIX: KEY PLAYERS, 2024
13.5.5
COMPANY FOOTPRINT: KEY PLAYERS, 2024
13.5.5.1
Company footprint
13.5.5.2
Region footprint
13.5.5.3
Application footprint
13.6
COMPANY EVALUATION MATRIX: STARTUPS/SMES, 2024
13.6.1
PROGRESSIVE COMPANIES
13.6.2
RESPONSIVE COMPANIES
13.6.5
COMPETITIVE BENCHMARKING: STARTUPS/SMES, 2024
13.6.5.1
Detailed list of key startups/SMEs
13.6.5.2
Competitive benchmarking of key startups/SMEs
13.7
PRODUCT COMPARISON ANALYSIS
13.8
COMPANY VALUATION AND FINANCIAL METRICS
13.9
COMPETITIVE SCENARIO
14
COMPANY PROFILES
In-depth Company Profiles of Leading Market Players with detailed Business Overview, Product and Service Portfolio, Recent Developments, and Unique Analyst Perspective (MnM View)
338
14.1.1
HENKEL AG & CO. KGAA
14.1.1.1
Business overview
14.1.1.2
Products offered
14.1.1.3
Recent developments
14.1.2
H.B. FULLER COMPANY
14.1.6
HUNTSMAN CORPORATION
14.1.8
AVERY DENNISON CORPORATION
14.1.10
ILLINOIS TOOL WORKS INC.
14.2.2
PPG INDUSTRIES, INC.
14.2.3
PARKER HANNIFIN CORP
14.2.4
ADHESIVES RESEARCH, INC.
14.2.5
DELO INDUSTRIE KLEBSTOFFE GMBH & CO. KGAA
14.2.8
MERIDIAN ADHESIVES GROUP
14.2.11
PIDILITE INDUSTRIES LTD.
14.2.13
FRANKLIN INTERNATIONAL
15
ADJACENT & RELATED MARKETS
397
15.2
CONSTRUCTION SEALANTS MARKET
15.4
CONSTRUCTION SEALANTS MARKET, BY RESIN TYPE
15.5
CONSTRUCTION SEALANTS MARKET, BY APPLICATION
15.5.2
FLOORING & JOINING
15.5.3
SANITARY & KITCHEN
15.5.4
OTHER APPLICATIONS
15.6
CONSTRUCTION SEALANTS MARKET, BY END-USE INDUSTRY
15.6.3
COMMERCIAL & INFRASTRUCTURE
15.7
CONSTRUCTION SEALANTS MARKET, BY REGION
15.7.5
MIDDLE EAST & AFRICA
16.2
KNOWLEDGESTORE: MARKETSANDMARKETS’ SUBSCRIPTION PORTAL
16.3
CUSTOMIZATION OPTIONS
TABLE 1
ADHESIVES & SEALANTS MARKET: RISK ASSESSMENT
TABLE 2
ADHESIVES & SEALANTS MARKET: PORTER'S FIVE FORCES ANALYSIS
TABLE 3
GDP TRENDS AND FORECAST OF MAJOR ECONOMIES, 2021–2030 (USD BILLION)
TABLE 4
CONSTRUCTION INDUSTRY SPENDING OF TOP ECONOMIES, 2020–2024 (USD BILLION)
TABLE 5
ADHESIVES & SEALANTS MARKET: ROLE IN ECOSYSTEM
TABLE 6
INVESTMENT AND FUNDING SCENARIO
TABLE 7
INFLUENCE OF STAKEHOLDERS ON BUYING PROCESS FOR TOP 3 APPLICATIONS (%)
TABLE 8
KEY BUYING CRITERIA FOR ADHESIVES & SEALANTS
TABLE 9
PRICING RANGE OF ADHESIVES FOR TOP APPLICATIONS, BY KEY PLAYER, 2024 (USD/KG)
TABLE 10
PRICING RANGE OF SEALANTS FOR TOP APPLICATIONS, BY KEY PLAYER, 2024 (USD/KG)
TABLE 11
PRICING TREND OF ADHESIVES, BY REGION, 2022–2030 (USD/KG)
TABLE 12
PRICING TREND OF SEALANTS, BY REGION, 2022–2030 (USD/KG)
TABLE 13
IMPORT DATA RELATED TO ADHESIVES & SEALANTS, BY REGION, 2020–2024 (USD MILLION)
TABLE 14
EXPORT DATA RELATED TO ADHESIVES & SEALANTS, BY REGION, 2020–2024 (USD MILLION)
TABLE 15
LEEDS STANDARDS FOR ARCHITECTURAL APPLICATIONS
TABLE 16
LEEDS STANDARDS FOR SPECIALTY APPLICATIONS
TABLE 17
LEEDS STANDARDS FOR SUBSTRATE-SPECIFIC APPLICATIONS
TABLE 18
NORTH AMERICA: REGULATORY BODIES, GOVERNMENT AGENCIES, AND OTHER ORGANIZATIONS
TABLE 19
EUROPE: REGULATORY BODIES, GOVERNMENT AGENCIES, AND OTHER ORGANIZATIONS
TABLE 20
ASIA PACIFIC: REGULATORY BODIES, GOVERNMENT AGENCIES, AND OTHER ORGANIZATIONS
TABLE 21
ADHESIVES & SEALANTS MARKET: DETAILED LIST OF CONFERENCES & EVENTS
TABLE 22
PATENT STATUS: PATENT APPLICATIONS, LIMITED PATENTS, AND GRANTED PATENTS, 2014–2024
TABLE 23
LIST OF MAJOR PATENTS RELATED TO POLYURETHANE ADHESIVES, 2014–2024
TABLE 24
PATENTS BY MITSUI CHEMICALS INC
TABLE 25
US ADJUSTED RECIPROCAL TARIFF RATES
TABLE 26
ADHESIVES & SEALANTS MARKET, BY TYPE, 2020–2024 (USD MILLION)
TABLE 27
ADHESIVES & SEALANTS MARKET, BY TYPE, 2025–2030 (USD MILLION)
TABLE 28
ADHESIVES & SEALANTS MARKET, BY TYPE, 2020–2024 (KILOTON)
TABLE 29
ADHESIVES & SEALANTS MARKET, BY TYPE, 2025–2030 (KILOTON)
TABLE 30
ADHESIVES MARKET, BY REGION, 2020–2024 (USD MILLION)
TABLE 31
ADHESIVES MARKET, BY REGION, 2025–2030 (USD MILLION)
TABLE 32
ADHESIVES MARKET, BY REGION, 2020–2024 (KILOTON)
TABLE 33
ADHESIVES MARKET, BY REGION, 2025–2030 (KILOTON)
TABLE 34
SEALANTS MARKET, BY REGION, 2020–2024 (USD MILLION)
TABLE 35
SEALANTS MARKET, BY REGION, 2025–2030 (USD MILLION)
TABLE 36
SEALANTS MARKET, BY REGION, 2020–2024 (KILOTON)
TABLE 37
SEALANTS MARKET, BY REGION, 2025–2030 (KILOTON)
TABLE 38
ADHESIVES MARKET, BY TECHNOLOGY, 2020–2024 (USD MILLION)
TABLE 39
ADHESIVES MARKET, BY TECHNOLOGY, 2025–2030 (USD MILLION)
TABLE 40
ADHESIVES MARKET, BY TECHNOLOGY, 2020–2024 (KILOTON)
TABLE 41
ADHESIVES MARKET, BY TECHNOLOGY, 2025–2030 (KILOTON)
TABLE 42
WATER-BASED: ADHESIVES MARKET, BY REGION, 2020–2024 (USD MILLION)
TABLE 43
WATER-BASED: ADHESIVES MARKET, BY REGION, 2025–2030 (USD MILLION)
TABLE 44
WATER-BASED: ADHESIVES MARKET, BY REGION, 2020–2024 (KILOTON)
TABLE 45
WATER-BASED: ADHESIVES MARKET, BY REGION, 2025–2030 (KILOTON)
TABLE 46
WATER-BASED: ADHESIVES MARKET, BY RESIN TYPE, 2020–2024 (USD MILLION)
TABLE 47
WATER-BASED: ADHESIVES MARKET T, BY RESIN TYPE, 2025–2030 (USD MILLION)
TABLE 48
WATER-BASED: ADHESIVES MARKET, BY RESIN TYPE, 2020–2024 (KILOTON)
TABLE 49
WATER-BASED: ADHESIVES MARKET, BY RESIN TYPE, 2025–2030 (KILOTON)
TABLE 50
PVA EMULSION: WATER-BASED ADHESIVES MARKET, BY REGION, 2020–2024 (USD MILLION)
TABLE 51
PVA EMULSION: WATER-BASED ADHESIVES MARKET, BY REGION, 2025–2030 (USD MILLION)
TABLE 52
PVA EMULSION: WATER-BASED ADHESIVES MARKET, BY REGION, 2020–2024 (KILOTON)
TABLE 53
PVA EMULSION: WATER-BASED ADHESIVES MARKET, BY REGION, 2025–2030 (KILOTON)
TABLE 54
ACRYLIC POLYMER EMULSION: WATER-BASED ADHESIVES MARKET, BY REGION, 2020–2024 (USD MILLION)
TABLE 55
ACRYLIC POLYMER EMULSION: WATER-BASED ADHESIVES MARKET, BY REGION, 2025–2030 (USD MILLION)
TABLE 56
ACRYLIC POLYMER EMULSION: WATER-BASED ADHESIVES MARKET, BY REGION, 2020–2024 (KILOTON)
TABLE 57
ACRYLIC POLYMER EMULSION: WATER-BASED ADHESIVES MARKET, BY REGION, 2025–2030 (KILOTON)
TABLE 58
VAE EMULSION: WATER-BASED ADHESIVES MARKET, BY REGION, 2020–2024 (USD MILLION)
TABLE 59
VAE EMULSION: WATER-BASED ADHESIVES MARKET, BY REGION, 2025–2030 (USD MILLION)
TABLE 60
VAE EMULSION: WATER-BASED ADHESIVES MARKET, BY REGION, 2020–2024 (KILOTON)
TABLE 61
VAE EMULSION: WATER-BASED ADHESIVES MARKET, BY REGION, 2025–2030 (KILOTON)
TABLE 62
SBC LATEX: WATER-BASED ADHESIVES MARKET, BY REGION, 2020–2024 (USD MILLION)
TABLE 63
SBC LATEX: WATER-BASED ADHESIVES MARKET, BY REGION, 2025–2030 (USD MILLION)
TABLE 64
SBC LATEX: WATER-BASED ADHESIVES MARKET, BY REGION, 2020–2024 (KILOTON)
TABLE 65
SBC LATEX: WATER-BASED ADHESIVES MARKET, BY REGION, 2025–2030 (KILOTON)
TABLE 66
OTHER RESIN TYPES: WATER-BASED ADHESIVES MARKET, BY REGION, 2020–2024 (USD MILLION)
TABLE 67
OTHER RESIN TYPES: WATER-BASED ADHESIVES MARKET, BY REGION, 2025–2030 (USD MILLION)
TABLE 68
OTHER RESIN TYPES: WATER-BASED ADHESIVES MARKET, BY REGION, 2020–2024 (KILOTON)
TABLE 69
OTHER RESIN TYPES: WATER-BASED ADHESIVES MARKET, BY REGION, 2025–2030 (KILOTON)
TABLE 70
SOLVENT-BASED: ADHESIVES MARKET, BY REGION, 2020–2024 (USD MILLION)
TABLE 71
SOLVENT-BASED: ADHESIVES MARKET, BY REGION, 2025–2030 (USD MILLION)
TABLE 72
SOLVENT-BASED: ADHESIVES MARKET, BY REGION, 2020–2024 (KILOTON)
TABLE 73
SOLVENT-BASED: ADHESIVES MARKET, BY REGION, 2025–2030 (KILOTON)
TABLE 74
SOLVENT-BASED: ADHESIVES MARKET, BY RESIN TYPE, 2020–2024 (USD MILLION)
TABLE 75
SOLVENT-BASED: ADHESIVES MARKET, BY RESIN TYPE, 2025–2030 (USD MILLION)
TABLE 76
SOLVENT-BASED: ADHESIVES MARKET, BY RESIN TYPE, 2020–2024 (KILOTON)
TABLE 77
SOLVENT-BASED: ADHESIVES MARKET, BY RESIN TYPE, 2025–2030 (KILOTON)
TABLE 78
POLYURETHANE: SOLVENT-BASED ADHESIVES MARKET, BY REGION, 2020–2024 (USD MILLION)
TABLE 79
POLYURETHANE: SOLVENT-BASED ADHESIVES MARKET, BY REGION, 2025–2030 (USD MILLION)
TABLE 80
POLYURETHANE: SOLVENT-BASED ADHESIVES MARKET, BY REGION, 2020–2024 (KILOTON)
TABLE 81
POLYURETHANE: SOLVENT-BASED ADHESIVES MARKET, BY REGION, 2025–2030 (KILOTON)
TABLE 82
ACRYLIC: SOLVENT-BASED ADHESIVES MARKET, BY REGION, 2020–2024 (USD MILLION)
TABLE 83
ACRYLIC: SOLVENT-BASED ADHESIVES MARKET, BY REGION, 2025–2030 (USD MILLION)
TABLE 84
ACRYLIC: SOLVENT-BASED ADHESIVES MARKET, BY REGION, 2020–2024 (KILOTON)
TABLE 85
ACRYLIC: SOLVENT-BASED ADHESIVES MARKET, BY REGION, 2025–2030 (KILOTON)
TABLE 86
CHLOROPRENE RUBBER: SOLVENT-BASED ADHESIVES MARKET, BY REGION, 2020–2024 (USD MILLION)
TABLE 87
CHLOROPRENE RUBBER: SOLVENT-BASED ADHESIVES MARKET, BY REGION, 2025–2030 (USD MILLION)
TABLE 88
CHLOROPRENE RUBBER: SOLVENT-BASED ADHESIVES MARKET, BY REGION, 2020–2024 (KILOTON)
TABLE 89
CHLOROPRENE RUBBER: SOLVENT-BASED ADHESIVES MARKET, BY REGION, 2025–2030 (KILOTON)
TABLE 90
POLYVINYL ACETATE: SOLVENT-BASED ADHESIVES MARKET, BY REGION, 2020–2024 (USD MILLION)
TABLE 91
POLYVINYL ACETATE: SOLVENT-BASED ADHESIVES MARKET, BY REGION, 2025–2030 (USD MILLION)
TABLE 92
POLYVINYL ACETATE: SOLVENT-BASED ADHESIVES MARKET, BY REGION, 2020–2024 (KILOTON)
TABLE 93
POLYVINYL ACETATE: SOLVENT-BASED ADHESIVES MARKET, BY REGION, 2025–2030 (KILOTON)
TABLE 94
POLYAMIDE: SOLVENT-BASED ADHESIVES MARKET, BY REGION, 2020–2024 (USD MILLION)
TABLE 95
POLYAMIDE: SOLVENT-BASED ADHESIVES MARKET, BY REGION, 2025–2030 (USD MILLION)
TABLE 96
POLYAMIDE: SOLVENT-BASED ADHESIVES MARKET, BY REGION, 2020–2024 (KILOTON)
TABLE 97
POLYAMIDE: SOLVENT-BASED ADHESIVES MARKET, BY REGION, 2025–2030 (KILOTON)
TABLE 98
SYNTHESIZED RUBBER: SOLVENT-BASED ADHESIVES MARKET, BY REGION, 2020–2024 (USD MILLION)
TABLE 99
SYNTHESIZED RUBBER: SOLVENT-BASED ADHESIVES MARKET, BY REGION, 2025–2030 (USD MILLION)
TABLE 100
SYNTHESIZED RUBBER: SOLVENT-BASED ADHESIVES MARKET, BY REGION, 2020–2024 (KILOTON)
TABLE 101
SYNTHESIZED RUBBER: SOLVENT-BASED ADHESIVES MARKET, BY REGION, 2025–2030 (KILOTON)
TABLE 102
OTHER RESIN TYPES: SOLVENT-BASED ADHESIVES MARKET, BY REGION, 2020–2024 (USD MILLION)
TABLE 103
OTHER RESIN TYPES: SOLVENT-BASED ADHESIVES MARKET, BY REGION, 2025–2030 (USD MILLION)
TABLE 104
OTHER RESIN TYPES: SOLVENT-BASED ADHESIVES MARKET, BY REGION, 2020–2024 (KILOTON)
TABLE 105
OTHER RESIN TYPES: SOLVENT-BASED ADHESIVES MARKET, BY REGION, 2025–2030 (KILOTON)
TABLE 106
HOT-MELT: ADHESIVES MARKET, BY REGION, 2020–2024 (USD MILLION)
TABLE 107
HOT-MELT: ADHESIVES MARKET, BY REGION, 2025–2030 (USD MILLION)
TABLE 108
HOT-MELT: ADHESIVES MARKET, BY REGION, 2020–2024 (KILOTON)
TABLE 109
HOT-MELT: ADHESIVES MARKET, BY REGION, 2025–2030 (KILOTON)
TABLE 110
HOT-MELT: ADHESIVES MARKET, BY RESIN TYPE, 2020–2024 (USD MILLION)
TABLE 111
HOT-MELT: ADHESIVES MARKET, BY RESIN TYPE, 2025–2030 (USD MILLION)
TABLE 112
HOT-MELT: ADHESIVES MARKET, BY RESIN TYPE, 2020–2024 (KILOTON)
TABLE 113
HOT-MELT: ADHESIVES MARKET, BY RESIN TYPE, 2025–2030 (KILOTON)
TABLE 114
ETHYLENE-VINYL ACETATE: HOLT-MELT ADHESIVES MARKET, BY REGION, 2020–2024 (USD MILLION)
TABLE 115
ETHYLENE-VINYL ACETATE: HOLT-MELT ADHESIVES MARKET, BY REGION, 2025–2030 (USD MILLION)
TABLE 116
ETHYLENE-VINYL ACETATE: HOLT-MELT ADHESIVES MARKET, BY REGION, 2020–2024 (KILOTON)
TABLE 117
ETHYLENE-VINYL ACETATE: HOLT-MELT ADHESIVES MARKET, BY REGION, 2025–2030 (KILOTON)
TABLE 118
STYRENIC BLOCK COPOLYMER: HOT-MELT ADHESIVES MARKET, BY REGION, 2020–2024 (USD MILLION)
TABLE 119
STYRENIC BLOCK COPOLYMER: HOT-MELT ADHESIVES MARKET, BY REGION, 2025–2030 (USD MILLION)
TABLE 120
STYRENIC BLOCK COPOLYMER: HOT-MELT ADHESIVES MARKET, BY REGION, 2020–2024 (KILOTON)
TABLE 121
STYRENIC BLOCK COPOLYMER: HOT-MELT ADHESIVES MARKET, BY REGION, 2025–2030 (KILOTON)
TABLE 122
METALLOCENE POLYOLEFIN: HOT-MELT ADHESIVES MARKET, BY REGION, 2020–2024 (USD MILLION)
TABLE 123
METALLOCENE POLYOLEFIN: HOT-MELT ADHESIVES MARKET, BY REGION, 2025–2030 (USD MILLION)
TABLE 124
METALLOCENE POLYOLEFIN: HOT-MELT ADHESIVES MARKET, BY REGION, 2020–2024 (KILOTON)
TABLE 125
METALLOCENE POLYOLEFIN: HOT-MELT ADHESIVES MARKET, BY REGION, 2025–2030 (KILOTON)
TABLE 126
POLYOLEFIN: HOT-MELT ADHESIVES MARKET, BY REGION, 2020–2024 (USD MILLION)
TABLE 127
POLYOLEFIN: HOT-MELT ADHESIVES MARKET, BY REGION, 2025–2030 (USD MILLION)
TABLE 128
POLYOLEFIN: HOT-MELT ADHESIVES MARKET, BY REGION, 2020–2024 (KILOTON)
TABLE 129
POLYOLEFIN: HOT-MELT ADHESIVES MARKET, BY REGION, 2025–2030 (KILOTON)
TABLE 130
AMORPHOUS POLY-ALPHAOLEFIN: HOT-MELT ADHESIVES MARKET, BY REGION, 2020–2024 (USD MILLION)
TABLE 131
AMORPHOUS POLY-ALPHAOLEFIN: HOT-MELT ADHESIVES MARKET, BY REGION, 2025–2030 (USD MILLION)
TABLE 132
AMORPHOUS POLY-ALPHAOLEFIN: HOT-MELT ADHESIVES MARKET, BY REGION, 2020–2024 (KILOTON)
TABLE 133
AMORPHOUS POLY-ALPHAOLEFIN: HOT-MELT ADHESIVES MARKET, BY REGION, 2025–2030 (KILOTON)
TABLE 134
OTHER RESIN TYPES: HOT-MELT ADHESIVES MARKET, BY REGION, 2020–2024 (USD MILLION)
TABLE 135
OTHER RESIN TYPES: HOT-MELT ADHESIVES MARKET, BY REGION, 2025–2030 (USD MILLION)
TABLE 136
OTHER RESIN TYPE: HOT-MELT ADHESIVES MARKET, BY REGION, 2020–2024 (KILOTON)
TABLE 137
OTHER RESIN TYPE: HOT-MELT ADHESIVES MARKET, BY REGION, 2025–2030 (KILOTON)
TABLE 138
REACTIVE & OTHERS: ADHESIVES MARKET, BY REGION, 2020–2024 (USD MILLION)
TABLE 139
REACTIVE & OTHERS: ADHESIVES MARKET, BY REGION, 2025–2030 (USD MILLION)
TABLE 140
REACTIVE & OTHERS: ADHESIVES MARKET, BY REGION, 2020–2024 (KILOTON)
TABLE 141
REACTIVE & OTHERS: ADHESIVES MARKET, BY REGION, 2025–2030 (KILOTON)
TABLE 142
REACTIVE & OTHERS: ADHESIVES MARKET, BY RESIN TYPE, 2020–2024 (USD MILLION)
TABLE 143
REACTIVE & OTHERS: ADHESIVES MARKET, BY RESIN TYPE, 2025–2030 (USD MILLION)
TABLE 144
REACTIVE & OTHERS: ADHESIVES MARKET, BY RESIN TYPE, 2020–2024 (KILOTON)
TABLE 145
REACTIVE & OTHERS: ADHESIVES MARKET, BY RESIN TYPE, 2025–2030 (KILOTON)
TABLE 146
POLYURETHANE: REACTIVE & OTHER ADHESIVES MARKET, BY REGION, 2020–2024 (USD MILLION)
TABLE 147
POLYURETHANE: REACTIVE & OTHER ADHESIVES MARKET, BY REGION, 2025–2030 (USD MILLION)
TABLE 148
POLYURETHANE: REACTIVE & OTHER ADHESIVES MARKET, BY REGION, 2020–2024 (KILOTON)
TABLE 149
POLYURETHANE: REACTIVE & OTHER ADHESIVES MARKET, BY REGION, 2025–2030 (KILOTON)
TABLE 150
EPOXY: REACTIVE & OTHER ADHESIVES MARKET, BY REGION, 2020–2024 (USD MILLION)
TABLE 151
EPOXY: REACTIVE & OTHER ADHESIVES MARKET, BY REGION, 2025–2030 (USD MILLION)
TABLE 152
EPOXY: REACTIVE & OTHER ADHESIVES MARKET, BY REGION, 2020–2024 (KILOTON)
TABLE 153
EPOXY: REACTIVE & OTHER ADHESIVES MARKET, BY REGION, 2025–2030 (KILOTON)
TABLE 154
APPLICATIONS OF CYANOACRYLATE ADHESIVES
TABLE 155
APPLICATIONS OF ANAEROBIC ADHESIVES
TABLE 156
APPLICATIONS OF PHENOLIC RESINS IN VARIOUS ADHESIVE MIXES
TABLE 157
OTHER RESIN TYPES: REACTIVE & OTHER ADHESIVES MARKET, BY REGION, 2020–2024 (USD MILLION)
TABLE 158
OTHER RESIN TYPES: REACTIVE & OTHER ADHESIVES MARKET, BY REGION, 2025–2030 (USD MILLION)
TABLE 159
OTHER RESIN TYPES: REACTIVE & OTHER ADHESIVES MARKET, BY REGION, 2020–2024 (KILOTON)
TABLE 160
OTHER RESIN TYPES: REACTIVE & OTHER ADHESIVES MARKET, BY REGION, 2025–2030 (KILOTON)
TABLE 161
ADHESIVES MARKET, BY APPLICATION, 2020–2024 (USD MILLION)
TABLE 162
ADHESIVES MARKET, BY APPLICATION, 2025–2030 (USD MILLION)
TABLE 163
ADHESIVES MARKET, BY APPLICATION, 2020–2024 (KILOTON)
TABLE 164
ADHESIVES MARKET, BY APPLICATION, 2025–2030 (KILOTON)
TABLE 165
PAPER & PACKAGING: ADHESIVES MARKET, BY REGION, 2020–2024 (USD MILLION)
TABLE 166
PAPER & PACKAGING: ADHESIVES MARKET, BY REGION, 2025–2030 (USD MILLION)
TABLE 167
PAPER & PACKAGING: ADHESIVES MARKET, BY REGION, 2020–2024 (KILOTON)
TABLE 168
PAPER & PACKAGING: ADHESIVES MARKET, BY REGION, 2025–2030 (KILOTON)
TABLE 169
BUILDING & CONSTRUCTION: ADHESIVES MARKET, BY REGION, 2020–2024 (USD MILLION)
TABLE 170
BUILDING & CONSTRUCTION: ADHESIVES MARKET, BY REGION, 2025–2030 (USD MILLION)
TABLE 171
BUILDING & CONSTRUCTION: ADHESIVES MARKET, BY REGION, 2020–2024 (KILOTON)
TABLE 172
BUILDING & CONSTRUCTION: ADHESIVES MARKET, BY REGION, 2025–2030 (KILOTON)
TABLE 173
WOODWORKING: ADHESIVES MARKET, BY REGION, 2020–2024 (USD MILLION)
TABLE 174
WOODWORKING: ADHESIVES MARKET, BY REGION, 2025–2030 (USD MILLION)
TABLE 175
WOODWORKING: ADHESIVES MARKET, BY REGION, 2020–2024 (KILOTON)
TABLE 176
WOODWORKING: ADHESIVES MARKET, BY REGION, 2025–2030 (KILOTON)
TABLE 177
AUTOMOTIVE & TRANSPORTATION: ADHESIVES MARKET, BY REGION, 2020–2024 (USD MILLION)
TABLE 178
AUTOMOTIVE & TRANSPORTATION: ADHESIVES MARKET, BY REGION, 2025–2030 (USD MILLION)
TABLE 179
AUTOMOTIVE & TRANSPORTATION: ADHESIVES MARKET, BY REGION, 2020–2024 (KILOTON)
TABLE 180
AUTOMOTIVE & TRANSPORTATION: ADHESIVES MARKET, BY REGION, 2025–2030 (KILOTON)
TABLE 181
CONSUMER & DIY: ADHESIVES MARKET, BY REGION, 2020–2024 (USD MILLION)
TABLE 182
CONSUMER & DIY: ADHESIVES MARKET, BY REGION, 2025–2030 (USD MILLION)
TABLE 183
CONSUMER & DIY: ADHESIVES MARKET, BY REGION, 2020–2024 (KILOTON)
TABLE 184
CONSUMER & DIY: ADHESIVES MARKET, BY REGION, 2025–2030 (KILOTON)
TABLE 185
LEATHER & FOOTWEAR: ADHESIVES MARKET, BY REGION, 2020–2024 (USD MILLION)
TABLE 186
LEATHER & FOOTWEAR: ADHESIVES MARKET, BY REGION, 2025–2030 (USD MILLION)
TABLE 187
LEATHER & FOOTWEAR: ADHESIVES MARKET, BY REGION, 2020–2024 (KILOTON)
TABLE 188
LEATHER & FOOTWEAR: ADHESIVES MARKET, BY REGION, 2025–2030 (KILOTON)
TABLE 189
ASSEMBLY: ADHESIVES MARKET, BY REGION, 2020–2024 (USD MILLION)
TABLE 190
ASSEMBLY: ADHESIVES MARKET, BY REGION, 2025–2030 (USD MILLION)
TABLE 191
ASSEMBLY: ADHESIVES MARKET, BY REGION, 2020–2024 (KILOTON)
TABLE 192
ASSEMBLY: ADHESIVES MARKET, BY REGION, 2025–2030 (KILOTON)
TABLE 193
ELECTRONICS: ADHESIVES MARKET, BY REGION, 2020–2024 (USD MILLION)
TABLE 194
ELECTRONICS: ADHESIVES MARKET, BY REGION, 2025–2030 (USD MILLION)
TABLE 195
ELECTRONICS: ADHESIVES MARKET, BY REGION, 2020–2024 (KILOTON)
TABLE 196
ELECTRONICS: ADHESIVES MARKET, BY REGION, 2025–2030 (KILOTON)
TABLE 197
MEDICAL: ADHESIVES MARKET, BY REGION, 2020–2024 (USD MILLION)
TABLE 198
MEDICAL: ADHESIVES & SEALANTS MARKET, BY REGION,2025–2030 (USD MILLION)
TABLE 199
MEDICAL: ADHESIVES MARKET, BY REGION, 2020–2024 (KILOTON)
TABLE 200
MEDICAL: ADHESIVES MARKET, BY REGION, 2025–2030 (KILOTON)
TABLE 201
OTHER APPLICATIONS: ADHESIVES MARKET, BY REGION, 2020–2024 (USD MILLION)
TABLE 202
OTHER APPLICATIONS: ADHESIVES MARKET, BY REGION, 2025–2030 (USD MILLION)
TABLE 203
OTHER APPLICATIONS: ADHESIVES MARKET, BY REGION, 2020–2024 (KILOTON)
TABLE 204
OTHER APPLICATIONS: ADHESIVES MARKET, BY REGION, 2025–2030 (KILOTON)
TABLE 205
SEALANTS MARKET, BY RESIN TYPE, 2020–2024 (USD MILLION)
TABLE 206
SEALANTS MARKET, BY RESIN TYPE, 2025–2030 (USD MILLION)
TABLE 207
SEALANTS MARKET, BY RESIN TYPE, 2020–2024 (KILOTON)
TABLE 208
SEALANTS MARKET, BY RESIN TYPE, 2025–2030 (KILOTON)
TABLE 209
SILICONE: SEALANTS MARKET, BY REGION, 2020–2024 (USD MILLION)
TABLE 210
SILICONE: SEALANTS MARKET, BY REGION, 2025–2030 (USD MILLION)
TABLE 211
SILICONE: SEALANTS MARKET, BY REGION, 2020–2024 (KILOTON)
TABLE 212
SILICONE: SEALANTS MARKET, BY REGION, 2025–2030 (KILOTON)
TABLE 213
POLYURETHANE: SEALANTS MARKET, BY REGION, 2020–2024 (USD MILLION)
TABLE 214
POLYURETHANE: SEALANTS MARKET, BY REGION, 2025–2030 (USD MILLION)
TABLE 215
POLYURETHANE: SEALANTS MARKET, BY REGION, 2020–2024 (KILOTON)
TABLE 216
POLYURETHANE: SEALANTS MARKET, BY REGION, 2025–2030 (KILOTON)
TABLE 217
PLASTISOL: SEALANTS MARKET, BY REGION, 2020–2024 (USD MILLION)
TABLE 218
PLASTISOL: SEALANTS MARKET, BY REGION, 2025–2030 (USD MILLION)
TABLE 219
PLASTISOL: SEALANTS MARKET, BY REGION, 2020–2024 (KILOTON)
TABLE 220
PLASTISOL: SEALANTS MARKET, BY REGION, 2025–2030 (KILOTON)
TABLE 221
EMULSION: SEALANTS MARKET, BY REGION, 2020–2024 (USD MILLION)
TABLE 222
EMULSION: SEALANTS MARKET, BY REGION, 2025–2030 (USD MILLION)
TABLE 223
EMULSION: SEALANTS MARKET, BY REGION, 2020–2024 (KILOTON)
TABLE 224
EMULSION: SEALANTS MARKET, BY REGION, 2025–2030 (KILOTON)
TABLE 225
POLYSULFIDE: SEALANTS MARKET, BY REGION, 2020–2024 (USD MILLION)
TABLE 226
POLYSULFIDE: SEALANTS MARKET, BY REGION, 2025–2030 (USD MILLION)
TABLE 227
POLYSULFIDE: SEALANTS MARKET, BY REGION, 2020–2024 (KILOTON)
TABLE 228
POLYSULFIDE: SEALANTS MARKET, BY REGION, 2025–2030 (KILOTON)
TABLE 229
BUTYL: SEALANTS MARKET, BY REGION, 2020–2024 (USD MILLION)
TABLE 230
BUTYL: SEALANTS MARKET, BY REGION, 2025–2030 (USD MILLION)
TABLE 231
BUTYL: SEALANTS MARKET, BY REGION, 2020–2024 (KILOTON)
TABLE 232
BUTYL: SEALANTS MARKET, BY REGION, 2025–2030 (KILOTON)
TABLE 233
OTHER RESIN TYPES: SEALANTS MARKET, BY REGION, 2020–2024 (USD MILLION)
TABLE 234
OTHER RESIN TYPES: SEALANTS MARKET, BY REGION, 2025–2030 (USD MILLION)
TABLE 235
OTHER RESIN TYPES: SEALANTS MARKET, BY REGION, 2020–2024 (KILOTON)
TABLE 236
OTHER RESIN TYPES: SEALANTS MARKET, BY REGION, 2025–2030 (KILOTON)
TABLE 237
SEALANTS MARKET, BY APPLICATION, 2020–2024 (USD MILLION)
TABLE 238
SEALANTS MARKET, BY APPLICATION, 2025–2030 (USD MILLION)
TABLE 239
SEALANTS MARKET, BY APPLICATION, 2020–2024 (KILOTON)
TABLE 240
SEALANTS MARKET, BY APPLICATION, 2025–2030 (KILOTON)
TABLE 241
BUILDING & CONSTRUCTION: SEALANTS MARKET, BY REGION, 2020–2024 (USD MILLION)
TABLE 242
BUILDING & CONSTRUCTION: SEALANTS MARKET, BY REGION, 2025–2030 (USD MILLION)
TABLE 243
BUILDING & CONSTRUCTION: SEALANTS MARKET, BY REGION, 2020–2024 (KILOTON)
TABLE 244
BUILDING & CONSTRUCTION: SEALANTS MARKET, BY REGION, 2025–2030 (KILOTON)
TABLE 245
AUTOMOTIVE & TRANSPORTATION: SEALANTS MARKET, BY REGION, 2020–2024 (USD MILLION)
TABLE 246
AUTOMOTIVE & TRANSPORTATION: SEALANTS MARKET, BY REGION, 2025–2030 (USD MILLION)
TABLE 247
AUTOMOTIVE & TRANSPORTATION: SEALANTS MARKET, BY REGION, 2020–2024 (KILOTON)
TABLE 248
AUTOMOTIVE & TRANSPORTATION: SEALANTS MARKET, BY REGION, 2025–2030 (KILOTON)
TABLE 249
CONSUMER: SEALANTS MARKET, BY REGION, 2020–2024 (USD MILLION)
TABLE 250
CONSUMER: SEALANTS MARKET, BY REGION, 2025–2030 (USD MILLION)
TABLE 251
CONSUMER: SEALANTS MARKET, BY REGION, 2020–2024 (KILOTON)
TABLE 252
CONSUMER: SEALANTS MARKET, BY REGION, 2025–2030 (KILOTON)
TABLE 253
OTHER APPLICATIONS: SEALANTS MARKET, BY REGION, 2020–2024 (USD MILLION)
TABLE 254
OTHER APPLICATIONS: SEALANTS MARKET, BY REGION, 2025–2030 (USD MILLION)
TABLE 255
OTHER APPLICATIONS: SEALANTS MARKET, BY REGION, 2020–2024 (KILOTON)
TABLE 256
OTHER APPLICATIONS: SEALANTS MARKET, BY REGION, 2025–2030 (KILOTON)
TABLE 257
ADHESIVES & SEALANTS MARKET, BY REGION, 2020–2024 (USD MILLION)
TABLE 258
ADHESIVES & SEALANTS MARKET, BY REGION, 2025–2030 (USD MILLION)
TABLE 259
ADHESIVES & SEALANTS MARKET, BY REGION, 2020–2024 (KILOTON)
TABLE 260
ADHESIVES & SEALANTS MARKET, BY REGION, 2025–2030 (KILOTON)
TABLE 261
ADHESIVES MARKET, BY REGION, 2020–2024 (USD MILLION)
TABLE 262
ADHESIVES MARKET, BY REGION, 2025–2030 (USD MILLION)
TABLE 263
ADHESIVES MARKET, BY REGION, 2020–2024 (KILOTON)
TABLE 264
ADHESIVES MARKET, BY REGION, 2025–2030 (KILOTON)
TABLE 265
SEALANTS MARKET, BY REGION, 2020–2024 (USD MILLION)
TABLE 266
SEALANTS MARKET, BY REGION, 2025–2030 (USD MILLION)
TABLE 267
SEALANTS MARKET, BY REGION, 2020–2024 (KILOTON)
TABLE 268
SEALANTS MARKET, BY REGION, 2025–2030 (KILOTON)
TABLE 269
NORTH AMERICA: ADHESIVES & SEALANTS MARKET, BY TYPE, 2020–2024 (USD MILLION)
TABLE 270
NORTH AMERICA: ADHESIVES & SEALANTS MARKET, BY TYPE, 2025–2030 (USD MILLION)
TABLE 271
NORTH AMERICA: ADHESIVES & SEALANTS MARKET, BY TYPE, 2020–2024 (KILOTON)
TABLE 272
NORTH AMERICA: ADHESIVES & SEALANTS MARKET, BY TYPE, 2025–2030 (KILOTON)
TABLE 273
NORTH AMERICA: ADHESIVES MARKET, BY COUNTRY, 2020–2024 (USD MILLION)
TABLE 274
NORTH AMERICA: ADHESIVES MARKET, BY COUNTRY, 2025–2030 (USD MILLION)
TABLE 275
NORTH AMERICA: ADHESIVES MARKET, BY COUNTRY, 2020–2024 (KILOTON)
TABLE 276
NORTH AMERICA: ADHESIVES MARKET, BY COUNTRY, 2025–2030 (KILOTON)
TABLE 277
NORTH AMERICA: SEALANTS MARKET, BY COUNTRY, 2020–2024 (USD MILLION)
TABLE 278
NORTH AMERICA: SEALANTS MARKET, BY COUNTRY, 2025–2030 (USD MILLION)
TABLE 279
NORTH AMERICA: SEALANTS MARKET, BY COUNTRY, 2020–2024 (KILOTON)
TABLE 280
NORTH AMERICA: SEALANTS MARKET, BY COUNTRY, 2025–2030 (KILOTON)
TABLE 281
NORTH AMERICA: ADHESIVES MARKET, BY TECHNOLOGY, 2020–2024 (USD MILLION)
TABLE 282
NORTH AMERICA: ADHESIVES MARKET, BY TECHNOLOGY, 2025–2030 (USD MILLION)
TABLE 283
NORTH AMERICA: ADHESIVES MARKET, BY TECHNOLOGY, 2020–2024 (KILOTON)
TABLE 284
NORTH AMERICA: ADHESIVES MARKET, BY TECHNOLOGY, 2025–2030 (KILOTON)
TABLE 285
NORTH AMERICA: WATER-BASED ADHESIVES MARKET, BY RESIN TYPE, 2020–2024 (USD MILLION)
TABLE 286
NORTH AMERICA: WATER-BASED ADHESIVES MARKET, BY RESIN TYPE, 2025–2030 (USD MILLION)
TABLE 287
NORTH AMERICA: WATER-BASED ADHESIVES MARKET, BY RESIN TYPE, 2020–2024 (KILOTON)
TABLE 288
NORTH AMERICA: WATER-BASED ADHESIVES MARKET, BY RESIN TYPE, 2025–2030 (KILOTON)
TABLE 289
NORTH AMERICA: SOLVENT-BASED ADHESIVES MARKET, BY RESIN TYPE, 2020–2024 (USD MILLION)
TABLE 290
NORTH AMERICA: SOLVENT-BASED ADHESIVES MARKET, BY RESIN TYPE, 2025–2030 (USD MILLION)
TABLE 291
NORTH AMERICA: SOLVENT-BASED ADHESIVES MARKET, BY RESIN TYPE, 2020–2024 (KILOTON)
TABLE 292
NORTH AMERICA: SOLVENT-BASED ADHESIVES MARKET, BY RESIN TYPE, 2025–2030 (KILOTON)
TABLE 293
NORTH AMERICA: HOT-MELT ADHESIVES MARKET, BY RESIN TYPE, 2020–2024 (USD MILLION)
TABLE 294
NORTH AMERICA: HOT-MELT ADHESIVES MARKET, BY RESIN TYPE, 2025–2030 (USD MILLION)
TABLE 295
NORTH AMERICA: HOT-MELT ADHESIVES MARKET, BY RESIN TYPE, 2020–2024 (KILOTON)
TABLE 296
NORTH AMERICA: HOT-MELT ADHESIVES MARKET, BY RESIN TYPE, 2025–2030 (KILOTON)
TABLE 297
NORTH AMERICA: REACTIVE & OTHER ADHESIVES MARKET, BY RESIN TYPE, 2020–2024 (USD MILLION)
TABLE 298
NORTH AMERICA: REACTIVE & OTHER ADHESIVES MARKET, BY RESIN TYPE, 2025–2030 (USD MILLION)
TABLE 299
NORTH AMERICA: REACTIVE & OTHER ADHESIVES MARKET, BY RESIN TYPE, 2020–2024 (KILOTON)
TABLE 300
NORTH AMERICA: REACTIVE & OTHER ADHESIVES MARKET, BY RESIN TYPE, 2025–2030 (KILOTON)
TABLE 301
NORTH AMERICA: ADHESIVES MARKET, BY APPLICATION, 2020–2024 (USD MILLION)
TABLE 302
NORTH AMERICA: ADHESIVES MARKET, BY APPLICATION, 2025–2030 (USD MILLION)
TABLE 303
NORTH AMERICA: ADHESIVES MARKET, BY APPLICATION, 2020–2024 (KILOTON)
TABLE 304
NORTH AMERICA: ADHESIVES MARKET, BY APPLICATION, 2025–2030 (KILOTON)
TABLE 305
NORTH AMERICA: SEALANTS MARKET, BY RESIN TYPE, 2020–2024 (USD MILLION)
TABLE 306
NORTH AMERICA: SEALANTS MARKET, BY RESIN TYPE, 2025–2030 (USD MILLION)
TABLE 307
NORTH AMERICA: SEALANTS MARKET, BY RESIN TYPE, 2020–2024 (KILOTON)
TABLE 308
NORTH AMERICA: SEALANTS MARKET, BY RESIN TYPE, 2025–2030 (KILOTON)
TABLE 309
NORTH AMERICA: SEALANTS MARKET, BY APPLICATION, 2020–2024 (USD MILLION)
TABLE 310
NORTH AMERICA: SEALANTS MARKET, BY APPLICATION, 2025–2030 (USD MILLION)
TABLE 311
NORTH AMERICA: SEALANTS MARKET, BY APPLICATION, 2020–2024 (KILOTON)
TABLE 312
NORTH AMERICA: SEALANTS MARKET, BY APPLICATION, 2025–2030 (KILOTON)
TABLE 313
EUROPE: ADHESIVES & SEALANTS MARKET, BY TYPE, 2020–2024 (USD MILLION)
TABLE 314
EUROPE: ADHESIVES & SEALANTS MARKET, BY TYPE, 2025–2030 (USD MILLION)
TABLE 315
EUROPE: ADHESIVES & SEALANTS MARKET, BY TYPE, 2020–2024 (KILOTON)
TABLE 316
EUROPE: ADHESIVES & SEALANTS MARKET, BY TYPE, 2025–2030 (KILOTON)
TABLE 317
EUROPE: ADHESIVES MARKET, BY COUNTRY, 2020–2024 (USD MILLION)
TABLE 318
EUROPE: ADHESIVES MARKET, BY COUNTRY, 2025–2030 (USD MILLION)
TABLE 319
EUROPE: ADHESIVES MARKET, BY COUNTRY, 2020–2024 (KILOTON)
TABLE 320
EUROPE: ADHESIVES MARKET, BY COUNTRY, 2025–2030 (KILOTON)
TABLE 321
EUROPE: SEALANTS MARKET, BY COUNTRY, 2020–2024 (USD MILLION)
TABLE 322
EUROPE: SEALANTS MARKET, BY COUNTRY, 2025–2030 (USD MILLION)
TABLE 323
EUROPE: SEALANTS MARKET, BY COUNTRY, 2020–2024 (KILOTON)
TABLE 324
EUROPE: SEALANTS MARKET, BY COUNTRY, 2025–2030 (KILOTON)
TABLE 325
EUROPE: ADHESIVES MARKET, BY TECHNOLOGY, 2020–2024 (USD MILLION)
TABLE 326
EUROPE: ADHESIVES MARKET, BY TECHNOLOGY, 2025–2030 (USD MILLION)
TABLE 327
EUROPE: ADHESIVES MARKET, BY TECHNOLOGY, 2020–2024 (KILOTON)
TABLE 328
EUROPE: ADHESIVES MARKET, BY TECHNOLOGY, 2025–2030 (KILOTON)
TABLE 329
EUROPE: WATER-BASED ADHESIVES MARKET, BY RESIN TYPE, 2020–2024 (USD MILLION)
TABLE 330
EUROPE: WATER-BASED ADHESIVES MARKET, BY RESIN TYPE, 2025–2030 (USD MILLION)
TABLE 331
EUROPE: WATER-BASED ADHESIVES MARKET, BY RESIN TYPE, 2020–2024 (KILOTON)
TABLE 332
EUROPE: WATER-BASED ADHESIVES MARKET, BY RESIN TYPE, 2025–2030 (KILOTON)
TABLE 333
EUROPE: SOLVENT-BASED ADHESIVES MARKET, BY RESIN TYPE, 2020–2024 (USD MILLION)
TABLE 334
EUROPE: SOLVENT-BASED ADHESIVES MARKET, BY RESIN TYPE, 2025–2030 (USD MILLION)
TABLE 335
EUROPE: SOLVENT-BASED ADHESIVES MARKET, BY RESIN TYPE, 2020–2024 (KILOTON)
TABLE 336
EUROPE: SOLVENT-BASED ADHESIVES MARKET, BY RESIN TYPE, 2025–2030 (KILOTON)
TABLE 337
EUROPE: HOT-MELT ADHESIVES MARKET, BY RESIN TYPE, 2020–2024 (USD MILLION)
TABLE 338
EUROPE: HOT-MELT ADHESIVES MARKET, BY RESIN TYPE, 2025–2030 (USD MILLION)
TABLE 339
EUROPE: HOT-MELT ADHESIVES MARKET, BY RESIN TYPE, 2020–2024 (KILOTON)
TABLE 340
EUROPE: HOT-MELT ADHESIVES MARKET, BY RESIN TYPE, 2025–2030 (KILOTON)
TABLE 341
EUROPE: REACTIVE & OTHER ADHESIVES MARKET, BY RESIN TYPE, 2020–2024 (USD MILLION)
TABLE 342
EUROPE: REACTIVE & OTHER ADHESIVES MARKET, BY RESIN TYPE, 2025–2030 (USD MILLION)
TABLE 343
EUROPE: REACTIVE & OTHER ADHESIVES MARKET, BY RESIN TYPE, 2020–2024 (KILOTON)
TABLE 344
EUROPE: REACTIVE & OTHER ADHESIVES MARKET, BY RESIN TYPE, 2025–2030 (KILOTON)
TABLE 345
EUROPE: ADHESIVES MARKET, BY APPLICATION, 2020–2024 (USD MILLION)
TABLE 346
EUROPE: ADHESIVES MARKET, BY APPLICATION, 2025–2030 (USD MILLION)
TABLE 347
EUROPE: ADHESIVES MARKET, BY APPLICATION, 2020–2024 (KILOTON)
TABLE 348
EUROPE: ADHESIVES MARKET, BY APPLICATION, 2025–2030 (KILOTON)
TABLE 349
EUROPE: SEALANTS MARKET, BY RESIN TYPE, 2020–2024 (USD MILLION)
TABLE 350
EUROPE: SEALANTS MARKET, BY RESIN TYPE, 2025–2030 (USD MILLION)
TABLE 351
EUROPE: SEALANTS MARKET, BY RESIN TYPE, 2020–2024 (KILOTON)
TABLE 352
EUROPE: SEALANTS MARKET, BY RESIN TYPE, 2025–2030 (KILOTON)
TABLE 353
EUROPE: SEALANTS MARKET, BY APPLICATION, 2020–2024 (USD MILLION)
TABLE 354
EUROPE: SEALANTS MARKET, BY APPLICATION, 2025–2030 (USD MILLION)
TABLE 355
EUROPE: SEALANTS MARKET, BY APPLICATION, 2020–2024 (KILOTON)
TABLE 356
EUROPE: SEALANTS MARKET, BY APPLICATION, 2025–2030 (KILOTON)
TABLE 357
ASIA PACIFIC: ADHESIVES & SEALANTS MARKET, BY TYPE, 2020–2024 (USD MILLION)
TABLE 358
ASIA PACIFIC: ADHESIVES & SEALANTS MARKET, BY TYPE, 2025–2030 (USD MILLION)
TABLE 359
ASIA PACIFIC: ADHESIVES & SEALANTS MARKET, BY TYPE, 2020–2024 (KILOTON)
TABLE 360
ASIA PACIFIC: ADHESIVES & SEALANTS MARKET, BY TYPE, 2025–2030 (KILOTON)
TABLE 361
ASIA PACIFIC: ADHESIVES MARKET, BY COUNTRY, 2020–2024 (USD MILLION)
TABLE 362
ASIA PACIFIC: ADHESIVES MARKET, BY COUNTRY, 2025–2030 (USD MILLION)
TABLE 363
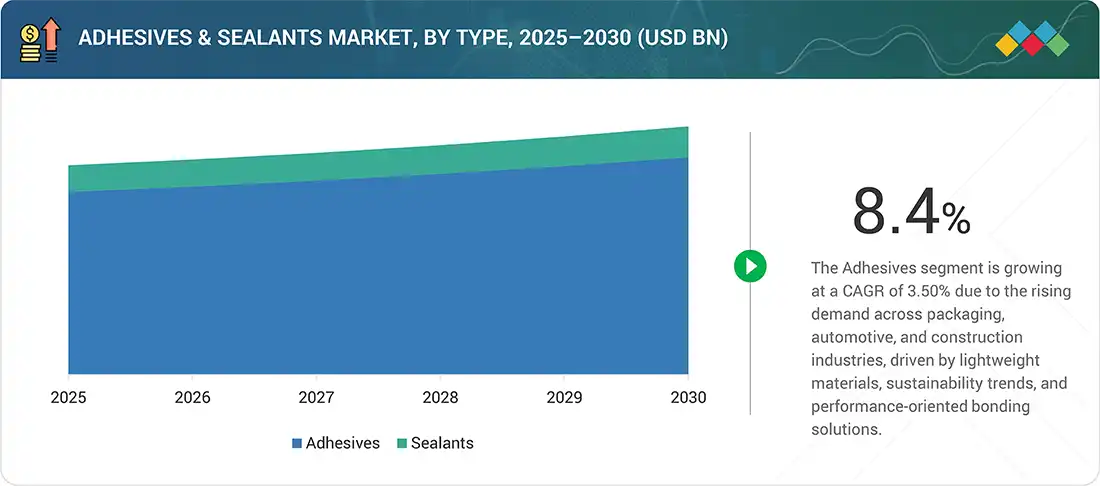
ASIA PACIFIC: ADHESIVES MARKET, BY COUNTRY, 2020–2024 (KILOTON)
TABLE 364
ASIA PACIFIC: ADHESIVES MARKET, BY COUNTRY, 2025–2030 (KILOTON)
TABLE 365
ASIA PACIFIC: SEALANTS MARKET, BY COUNTRY, 2020–2024 (USD MILLION)
TABLE 366
ASIA PACIFIC: SEALANTS MARKET, BY COUNTRY, 2025–2030 (USD MILLION)
TABLE 367
ASIA PACIFIC: SEALANTS MARKET, BY COUNTRY, 2020–2024 (KILOTON)
TABLE 368
ASIA PACIFIC: SEALANTS MARKET, BY COUNTRY, 2025–2030 (KILOTON)
TABLE 369
ASIA PACIFIC: ADHESIVES MARKET, BY TECHNOLOGY, 2020–2024 (USD MILLION)
TABLE 370
ASIA PACIFIC: ADHESIVES MARKET, BY TECHNOLOGY, 2025–2030 (USD MILLION)
TABLE 371
ASIA PACIFIC: ADHESIVES MARKET, BY TECHNOLOGY, 2020–2024 (KILOTON)
TABLE 372
ASIA PACIFIC: ADHESIVES MARKET, BY TECHNOLOGY, 2025–2030 (KILOTON)
TABLE 373
ASIA PACIFIC: WATER-BASED ADHESIVES MARKET, BY RESIN TYPE, 2020–2024 (USD MILLION)
TABLE 374
ASIA PACIFIC: WATER-BASED ADHESIVES MARKET, BY RESIN TYPE, 2025–2030 (USD MILLION)
TABLE 375
ASIA PACIFIC: WATER-BASED ADHESIVES MARKET, BY RESIN TYPE, 2020–2024 (KILOTON)
TABLE 376
ASIA PACIFIC: WATER-BASED ADHESIVES MARKET, BY RESIN TYPE, 2025–2030 (KILOTON)
TABLE 377
ASIA PACIFIC: SOLVENT-BASED ADHESIVES MARKET, BY RESIN TYPE, 2020–2024 (USD MILLION)
TABLE 378
ASIA PACIFIC: SOLVENT-BASED ADHESIVES MARKET, BY RESIN TYPE, 2025–2030 (USD MILLION)
TABLE 379
ASIA PACIFIC: SOLVENT-BASED ADHESIVES MARKET, BY RESIN TYPE, 2020–2024 (KILOTON)
TABLE 380
ASIA PACIFIC: SOLVENT-BASED ADHESIVES MARKET, BY RESIN TYPE, 2025–2030 (KILOTON)
TABLE 381
ASIA PACIFIC: HOT-MELT ADHESIVES MARKET, BY RESIN TYPE, 2020–2024 (USD MILLION)
TABLE 382
ASIA PACIFIC: HOT-MELT ADHESIVES MARKET, BY RESIN TYPE, 2025–2030 (USD MILLION)
TABLE 383
ASIA PACIFIC: HOT-MELT ADHESIVES MARKET, BY RESIN TYPE, 2020–2024 (KILOTON)
TABLE 384
ASIA PACIFIC: HOT-MELT ADHESIVES MARKET, BY RESIN TYPE, 2025–2030 (KILOTON)
TABLE 385
ASIA PACIFIC: REACTIVE & OTHER ADHESIVES MARKET, BY RESIN TYPE, 2020–2024 (USD MILLION)
TABLE 386
ASIA PACIFIC: REACTIVE & OTHER ADHESIVES MARKET, BY RESIN TYPE, 2025–2030 (USD MILLION)
TABLE 387
ASIA PACIFIC: REACTIVE & OTHER ADHESIVES MARKET, BY RESIN TYPE, 2020–2024 (KILOTON)
TABLE 388
ASIA PACIFIC: REACTIVE & OTHER ADHESIVES MARKET, BY RESIN TYPE, 2025–2030 (KILOTON)
TABLE 389
ASIA PACIFIC: ADHESIVES MARKET, BY APPLICATION, 2020–2024 (USD MILLION)
TABLE 390
ASIA PACIFIC: ADHESIVES MARKET, BY APPLICATION, 2025–2030 (USD MILLION)
TABLE 391
ASIA PACIFIC: ADHESIVES MARKET, BY APPLICATION, 2020–2024 (KILOTON)
TABLE 392
ASIA PACIFIC: ADHESIVES MARKET, BY APPLICATION, 2025–2030 (KILOTON)
TABLE 393
ASIA PACIFIC: SEALANTS MARKET, BY RESIN TYPE, 2020–2024 (USD MILLION)
TABLE 394
ASIA PACIFIC: SEALANTS MARKET, BY RESIN TYPE, 2025–2030 (USD MILLION)
TABLE 395
ASIA PACIFIC: SEALANTS MARKET, BY RESIN TYPE, 2020–2024 (KILOTON)
TABLE 396
ASIA PACIFIC: SEALANTS MARKET, BY RESIN TYPE, 2025–2030 (KILOTON)
TABLE 397
ASIA PACIFIC: SEALANTS MARKET, BY APPLICATION, 2020–2024 (USD MILLION)
TABLE 398
ASIA PACIFIC: SEALANTS MARKET, BY APPLICATION, 2025–2030 (USD MILLION)
TABLE 399
ASIA PACIFIC: SEALANTS MARKET, BY APPLICATION, 2020–2024 (KILOTON)
TABLE 400
ASIA PACIFIC: SEALANTS MARKET, BY APPLICATION, 2025–2030 (KILOTON)
TABLE 401
SOUTH AMERICA: ADHESIVES & SEALANTS MARKET, BY TYPE, 2020–2024 (USD MILLION)
TABLE 402
SOUTH AMERICA: ADHESIVES & SEALANTS MARKET, BY TYPE, 2025–2030 (USD MILLION)
TABLE 403
SOUTH AMERICA: ADHESIVES & SEALANTS MARKET, BY TYPE, 2020–2024 (KILOTON)
TABLE 404
SOUTH AMERICA: ADHESIVES & SEALANTS MARKET, BY TYPE, 2025–2030 (KILOTON)
TABLE 405
SOUTH AMERICA: ADHESIVES MARKET, BY COUNTRY, 2020–2024 (USD MILLION)
TABLE 406
SOUTH AMERICA: ADHESIVES MARKET, BY COUNTRY, 2025–2030 (USD MILLION)
TABLE 407
SOUTH AMERICA: ADHESIVES MARKET, BY COUNTRY, 2020–2024 (KILOTON)
TABLE 408
SOUTH AMERICA: ADHESIVES MARKET, BY COUNTRY, 2025–2030 (KILOTON)
TABLE 409
SOUTH AMERICA: SEALANTS MARKET, BY COUNTRY, 2020–2024 (USD MILLION)
TABLE 410
SOUTH AMERICA: SEALANTS MARKET, BY COUNTRY, 2025–2030 (USD MILLION)
TABLE 411
SOUTH AMERICA: SEALANTS MARKET, BY COUNTRY, 2020–2024 (KILOTON)
TABLE 412
SOUTH AMERICA: SEALANTS MARKET, BY COUNTRY, 2025–2030 (KILOTON)
TABLE 413
SOUTH AMERICA: ADHESIVES MARKET, BY TECHNOLOGY, 2020–2024 (USD MILLION)
TABLE 414
SOUTH AMERICA: ADHESIVES MARKET, BY TECHNOLOGY, 2025–2030 (USD MILLION)
TABLE 415
SOUTH AMERICA: ADHESIVES MARKET, BY TECHNOLOGY, 2020–2024 (KILOTON)
TABLE 416
SOUTH AMERICA: ADHESIVES MARKET, BY TECHNOLOGY, 2025–2030 (KILOTON)
TABLE 417
SOUTH AMERICA: WATER-BASED ADHESIVES MARKET, BY RESIN TYPE, 2020–2024 (USD MILLION)
TABLE 418
SOUTH AMERICA: WATER-BASED ADHESIVES MARKET, BY RESIN TYPE, 2025–2030 (USD MILLION)
TABLE 419
SOUTH AMERICA: WATER-BASED ADHESIVES MARKET, BY RESIN TYPE, 2020–2024 (KILOTON)
TABLE 420
SOUTH AMERICA: WATER-BASED ADHESIVES MARKET, BY RESIN TYPE, 2025–2030 (KILOTON)
TABLE 421
SOUTH AMERICA: SOLVENT-BASED ADHESIVES MARKET, BY RESIN TYPE, 2020–2024 (USD MILLION)
TABLE 422
SOUTH AMERICA: SOLVENT-BASED ADHESIVES MARKET, BY RESIN TYPE, 2025–2030 (USD MILLION)
TABLE 423
SOUTH AMERICA: SOLVENT-BASED ADHESIVES MARKET, BY RESIN TYPE, 2020–2024 (KILOTON)
TABLE 424
SOUTH AMERICA: SOLVENT-BASED ADHESIVES MARKET, BY RESIN TYPE, 2025–2030 (KILOTON)
TABLE 425
SOUTH AMERICA: HOT-MELT ADHESIVES MARKET, BY RESIN TYPE, 2020–2024 (USD MILLION)
TABLE 426
SOUTH AMERICA: HOT-MELT ADHESIVES MARKET, BY RESIN TYPE, 2025–2030 (USD MILLION)
TABLE 427
SOUTH AMERICA: HOT-MELT ADHESIVES MARKET, BY RESIN TYPE, 2020–2024 (KILOTON)
TABLE 428
SOUTH AMERICA: HOT-MELT ADHESIVES MARKET, BY RESIN TYPE, 2025–2030 (KILOTON)
TABLE 429
SOUTH AMERICA: REACTIVE & OTHER ADHESIVES MARKET, BY RESIN TYPE, 2020–2024 (USD MILLION)
TABLE 430
SOUTH AMERICA: REACTIVE & OTHER ADHESIVES MARKET, BY RESIN TYPE, 2025–2030 (USD MILLION)
TABLE 431
SOUTH AMERICA: REACTIVE & OTHER ADHESIVES MARKET, BY RESIN TYPE, 2020–2024 (KILOTON)
TABLE 432
SOUTH AMERICA: REACTIVE & OTHER ADHESIVES MARKET, BY RESIN TYPE, 2025–2030 (KILOTON)
TABLE 433
SOUTH AMERICA: ADHESIVES MARKET, BY APPLICATION, 2020–2024 (USD MILLION)
TABLE 434
SOUTH AMERICA: ADHESIVES MARKET, BY APPLICATION, 2025–2030 (USD MILLION)
TABLE 435
SOUTH AMERICA: ADHESIVES MARKET, BY APPLICATION, 2020–2024 (KILOTON)
TABLE 436
SOUTH AMERICA: ADHESIVES MARKET, BY APPLICATION, 2025–2030 (KILOTON)
TABLE 437
SOUTH AMERICA: SEALANTS MARKET, BY RESIN TYPE, 2020–2024 (USD MILLION)
TABLE 438
SOUTH AMERICA: SEALANTS MARKET, BY RESIN TYPE, 2025–2030 (USD MILLION)
TABLE 439
SOUTH AMERICA: SEALANTS MARKET, BY RESIN TYPE, 2020–2024 (KILOTON)
TABLE 440
SOUTH AMERICA: SEALANTS MARKET, BY RESIN TYPE, 2025–2030 (KILOTON)
TABLE 441
SOUTH AMERICA: SEALANTS MARKET, BY APPLICATION, 2020–2024 (USD MILLION)
TABLE 442
SOUTH AMERICA: SEALANTS MARKET, BY APPLICATION, 2025–2030 (USD MILLION)
TABLE 443
SOUTH AMERICA: SEALANTS MARKET, BY APPLICATION, 2020–2024 (KILOTON)
TABLE 444
SOUTH AMERICA: SEALANTS MARKET, BY APPLICATION, 2025–2030 (KILOTON)
TABLE 445
MIDDLE EAST & AFRICA: ADHESIVES & SEALANTS MARKET, BY TYPE, 2020–2024 (USD MILLION)
TABLE 446
MIDDLE EAST & AFRICA: ADHESIVES & SEALANTS MARKET, BY TYPE, 2025–2030 (USD MILLION)
TABLE 447
MIDDLE EAST & AFRICA: ADHESIVES & SEALANTS MARKET, BY TYPE, 2020–2024 (KILOTON)
TABLE 448
MIDDLE EAST & AFRICA: ADHESIVES & SEALANTS MARKET, BY TYPE, 2025–2030 (KILOTON)
TABLE 449
MIDDLE EAST & AFRICA: ADHESIVES MARKET, BY COUNTRY, 2020–2024 (USD MILLION)
TABLE 450
MIDDLE EAST & AFRICA: ADHESIVES MARKET, BY COUNTRY, 2025–2030 (USD MILLION)
TABLE 451
MIDDLE EAST & AFRICA: ADHESIVES MARKET, BY COUNTRY, 2020–2024 (KILOTON)
TABLE 452
MIDDLE EAST & AFRICA: ADHESIVES MARKET, BY COUNTRY, 2025–2030 (KILOTON)
TABLE 453
MIDDLE EAST & AFRICA: SEALANTS MARKET, BY COUNTRY, 2020–2024 (USD MILLION)
TABLE 454
MIDDLE EAST & AFRICA: SEALANTS MARKET, BY COUNTRY, 2025–2030 (USD MILLION)
TABLE 455
MIDDLE EAST & AFRICA: SEALANTS MARKET, BY COUNTRY, 2020–2024 (KILOTON)
TABLE 456
MIDDLE EAST & AFRICA: SEALANTS MARKET, BY COUNTRY, 2025–2030 (KILOTON)
TABLE 457
MIDDLE EAST & AFRICA: ADHESIVES MARKET, BY TECHNOLOGY, 2020–2024 (USD MILLION)
TABLE 458
MIDDLE EAST & AFRICA: ADHESIVES MARKET, BY TECHNOLOGY, 2025–2030 (USD MILLION)
TABLE 459
MIDDLE EAST & AFRICA: ADHESIVES MARKET, BY TECHNOLOGY, 2020–2024 (KILOTON)
TABLE 460
MIDDLE EAST & AFRICA: ADHESIVES MARKET, BY TECHNOLOGY, 2025–2030 (KILOTON)
TABLE 461
MIDDLE EAST & AFRICA: WATER-BASED ADHESIVES MARKET, BY RESIN TYPE, 2020–2024 (USD MILLION)
TABLE 462
MIDDLE EAST & AFRICA: WATER-BASED ADHESIVES MARKET, BY RESIN TYPE, 2025–2030 (USD MILLION)
TABLE 463
MIDDLE EAST & AFRICA: WATER-BASED ADHESIVES MARKET, BY RESIN TYPE, 2020–2024 (KILOTON)
TABLE 464
MIDDLE EAST & AFRICA: WATER-BASED ADHESIVES MARKET, BY RESIN TYPE, 2025–2030 (KILOTON)
TABLE 465
MIDDLE EAST & AFRICA: SOLVENT-BASED ADHESIVES MARKET, BY RESIN TYPE, 2020–2024 (USD MILLION)
TABLE 466
MIDDLE EAST & AFRICA: SOLVENT-BASED ADHESIVES MARKET, BY RESIN TYPE, 2025–2030 (USD MILLION)
TABLE 467
MIDDLE EAST & AFRICA: SOLVENT-BASED ADHESIVES MARKET, BY RESIN TYPE, 2020–2024 (KILOTON)
TABLE 468
MIDDLE EAST & AFRICA: SOLVENT-BASED ADHESIVES MARKET, BY RESIN TYPE, 2025–2030 (KILOTON)
TABLE 469
MIDDLE EAST & AFRICA: HOT-MELT ADHESIVES MARKET, BY RESIN TYPE, 2020–2024 (USD MILLION)
TABLE 470
MIDDLE EAST & AFRICA: HOT-MELT ADHESIVES MARKET, BY RESIN TYPE,2025–2030 (USD MILLION)
TABLE 471
MIDDLE EAST & AFRICA: HOT-MELT ADHESIVES MARKET, BY RESIN TYPE, 2020–2024 (KILOTON)
TABLE 472
MIDDLE EAST & AFRICA: HOT-MELT ADHESIVES MARKET, BY RESIN TYPE, 2025–2030 (KILOTON)
TABLE 473
MIDDLE EAST & AFRICA: REACTIVE & OTHER ADHESIVES MARKET, BY RESIN TYPE, 2020–2024 (USD MILLION)
TABLE 474
MIDDLE EAST & AFRICA: REACTIVE & OTHER ADHESIVES MARKET, BY RESIN TYPE, 2025–2030 (USD MILLION)
TABLE 475
MIDDLE EAST & AFRICA: REACTIVE & OTHER ADHESIVES MARKET, BY RESIN TYPE, 2020–2024 (KILOTON)
TABLE 476
MIDDLE EAST & AFRICA: REACTIVE & OTHER ADHESIVES MARKET, BY RESIN TYPE, 2025–2030 (KILOTON)
TABLE 477
MIDDLE EAST & AFRICA: ADHESIVES MARKET, BY APPLICATION, 2020–2024 (USD MILLION)
TABLE 478
MIDDLE EAST & AFRICA: ADHESIVES MARKET, BY APPLICATION, 2025–2030 (USD MILLION)
TABLE 479
MIDDLE EAST & AFRICA: ADHESIVES MARKET, BY APPLICATION, 2020–2024 (KILOTON)
TABLE 480
MIDDLE EAST & AFRICA: ADHESIVES MARKET, BY APPLICATION, 2025–2030 (KILOTON)
TABLE 481
MIDDLE EAST & AFRICA: SEALANTS MARKET, BY RESIN TYPE, 2020–2024 (USD MILLION)
TABLE 482
MIDDLE EAST & AFRICA: SEALANTS MARKET, BY RESIN TYPE, 2025–2030 (USD MILLION)
TABLE 483
MIDDLE EAST & AFRICA: SEALANTS MARKET, BY RESIN TYPE, 2020–2024 (KILOTON)
TABLE 484
MIDDLE EAST & AFRICA: SEALANTS MARKET, BY RESIN TYPE, 2025–2030 (KILOTON)
TABLE 485
MIDDLE EAST & AFRICA: SEALANTS MARKET, BY APPLICATION, 2020–2024 (USD MILLION)
TABLE 486
MIDDLE EAST & AFRICA: SEALANTS MARKET, BY APPLICATION, 2025–2030 (USD MILLION)
TABLE 487
MIDDLE EAST & AFRICA: SEALANTS MARKET, BY APPLICATION, 2020–2024 (KILOTON)
TABLE 488
MIDDLE EAST & AFRICA: SEALANTS MARKET, BY APPLICATION, 2025–2030 (KILOTON)
TABLE 489
STRATEGIES ADOPTED BY KEY ADHESIVE & SEALANT MANUFACTURERS, JANUARY 2020–MAY 2025
TABLE 490
ADHESIVES & SEALANTS MARKET: DEGREE OF COMPETITION
TABLE 491
ADHESIVES & SEALANTS MARKET: REGION FOOTPRINT
TABLE 492
ADHESIVES & SEALANTS MARKET: APPLICATION FOOTPRINT
TABLE 493
ADHESIVES & SEALANTS MARKET: DETAILED LIST OF KEY STARTUPS/SMES
TABLE 494
ADHESIVES & SEALANTS MARKET: COMPETITIVE BENCHMARKING OF KEY STARTUPS/SMES
TABLE 495
ADHESIVES & SEALANTS MARKET: PRODUCT LAUNCHES, JANUARY 2020–MAY 2025
TABLE 496
ADHESIVES & SEALANTS MARKET: DEALS, JANUARY 2020–MAY 2025
TABLE 497
ADHESIVES & SEALANTS MARKET: EXPANSIONS, JANUARY 2020–APRIL 2025
TABLE 498
HENKEL AG & CO. KGAACOMPANY OVERVIEW
TABLE 499
HENKEL AG & CO. KGAA: PRODUCTS OFFERED
TABLE 500
HENKEL AG & CO. KGAA: PRODUCT LAUNCHES, JANUARY 2020–MAY 2025
TABLE 501
HENKEL AG & CO. KGAA: DEALS, JANUARY 2020–MAY 2025
TABLE 502
HENKEL AG & CO. KGAA: EXPANSIONS, JANUARY 2020–MAY 2025
TABLE 503
H.B. FULLER COMPANY: COMPANY OVERVIEW
TABLE 504
H.B. FULLER COMPANY: PRODUCTS OFFERED
TABLE 505
H.B. FULLER COMPANY: PRODUCT LAUNCHES, JANUARY 2020–MAY 2025
TABLE 506
H.B. FULLER COMPANY: DEALS, JANUARY 2020–MAY 2025
TABLE 507
H.B. FULLER COMPANY: EXPANSIONS, JANUARY 2020–MAY 2025
TABLE 508
SIKA AG: COMPANY OVERVIEW
TABLE 509
SIKA AG: PRODUCTS OFFERED
TABLE 510
SIKA AG: DEALS, JANUARY 2020–MAY 2025
TABLE 511
SIKA AG: EXPANSIONS, JANUARY 2020–MAY 2025
TABLE 512
ARKEMA: COMPANY OVERVIEW
TABLE 513
ARKEMA: PRODUCTS OFFERED
TABLE 514
ARKEMA: PRODUCT LAUNCHES, JANUARY 2020–MAY 2025
TABLE 515
ARKEMA: DEALS, JANUARY 2020–MAY 2025
TABLE 516
3M COMPANY: COMPANY OVERVIEW
TABLE 517
3M COMPANY: PRODUCT OFFERED
TABLE 518
3M COMPANY: PRODUCT LAUNCHES, JANUARY 2020–MAY 2025
TABLE 519
HUNTSMAN CORPORATION: COMPANY OVERVIEW
TABLE 520
HUNTSMAN CORPORATION: PRODUCTS OFFERED
TABLE 521
HUNTSMAN CORPORATION: PRODUCT LAUNCHES, JANUARY 2020–MAY 2025
TABLE 522
HUNTSMAN CORPORATION: DEALS, JANUARY 2020–MAY 2025
TABLE 523
HUNTSMAN CORPORATION: EXPANSIONS, JANUARY 2020–MAY 2025
TABLE 524
DOW INC.: COMPANY OVERVIEW
TABLE 525
DOW INC.: PRODUCTS OFFERED
TABLE 526
DOW INC.: PRODUCT LAUNCHES, JANUARY 2020–MAY 2025
TABLE 527
DOW INC.: EXPANSIONS, JANUARY 2020–MAY 2025
TABLE 528
AVERY DENNISON CORPORATION: COMPANY OVERVIEW
TABLE 529
AVERY DENNISON CORPORATION: PRODUCTS OFFERED
TABLE 530
AVERY DENNISON CORPORATION: PRODUCT LAUNCHES, JANUARY 2020–MAY 2025
TABLE 531
AVERY DENNISON CORPORATION: EXPANSIONS, JANUARY 2020–MAY 2025
TABLE 532
WACKER CHEMIE AG: COMPANY OVERVIEW
TABLE 533
WACKER CHEMIE AG: PRODUCTS/SOLUTIONS/SERVICES OFFERED
TABLE 534
WACKER CHEMIE AG: PRODUCT LAUNCHES, JANUARY 2020–MAY 2025
TABLE 535
WACKER CHEMIE AG: EXPANSIONS, JANUARY 2020–MAY 2025
TABLE 536
ILLINOIS TOOL WORKS INC.: COMPANY OVERVIEW
TABLE 537
ILLINOIS TOOL WORKS INC.: PRODUCTS OFFERED
TABLE 538
ILLINOIS TOOL WORKS INC.: PRODUCT LAUNCHES, JANUARY 2020–MAY 2025
TABLE 539
ILLINOIS TOOL WORKS INC.: DEALS, JANUARY 2020–MAY 2025
TABLE 540
AKZO NOBEL N.V.: COMPANY OVERVIEW
TABLE 541
PPG INDUSTRIES, INC.: COMPANY OVERVIEW
TABLE 542
PARKER HANNIFIN CORP: COMPANY OVERVIEW
TABLE 543
ADHESIVES RESEARCH, INC.: COMPANY OVERVIEW
TABLE 544
DELO INDUSTRIE KLEBSTOFFE GMBH & CO. KGAA: COMPANY OVERVIEW
TABLE 545
DYMAX: COMPANY OVERVIEW
TABLE 546
MAPEI S.P.A.: COMPANY OVERVIEW
TABLE 547
MERIDIAN ADHESIVES GROUP: COMPANY OVERVIEW
TABLE 548
MASTER BOND INC. COMPANY OVERVIEW
TABLE 549
SOUDAL GROUP: COMPANY OVERVIEW
TABLE 550
PIDILITE INDUSTRIES LTD.: COMPANY OVERVIEW
TABLE 551
JOWAT SE: COMPANY OVERVIEW
TABLE 552
FRANKLIN INTERNATIONAL: COMPANY OVERVIEW
TABLE 553
ASTRAL ADHESIVES: COMPANY OVERVIEW
TABLE 554
DIC CORPORATION: COMPANY OVERVIEW
TABLE 555
CONSTRUCTION SEALANTS MARKET, BY RESIN TYPE, 2020–2022 (USD MILLION)
TABLE 556
CONSTRUCTION SEALANTS MARKET, BY RESIN TYPE, 2023–2028 (USD MILLION)
TABLE 557
CONSTRUCTION SEALANTS MARKET, BY RESIN TYPE, 2020–2022 (KILOTON)
TABLE 558
CONSTRUCTION SEALANTS MARKET, BY RESIN TYPE, 2023–2028 (KILOTON)
TABLE 559
CONSTRUCTION SEALANTS MARKET, BY APPLICATION, 2020–2022 (USD MILLION)
TABLE 560
CONSTRUCTION SEALANTS MARKET, BY APPLICATION, 2023–2028 (USD MILLION)
TABLE 561
CONSTRUCTION SEALANTS MARKET, BY APPLICATION, 2020–2022 (KILOTON)
TABLE 562
CONSTRUCTION SEALANTS MARKET, BY APPLICATION, 2023–2028 (KILOTON)
TABLE 563
CONSTRUCTION SEALANTS MARKET, BY END-USE INDUSTRY, 2020–2022 (USD MILLION)
TABLE 564
CONSTRUCTION SEALANTS MARKET, BY END-USE INDUSTRY, 2023–2028 (USD MILLION)
TABLE 565
CONSTRUCTION SEALANTS MARKET, BY END-USE INDUSTRY, 2020–2022 (KILOTON)
TABLE 566
CONSTRUCTION SEALANTS MARKET, BY END-USE INDUSTRY, 2023–2028 (KILOTON)
TABLE 567
CONSTRUCTION SEALANTS MARKET, BY REGION, 2020–2022 (USD MILLION)
TABLE 568
CONSTRUCTION SEALANTS MARKET, BY REGION, 2023–2028 (USD MILLION)
TABLE 569
CONSTRUCTION SEALANTS MARKET, BY REGION, 2020–2022 (KILOTON)
TABLE 570
CONSTRUCTION SEALANTS MARKET, BY REGION, 2023–2028 (KILOTON)
FIGURE 1
ADHESIVES & SEALANTS MARKET SEGMENTATION
FIGURE 2
ADHESIVES & SEALANTS MARKET: RESEARCH DESIGN
FIGURE 3
MARKET SIZE ESTIMATION METHODOLOGY: APPROACH 1 (SUPPLY SIDE)—COLLECTIVE SHARE OF KEY PLAYERS
FIGURE 4
MARKET SIZE ESTIMATION METHODOLOGY: APPROACH 2 BOTTOM-UP (SUPPLY SIDE): COLLECTIVE REVENUE OF ALL PRODUCTS
FIGURE 5
MARKET SIZE ESTIMATION METHODOLOGY: APPROACH 3 – BOTTOM-UP (DEMAND SIDE)
FIGURE 6
MARKET SIZE ESTIMATION: TOP-DOWN APPROACH
FIGURE 7
ADHESIVES & SEALANTS MARKET SIZE ESTIMATION, BY REGION
FIGURE 8
ADHESIVES & SEALANTS MARKET: SUPPLY-SIDE FORECAST
FIGURE 9
ADHESIVES & SEALANTS MARKET: DATA TRIANGULATION
FIGURE 10
HOT-MELT SEGMENT TO REGISTER HIGHT CAGR IN ADHESIVES MARKET DURING FORECAST PERIOD
FIGURE 11
ELECTRONIC APPLICATION TO REGISTER HIGHEST CAGR IN ADHESIVES MARKET
FIGURE 12
SILICONE TO BE LEADING RESIN TYPE IN SEALANTS MARKET
FIGURE 13
ASIA PACIFIC LED ADHESIVES & SEALANTS MARKET IN 2024
FIGURE 14
ADHESIVES & SEALANTS MARKET TO WITNESS MODERATE GROWTH DURING FORECAST PERIOD
FIGURE 15
ASIA PACIFIC TO REGISTER HIGHEST GROWTH BETWEEN 2025 AND 2030
FIGURE 16
CHINA ACCOUNTED FOR LARGEST MARKET SHARE IN 2024
FIGURE 17
SILICONE SEGMENT ACCOUNTED FOR LARGEST MARKET SHARE IN 2024
FIGURE 18
BUILDING & CONSTRUCTION LARGEST SEALANT APPLICATION IN 2024
FIGURE 19
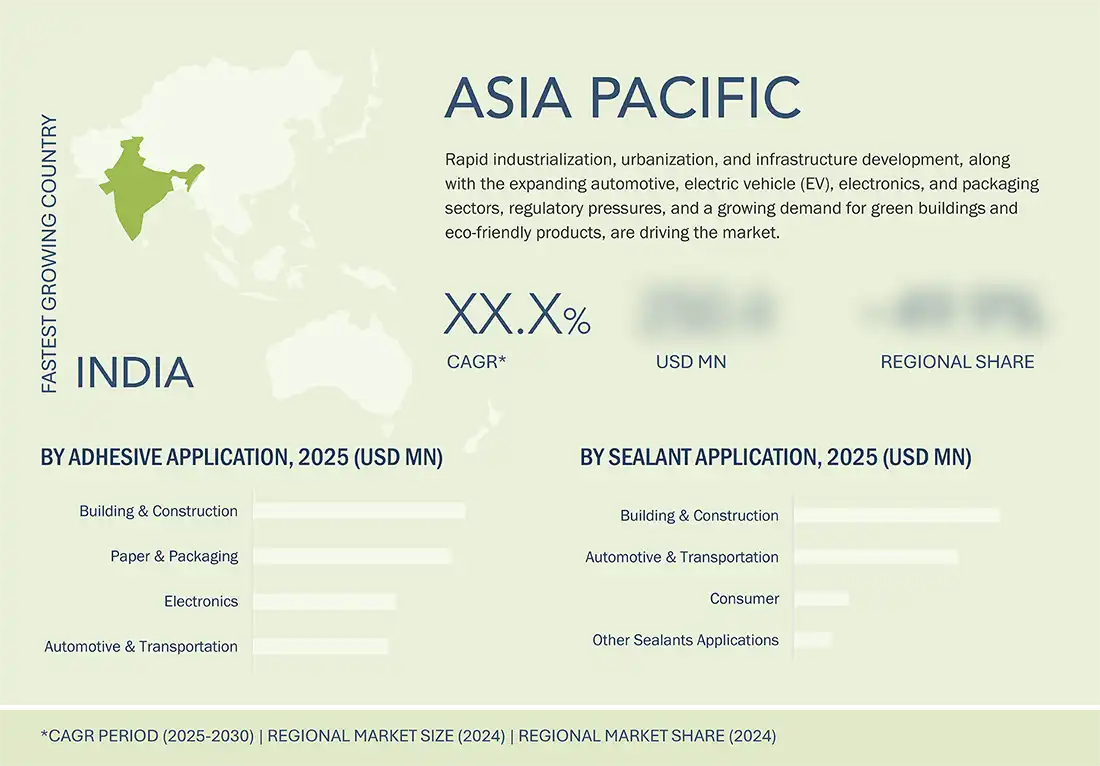
INDIA TO REGISTER HIGHEST CAGR DURING FORECAST PERIOD
FIGURE 20
ADHESIVES & SEALANTS MARKET: DRIVERS, RESTRAINTS, OPPORTUNITIES, AND CHALLENGES
FIGURE 21
PORTER'S FIVE FORCES ANALYSIS: ADHESIVES & SEALANTS MARKET
FIGURE 22
ADHESIVES & SEALANTS MARKET: SUPPLY CHAIN ANALYSIS
FIGURE 23
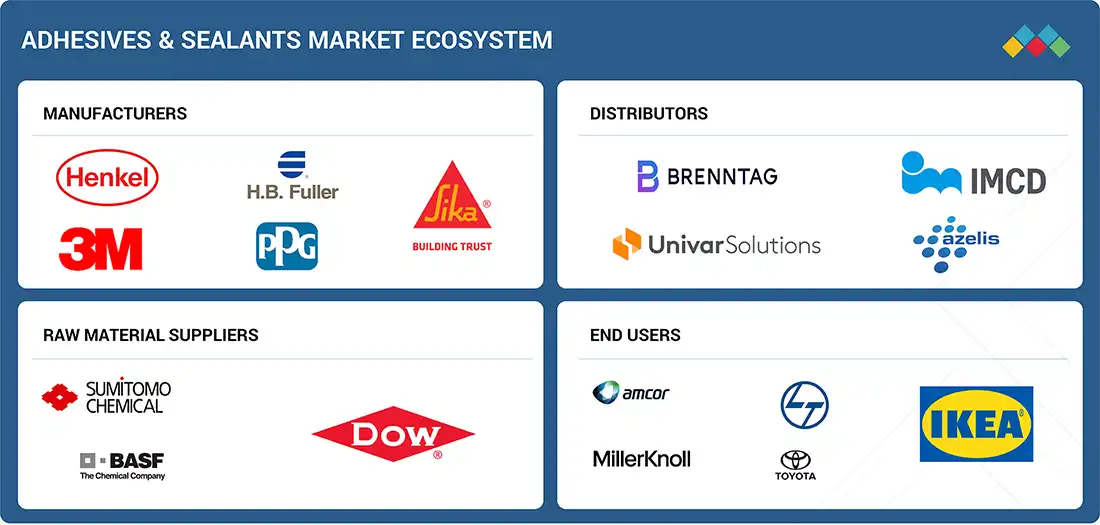
ADHESIVES & SEALANTS MARKET: ECOSYSTEM
FIGURE 24
NEW REVENUE POCKETS IN ADHESIVES & SEALANTS MARKET
FIGURE 25
INFLUENCE OF STAKEHOLDERS IN BUYING PROCESS
FIGURE 26
KEY BUYING CRITERIA FOR ADHESIVES & SEALANTS
FIGURE 27
PRICE RANGE OF ADHESIVES OFFERED BY KEY PLAYERS, BY APPLICATION, 2024
FIGURE 28
PRICE RANGE OF SEALANTS OFFERED BY KEY PLAYERS, BY APPLICATION, 2024
FIGURE 29
AVERAGE SELLING PRICE TREND OF ADHESIVES, BY REGION
FIGURE 30
AVERAGE SELLING PRICE TREND OF SEALANTS, BY REGION
FIGURE 31
IMPORT DATA FOR ADHESIVES & SEALANTS, BY KEY COUNTRY, 2020–2024 (USD MILLION)
FIGURE 32
EXPORT DATA FOR ADHESIVES & SEALANTS, BY KEY COUNTRY, 2020–2024 (USD MILLION)
FIGURE 33
PATENTS REGISTERED FOR ADHESIVES & SEALANTS, 2014–2024
FIGURE 34
MAJOR PATENTS RELATED TO ADHESIVES & SEALANTS, 2014–2024
FIGURE 35
LEGAL STATUS OF PATENTS RELATED TO ADHESIVES & SEALANTS, 2014–2024
FIGURE 36
MAXIMUM PATENTS FILED IN JURISDICTION OF US, 2014–2024
FIGURE 37
IMPACT OF AI/GEN AI ON ADHESIVES & SEALANTS MARKET
FIGURE 38
ADHESIVE SEGMENT TO LEAD ADHESIVES & SEALANTS MARKET DURING FORECAST PERIOD
FIGURE 39
WATER-BASED TECHNOLOGY TO LEAD ADHESIVES MARKET DURING FORECAST PERIOD
FIGURE 40
PAPER & PACKAGING SEGMENT TO LEAD ADHESIVES MARKET DURING FORECAST PERIOD
FIGURE 41
SILICONE SEGMENT TO LEAD SEALANTS MARKET DURING FORECAST PERIOD
FIGURE 42
BUILDING & CONSTRUCTION SEGMENT TO LEAD SEALANTS MARKET DURING FORECAST PERIOD
FIGURE 43
ASIA PACIFIC TO REGISTER HIGHEST CAGR FOR ADHESIVES BETWEEN 2024 AND 2029
FIGURE 44
NORTH AMERICA: ADHESIVES & SEALANTS MARKET SNAPSHOT
FIGURE 45
EUROPE: ADHESIVES & SEALANTS MARKET SNAPSHOT
FIGURE 46
ASIA PACIFIC: ADHESIVES & SEALANTS MARKET SNAPSHOT
FIGURE 47
ADHESIVES & SEALANTS MARKET SHARE ANALYSIS OF TOP FIVE PLAYERS, 2024
FIGURE 48
ADHESIVES & SEALANTS MARKET: REVENUE ANALYSIS OF KEY PLAYERS, 2021–2024
FIGURE 49
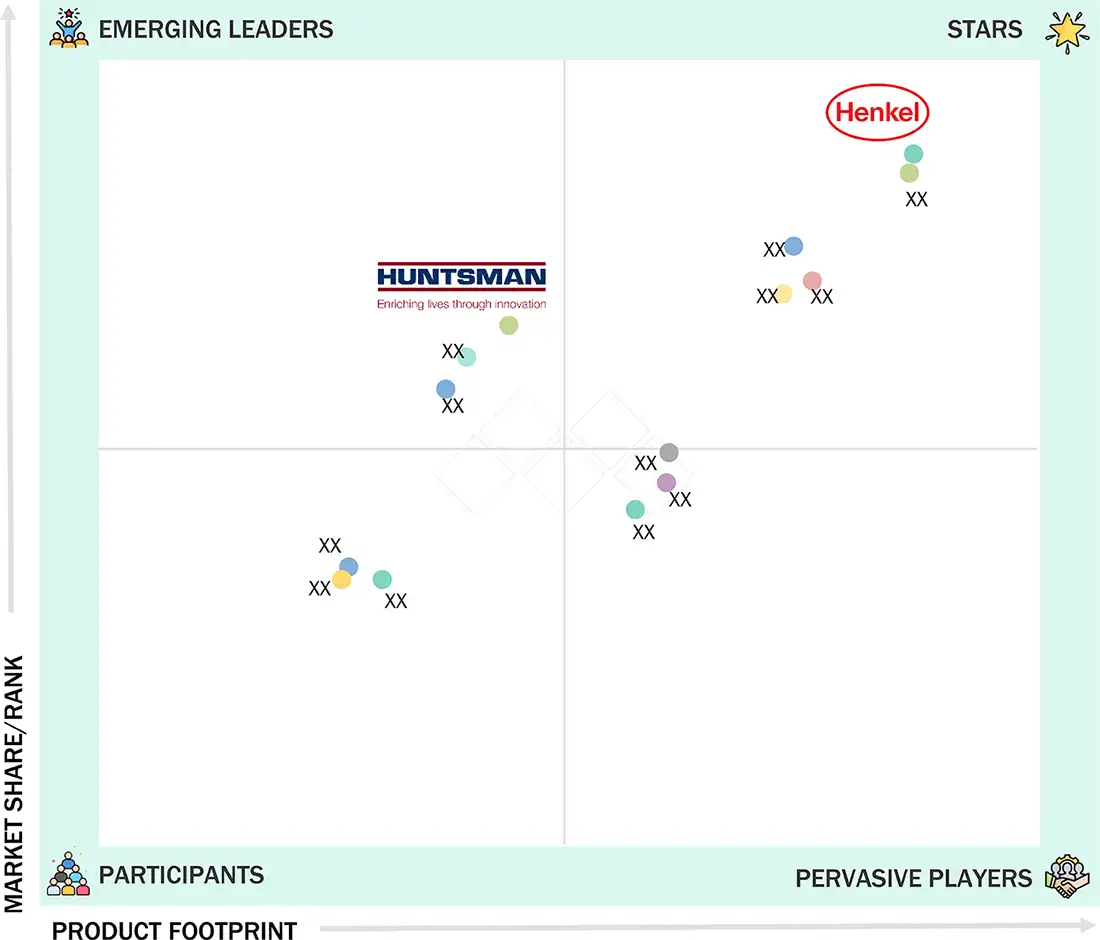
ADHESIVES & SEALANTS MARKET: COMPANY EVALUATION MATRIX (KEY PLAYERS), 2024
FIGURE 50
ADHESIVES & SEALANTS MARKET: COMPANY FOOTPRINT
FIGURE 51
ADHESIVES & SEALANTS MARKET: COMPANY EVALUATION MATRIX (STARTUPS/SMES), 2024
FIGURE 52
PRODUCT COMPARISON
FIGURE 53
ADHESIVES & SEALANTS MARKET: EV/EBITDA OF KEY MANUFACTURERS
FIGURE 54
ADHESIVES & SEALANTS MARKET: ENTERPRISE VALUATION (EV) OF KEY PLAYERS
FIGURE 55
HENKEL AG & CO. KGAA: COMPANY SNAPSHOT
FIGURE 56
H.B. FULLER COMPANY: COMPANY SNAPSHOT
FIGURE 57
SIKA AG: COMPANY SNAPSHOT
FIGURE 58
ARKEMA: COMPANY SNAPSHOT
FIGURE 59
3M COMPANY: COMPANY SNAPSHOT
FIGURE 60
HUNTSMAN CORPORATION: COMPANY SNAPSHOT
FIGURE 61
DOW INC.: COMPANY SNAPSHOT
FIGURE 62
AVERY DENNISON CORPORATION: COMPANY SNAPSHOT
FIGURE 63
WACKER CHEMIE AG: COMPANY SNAPSHOT
FIGURE 64
ILLINOIS TOOL WORKS INC.: COMPANY SNAPSHOT


 Exclusive indicates content/data unique to MarketsandMarkets and not available with any competitors.


Leena
Dec, 2015
Market dynamics, growth trends, key manufacturers, and raw material analysis, different applications present in the market.
Steffen
Jan, 2019
General information on Adhesives Market.
Madhurima
Jul, 2013
Oil & Gas market in India, Future of Telecom in India, Railways and Power. Manufacturers of sealant, adhesives , putty etc in india.
Madhurima
Jul, 2013
Data on potential market assessment of cable glands, sealant, putty etc in the segments such as Oil & Gas, Power, energy, Railways and Telecom Markets in India. .
Zaw
Mar, 2016
Require report list of seanat, adhesive, weld-crete, PU foam, and others.
Kenneth
May, 2012
General information on European adhesives and sealants market .
Gabriele
Aug, 2017
Report title not mentioned.
Masami
Mar, 2019
Interested in global market..
Burcu
May, 2015
General information on Adhesives & Sealants market by material.
Tim
Nov, 2014
Global Adhesives: Market Revenue, By Applications,2011 � 2018 ($Million) Sealants: Market Revenue, By Applications,2011 � 2018 ($Million) and for Europe.
Sandra
Feb, 2017
Market data for global Superplasticizers market.
kishan
Feb, 2015
sample data needed for demand drivers of adhesives and sealants industry in india.
Timothy
Jan, 2015
Interested in Woodflooring adhesives and Sealants..
Hans-Joachim
Jun, 2012
Looking for global adhesie market breakdown by Suppliers and future growth prospects.
Hans-Joachim
Jun, 2012
Global adhesive market split by suppliers (% share) by technology PUR, epoxy , acrylic etc. and future growth rate.
Nick
Apr, 2017
Adhesives (non consturction). i.e. Cyanoacylates, Epoxys, PVAs, PUs, SMPs, etc, for small job "repair and create" use..
Andrew
May, 2022
How big is the Adhesives And Sealants Market ? Do you have information on Adhesives And Sealants Market Size upto 2030 ? Report Attributes, Report coverage, Revenue forecast. Need this data at the earliest. Can you help ?.
Samantha
May, 2015
Interested in forecast, historical, per capita of global adhesives and sealants market.
Justin
Jun, 2012
Interested in thermoset adhesives such as PU or polycarbonate.
Justin
Jun, 2012
Thermoset adhesives, specifically those that are polycarbonate polyol based or polyurethanes and chemistries.
Donyaporn
Apr, 2015
Market value of adhesive market by technology (solvent, hotmelt, water based) in Thailand. .
Khaled
Feb, 2014
interetsed to about lamination adhesives market in UAE in terms of market size , current local production size and expected growth for the next 3 years (flexible packaging segment ).
Sigal
Dec, 2013
Purchase inquiry for Adhesives & Sealants market report.
Rahul
Jun, 2019
Market potential of Tile Adhesives in India, with a focus on Southern Region for a startup. .
Jack
Apr, 2017
Specific information on application of Adhesives & Sealants for electrically conductive, thermal, and UV-cured .
Mark
Oct, 2014
Need broad understanding of entire adhesives and sealants industry.
Csaszar
Sep, 2019
Find general informations about Adhesives and Sealants market..
Piyal
Jul, 2017
Bonding techniques in Fabric and future outlook.
JK
Oct, 2015
Interested in Tire Sealant, Hot melt Adhesive, Pressure sensitive adhesive.
JK
Oct, 2015
Adhesive and sealant for Tire Application.
jaime
Sep, 2016
Contact Adhesive Market.
Birendra
Sep, 2015
Coverage of off the shelf reports adhesive portfolio. Also wants to lear about overall global market of adhesive.
Birendra
Sep, 2015
Needed Adhesive market for book report .
Abhishek
Apr, 2013
Interested in comparitive study of natural adhesives vs their polymeric counterparts.
Seung
Mar, 2017
Global adhesive market and trends.
Deepakraja
Mar, 2016
Adhesives sales growth from 2012 to 2018 along with technology growth..
Zeeshan
Mar, 2016
Interested in Polyamide,Polyurethane,Water Based,Solventless and Solvent Based Adhesive for flexible packaging lamination.
Koshy
Jan, 2015
Information on Oil and Gas Sealant Market.
Alexander
Aug, 2017
General information on specialty adhesives market .
Alice
Feb, 2018
SOLVENT-BASED ADHESIVES MARKET.
DILIP
Jan, 2014
Information on India Adhesives market by Volume and Value.
Mark
Oct, 2014
Interested in market for Malaysia, Indonesia, Hongkong, Singapore, and Thailand.
SONER
Sep, 2017
required more information.
Kelvin
Dec, 2018
General information on two reports i.e. adhesive and sealant & ink additives .
janardhan
Dec, 2015
Interested in bottle label market.
Melissa
Oct, 2017
Report on Adhesives/sealants market.
Nina
Oct, 2017
Specific information for construction silicones, Polyurethane adhesives (1K, 2K- 1/2), MS-Polymers, Plastisoles in the automotive industry.
jalil
Sep, 2016
Market information on acrylic adhesive market globally .
Eduardo
Sep, 2014
Interested in Adhesives & Sealants Market report.
Ek
Aug, 2015
hot melt i.e. technology, industry, and equipment. Future technology as well if possible..
Ek
Aug, 2015
Specific information on hot melt .
Freddy
Aug, 2018
Customer identification for Vinyl Acetate/Ethylene (VAE) Emulsion and 1,4 BDO .
MyeongJin
Aug, 2015
Sample of Hot Melt Adhesive.
Julien
Aug, 2014
Looking for insights on footwear adhesives market.
Andrej
Jul, 2013
Specific information on poland adhesives .
Faheem
Jun, 2019
Cut-off report available?.
Anja
May, 2017
Information on scope of our study with a small description.
john
Apr, 2017
General information on adhesives and sealants market in electronics application.
Rakesh
Mar, 2014
Sealants market by type and Application.
Sharon
Mar, 2020
Can I get a citation reference for this report? .
Aaron
Feb, 2019
Information in adhesives and sealents market.
Vamsikrishna
Feb, 2012
Global polyisobutylene adhesive market .
Madhurima
Jan, 2013
Information on Cable Sealing compounds market potential, Electrical Cabinet manufacturers, Oil & Gas market in India.
Robin
Jan, 2014
Adhesives + sealants in: Agriculture/Construction/Filtration/Appliances/Medical/White goods/Wind energy..