
Position Sensor Market Size, Share and Trends, 2025 To 2030

Position Sensor Market by Type (Linear, Rotary, Proximity, Photoelectric, ToF, Stereo Vision, Structured Light), Signal (Digital, Analog), Technology (Capacitive, Inductive, Optical, Magnetic, Ultrasonic) - Global Forecast to 2030


OVERVIEW
Source: Secondary Research, Interviews with Experts, MarketsandMarkets Analysis
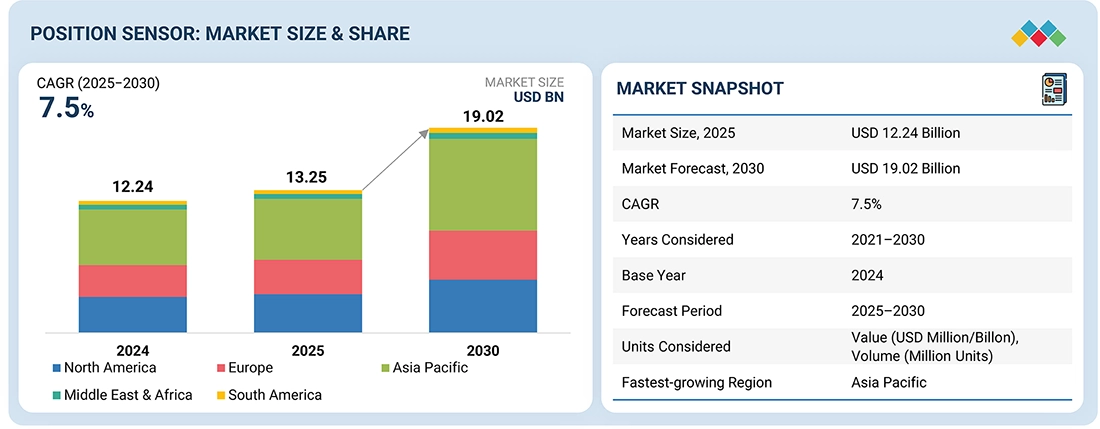
The laser processing market is projected to reach USD 19.02 billion by 2030 from USD 13.25 billion in 2025, at a CAGR of 7.5%. The position sensors market is expanding due to the rising adoption across various industries, including manufacturing, automotive, aerospace, healthcare, and consumer electronics, driven by automation and advanced sensor technologies.
KEY TAKEAWAYS
-
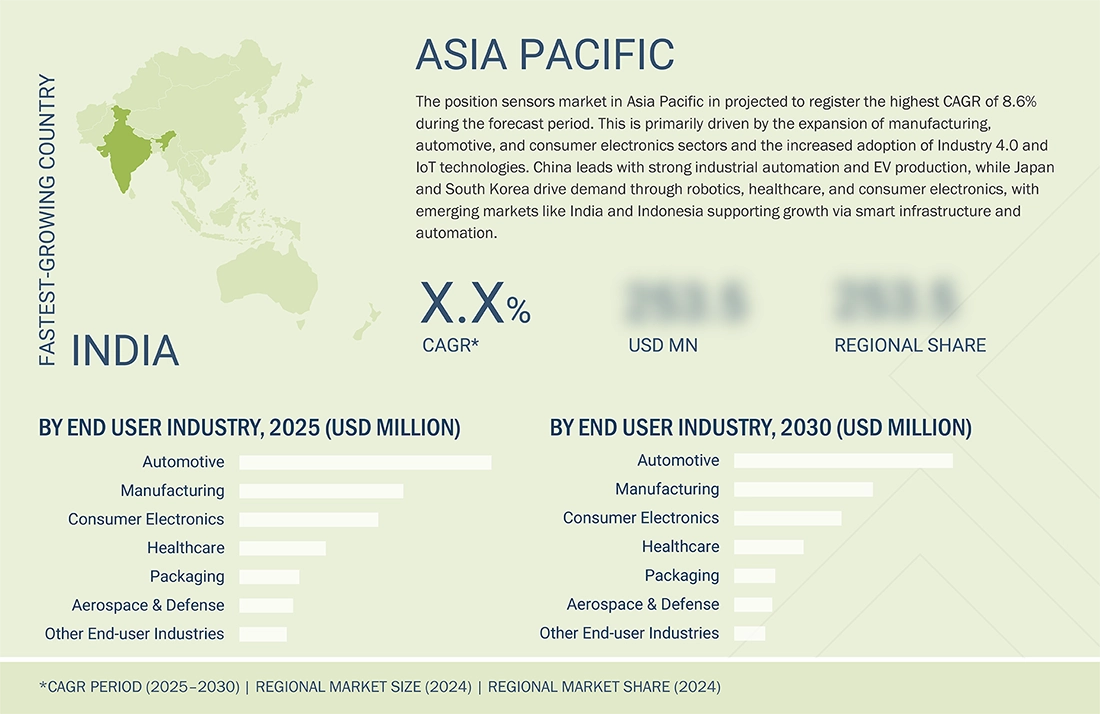
BY REGIONAsia Pacific is estimated to dominate the position sensor market with a market share of 42.5% in 2025.
-
BY TYPEThe proximity sensors segment is estimated to account for the largest market share of 35.1% in 2025.
-
BY CONTACT TYPEThe non-contact type segment holds the largest share in the position sensors market.
-
BY SIGNAL OUTPUTThe digital segment in the position sensors market holds the largest share due to its precise, reliable, and interference-resistant data, crucial for real-time monitoring and control.
-
BY TECHNOLOGYThe Ultrasonic segment is projected to grow at the highest CAGR of 10.9% during the forecast period.
-
BY CONNECTIVITYThe wired segment in the position sensors market holds the largest share due to its superior reliability, immunity to signal interference, and stable data transmission in critical applications.
-
BY APPLICATIONBy application, the machine tools segment accounted for 27.5% of the market in 2024.
-
BY END-USER INDUSTRYThe market for position sensors in the automotive industry is estimated to account for the largest market share due to rising demand for ADAS, EVs, and autonomous driving technologies.
-
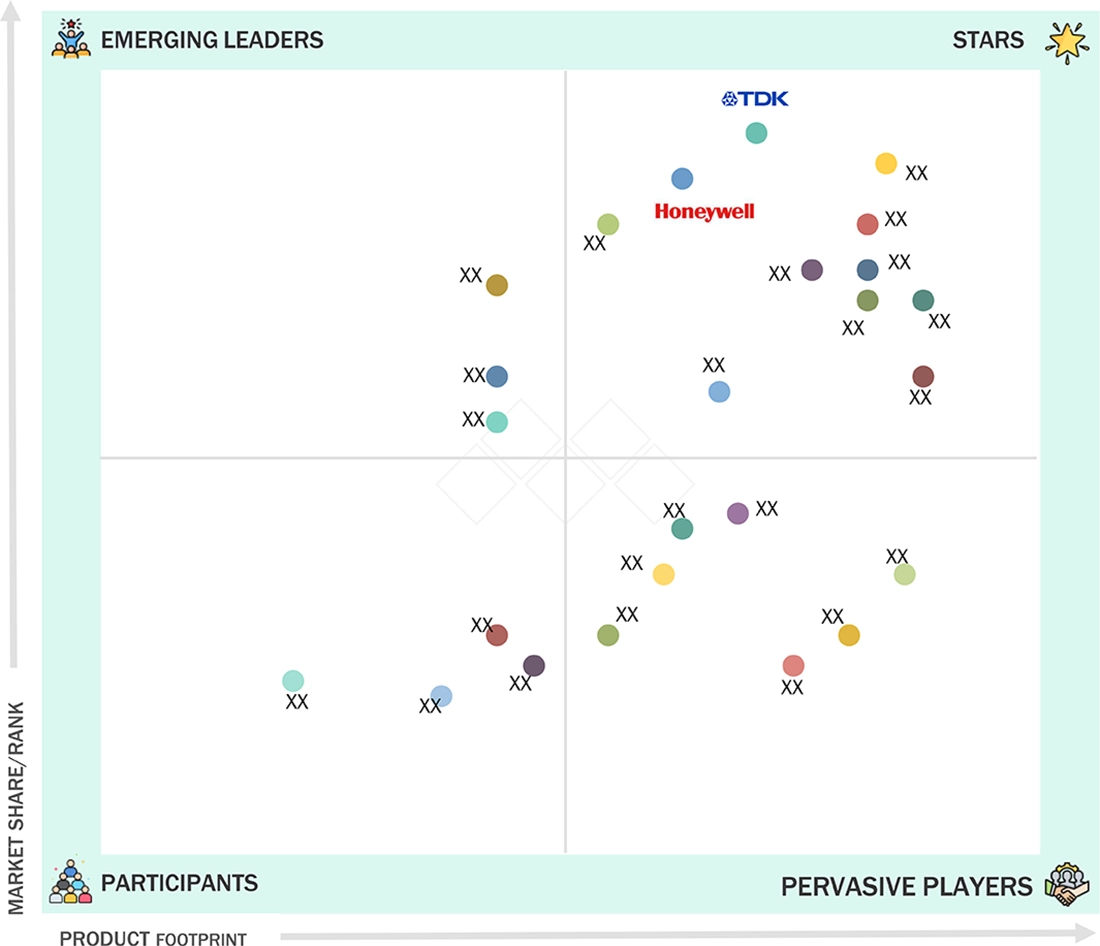
COMPETITIVE LANDSCAPE (KEY PLAYERS)Honeywell International Inc. (US), TDK Corporation (Japan), STMicroelectronics (Switzerland), Amphenol Corporation (US), SICK AG (Germany), and Sensata Technologies, Inc. (US) were identified as Star players in the position sensor market, given their strong global brand presence, extensive product portfolios, and continuous focus on innovation.
-
COMPETITIVE LANDSCAPE (STARTUPS/SMES)SONAIR (Norway), TOPOSENS (Germany), TERABEE (France), NODAR Inc. (US), and LUMOTIVE (US) have emerged as startups and SMEs driving technological innovation and market agility in the position sensor market.
The position sensors market is growing due to the increasing adoption across various end-user industries, including manufacturing, automotive, aerospace & defense, packaging, healthcare, and consumer electronics. The rising demand for automation, advancements in sensor technologies such as photoelectric sensors, and their resilience to harsh environments drive growth. Additionally, innovations in robotics, IoT, and smart systems are unlocking new opportunities, enhancing efficiency and accuracy in industrial and consumer applications.
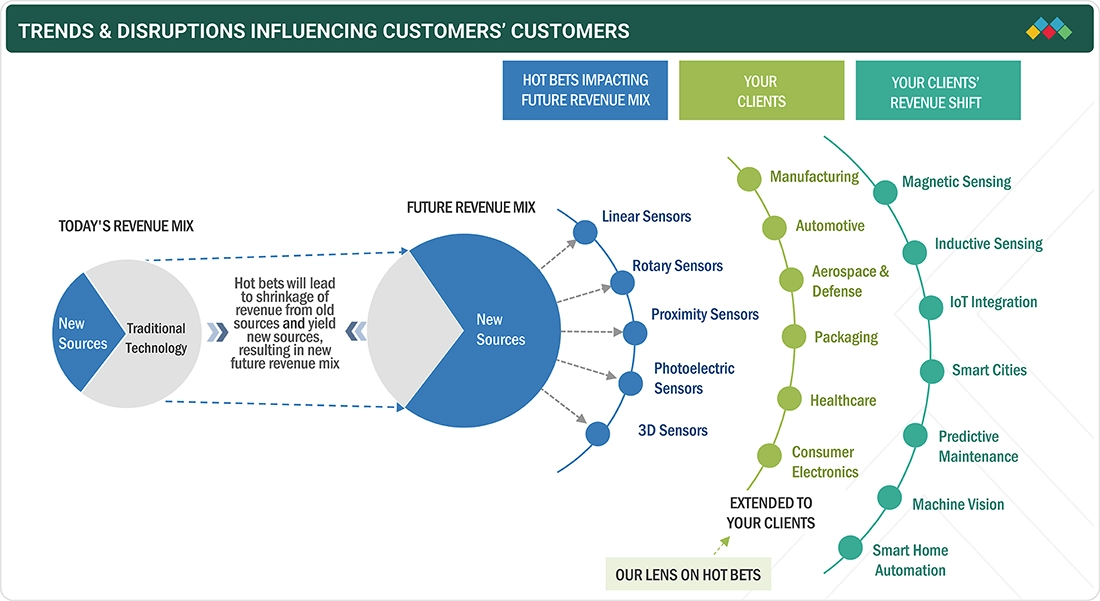
TRENDS & DISRUPTIONS IMPACTING CUSTOMERS' CUSTOMERS
In the position sensor market, emerging trends and disruptions are driving a shift from traditional technologies to new sources of revenue. Rapid advancements in linear, rotary, proximity, photoelectric, and 3D sensors are enabling applications across manufacturing, automotive, aerospace & defense, healthcare, and consumer electronics. Integration with IoT, smart cities, predictive maintenance, and machine vision is further transforming client imperatives, creating opportunities for innovation and expanded market adoption.
Source: Secondary Research, Interviews with Experts, MarketsandMarkets Analysis
MARKET DYNAMICS
Level
-
Increase in adoption of Industry 4.0 technologies

-
Rise in adoption of position sensors in automotive industry

Level
-
High cost of ownership

Level
-
Integration of position sensors into IoT devices

-
Growth in advancements in robotics and automation

Level
-
Operational limitations in range, performance, and precision of position sensors

Source: Secondary Research, Interviews with Experts, MarketsandMarkets Analysis
Driver: Increase in adoption of Industry 4.0 technologies
The adoption of Industry 4.0 technologies is a key factor driving growth in the position sensors market. Industry 4.0 emphasizes automation, data analytics, and connectivity to create intelligent factories where machines and workers collaborate to optimize production. With increasing investments and technological advancements, the adoption of Industry 4.0 technologies continues to drive the growth of the position sensors market.
Restraint: High cost of ownership
The position sensor market faces restraints due to the complexity of manufacturing and rising cost pressures. Customization adds to the difficulty, as sensors must meet specific application requirements, increasing production costs. Despite this, OEMs demand advanced sensors at lower prices, creating intense pricing pressure.
Opportunity: Integration of position sensors into IoT devices
The integration of position sensors into IoT devices is driving innovation across various applications, enhancing automation, security, and efficiency. In smart homes, position sensors play a pivotal role in automating daily functions and improving user convenience. The growth of IoT, combined with technologies such as cloud computing and artificial intelligence, further expands the potential of position sensors.
Challenge: Operational limitations in range, performance, and precision of position sensors
Position sensors are often inadequate for precise operations, which are critical in industries like robotics, medical equipment, and aerospace. Even small inaccuracies can lead to operational inefficiencies, safety concerns, and system malfunctions, particularly in environments where exact positioning is crucial.
Position Sensor Market: COMMERCIAL USE CASES ACROSS INDUSTRIES
| COMPANY | USE CASE DESCRIPTION | BENEFITS |
|---|---|---|
 |
Position sensors for aerospace flight control systems, industrial automation, and automotive throttle position monitoring | High reliability in extreme environments, precise position feedback for safety-critical applications, reduced system downtime, and enhanced operational safety |
 |
Magnetic position sensors using TMR and Hall-effect technology for automotive steering systems, EV motor control, and industrial robotics | Non-contact operation for extended lifespan, immunity to dust and vibration, high accuracy at sub-micron levels, and compact design for space-constrained applications |
 |
Integrated position sensing solutions for automotive ADAS, drone stabilization, and smart home automation systems | Low power consumption, fast response time for real-time control, integrated signal processing for reduced system complexity, and cost-effective scalability |
 |
Rugged position sensors and encoder systems for heavy machinery, construction equipment, and marine vessel control systems | Extreme durability in harsh conditions, resistance to shock and vibration, waterproof and dustproof designs, and long-term reliability reducing maintenance costs |
 |
Optical and magnetic position sensors for factory automation, packaging machinery, warehouse logistics, and AGV navigation systems | High precision positioning for automated processes, fast detection speeds for high-throughput operations, easy integration with Industry 40 systems, and predictive maintenance capabilities |
Logos and trademarks shown above are the property of their respective owners. Their use here is for informational and illustrative purposes only.
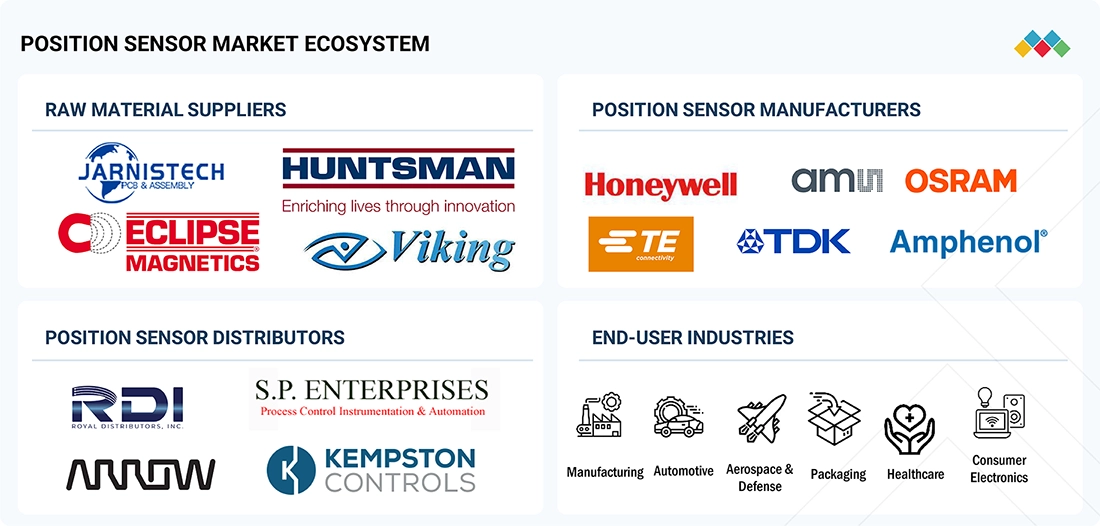
MARKET ECOSYSTEM
The position sensor ecosystem comprises research, design, and development, raw material suppliers, position sensor manufacturers, position sensor distributors, and end-user industries. The ecosystem identifies end-user sectors, such as manufacturing, automotive, aerospace & defense, packaging, healthcare, consumer electronics, and other industries. As predictive maintenance and IoT integration gain ubiquity, home automation continues to grow, and smart cities are a focus for governments worldwide.
Logos and trademarks shown above are the property of their respective owners. Their use here is for informational and illustrative purposes only.
MARKET SEGMENTS
Source: Secondary Research, Interviews with Experts, MarketsandMarkets Analysis
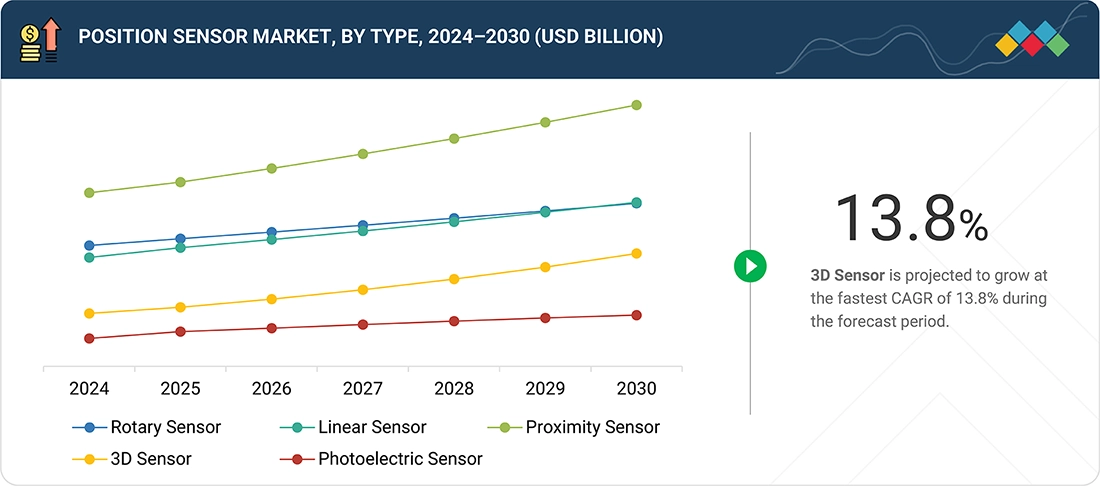
Position Sensor Market, by Type
The position sensors market, segmented by type into linear, rotary, proximity, photoelectric, and 3D sensors, plays a key role across diverse industrial and consumer applications. Proximity sensors dominate this segment due to their extensive use in industrial automation, automotive safety, and consumer electronics. Their non-contact detection and durability make them ideal for harsh environments. The rising adoption of 3D and photoelectric sensors for robotics and smart manufacturing further supports segment growth.
Position Sensor Market, by Contact Type
Position sensors are categorized as contact and non-contact types, depending on their sensing principles and interaction with the target object. The non-contact type segment dominates the market due to its long operational life, low maintenance, and suitability for demanding environments. These sensors are widely used in automotive, aerospace, and industrial automation applications. Their precision and reliability make them critical for modern robotic and motion control systems.
Position Sensor Market, by Signal Output
Based on signal output, the market is divided into analog and digital position sensors. The digital segment holds the largest share, attributed to its precision, reliability, and resistance to signal interference. Digital sensors are preferred in applications requiring real-time monitoring, control, and data accuracy. Integration with IoT, Industry 4.0, and machine learning technologies enhances their role in predictive maintenance and smart system automation.
Position Sensor Market, by Technology
The position sensors market is segmented into capacitive, inductive, optical, magnetic, ultrasonic, and piezoelectric technologies. Inductive technology dominates due to its robustness, high accuracy, and performance in harsh industrial environments. It is extensively used in automotive, manufacturing, and robotics applications for non-contact detection. The increasing adoption of automation and Industry 4.0 is further driving demand for advanced inductive and magnetic sensors.
Position Sensor Market, by Connectivity
Position sensors are classified into wired and wireless categories based on their connectivity mode. The wired segment leads the market due to its superior reliability, immunity to interference, and suitability for mission-critical operations in aerospace, healthcare, and manufacturing. However, wireless sensors are gaining traction in IoT-enabled and remote applications. As industries transition toward automation, both wired and wireless technologies cater to evolving operational needs.
Position Sensor Market, by Application
The position sensor market is segmented by application into machine tools, robotics, motion systems, material handling, test equipment, and other applications. Machine tools dominate this segment due to their vital role in precision machining, alignment, and control in CNC machines and milling systems. Increasing automation and adoption of Industry 4.0 technologies enhance productivity and accuracy in manufacturing. Position sensors also play a key role in robotics and quality control applications.
Position Sensor Market, by End-user Industry
By end user, the position sensors market is segmented into manufacturing, automotive, aerospace, packaging, healthcare, electronics, and others. The automotive industry holds the largest share, driven by the growing use of ADAS, EVs, and autonomous vehicles. Position sensors enhance vehicle safety, energy efficiency, and performance by enabling precise control of components, including throttle, steering, and braking systems. Trends in electrification and IoT connectivity further strengthen this segment’s dominance.
REGION
Asia Pacific holds the largest market share and is projected to register the fastest CAGR over the forecast period.
Asia Pacific dominates the global position sensor industry, driven by rapid industrialization, strong manufacturing growth, and increasing adoption of automation and IoT technologies. China leads the region, focusing on EV production and industrial automation, while Japan and South Korea contribute through advancements in robotics and consumer electronics. Emerging economies such as India and Indonesia are also expanding their market presence through investments in smart infrastructure and modern manufacturing. The region’s continued focus on Industry 4.0 and digital transformation supports sustained market growth.
Position Sensor Market: COMPANY EVALUATION MATRIX
In the position sensors companies, Honeywell International Inc. (US) and TDK Corporation (Japan) are star players with strong product portfolios, extensive market presence, and strategic innovations driving global adoption. Analog Devices, Inc. (US) stands as an emerging leader, leveraging its focused and advanced sensor technologies to strengthen competitiveness despite a smaller market share.
Source: Secondary Research, Interviews with Experts, MarketsandMarkets Analysis
KEY MARKET PLAYERS
MARKET SCOPE
| REPORT METRIC | DETAILS |
|---|---|
| Market Size, 2024 (Value) | USD 12.24 Billion |
| Market Forecast, 2030 (Value) | USD 19.02 Billion |
| Growth Rate | CAGR of 7.5% from 2025 to 2030 |
| Years Considered | 2021–2030 |
| Base Year | 2024 |
| Forecast Period | 2025–2030 |
| Units Considered | Value (USD Million/Billion), Volume (Million Units) |
| Report Coverage | Revenue Forecast, Company Ranking, Competitive Landscape, Growth Factors, and Trends |
| Segments Covered |
|
| Regions Covered | North America, Asia Pacific, Europe, South America, Middle East & Africa |
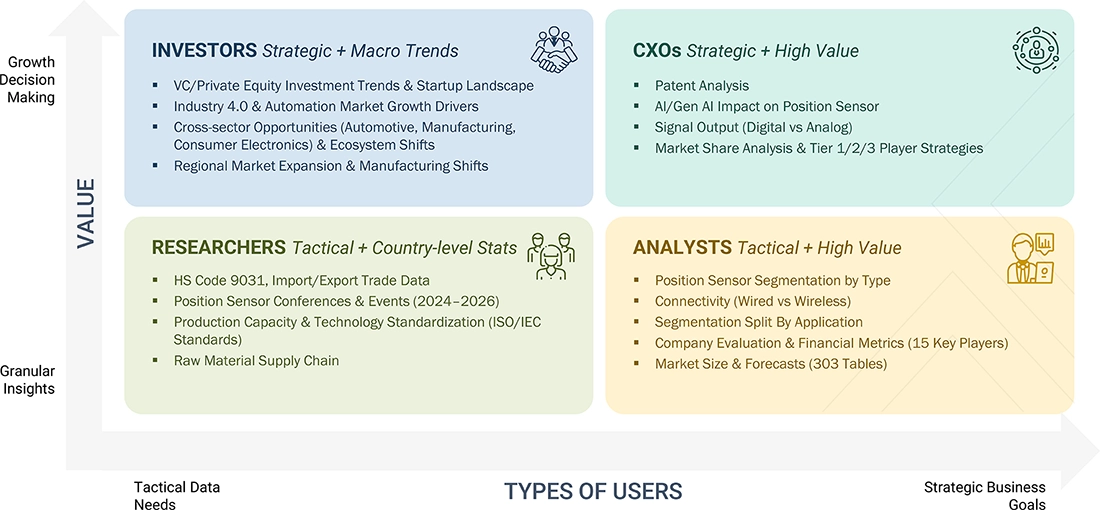
WHAT IS IN IT FOR YOU: Position Sensor Market REPORT CONTENT GUIDE
DELIVERED CUSTOMIZATIONS
We have successfully delivered the following deep-dive customizations:
| CLIENT REQUEST | CUSTOMIZATION DELIVERED | VALUE ADDS |
|---|---|---|
| Position Sensor Manufacturer |
|
|
| Industrial Automation System Integrator |
|
|
| Automotive Tier 1 Supplier |
|
|
| European Position Sensor Startup |
|
|
RECENT DEVELOPMENTS
- December 2024 : SICK AG launched the RMS2000 2D radar sensor, featuring advanced FMCW radar technology for high-resolution distance and speed measurements. Designed for harsh environments, it offers scanning ranges of up to 200 meters, a wide 120° detection field, and robust performance against rain, fog, or dust.
- December 2024 : SICK AG partnered with Aeva to expand the use of Aeva's FMCW technology in SICK's portfolio of high-accuracy, contactless sensors for industrial applications. This collaboration would enhance SICK's factory automation solutions with precise distance and motion control capabilities, offering micrometer-level accuracy across various surfaces and lighting conditions.
- November 2024 : Temposonics introduced the MH-Series FLEX Safety, a safety-rated magnetostrictive sensor offering accurate linear position measurements up to 10.5 m. Designed for critical applications, it featured a modular, field-serviceable design with SIL 2 and Performance Level d compliance.
- September 2024 : ams OSRAM launched the TMF8806, a next-generation direct Time-of-Flight (dToF) sensor module designed for precise obstacle detection and collision avoidance. With a 1 cm to 5 m detection range, ultra-low-power operation, and compact dimensions, it enables high-accuracy sensing for robotics, smart-home devices, and automation systems.
- September 2024 : TE Connectivity acquired Sense Eletrônica Ltda, a leading Brazilian manufacturer specializing in position sensors, factory automation, and process automation solutions. This acquisition enhanced TE's portfolio with advanced position, inductive, capacitive, and photoelectric sensors, as well as valve automation products, strengthening its presence in the industrial automation market.
- July 2024 : STMicroelectronics introduced the VL53L4ED, a single-zone Time-of-Flight (ToF) sensor designed for precise proximity detection and ranging in harsh environments with temperatures ranging from -40°C to 105°C. The compact module integrates a laser emitter and SPAD detector, catering to industrial tools, robotics, outdoor lighting, and security applications.
Table of Contents
 Exclusive indicates content/data unique to MarketsandMarkets and not available with any competitors.
Methodology
The study used four major activities to estimate the market size of the position sensor. Exhaustive secondary research was conducted to gather information on the market and its peer and parent markets. The next step was to validate these findings, assumptions, and sizing with industry experts across the value chain through primary research. Both top-down and bottom-up approaches were employed to estimate the total market size. Finally, market breakdown and data triangulation methods were utilized to estimate the market size for different segments and subsegments.
Secondary Research
The research methodology used to estimate and forecast the size of the position sensor market began with the acquisition of data related to the revenues of key vendors in the market through secondary research. Various secondary sources have been referred to in the secondary research process to identify and collect information for this study. Secondary sources include annual reports, press releases, and investor presentations of companies; white papers, journals, certified publications, and articles by recognized authors; websites; directories; and databases. Secondary research has mainly been used to obtain key information about the value chain of the position sensor market, key players, market classification, and segmentation according to the industry trends to the bottom-most level, geographic markets, and key developments from both market and technology-oriented perspectives. Secondary data has been collected and analyzed to determine the overall market size, further validated through primary research. The secondary research referred to for this research study involves the MDPI, Elsevier B.V., IEEE, WTWH Media LLC, and various other sources. Moreover, the study involved extensive use of secondary sources, directories, and databases, such as Hoovers, Bloomberg Businessweek, Factiva, and OneSource, to identify and collect valuable information for a technical, market-oriented, and commercial study of the position sensor market. Vendor offerings have been taken into consideration to determine market segmentation.
Primary Research
In the primary research, various primary sources from both the supply and demand sides have been interviewed to obtain the qualitative and quantitative information relevant to this report. Primary sources from the supply side include the key industry participants, subject-matter experts (SMEs), and C-level executives and consultants from various key companies and organizations in the position sensor ecosystem. After the complete market engineering (including calculations for the market statistics, the market breakdown, the market size estimations, the market forecasting, and the data triangulation), extensive primary research has been conducted to verify and validate the critical market numbers obtained. Extensive qualitative and quantitative analyses have been performed during the market engineering process to list key information/insights throughout the report. Extensive primary research has been conducted after understanding the position sensor market scenario through secondary research. Several primary interviews have been conducted with market experts from the demand and supply-side players across key regions: North America, Europe, Asia Pacific, and the Rest of the World (Middle East, Africa, and South America). Various primary sources from the supply and demand sides of the market have been interviewed to obtain qualitative and quantitative information. Following is the breakdown of the primary respondents.
Primary data has been collected through questionnaires, emails, and telephonic interviews. In the canvassing of primaries, various departments within organizations, such as sales, operations, and administration, were covered to provide a holistic viewpoint in our report. After interacting with industry experts, brief sessions were conducted with highly experienced independent consultants to reinforce the findings from our primaries. This and the in-house subject matter experts’ opinions have led us to the findings described in the remainder of this report.

Note: The three tiers of the companies are defined based on their total revenue in 2023: Tier 1 - revenue greater than or equal to USD 1 billion; Tier 2 - revenue between USD 100 million and USD 1 billion; and Tier 3 revenue less than or equal to USD 100 million. Other designations include sales managers, marketing managers, and product managers.
To know about the assumptions considered for the study, download the pdf brochure
Market Size Estimation
To estimate and validate the size of the position sensor market and its submarkets, both top-down and bottom-up approaches were utilized. Secondary research was conducted to identify the key players in the market, and primary and secondary research was used to determine their market share in specific regions. The entire process involved studying top players' annual and financial reports and conducting extensive interviews with industry leaders such as CEOs, VPs, directors, and marketing executives. Secondary sources were used to determine all percentage shares and breakdowns, which were verified through primary sources. All parameters that could impact the markets covered in this research study were accounted for, analyzed in detail, verified through primary research, and consolidated to obtain the final quantitative and qualitative data.
Position Sensor Market : Top-Down and Bottom-Up Approach

Data Triangulation
Once the overall size of the position sensor market was determined using the methods described above, it was divided into multiple segments and subsegments. Market engineering was performed for each segment and subsegment using market breakdown and data triangulation methods, as applicable, to obtain accurate statistics. To triangulate the data, various factors and trends from the demand and supply sides were studied. The market was validated using both top-down and bottom-up approaches.
Market Definition
Position sensors are the devices intended for the position or motion measurement of an object with variable parameters, which change a physical displacement into electrical signals. They play essential roles in automation processes. Position sensors can be mainly categorized in Linear sensors, Rotary sensors, Proximity sensors, Photoelectric sensors, and Advanced 3D sensors based on the requirements of the application.
These sensors are suitable for machine tools, robotics, motion systems, material handling systems, different types of test & instrumentation equipment, and some other specific applications. Manufacturing, automotive, aerospace & defense, packaging, healthcare, and electronics industries depend on position sensors to improve performance, safety, and precision. The constant need for improved automation and advanced technology remains the key factor for the growth of the position sensor market across the world.
Key Stakeholders
- Raw Material Providers
- OEMs (Original Equipment Manufacturers)
- System Integrators
- Distributors and Retailers
- Research Institutions and Organizations
- Service Providers
- End-user Industries
Report Objectives
- To estimate and forecast the size of the position sensor market, in terms of value, based on type, contact type, signal output, technology, connectivity, application, end-user industry, and region
- To identify market opportunities across manufacturing, automotive, aerospace, packaging, healthcare, consumer electronics, and other end-user industries
- To analyze different position sensor types and their adoption across various end-user industries
- To describe and forecast the market size, in terms of value, for four major regions-North America, Europe, Asia Pacific, and the Rest of the World (RoW)
- To provide detailed information regarding major factors such as drivers, restraints, opportunities, and challenges influencing the market growth
- To provide a detailed overview of the position sensor value chain
- To strategically analyze micromarkets regarding individual market trends, growth prospects, and contributions to the total market
- To strategically profile key players and comprehensively analyze their market position in terms of ranking and core competencies, along with a detailed competitive landscape for the market leaders
- To analyze major growth strategies such as product launches/developments and acquisitions adopted by the key market players to enhance their market position
- To analyze the impact of the macroeconomic factors impacting the position sensor market
Available Customizations
With the given market data, MarketsandMarkets offers customizations according to the specific requirements of companies. The following customization options are available for the report:
- Detailed analysis and profiling of additional market players (up to 5)
- Additional country-level analysis of the position sensor market
Product Analysis
- Product matrix, which provides a detailed comparison of the product portfolio of each company in the position sensor market.
Key Questions Addressed by the Report
Need a Tailored Report?
Customize this report to your needs
Get 10% FREE Customization
Customize This ReportPersonalize This Research
- Triangulate with your Own Data
- Get Data as per your Format and Definition
- Gain a Deeper Dive on a Specific Application, Geography, Customer or Competitor
- Any level of Personalization
Let Us Help You
- What are the Known and Unknown Adjacencies Impacting the Position Sensor Market
- What will your New Revenue Sources be?
- Who will be your Top Customer; what will make them switch?
- Defend your Market Share or Win Competitors
- Get a Scorecard for Target Partners

Custom Market Research Services
We Will Customise The Research For You, In Case The Report Listed Above Does Not Meet With Your Requirements
Get 10% Free CustomisationGrowth opportunities and latent adjacency in Position Sensor Market


Corinna
Mar, 2017
Dear Sir or Madam, if it is possible to send executive summary of position sensor market, however we are interested in Analyze the Japanese MPS market? Our interest in detail as -->market forecast of Motor Position Sensors with Steering application -->breakdown into different sensor Technologies -->explanation of choice of Technology -->competitors, customers and future Trends. .