Pea Protein Market

Report Code FB 2741
Published in Feb, 2024, By MarketsandMarkets™
Download PDF

Choose License Type

Buy Report Now Inquire Before Buying

Pea Protein Market by Type (Isolates, Concentrates and Textured), Application (Food, Beverages), Form (Dry, Wet), Source (Chickpeas, Yellow Split Peas, Lentils), Processing Method (Dry, Wet) and Region - Global Forecast to 2029

Overview

The pea protein market is estimated at USD 2.1 billion in 2024 and is projected to reach USD 3.7 billion by 2029, at a CAGR of 12.0% from 2024 to 2029. As consumer priorities shift towards health and wellness, pea protein gains traction due to its association with various health benefits such as muscle building, weight management, and satiety support. This alignment with prevailing health trends drives demand among individuals seeking nutritious and functional food options. Pea protein's natural origin and minimal processing address consumers' preference for clean label products. Its incorporation in food formulations enables manufacturers to meet the demand for transparent ingredient lists, fostering trust and loyalty among discerning consumers. The allergen-free nature of pea protein, devoid of common allergens like soy and dairy, makes it suitable for individuals with dietary restrictions or allergies. Its plant-based origin also aligns with the growing vegan and vegetarian lifestyle trends, further boosting its adoption in plant-based food and beverage products. In addition, the rising awareness of environmental sustainability prompts consumers to seek alternative protein sources with lower environmental footprints. Pea protein production's minimal resource requirements and reduced greenhouse gas emissions compared to animal-based proteins position it as an eco-conscious choice that resonates with environmentally aware consumers.

Attractive Opportunities in the Pea Protein Market

EUROPE

The market growth in Europe can be attributed to the rising population, rising income, increasing urbanization, and rising awareness for heathy diets in the region.

The rise in demand for fortified and functional foods among consumers has driven the demand for targeted delivery of functional ingredients. Hence, manufacturers have adopted the technology at high rates.

The growing vegan population and popularity of plant-based products are driving the demand for pea protein. The growing consumer awareness about nutritional benefits offered by pea and pea-based products is the other factor driving demand.

The market growth in Europe can be attributed to the rising demand for plant-based nutritional supplements in the region.

Expansions, joint ventures, and product launches would offer lucrative opportunities for market players over the next few years.

Global Pea Protein Market Dynamics

DRIVERS: Growing consumer awareness about nutritional benefits offered by pea and pea-based products

In 2020, there was a significant rise in the popularity of plant-based foods globally, with various new products hitting the market, ranging from bakery items and pastries to pizza, lattes, and vegan burgers. By the end of the year, McDonald's joined the trend by introducing their McPlant menu. Additionally, the COVID-19 pandemic prompted two global lockdowns, leading people to reevaluate their priorities, focusing more on health and wellbeing. This shift resulted in a surge in plant-based food sales, increasing by 243%, with a notable 14% rise in the preference for meat-free and dairy-free options among consumers, as reported by New Food Magazine.Pea protein powder has emerged as a popular ingredient for protein shakes, smoothies, and energy drinks due to its ability to enhance protein content. It is suitable for various dietary preferences as it is naturally vegan and hypoallergenic. Pea protein is rich in iron and high-quality protein, and it is believed to promote muscle growth, aid in weight loss, and support heart health. Studies indicate that protein derived from peas, particularly yellow peas, can help lower cholesterol and blood pressure without putting strain on the kidneys. These health benefits are anticipated to propel the growth of the global pea protein market.

RESTRAINTS: High cost of raw material

According to the October 2021 report by Roquette Frères, there has been a noticeable increase in global pea prices. The company, which launched a pea protein factory in Canada in 2020 and supplies to a prominent plant-based meat brand, "Beyond Meat," cautioned its customers about an imminent price surge. This warning came as the company observed a significant impact on supply from various fronts. Canada, a major pea-producing nation globally, experienced a sharp 45% decline in its production. Pea prices have surged by 120% compared to 2020 levels, following an unprecedented drought in Canada, described as the most severe in over a century.Pea production in Europe, particularly in France, another significant pea-producing economy, also suffered as crops were severely damaged during harvest due to the wet season. Despite the growing global demand for peas driven by the introduction of numerous new plant-based food products, the sector is grappling with the repercussions of a pea shortage. The substantial price hikes are expected to result in increased costs for customers as companies look to offset rising expenses. Consequently, the market faces constraints on growth due to the unstable supply of raw materials and escalating prices.


OPPORTUNITIES: Increasing focus on innovation and developments of better pea protein extracts & products in global markets

With evolving lifestyles and growing consumer demand for diverse options, the pea protein sector is experiencing a surge in innovation. Currently, pea protein serves as a primary ingredient in numerous plant-based meat products, including energy bars and snacks. Food technology companies are diligently refining this ingredient at every stage of production to cater to plant-based meat manufacturers, ranging from optimizing pea cultivation in the field to refining protein extraction technology.Many consumers prioritize maximum protein content when selecting products, prompting companies to strive for higher protein extraction rates from raw materials to incorporate into their end products. In October 2021, Benson Hill, a company based in Missouri, launched a new yellow pea breeding and commercialization program aimed at developing plants that yield superior peas. Their focus lies on enhancing two critical attributes: nutritional density and flavor. The cultivation of more protein-rich yellow pea plants could also lead to greater efficiency in land use in farming practices. Benson Hill leverages a machine learning and AI-powered platform to guide its efforts in crop improvement.On 2022, merit Functional Foods (Canada) opened a 94,000 square foot plant to process pea and canola protein. The company uses a proprietary manufacturing process that is more expensive than the industry standard. The process requires more equipment and more filtration but results in a higher-purity product with improved taste and texture. According to StartUs Insights (an AI-powered data platform), in September 2021, 149 new startups were identified in the pea protein sector, with the top five being Sunfed Food (New Zealand) (makes meat alternatives), Mighty Pea (UK) (formulates vegan milk), Elevate Nutrition (US) (offers sports nutrition), YoFiit (Canada) (offers plant-based nutrition bars), and PeaTos (US) (produces pea-based snacks). Thus, with a greater number of startups rising in the sector, significant research is being taken up to develop newer attractive products in the market.

CHALLENGES: Supply constraints due to unstable production of peas hampering growth prospects

Pea protein manufacturers are confronted with a significant challenge: a shortage in supply. Climate change is already impacting agriculture, with consequences varying across regions. Rising temperatures have begun to diminish the yields of essential crops. Reduced production, compounded by import delays due to COVID-19, has resulted in escalated pea prices. According to an article by IndiaToday, the cost of pulses, which serve as one of the most affordable protein sources, has surged by over 15% since the previous year.The USDA forecasts a 3% decline in the area seeded to dry peas in the US for 2021-22 compared to 2020, dropping to below 1.0 million acres, primarily driven by decreased seeding in North Dakota. Yields are anticipated to be below average. The USDA further projects a 44% decrease in US dry pea production to slightly over 0.5 million metric tons. Consequently, this decrease in production leads to fluctuations in prices and market uncertainty, posing significant challenges for both manufacturers and consumers in the global pea protein market.

Global Pea Protein Market Ecosystem Analysis

Based on the form, dry is estimated to account for the largest market share of the pea protein market. Dry pea protein's powdered form streamlines formulation processes, ensuring precise measurement and consistent distribution throughout food and beverage products. This consistency in formulation maintains product quality, meeting consumer expectations for reliable and enjoyable products. Additionally, the reduced moisture content of dry pea protein translates to lighter weight and reduced volume, lowering transportation costs for both manufacturers and consumers. This cost-saving benefit contributes to the widespread adoption of dry pea protein across various markets. The longer shelf life of dry pea protein minimizes the risk of spoilage and reduces food waste. This extended shelf life enhances product stability, ensuring prolonged availability to consumers and driving further demand for dry pea protein.


Based on source, yellow split peas is anticipated to have the highest growth rate in the pea protein market.

Yellow split peas serve as a significant driver in the pea protein market for several reasons. Their abundant protein content makes them an ideal source for pea protein extraction, enhancing the nutritional value of pea protein products. This appeals to consumers seeking protein-rich foods, especially within plant-based diets. The versatility of yellow split peas in food applications extends from soups and salads to baked goods, facilitating the creation of a diverse range of pea protein-based foods. This flexibility allows manufacturers to cater to various consumer preferences, including plant-based meats, dairy alternatives, snacks, and supplements.Furthermore, yellow split peas are a sustainable crop choice, requiring fewer resources such as water and land compared to animal-based protein sources. Their ability to fix nitrogen in the soil reduces the need for synthetic fertilizers, aligning with consumer preferences for eco-friendly and ethically sourced products. The rising popularity of plant-based diets, driven by concerns for health, animal welfare, and environmental sustainability, fuels the demand for pea protein derived from yellow split peas. As more individuals adopt vegetarian, vegan, or flexitarian lifestyles, the demand for plant-based protein sources like pea protein continues to grow, positioning yellow split peas as a key driver in the pea protein market.

Based on source, yellow split peas is anticipated to have the highest growth rate in the pea protein market.

Yellow split peas serve as a significant driver in the pea protein market for several reasons. Their abundant protein content makes them an ideal source for pea protein extraction, enhancing the nutritional value of pea protein products. This appeals to consumers seeking protein-rich foods, especially within plant-based diets. The versatility of yellow split peas in food applications extends from soups and salads to baked goods, facilitating the creation of a diverse range of pea protein-based foods. This flexibility allows manufacturers to cater to various consumer preferences, including plant-based meats, dairy alternatives, snacks, and supplements.

Furthermore, yellow split peas are a sustainable crop choice, requiring fewer resources such as water and land compared to animal-based protein sources. Their ability to fix nitrogen in the soil reduces the need for synthetic fertilizers, aligning with consumer preferences for eco-friendly and ethically sourced products. The rising popularity of plant-based diets, driven by concerns for health, animal welfare, and environmental sustainability, fuels the demand for pea protein derived from yellow split peas. As more individuals adopt vegetarian, vegan, or flexitarian lifestyles, the demand for plant-based protein sources like pea protein continues to grow, positioning yellow split peas as a key driver in the pea protein market.


Europe Region Holds the Largest Share of the Pea Protein Market

The Europe region is witnessing a burgeoning wave of growth in the pea protein market as food & beverage industries across the continent embrace the multifunctional applications of this plant based compound. European region's active participation in global trade further amplifies the accessibility of pea protein. The ease of trade facilitates the flow of these versatile compounds across borders, supporting the region's industries with a diverse range of applications.


Recent Developments of Pea Protein Market industry

  • In June 2020, Roquette Frères has joined a collaborative R&D initiative to promote Canada's plant protein ecosystem, identify solutions to development issues in cold Prairie conditions, and develop novel pea and fava bean products. The total investment by these three companies was USD 19.2 million. This collaboration will address the present pea processing issue and will help to implant new technology in pea protein processing.
  • In November 2022, Ingredion Incorporated has entered an exclusive commercial distribution partnership with InnovoPro, a prominent chickpea solutions company. This partnership, effective immediately, focuses on distributing chickpea protein concentrate in the US and Canada. The aim is to enhance the availability of chickpea protein, aiding food and beverage manufacturers in meeting the rising consumer demand for sustainable, nutritious, and appealing plant-based products.

Key Market Players

KEY PLAYERS IN THE Pea Protein Market INCLUDE

Want to explore hidden markets that can drive new revenue in Pea Protein Market?

Scope of the Report

Report Attribute Details
Market size estimation 2024–2029
Base year considered 2023
Forecast period considered 2024–2029
Units considered Value (USD Million), Volume (TONS)
Segments Covered By Type, By Application, By Form, By Source, By Processing Method and By Region
Regions covered North America, Europe, Asia Pacific, and Rest of the World
Companies studied Roquette Frères (France) Cargill, Incorporated (US) Glanbia PLC (Ireland) Kerry (Ireland) Ingredion Incorporated (US) Emsland Group (Germany) Yantai Shuangta Foods Co, Ltd (China) The Scoular Company (US) Burcan Nutrascience Corp (Canada) Shandong Jianyuan Group (China) ET-Chem (China) AGT Foods and Ingredients (Canada) The Green Labs LLC (US) Axiom Foods INC (US)


Key Questions Addressed by the Report

Which region is projected to account for the largest share of the pea protein market?
The Europe region accounted for the largest share in terms of value at USD 0.8 billion in 2024 and is expected to grow at a CAGR of 11.7% during the forecast period.
What is the current size of the global pea protein market?
The pea protein market is estimated at USD 2.1 billion in 2024 and is projected to reach USD 3.7 billion by 2029, at a CAGR of 12.0% from 2024 to 2029.
Which are the major key players in the pea protein market?
Roquette Frères (France), Cargill, Incorporated (US), Glanbia PLC (Ireland), Kerry (Ireland), Ingredion Incorporated (US), Emsland Group (Germany), Yantai Shuangta Foods Co, Ltd (China), The Scoular Company (US), Burcan Nutrascience Corp (Canada), Shandong Jianyuan Group (China), ET-Chem (China), AGT Foods and Ingredients (Canada), The Green Labs LLC (US) and Axiom Foods Inc (US).
What are the factors driving the pea protein market?
  • Nutritional Value: Pea protein boasts high protein content, ideal for health-conscious consumers seeking nutrient-rich alternatives.
  • Allergen-Free: Its absence of soy, dairy, and gluten caters to individuals with dietary restrictions, ensuring broader accessibility and appeal in the market.
  • Sustainability: Pea protein's cultivation requires fewer resources and emits fewer greenhouse gases than animal-based proteins, making it an environmentally friendly choice.
  • Versatility: With its neutral flavor and functional properties, pea protein seamlessly integrates into various food and beverage applications, enhancing product innovation and consumer choice.
  • Plant-Based Trend: As plant-based diets gain traction, pea protein emerges as a favored option, aligning with the growing consumer preference for sustainable and ethical food choices.
Which segment by source accounted for the largest pea protein market share?
By source, the yellow split pea segment dominated the market for pea protein and was valued the largest at USD 1.1 billion in 2024. .


Personalize This Research

  • Triangulate with your Own Data
  • Get Data as per your Format and Definition
  • Gain a Deeper Dive on a Specific Application, Geography, Customer or Competitor
  • Any level of Personalization
Request A Free Customisation

Let Us Help You

  • What are the Known and Unknown Adjacencies Impacting the Pea Protein Market
  • What will your New Revenue Sources be?
  • Who will be your Top Customer; what will make them switch?
  • Defend your Market Share or Win Competitors
  • Get a Scorecard for Target Partners
Customized Workshop Request

Table of Contents

Exclusive indicates content/data unique to MarketsandMarkets and not available with any competitors.

TITLE
PAGE NO
INTRODUCTION
26
RESEARCH METHODOLOGY
32
EXECUTIVE SUMMARY
46
PREMIUM INSIGHTS
52
MARKET OVERVIEW
56
  • 5.1 INTRODUCTION
  • 5.2 MACROECONOMIC INDICATOR
    GLOBAL PRODUCTION OF AND INNOVATION IN PEA CROPS
  • 5.3 MARKET DYNAMICS
    DRIVERS
    - Growing vegan population and popularity of plant-based products
    - Advancements in extraction and processing technologies
    - Growing consumer awareness about nutritional benefits offered by pea and pea-based products
    - Increase in demand for gluten-free food products
    RESTRAINTS
    - High cost of raw material
    - Low processing output, resulting in limited supply to manufacturers
    OPPORTUNITIES
    - Increasing focus on innovation in global market
    - Hypoallergenic properties compared to other plant-based proteins
    - Advancements in texture properties that support adoption in baking and meat processing
    - Rise in demand from pet food industry
    CHALLENGES
    - Supply constraints due to unstable production of peas
    - Presence of alternative plant proteins
INDUSTRY TRENDS
66
  • 6.1 INTRODUCTION
  • 6.2 SUPPLY CHAIN ANALYSIS
  • 6.3 VALUE CHAIN ANALYSIS
  • 6.4 PATENT ANALYSIS
  • 6.5 REGULATORY LANDSCAPE
    REGULATORY LANDSCAPE
    - North America
    - Europe
    - Asia Pacific
    - South America
    REGULATORY BODIES, GOVERNMENT AGENCIES, & OTHER ORGANIZATIONS
  • 6.6 ECOSYSTEM MAP
  • 6.7 TRENDS/DISRUPTIONS IMPACTING CUSTOMER BUSINESS
  • 6.8 TECHNOLOGY ANALYSIS
    FERMENTATION
    IOT (INTERNET OF THINGS) TECHNOLOGY
  • 6.9 PORTER'S FIVE FORCES ANALYSIS
    INTENSITY OF COMPETITIVE RIVALRY
    BARGAINING POWER OF SUPPLIERS
    BARGAINING POWER OF BUYERS
    THREAT OF SUBSTITUTES
    THREAT OF NEW ENTRANTS
  • 6.10 TRADE DATA ANALYSIS
  • 6.11 PRICING ANALYSIS
    INTRODUCTION
    AVERAGE SELLING PRICE TREND OF KEY PLAYERS, BY TYPE
    AVERAGE SELLING PRICE TREND, BY REGION
    AVERAGE SELLING PRICE TREND, BY TYPE
  • 6.12 CASE STUDY ANALYSIS: PEA PROTEIN MARKET
  • 6.13 KEY STAKEHOLDERS AND BUYING CRITERIA
    KEY STAKEHOLDERS IN BUYING PROCESS
    BUYING CRITERIA
  • 6.14 KEY CONFERENCES & EVENTS IN 2024
  • 6.15 INVESTMENT AND FUNDING SCENARIO
PEA PROTEIN MARKET, BY TYPE
92
  • 7.1 INTRODUCTION
  • 7.2 ISOLATES
    GROWING INNOVATION FOR HIGH-QUALITY PROTEIN ISOLATES TO DRIVE SEGMENT
  • 7.3 CONCENTRATES
    WIDE APPLICATION IN SNACKS AND BAKERY ITEMS TO BOOST DEMAND
  • 7.4 TEXTURED
    NUTRITIONAL BENEFITS AND FUNCTIONAL ATTRIBUTES TO DRIVE DEMAND
PEA PROTEIN MARKET, BY SOURCE
101
  • 8.1 INTRODUCTION
  • 8.2 YELLOW SPLIT PEAS
    HIGH PRODUCTION RATE AND PROTEIN CONTENT TO BOOST DEMAND
  • 8.3 CHICKPEAS
    IMPROVEMENTS IN PROCESSING TECHNOLOGY TO DRIVE GROWTH
  • 8.4 LENTILS
    HIGH PRODUCTION, EASY AVAILABILITY, AND LOW COSTS TO DRIVE GLOBAL DEMAND
PEA PROTEIN MARKET, BY FORM
110
  • 9.1 INTRODUCTION
  • 9.2 DRY
    DEMAND FOR PLANT-BASED MEATS AND SNACKS TO SUPPLEMENT SEGMENT GROWTH
  • 9.3 WET
    PERFORMANCE NUTRITION APPLICATIONS TO SUPPORT GROWTH
PEA PROTEIN MARKET, BY PROCESSING METHOD
115
  • 10.1 DRY PROCESSING
    INNOVATION IN DIVERSE FOOD SECTORS – KEY DRIVER
  • 10.2 WET PROCESSING
    SUPERIOR FUNCTIONALITY AND PURITY – KEY DRIVERS
PEA PROTEIN MARKET, BY APPLICATION
116
  • 11.1 INTRODUCTION
  • 11.2 FOOD
    MEAT SUBSTITUTES
    - Global trends of plant-based meats and veganism drive segment
    PERFORMANCE NUTRITION
    - Increasing cases of lactose intolerance and adoption in supplements to drive adoption
    FUNCTIONAL FOODS
    - Growing awareness about functional benefits of pea protein supports growth
    SNACKS
    - Spike in demand for healthy snacking alternatives to drive demand
    BAKERY PRODUCTS
    - Demand for healthy alternatives in baking applications
    CONFECTIONERIES
    - Consumer demand for healthier confectionery products to drive segment
    OTHER FOOD APPLICATIONS
  • 11.3 BEVERAGES
    EASY SOLUBILITY AND ADOPTION IN PLANT-BASED BEVERAGES TO SUPPORT GROWTH
  • 11.4 OTHER APPLICATIONS
    BENEFITS OF PEA PROTEINS IN ANIMAL HEALTH AND WELL-BEING TO DRIVE DEMAND
PEA PROTEIN MARKET, REGION
132
  • 12.1 INTRODUCTION
  • 12.2 NORTH AMERICA
    NORTH AMERICA: RECESSION IMPACT ANALYSIS
    US
    - Rise of veganism and rising concerns about food sustainability to drive pea protein demand
    CANADA
    - Rapid growth and expansion in market driven by high production volumes of dry pea
    MEXICO
    - Changing consumer preferences and plant-based food trend to boost market
  • 12.3 EUROPE
    EUROPE: RECESSION IMPACT ANALYSIS
    FRANCE
    - Rise in consumption of functional foods and strong production capacities to drive market
    DENMARK
    - Investments and production facilities to contribute to market growth in Denmark
    GERMANY
    - Increasing veganism trend to drive demand for pea proteins
    UK
    - Focus on consumption of plant-based food alternatives to propel market growth
    SPAIN
    - Strong agricultural output and changing consumer preferences to drive market
    THE NETHERLANDS
    - Government support and rising health issues among consumers to drive growth
    ITALY
    - Strong competition from conventional protein sources to drive demand for pea protein
    FINLAND
    - Increasing manufacturer presence to drive market
    REST OF EUROPE
  • 12.4 ASIA PACIFIC
    ASIA PACIFIC: RECESSION IMPACT ANALYSIS
    CHINA
    - Rise in demand for meat protein substitutes to fuel market
    INDIA
    - Growth of startups in plant-based food products segment to boost demand
    JAPAN
    - Increasing vegan culture makes country lucrative market for pea protein
    AUSTRALIA & NEW ZEALAND
    - Rising environmental concerns fuel market growth
    REST OF ASIA PACIFIC
  • 12.5 SOUTH AMERICA
    SOUTH AMERICA: RECESSION IMPACT ANALYSIS
    BRAZIL
    - High demand for sports nutrition to boost market growth
    ARGENTINA
    - Increasing exports due to high quality of peas to boost market
    REST OF SOUTH AMERICA
    - Increasing consumer preference for plant-based food for fitness and nutrition
  • 12.6 REST OF THE WORLD
    ROW: RECESSION IMPACT ANALYSIS
    MIDDLE EAST
    - Increasing sports activities to propel market growth
    - UAE
    - Saudi Arabia
    - Rest of Middle East
    AFRICA
    - Easy availability of raw materials to boost market
    - South Africa
    - Nigeria
    - Rest of Africa
COMPETITIVE LANDSCAPE
200
  • 13.1 OVERVIEW
  • 13.2 KEY PLAYERS STRATEGIES
  • 13.3 SEGMENTAL REVENUE ANALYSIS
  • 13.4 MARKET SHARE ANALYSIS, 2023
  • 13.5 BRAND/PRODUCT COMPARISON
  • 13.6 COMPANY VALUATION
  • 13.7 KEY PLAYERS: ANNUAL REVENUE VS. GROWTH
  • 13.8 FINANCIAL METRICS
  • 13.9 GLOBAL SNAPSHOT OF KEY MARKET PARTICIPANTS
  • 13.10 COMPANY EVALUATION MATRIX: KEY PLAYERS, 2023
    STARS
    EMERGING LEADERS
    PERVASIVE PLAYERS
    PARTICIPANTS
    COMPANY FOOTPRINT: KEY PLAYERS
    - Type footprint
    - Application footprint
    - Region footprint
    - Company footprint
  • 13.11 COMPANY EVALUATION MATRIX: STARTUPS/SMES, 2023
    PROGRESSIVE COMPANIES
    RESPONSIVE COMPANIES
    DYNAMIC COMPANIES
    STARTING BLOCKS
    COMPETITIVE BENCHMARKING: STARTUPS/SMES, 2023
  • 13.12 COMPETITIVE SCENARIO AND TRENDS
    PRODUCT LAUNCHES
    DEALS
    EXPANSIONS
COMPANY PROFILES
225
  • 14.1 KEY PLAYERS
    ROQUETTE FRÈRES
    - Business overview
    - Products/solutions/services offered
    - Recent developments
    - MnM view
    ADM
    - Business overview
    - Products/solutions/services offered
    - Recent developments
    - MnM view
    INGREDION
    - Business overview
    - Products/solutions/services offered
    - Recent developments
    - MnM view
    KERRY GROUP PLC.
    - Business overview
    - Products/solutions/services offered
    - Recent developments
    - MnM view
    GLANBIA PLC
    - Business overview
    - Products/solutions/services offered
    - Recent developments
    - MnM view
    CARGILL, INCORPORATED
    - Business overview
    - Products/solutions/services offered
    - Recent developments
    INTERNATIONAL FLAVORS & FRAGRANCES INC.
    - Business overview
    - Products/solutions/services offered
    - Recent developments
    PURIS
    - Business overview
    - Products/solutions/services offered
    - Recent developments
    EMSLAND GROUP
    - Business overview
    - Products/solutions/services offered
    - Recent developments
    YANTAI SHUANGTA FOODS CO., LTD.
    - Business overview
    - Products/solutions/services offered
    BURCON
    - Business overview
    - Products/solutions/services offered
    - Recent developments
    AXIOM FOODS INC.
    - Business overview
    - Products/solutions/services offered
    - Recent developments
    SHANDONG JIANYUAN GROUP
    - Business overview
    - Products/solutions/services offered
    ET-CHEM
    - Business overview
    - Products/solutions/services offered
    AGT FOOD AND INGREDIENTS
    - Business overview
    - Products/solutions/services offered
  • 14.2 OTHER PLAYERS
    THE GREEN LABS LLC
    COSUCRA
    NUTRI-PEA
    SOTEXPRO
    NATURZ ORGANICS
    FENCHEM INC
    PROEON
    SUN NUTRAFOODS
    INNOVOPRO
    CHICKP
ADJACENT & RELATED MARKETS
274
  • 15.1 INTRODUCTION
  • 15.2 ADJACENT MARKET STUDY LIMITATIONS
  • 15.3 PLANT-BASED PROTEINS MARKET
    MARKET DEFINITION
    MARKET OVERVIEW
    PLANT-BASED PROTEINS MARKET, BY NATURE
  • 15.4 PEA PROCESSED INGREDIENTS MARKET
    MARKET DEFINITION
    MARKET OVERVIEW
    PEA PROCESSED INGREDIENTS MARKET, BY SOURCE
APPENDIX
279
  • 16.1 DISCUSSION GUIDE
  • 16.2 KNOWLEDGESTORE: MARKETSANDMARKETS’ SUBSCRIPTION PORTAL
  • 16.3 CUSTOMIZATION OPTIONS
  • 16.4 RELATED REPORTS
  • 16.5 AUTHOR DETAILS
LIST OF TABLES
 
  • TABLE 1 INCLUSIONS AND EXCLUSIONS
  • TABLE 2 USD EXCHANGE RATES CONSIDERED, 2017–2022
  • TABLE 3 PEA PROTEIN MARKET SNAPSHOT, 2024 VS. 2029
  • TABLE 4 PROTEIN SOURCES: COMPARISON
  • TABLE 5 PATENTS PERTAINING TO PEA PROTEINS, 2020–2023
  • TABLE 6 NORTH AMERICA: REGULATORY BODIES, GOVERNMENT AGENCIES, AND OTHER ORGANIZATIONS
  • TABLE 7 EUROPE: REGULATORY BODIES, GOVERNMENT AGENCIES, AND OTHER ORGANIZATIONS
  • TABLE 8 ASIA PACIFIC: REGULATORY BODIES, GOVERNMENT AGENCIES, AND OTHER ORGANIZATIONS
  • TABLE 9 PEA PROTEIN MARKET: ECOSYSTEM
  • TABLE 10 PEA PROTEIN MARKET: PORTER'S FIVE FORCES ANALYSIS
  • TABLE 11 EXPORT DATA OF HS CODE 210610 FOR KEY COUNTRIES, 2020–2022 (KG)
  • TABLE 12 IMPORT DATA OF HS CODE 210610 FOR KEY COUNTRIES, 2020–2022 (KG)
  • TABLE 13 PEA PROTEIN MARKET: AVERAGE SELLING PRICE TREND, BY REGION, 2020–2023 (USD/TON)
  • TABLE 14 GLANBIA PLC DEVELOPS INGREDIENTS FOR BLUEBERRY PANCAKE PEA PROTEIN CEREAL
  • TABLE 15 INFLUENCE OF STAKEHOLDERS ON BUYING PROCESS IN PEA PROTEIN MARKET
  • TABLE 16 KEY BUYING CRITERIA FOR PEA PROTEIN TYPES
  • TABLE 17 PEA PROTEIN MARKET: KEY CONFERENCES & EVENTS
  • TABLE 18 PEA PROTEIN MARKET, BY TYPE, 2020–2023 (USD MILLION)
  • TABLE 19 PEA PROTEIN MARKET, BY TYPE, 2024–2029 (USD MILLION)
  • TABLE 20 PEA PROTEIN MARKET, BY TYPE, 2020–2023 (KT)
  • TABLE 21 PEA PROTEIN MARKET, BY TYPE, 2024–2029 (KT)
  • TABLE 22 ISOLATES: PEA PROTEIN MARKET, BY REGION, 2020–2023 (USD MILLION)
  • TABLE 23 ISOLATES: PEA PROTEIN MARKET, BY REGION, 2024–2029 (USD MILLION)
  • TABLE 24 ISOLATES: PEA PROTEIN MARKET, BY REGION, 2020–2023 (KT)
  • TABLE 25 ISOLATES: PEA PROTEIN MARKET, BY REGION, 2024–2029 (KT)
  • TABLE 26 CONCENTRATES: PEA PROTEIN MARKET, BY REGION, 2020–2023 (USD MILLION)
  • TABLE 27 CONCENTRATES: PEA PROTEIN MARKET, BY REGION, 2024–2029 (USD MILLION)
  • TABLE 28 CONCENTRATES: PEA PROTEIN MARKET, BY REGION, 2020–2023 (KT)
  • TABLE 29 CONCENTRATES: PEA PROTEIN MARKET, BY REGION, 2024–2029 (KT)
  • TABLE 30 TEXTURED: PEA PROTEIN MARKET, BY REGION, 2020–2023 (USD MILLION)
  • TABLE 31 TEXTURED: PEA PROTEIN MARKET, BY REGION, 2024–2029 (USD MILLION)
  • TABLE 32 TEXTURED: PEA PROTEIN MARKET, BY REGION, 2020–2023 (KT)
  • TABLE 33 TEXTURED: PEA PROTEIN MARKET, BY REGION, 2024–2029 (KT)
  • TABLE 34 COMPARISON OF ESSENTIAL AMINO ACID PROFILES IN PEAS, SOYBEAN, RICE, AND WHEAT
  • TABLE 35 AMINO ACID COMPOSITION OF LENTILS, PEAS, AND CHICKPEAS
  • TABLE 36 PEA PROTEIN MARKET, BY SOURCE, 2020–2023 (USD MILLION)
  • TABLE 37 PEA PROTEIN MARKET, BY SOURCE, 2024–2029 (USD MILLION)
  • TABLE 38 YELLOW SPLIT PEAS: PEA PROTEIN MARKET, BY REGION, 2020–2023 (USD MILLION)
  • TABLE 39 YELLOW SPLIT PEAS: PEA PROTEIN MARKET, BY REGION, 2024–2029 (USD MILLION)
  • TABLE 40 CHICKPEAS: PEA PROTEIN MARKET, BY REGION, 2020–2023 (USD MILLION)
  • TABLE 41 CHICKPEAS: PEA PROTEIN MARKET, BY REGION, 2024–2029 (USD MILLION)
  • TABLE 42 LENTILS: PEA PROTEIN MARKET, BY REGION, 2020–2023 (USD MILLION)
  • TABLE 43 LENTILS: PEA PROTEIN MARKET, BY REGION, 2024–2029 (USD MILLION)
  • TABLE 44 PEA PROTEIN MARKET, BY FORM, 2020–2023 (USD MILLION)
  • TABLE 45 PEA PROTEIN MARKET, BY FORM, 2024–2029 (USD MILLION)
  • TABLE 46 DRY PEA PROTEIN MARKET, BY REGION, 2020–2023 (USD MILLION)
  • TABLE 47 DRY PEA PROTEIN MARKET, BY REGION, 2024–2029 (USD MILLION)
  • TABLE 48 WET PEA PROTEIN MARKET, BY REGION, 2020–2023 (USD MILLION)
  • TABLE 49 WET PEA PROTEIN MARKET, BY REGION, 2024–2029 (USD MILLION)
  • TABLE 50 PEA PROTEIN MARKET, BY APPLICATION, 2020–2023 (USD MILLION)
  • TABLE 51 PEA PROTEIN MARKET, BY APPLICATION, 2024–2029 (USD MILLION)
  • TABLE 52 FOOD: PEA PROTEIN MARKET, BY REGION, 2020–2023 (USD MILLION)
  • TABLE 53 FOOD: PEA PROTEIN MARKET, BY REGION, 2024–2029 (USD MILLION)
  • TABLE 54 FOOD: PEA PROTEIN MARKET, BY APPLICATION, 2020–2023 (USD MILLION)
  • TABLE 55 FOOD: PEA PROTEIN MARKET, BY APPLICATION, 2024–2029 (USD MILLION)
  • TABLE 56 MEAT SUBSTITUTES: PEA PROTEIN MARKET, BY REGION, 2020–2023 (USD MILLION)
  • TABLE 57 MEAT SUBSTITUTES: PEA PROTEIN MARKET, BY REGION, 2024–2029 (USD MILLION)
  • TABLE 58 PERFORMANCE NUTRITION: PEA PROTEIN MARKET, BY REGION, 2020–2023 (USD MILLION)
  • TABLE 59 PERFORMANCE NUTRITION: PEA PROTEIN MARKET, BY REGION, 2024–2029 (USD MILLION)
  • TABLE 60 FUNCTIONAL FOODS: PEA PROTEIN MARKET, BY REGION, 2020–2023 (USD MILLION)
  • TABLE 61 FUNCTIONAL FOODS: PEA PROTEIN MARKET, BY REGION, 2024–2029 (USD MILLION)
  • TABLE 62 SNACKS: PEA PROTEIN MARKET, BY REGION, 2020–2023 (USD MILLION)
  • TABLE 63 SNACKS: PEA PROTEIN MARKET, BY REGION, 2024–2029 (USD MILLION)
  • TABLE 64 BAKERY PRODUCTS: PEA PROTEIN MARKET, BY REGION, 2020–2023 (USD MILLION)
  • TABLE 65 BAKERY PRODUCTS: PEA PROTEIN MARKET, BY REGION, 2024–2029 (USD MILLION)
  • TABLE 66 CONFECTIONERIES: PEA PROTEIN MARKET, BY REGION, 2020–2023 (USD MILLION)
  • TABLE 67 CONFECTIONERIES: PEA PROTEIN MARKET, BY REGION, 2024–2029 (USD MILLION)
  • TABLE 68 OTHER FOOD APPLICATIONS: PEA PROTEIN MARKET, BY REGION, 2020–2023 (USD MILLION)
  • TABLE 69 OTHER FOOD APPLICATIONS: PEA PROTEIN MARKET, BY REGION, 2024–2029 (USD MILLION)
  • TABLE 70 BEVERAGES: PEA PROTEIN MARKET, BY REGION, 2020–2023 (USD MILLION)
  • TABLE 71 BEVERAGES: PEA PROTEIN MARKET, BY REGION, 2024–2029 (USD MILLION)
  • TABLE 72 OTHER APPLICATIONS: PEA PROTEIN MARKET, BY REGION, 2020–2023 (USD MILLION)
  • TABLE 73 OTHER APPLICATIONS: PEA PROTEIN MARKET, BY REGION, 2024–2029 (USD MILLION)
  • TABLE 74 PEA PROTEIN MARKET, BY REGION, 2020–2023 (USD MILLION)
  • TABLE 75 PEA PROTEIN MARKET, BY REGION, 2024–2029 (USD MILLION)
  • TABLE 76 PEA PROTEIN MARKET, BY REGION, 2020–2023 (KT)
  • TABLE 77 PEA PROTEIN MARKET, BY REGION, 2024–2029 (KT)
  • TABLE 78 NORTH AMERICA: PEA PROTEIN MARKET, BY COUNTRY, 2020–2023 (USD MILLION)
  • TABLE 79 NORTH AMERICA: PEA PROTEIN MARKET, BY COUNTRY, 2024–2029 (USD MILLION)
  • TABLE 80 NORTH AMERICA: PEA PROTEIN MARKET, BY TYPE, 2020–2023 (USD MILLION)
  • TABLE 81 NORTH AMERICA: PEA PROTEIN MARKET, BY TYPE, 2024–2029 (USD MILLION)
  • TABLE 82 NORTH AMERICA: PEA PROTEIN MARKET, BY TYPE, 2020–2023 (KT)
  • TABLE 83 NORTH AMERICA: PEA PROTEIN MARKET, BY TYPE, 2024–2029 (KT)
  • TABLE 84 NORTH AMERICA: PEA PROTEIN MARKET, BY FORM, 2020–2023 (USD MILLION)
  • TABLE 85 NORTH AMERICA: PEA PROTEIN MARKET, BY FORM, 2024–2029 (USD MILLION)
  • TABLE 86 NORTH AMERICA: PEA PROTEIN MARKET, BY SOURCE, 2020–2023 (USD MILLION)
  • TABLE 87 NORTH AMERICA: PEA PROTEIN MARKET, BY SOURCE, 2024–2029 (USD MILLION)
  • TABLE 88 NORTH AMERICA: PEA PROTEIN MARKET, BY APPLICATION, 2020–2023 (USD MILLION)
  • TABLE 89 NORTH AMERICA: PEA PROTEIN MARKET, BY APPLICATION, 2024–2029 (USD MILLION)
  • TABLE 90 NORTH AMERICA: PEA PROTEIN MARKET, BY FOOD APPLICATION, 2020–2023 (USD MILLION)
  • TABLE 91 NORTH AMERICA: PEA PROTEIN MARKET, BY FOOD APPLICATION, 2024–2029 (USD MILLION)
  • TABLE 92 US: PEA PROTEIN MARKET, BY TYPE, 2020–2023 (USD MILLION)
  • TABLE 93 US: PEA PROTEIN MARKET, BY TYPE, 2024–2029 (USD MILLION)
  • TABLE 94 CANADA: PEA PROTEIN MARKET, BY TYPE, 2020–2023 (USD MILLION)
  • TABLE 95 CANADA: PEA PROTEIN MARKET, BY TYPE, 2024–2029 (USD MILLION)
  • TABLE 96 MEXICO: PEA PROTEIN MARKET, BY TYPE, 2020–2023 (USD MILLION)
  • TABLE 97 MEXICO: PEA PROTEIN MARKET, BY TYPE, 2024–2029 (USD MILLION)
  • TABLE 98 EUROPE: PEA PROTEIN MARKET, BY COUNTRY, 2020–2023 (USD MILLION)
  • TABLE 99 EUROPE: PEA PROTEIN MARKET, BY COUNTRY, 2024–2029 (USD MILLION)
  • TABLE 100 EUROPE: PEA PROTEIN MARKET, BY TYPE, 2020–2023 (USD MILLION)
  • TABLE 101 EUROPE: PEA PROTEIN MARKET, BY TYPE, 2024–2029 (USD MILLION)
  • TABLE 102 EUROPE: PEA PROTEIN MARKET, BY TYPE, 2020–2023 (KT)
  • TABLE 103 EUROPE: PEA PROTEIN MARKET, BY TYPE, 2024–2029 (KT)
  • TABLE 104 EUROPE: PEA PROTEIN MARKET, BY FORM, 2020–2023 (USD MILLION)
  • TABLE 105 EUROPE: PEA PROTEIN MARKET, BY FORM, 2024–2029 (USD MILLION)
  • TABLE 106 EUROPE: PEA PROTEIN MARKET, BY SOURCE, 2020–2023 (USD MILLION)
  • TABLE 107 EUROPE: PEA PROTEIN MARKET, BY SOURCE, 2024–2029 (USD MILLION)
  • TABLE 108 EUROPE: PEA PROTEIN MARKET, BY APPLICATION, 2020–2023 (USD MILLION)
  • TABLE 109 EUROPE: PEA PROTEIN MARKET, BY APPLICATION, 2024–2029 (USD MILLION)
  • TABLE 110 EUROPE: PEA PROTEIN MARKET, BY FOOD APPLICATION, 2020–2023 (USD MILLION)
  • TABLE 111 EUROPE: PEA PROTEIN MARKET, BY FOOD APPLICATION, 2024–2029 (USD MILLION)
  • TABLE 112 FRANCE: PEA PROTEIN MARKET, BY TYPE, 2020–2023 (USD MILLION)
  • TABLE 113 FRANCE: PEA PROTEIN MARKET, BY TYPE, 2024–2029 (USD MILLION)
  • TABLE 114 DENMARK: PEA PROTEIN MARKET, BY TYPE, 2020–2023 (USD MILLION)
  • TABLE 115 DENMARK: PEA PROTEIN MARKET, BY TYPE, 2024–2029 (USD MILLION)
  • TABLE 116 GERMANY: PEA PROTEIN MARKET, BY TYPE, 2020–2023 (USD MILLION)
  • TABLE 117 GERMANY: PEA PROTEIN MARKET, BY TYPE, 2024–2029 (USD MILLION)
  • TABLE 118 UK: PEA PROTEIN MARKET, BY TYPE, 2020–2023 (USD MILLION)
  • TABLE 119 UK: PEA PROTEIN MARKET, BY TYPE, 2024–2029 (USD MILLION)
  • TABLE 120 SPAIN: PEA PROTEIN MARKET, BY TYPE, 2020–2023 (USD MILLION)
  • TABLE 121 SPAIN: PEA PROTEIN MARKET, BY TYPE, 2024–2029 (USD MILLION)
  • TABLE 122 NETHERLANDS: PEA PROTEIN MARKET, BY TYPE, 2020–2023 (USD MILLION)
  • TABLE 123 NETHERLANDS: PEA PROTEIN MARKET, BY TYPE, 2024–2029 (USD MILLION)
  • TABLE 124 ITALY: PEA PROTEIN MARKET, BY TYPE, 2020–2023 (USD MILLION)
  • TABLE 125 ITALY: PEA PROTEIN MARKET, BY TYPE, 2024–2029 (USD MILLION)
  • TABLE 126 FINLAND: PEA PROTEIN MARKET, BY TYPE, 2020–2023 (USD MILLION)
  • TABLE 127 FINLAND: PEA PROTEIN MARKET, BY TYPE, 2024–2029 (USD MILLION)
  • TABLE 128 REST OF EUROPE: PEA PROTEIN MARKET, BY TYPE, 2020–2023 (USD MILLION)
  • TABLE 129 REST OF EUROPE: PEA PROTEIN MARKET, BY TYPE, 2024–2029 (USD MILLION)
  • TABLE 130 ASIA PACIFIC: PEA PROTEIN MARKET, BY COUNTRY, 2020–2023 (USD MILLION)
  • TABLE 131 ASIA PACIFIC: PEA PROTEIN MARKET, BY COUNTRY, 2024–2029 (USD MILLION)
  • TABLE 132 ASIA PACIFIC: PEA PROTEIN MARKET, BY TYPE, 2020–2023 (USD MILLION)
  • TABLE 133 ASIA PACIFIC: PEA PROTEIN MARKET, BY TYPE, 2024–2029 (USD MILLION)
  • TABLE 134 ASIA PACIFIC: PEA PROTEIN MARKET, BY TYPE, 2020–2023 (KT)
  • TABLE 135 ASIA PACIFIC: PEA PROTEIN MARKET, BY TYPE, 2024–2029 (KT)
  • TABLE 136 ASIA PACIFIC: PEA PROTEIN MARKET, BY FORM, 2020–2023 (USD MILLION)
  • TABLE 137 ASIA PACIFIC: PEA PROTEIN MARKET, BY FORM, 2024–2029 (USD MILLION)
  • TABLE 138 ASIA PACIFIC: PEA PROTEIN MARKET, BY SOURCE, 2020–2023 (USD MILLION)
  • TABLE 139 ASIA PACIFIC: PEA PROTEIN MARKET, BY SOURCE, 2024–2029 (USD MILLION)
  • TABLE 140 ASIA PACIFIC: PEA PROTEIN MARKET, BY APPLICATION, 2020–2023 (USD MILLION)
  • TABLE 141 ASIA PACIFIC: PEA PROTEIN MARKET, BY APPLICATION, 2024–2029 (USD MILLION)
  • TABLE 142 ASIA PACIFIC: PEA PROTEIN MARKET, BY FOOD APPLICATION, 2020–2023 (USD MILLION)
  • TABLE 143 ASIA PACIFIC: PEA PROTEIN MARKET, BY FOOD APPLICATION, 2024–2029 (USD MILLION)
  • TABLE 144 CHINA: PEA PROTEIN MARKET, BY TYPE, 2020–2023 (USD MILLION)
  • TABLE 145 CHINA: PEA PROTEIN MARKET, BY TYPE, 2024–2029 (USD MILLION)
  • TABLE 146 INDIA: PEA PROTEIN MARKET, BY TYPE, 2020–2023 (USD MILLION)
  • TABLE 147 INDIA: PEA PROTEIN MARKET, BY TYPE, 2024–2029 (USD MILLION)
  • TABLE 148 JAPAN: PEA PROTEIN MARKET, BY TYPE, 2020–2023 (USD MILLION)
  • TABLE 149 JAPAN: PEA PROTEIN MARKET, BY TYPE, 2024–2029 (USD MILLION)
  • TABLE 150 AUSTRALIA & NEW ZEALAND: PEA PROTEIN MARKET, BY TYPE, 2020–2023 (USD MILLION)
  • TABLE 151 AUSTRALIA & NEW ZEALAND: PEA PROTEIN MARKET, BY TYPE, 2024–2029 (USD MILLION)
  • TABLE 152 REST OF ASIA PACIFIC: PEA PROTEIN MARKET, BY TYPE, 2020–2023 (USD MILLION)
  • TABLE 153 REST OF ASIA PACIFIC: PEA PROTEIN MARKET, BY TYPE, 2024–2029 (USD MILLION)
  • TABLE 154 SOUTH AMERICA: PEA PROTEIN MARKET, BY COUNTRY, 2020–2023 (USD MILLION)
  • TABLE 155 SOUTH AMERICA: PEA PROTEIN MARKET, BY COUNTRY, 2024–2029 (USD MILLION)
  • TABLE 156 SOUTH AMERICA: PEA PROTEIN MARKET, BY TYPE, 2020–2023 (USD MILLION)
  • TABLE 157 SOUTH AMERICA: PEA PROTEIN MARKET, BY TYPE, 2024–2029 (USD MILLION)
  • TABLE 158 SOUTH AMERICA: PEA PROTEIN MARKET, BY TYPE, 2020–2023 (KT)
  • TABLE 159 SOUTH AMERICA: PEA PROTEIN MARKET, BY TYPE, 2024–2029 (KT)
  • TABLE 160 SOUTH AMERICA: PEA PROTEIN MARKET, BY FORM, 2020–2023 (USD MILLION)
  • TABLE 161 SOUTH AMERICA: PEA PROTEIN MARKET, BY FORM, 2024–2029 (USD MILLION)
  • TABLE 162 SOUTH AMERICA: PEA PROTEIN MARKET, BY SOURCE, 2020–2023 (USD MILLION)
  • TABLE 163 SOUTH AMERICA: PEA PROTEIN MARKET, BY SOURCE, 2024–2029 (USD MILLION)
  • TABLE 164 SOUTH AMERICA: PEA PROTEIN MARKET, BY APPLICATION, 2020–2023 (USD MILLION)
  • TABLE 165 SOUTH AMERICA: PEA PROTEIN MARKET, BY APPLICATION, 2024–2029 (USD MILLION)
  • TABLE 166 SOUTH AMERICA: PEA PROTEIN MARKET, BY FOOD APPLICATION, 2020–2023 (USD MILLION)
  • TABLE 167 SOUTH AMERICA: PEA PROTEIN MARKET, BY FOOD APPLICATION, 2024–2029 (USD MILLION)
  • TABLE 168 BRAZIL: PEA PROTEIN MARKET, BY TYPE, 2020–2023 (USD MILLION)
  • TABLE 169 BRAZIL: PEA PROTEIN MARKET, BY TYPE, 2024–2029 (USD MILLION)
  • TABLE 170 ARGENTINA: PEA PROTEIN MARKET, BY TYPE, 2020–2023 (USD MILLION)
  • TABLE 171 ARGENTINA: PEA PROTEIN MARKET, BY TYPE, 2024–2029 (USD MILLION)
  • TABLE 172 REST OF SOUTH AMERICA: PEA PROTEIN MARKET, BY TYPE, 2020–2023 (USD MILLION)
  • TABLE 173 REST OF SOUTH AMERICA: PEA PROTEIN MARKET, BY TYPE, 2024–2029 (USD MILLION)
  • TABLE 174 REST OF THE WORLD: PEA PROTEIN MARKET, BY REGION, 2020–2023 (USD MILLION)
  • TABLE 175 REST OF THE WORLD: PEA PROTEIN MARKET, BY REGION, 2024–2029 (USD MILLION)
  • TABLE 176 REST OF THE WORLD: PEA PROTEIN MARKET, BY TYPE, 2020–2023 (USD MILLION)
  • TABLE 177 REST OF THE WORLD: PEA PROTEIN MARKET, BY TYPE, 2024–2029 (USD MILLION)
  • TABLE 178 REST OF THE WORLD: PEA PROTEIN MARKET, BY TYPE, 2020–2023 (KT)
  • TABLE 179 REST OF THE WORLD: PEA PROTEIN MARKET, BY TYPE, 2024–2029 (KT)
  • TABLE 180 REST OF THE WORLD: PEA PROTEIN MARKET, BY FORM, 2020–2023 (USD MILLION)
  • TABLE 181 REST OF THE WORLD: PEA PROTEIN MARKET, BY FORM, 2024–2029 (USD MILLION)
  • TABLE 182 REST OF THE WORLD: PEA PROTEIN MARKET, BY SOURCE, 2020–2023 (USD MILLION)
  • TABLE 183 REST OF THE WORLD: PEA PROTEIN MARKET, BY SOURCE, 2024–2029 (USD MILLION)
  • TABLE 184 REST OF THE WORLD: PEA PROTEIN MARKET, BY APPLICATION, 2020–2023 (USD MILLION)
  • TABLE 185 REST OF THE WORLD: PEA PROTEIN MARKET, BY APPLICATION, 2024–2029 (USD MILLION)
  • TABLE 186 REST OF THE WORLD: PEA PROTEIN MARKET, BY FOOD APPLICATION, 2020–2023 (USD MILLION)
  • TABLE 187 REST OF THE WORLD: PEA PROTEIN MARKET, BY FOOD APPLICATION, 2024–2029 (USD MILLION)
  • TABLE 188 MIDDLE EAST: PEA PROTEIN MARKET, BY REGION, 2020–2023 (USD MILLION)
  • TABLE 189 MIDDLE EAST: PEA PROTEIN MARKET, BY REGION, 2024–2029 (USD MILLION)
  • TABLE 190 MIDDLE EAST: PEA PROTEIN MARKET, BY TYPE, 2020–2023 (USD MILLION)
  • TABLE 191 MIDDLE EAST: PEA PROTEIN MARKET, BY TYPE, 2024–2029 (USD MILLION)
  • TABLE 192 MIDDLE EAST: PEA PROTEIN MARKET, BY FORM, 2020–2023 (USD MILLION)
  • TABLE 193 MIDDLE EAST: PEA PROTEIN MARKET, BY FORM, 2024–2029 (USD MILLION)
  • TABLE 194 MIDDLE EAST: PEA PROTEIN MARKET, BY SOURCE, 2020–2023 (USD MILLION)
  • TABLE 195 MIDDLE EAST: PEA PROTEIN MARKET, BY SOURCE, 2024–2029 (USD MILLION)
  • TABLE 196 MIDDLE EAST: PEA PROTEIN MARKET, BY APPLICATION, 2020–2023 (USD MILLION)
  • TABLE 197 MIDDLE EAST: PEA PROTEIN MARKET, BY APPLICATION, 2024–2029 (USD MILLION)
  • TABLE 198 MIDDLE EAST: PEA PROTEIN MARKET, BY FOOD APPLICATION, 2020–2023 (USD MILLION)
  • TABLE 199 MIDDLE EAST: PEA PROTEIN MARKET, BY FOOD APPLICATION, 2024–2029 (USD MILLION)
  • TABLE 200 AFRICA: PEA PROTEIN MARKET, BY REGION, 2020–2023 (USD MILLION)
  • TABLE 201 AFRICA: PEA PROTEIN MARKET, BY REGION, 2024–2029 (USD MILLION)
  • TABLE 202 AFRICA: PEA PROTEIN MARKET, BY TYPE, 2020–2023 (USD MILLION)
  • TABLE 203 AFRICA: PEA PROTEIN MARKET, BY TYPE, 2024–2029 (USD MILLION)
  • TABLE 204 AFRICA: PEA PROTEIN MARKET, BY FORM, 2020–2023 (USD MILLION)
  • TABLE 205 AFRICA: PEA PROTEIN MARKET, BY FORM, 2024–2029 (USD MILLION)
  • TABLE 206 AFRICA: PEA PROTEIN MARKET, BY SOURCE, 2020–2023 (USD MILLION)
  • TABLE 207 AFRICA: PEA PROTEIN MARKET, BY SOURCE, 2024–2029 (USD MILLION)
  • TABLE 208 AFRICA: PEA PROTEIN MARKET, BY APPLICATION, 2020–2023 (USD MILLION)
  • TABLE 209 AFRICA: PEA PROTEIN MARKET, BY APPLICATION, 2024–2029 (USD MILLION)
  • TABLE 210 AFRICA: PEA PROTEIN MARKET, BY FOOD APPLICATION, 2020–2023 (USD MILLION)
  • TABLE 211 AFRICA: PEA PROTEIN MARKET, BY FOOD APPLICATION, 2024–2029 (USD MILLION)
  • TABLE 212 OVERVIEW OF STRATEGIES ADOPTED BY KEY PLAYERS IN PEA PROTEIN MARKET
  • TABLE 213 PEA PROTEIN MARKET: DEGREE OF COMPETITION
  • TABLE 214 PEA PROTEIN MARKET: COMPANY TYPE FOOTPRINT
  • TABLE 215 PEA PROTEIN MARKET: APPLICATION FOOTPRINT
  • TABLE 216 PEA PROTEIN MARKET: REGION FOOTPRINT
  • TABLE 217 PEA PROTEIN MARKET: KEY STARTUPS/SMES
  • TABLE 218 PEA PROTEIN MARKET: COMPETITIVE BENCHMARKING OF KEY STARTUPS/SMES
  • TABLE 219 PEA PROTEIN MARKET: PRODUCT LAUNCHES, JANUARY 2019–AUGUST 2022
  • TABLE 220 PEA PROTEIN MARKET: DEALS, JANUARY 2019–JANUARY 2024
  • TABLE 221 PEA PROTEIN MARKET: EXPANSIONS, JANUARY 2019–JANUARY 2024
  • TABLE 222 ROQUETTE FRÈRES: BUSINESS OVERVIEW
  • TABLE 223 ROQUETTE FRÈRES: PRODUCTS/ SOLUTIONS /SERVICES OFFERED
  • TABLE 224 ROQUETTE FRÈRES: DEALS, JANUARY 2019–JANUARY 2024
  • TABLE 225 ROQUETTE FRÈRES: EXPANSIONS, JANUARY 2019–JANUARY 2024
  • TABLE 226 ADM: BUSINESS OVERVIEW
  • TABLE 227 ADM: PRODUCTS/SOLUTIONS/SERVICES OFFERED
  • TABLE 228 ADM: DEALS, JANUARY 2019–JANUARY 2024
  • TABLE 229 ADM: EXPANSIONS, JANUARY 2019–JANUARY 2024
  • TABLE 230 INGREDION: BUSINESS OVERVIEW
  • TABLE 231 INGREDION: PRODUCTS/SOLUTIONS/SERVICES OFFERED
  • TABLE 232 INGREDION: PRODUCT LAUNCHES, JANUARY 2019–JANUARY 2024
  • TABLE 233 INGREDION: DEALS, JANUARY 2019–JANUARY 2024
  • TABLE 234 INGREDION: EXPANSION, JANUARY 2019–JANUARY 2024
  • TABLE 235 KERRY GROUP PLC.: BUSINESS OVERVIEW
  • TABLE 236 KERRY GROUP PLC.: PRODUCTS/SOLUTIONS/SERVICES OFFERED
  • TABLE 237 KERRY GROUP PLC.: DEALS, JANUARY 2019–JANUARY 2024
  • TABLE 238 KERRY GROUP PLC.: EXPANSIONS, JANUARY 2019–JANUARY 2024
  • TABLE 239 GLANBIA PLC: BUSINESS OVERVIEW
  • TABLE 240 GLANBIA PLC: PRODUCTS/SOLUTIONS/SERVICES OFFERED
  • TABLE 241 GLANBIA PLC: DEALS, JANUARY 2019–JANUARY 2024
  • TABLE 242 CARGILL, INCORPORATED: BUSINESS OVERVIEW
  • TABLE 243 CARGILL, INCORPORATED: PRODUCTS/SOLUTIONS/SERVICES OFFERED
  • TABLE 244 CARGILL, INCORPORATED: DEALS, JANUARY 2019–JANUARY 2024
  • TABLE 245 CARGILL, INCORPORATED: EXPANSIONS, JANUARY 2019–JANUARY 2024
  • TABLE 246 INTERNATIONAL FLAVORS & FRAGRANCES INC.: BUSINESS OVERVIEW
  • TABLE 247 INTERNATIONAL FLAVORS & FRAGRANCES INC.: PRODUCTS/SOLUTIONS/SERVICES OFFERED
  • TABLE 248 INTERNATIONAL FLAVORS & FRAGRANCES INC.: DEALS, JANUARY 2019–JANUARY 2024
  • TABLE 249 INTERNATIONAL FLAVORS & FRAGRANCES INC.: EXPANSIONS, JANUARY 2019–JANUARY 2024
  • TABLE 250 PURIS: BUSINESS OVERVIEW
  • TABLE 251 PURIS: PRODUCTS/SOLUTIONS/SERVICES OFFERED
  • TABLE 252 PURIS: DEALS, JANUARY 2019–JANUARY 2024
  • TABLE 253 EMSLAND GROUP: BUSINESS OVERVIEW
  • TABLE 254 EMSLAND GROUP: PRODUCTS/SOLUTIONS/SERVICES OFFERED
  • TABLE 255 EMSLAND GROUP: DEALS, JANUARY 2019–JANUARY 2024
  • TABLE 256 EMSLAND GROUP: EXPANSIONS, JANUARY 2019–JANUARY 2024
  • TABLE 257 YANTAI SHUANGTA FOODS CO., LTD.: BUSINESS OVERVIEW
  • TABLE 258 YANTAI SHUANGTA FOODS CO., LTD.: PRODUCTS/SOLUTIONS/SERVICES OFFERED
  • TABLE 259 BURCON: BUSINESS OVERVIEW
  • TABLE 260 BURCON: PRODUCTS/SOLUTIONS/SERVICES OFFERED
  • TABLE 261 BURCON: PRODUCT LAUNCHES, JANUARY 2019–JANUARY 2024
  • TABLE 262 BURCON: DEALS, JANUARY 2019–JANUARY 2024
  • TABLE 263 BURCON: EXPANSIONS, JANUARY 2019–JANUARY 2024
  • TABLE 264 AXIOM FOODS INC.: BUSINESS OVERVIEW
  • TABLE 265 AXIOM FOODS INC.: PRODUCTS/SOLUTIONS/SERVICES OFFERED
  • TABLE 266 AXIOM FOODS INC.: DEALS, JANUARY 2019–JANUARY 2024
  • TABLE 267 SHANDONG JIANYUAN GROUP: BUSINESS OVERVIEW
  • TABLE 268 SHANDONG JIANYUAN GROUP: PRODUCTS/SOLUTIONS/SERVICES OFFERED
  • TABLE 269 ET-CHEM: BUSINESS OVERVIEW
  • TABLE 270 ET-CHEM: PRODUCTS/SOLUTIONS/SERVICES OFFERED
  • TABLE 271 AGT FOOD AND INGREDIENTS: BUSINESS OVERVIEW
  • TABLE 272 AGT FOOD AND INGREDIENTS: PRODUCTS/SOLUTIONS/SERVICES OFFERED
  • TABLE 273 PLANT-BASED PROTEIN MARKET, BY NATURE, 2018–2022 (USD MILLION)
  • TABLE 274 PLANT-BASED PROTEIN MARKET, BY NATURE, 2023–2028 (USD MILLION)
  • TABLE 275 PEA PROCESSED INGREDIENTS MARKET, BY SOURCE, 2019–2026 (USD MILLION)
LIST OF FIGURES
 
  • FIGURE 1 PEA PROTEIN MARKET SEGMENTATION
  • FIGURE 2 PEA PROTEIN MARKET: RESEARCH DESIGN
  • FIGURE 3 BREAKDOWN OF INTERVIEWS WITH EXPERTS BY COMPANY TYPE, DESIGNATION, AND REGION
  • FIGURE 4 PEA PROTEIN MARKET SIZE ESTIMATION – DEMAND SIDE
  • FIGURE 5 PEA PROTEIN MARKET SIZE ESTIMATION: SUPPLY SIDE
  • FIGURE 6 PEA PROTEIN MARKET SIZE ESTIMATION: BOTTOM-UP APPROACH
  • FIGURE 7 DATA TRIANGULATION
  • FIGURE 8 INDICATORS OF RECESSION
  • FIGURE 9 GLOBAL INFLATION RATE, 2013–2022
  • FIGURE 10 GLOBAL GDP: 2013–2022 (USD TRILLION)
  • FIGURE 11 RECESSION INDICATORS AND THEIR IMPACT ON PEA PROTEIN MARKET
  • FIGURE 12 PEA PROTEIN MARKET: PREVIOUS FORECAST VS. RECESSION FORECAST
  • FIGURE 13 PROTEIN ISOLATES TO DOMINATE MARKET BY 2029 (USD MILLION)
  • FIGURE 14 DRY FORM OF PEA PROTEIN TO BE MAJOR MARKET BY 2029 (USD MILLION)
  • FIGURE 15 YELLOW SPLIT PEAS TO BE MAJOR PEA PROTEIN SOURCE BY 2029 (USD MILLION)
  • FIGURE 16 FOOD APPLICATIONS TO HOLD LARGEST SHARE IN PEA PROTEIN MARKET, 2029 (USD MILLION)
  • FIGURE 17 PEA PROTEIN MARKET: REGIONAL SNAPSHOT
  • FIGURE 18 RISING DEMAND FOR PLANT-BASED MEAT ALTERNATIVES AND FUNCTIONAL FOODS PRESENTS OPPORTUNITIES
  • FIGURE 19 ISOLATES ACCOUNTED FOR LARGEST SHARE OF EUROPEAN PEA PROTEIN MARKET IN 2023
  • FIGURE 20 PEA PROTEIN ISOLATES TO DOMINATE THROUGHOUT FORECAST PERIOD (USD MILLION)
  • FIGURE 21 YELLOW SPLIT PEAS TO BE MAJOR SEGMENT FROM 2024 TO 2029 (USD MILLION)
  • FIGURE 22 DRY PEA PROTEIN TO BE LARGER SEGMENT THROUGHOUT FORECAST PERIOD (USD MILLION)
  • FIGURE 23 FOOD TO BE DOMINANT APPLICATION THROUGHOUT FORECAST PERIOD (USD MILLION)
  • FIGURE 24 MARKET IN JAPAN TO GROW AT HIGHEST RATE DURING FORECAST PERIOD
  • FIGURE 25 GLOBAL CHICKPEA AND GREEN PEA PRODUCTION, 2016–2020 (MILLION TONNES)
  • FIGURE 26 GLOBAL PEA PRODUCTION, 2021 (MILLION TONNES)
  • FIGURE 27 PEA PROTEIN MARKET DYNAMICS
  • FIGURE 28 TOP FIVE COUNTRIES WITH VEGAN POPULATION, 2020
  • FIGURE 29 GLOBAL RISE IN PATENTS GRANTED FOR NEW PEA PROTEIN EXTRACTION PROCESSES, 2018–2023
  • FIGURE 30 TOP PATENT APPLICANT COMPANIES IN PEA PROTEIN MARKET, 2018–2023
  • FIGURE 31 PEA EXTRACTION: INDUSTRIAL PROCESS
  • FIGURE 32 PEA EXTRACTION: PILOT PROCESS
  • FIGURE 33 PLANT-BASED PROTEINS: ESTABLISHED CROPS VS. FUTURE CROPS
  • FIGURE 34 IMPORTANCE OF MANUFACTURING IN SUPPLY CHAIN OF PEA PROTEINS
  • FIGURE 35 RESEARCH & DEVELOPMENT AND RAW MATERIAL SOURCING OF PEA PROTEIN CONTRIBUTE MAJOR VALUE
  • FIGURE 36 NUMBER OF PATENTS GRANTED BETWEEN 2018 AND 2023
  • FIGURE 37 TOP 10 INVESTORS WITH HIGHEST NUMBER OF PATENT DOCUMENTS
  • FIGURE 38 PEA PROTEIN MARKET ECOSYSTEM
  • FIGURE 39 PEA PROTEIN MARKET MAP
  • FIGURE 40 TRENDS/DISRUPTIONS IMPACTING BUYERS IN PEA PROTEIN MARKET
  • FIGURE 41 AVERAGE SELLING PRICE TREND OF KEY PLAYERS, BY TYPE (USD/KG)
  • FIGURE 42 AVERAGE SELLING PRICE TREND, BY TYPE (USD/TON)
  • FIGURE 43 INFLUENCE OF STAKEHOLDERS ON BUYING PROCESS IN PEA PROTEIN MARKET
  • FIGURE 44 KEY BUYING CRITERIA FOR PEA PROTEIN TYPES
  • FIGURE 45 INVESTMENT AND FUNDING SCENARIO
  • FIGURE 46 PEA PROTEIN MARKET, BY TYPE, 2024 VS. 2029 (USD MILLION)
  • FIGURE 47 GLOBAL PRODUCTION OF PULSES (LAKH TONS), 2020
  • FIGURE 48 PEA PROTEIN MARKET, BY SOURCE, 2024 VS. 2029 (USD MILLION)
  • FIGURE 49 KEY COUNTRIES WITH CHICKPEA PRODUCTION (MILLION TONNES), 2019
  • FIGURE 50 PEA PROTEIN MARKET, BY FORM, 2024 VS. 2029 (USD MILLION)
  • FIGURE 51 PEA PROTEIN MARKET, BY APPLICATION, 2024 VS. 2029 (USD MILLION)
  • FIGURE 52 TOP EXPORTERS AND IMPORTERS OF BAKED GOODS, 2021
  • FIGURE 53 GLOBAL INCREASE IN CONFECTIONERY EXPORTS, 2004–2020
  • FIGURE 54 ASIA PACIFIC TO RECORD HIGHEST CAGR DURING FORECAST PERIOD
  • FIGURE 55 SHARE OF DEATHS ATTRIBUTED TO OBESITY IN NORTH AMERICA, 2019 (%)
  • FIGURE 56 NORTH AMERICA: INFLATION RATES, BY KEY COUNTRY, 2018–2022
  • FIGURE 57 NORTH AMERICA: RECESSION IMPACT ANALYSIS, 2023
  • FIGURE 58 GROWING PEA PRODUCTION IN CANADA, 2017–2020 (KT)
  • FIGURE 59 GREENHOUSE GAS EMISSIONS FROM AVERAGE FOOD CONSUMPTION
  • FIGURE 60 EUROPE: REGIONAL SNAPSHOT
  • FIGURE 61 EUROPE: INFLATION RATES, BY KEY COUNTRY, 2018–2022
  • FIGURE 62 EUROPE: RECESSION IMPACT ANALYSIS, 2023
  • FIGURE 63 GERMANY: HIGHEST CONSUMED PLANT-BASED FOOD PRODUCT BRANDS, 2019
  • FIGURE 64 ASIA PACIFIC: REGIONAL SNAPSHOT
  • FIGURE 65 ASIA PACIFIC: INFLATION RATES, BY KEY COUNTRY, 2018–2022
  • FIGURE 66 ASIA PACIFIC: RECESSION IMPACT ANALYSIS, 2023
  • FIGURE 67 SOUTH AMERICA: INFLATION RATES, BY KEY COUNTRY, 2017–2021
  • FIGURE 68 SOUTH AMERICA: RECESSION IMPACT ANALYSIS, 2023
  • FIGURE 69 ROW: INFLATION RATES, BY KEY COUNTRY, 2018–2022
  • FIGURE 70 ROW: RECESSION IMPACT ANALYSIS, 2022–2023
  • FIGURE 71 AFRICAN COUNTRIES IMPORT DATA FOR HS CODE 210610, 2020
  • FIGURE 72 SEGMENTAL REVENUE ANALYSIS OF KEY MARKET PLAYERS, 2018–2022 (USD BILLION)
  • FIGURE 73 PEA PROTEIN MARKET: BRAND/PRODUCT COMPARISON
  • FIGURE 74 PEA PROTEIN MARKET: COMPANY VALUATION (USD BILLION)
  • FIGURE 75 ANNUAL REVENUE, 2022 (USD BILLION) VS. REVENUE GROWTH, 2020–2022
  • FIGURE 76 EV/EBITDA, 2022 (USD BILLION)
  • FIGURE 77 PEA PROTEIN MARKET: GLOBAL SNAPSHOT OF KEY PARTICIPANTS, 2023
  • FIGURE 78 PEA PROTEIN MARKET: COMPANY EVALUATION MATRIX (KEY PLAYERS), 2023
  • FIGURE 79 PEA PROTEIN MARKET: COMPANY FOOTPRINT
  • FIGURE 80 PEA PROTEIN MARKET: COMPANY EVALUATION MATRIX (STARTUPS/SMES), 2023
  • FIGURE 81 ROQUETTE FRÈRES: COMPANY SNAPSHOT
  • FIGURE 82 ADM: COMPANY SNAPSHOT
  • FIGURE 83 INGREDION: COMPANY SNAPSHOT
  • FIGURE 84 KERRY GROUP PLC.: COMPANY SNAPSHOT
  • FIGURE 85 GLANBIA PLC: COMPANY SNAPSHOT
  • FIGURE 86 CARGILL: COMPANY SNAPSHOT
  • FIGURE 87 INTERNATIONAL FLAVORS & FRAGRANCES INC.: COMPANY SNAPSHOT

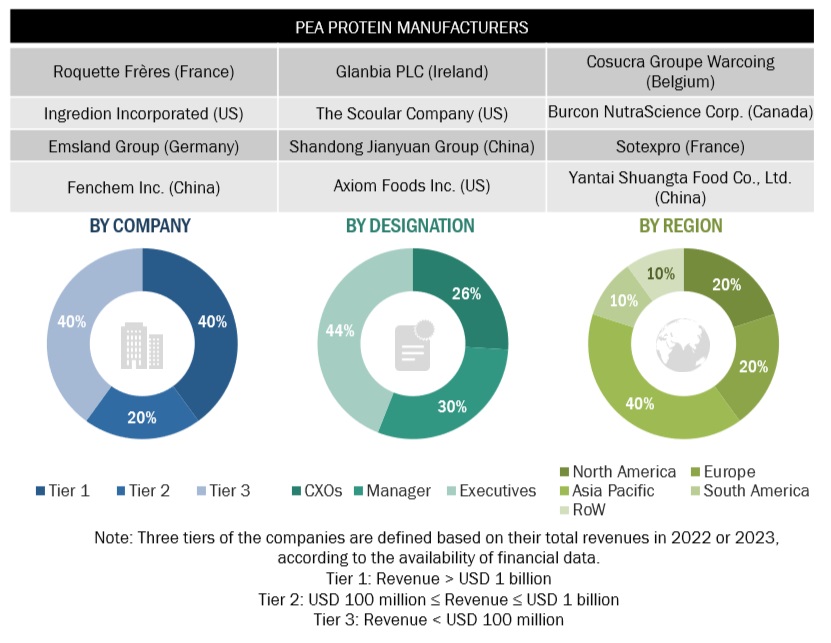
The research study involved extensive secondary sources, directories, and databases such as Bloomberg Businessweek and Factiva to identify and collect information useful for a technical, market-oriented, and commercial study of the pea protein market. In-depth interviews were conducted with various primary respondents—such as key industry participants, subject matter experts (SMEs), C-level executives of key market players, and industry consultants—to obtain and verify critical qualitative and quantitative information and assess prospects.

Secondary Research

The secondary sources referred for this research study include government sources, such as the Food and Agriculture Organization (FAO), the US Department of Agriculture (USDA), Eurostat (EU Database), and various national ministries of the agricultural department, corporate filings (such as annual reports, press releases, investor presentations, and financial statements), and trade, business, and professional associations such as In the secondary research process, various organizations such as the Saskatchewan Pulse Growers (Saskpulse), Good Food Institute (GFI), and European Vegetable Protein Association (EUVEPRO), were referred to identify and collect information for this study.

Secondary research was mainly used to obtain key information about the industry's supply chain—the total pool of key players, market classification, and segmentation according to the industry trends and key developments from market-oriented perspectives.

Primary Research

The pea protein market comprises several stakeholders, including raw material suppliers, ingredient suppliers, end-product manufacturers, and regulatory organizations in the supply chain. Various primary sources from both the supply and demand sides of the market were interviewed to obtain qualitative and quantitative information. Primary interviewees from the supply side include research institutions involved in R&D to introduce technology, distributors, wholesalers, importers & exporters of processed ingredients manufacturers and technology providers. Primary sources from the demand-side include key opinion leaders, executives, vice presidents, and CEOs through questionnaires, emails, and telephonic interviews.
Pea Protein Market Primary Research

To know about the assumptions considered for the study, download the pdf brochure

Market Size Estimation

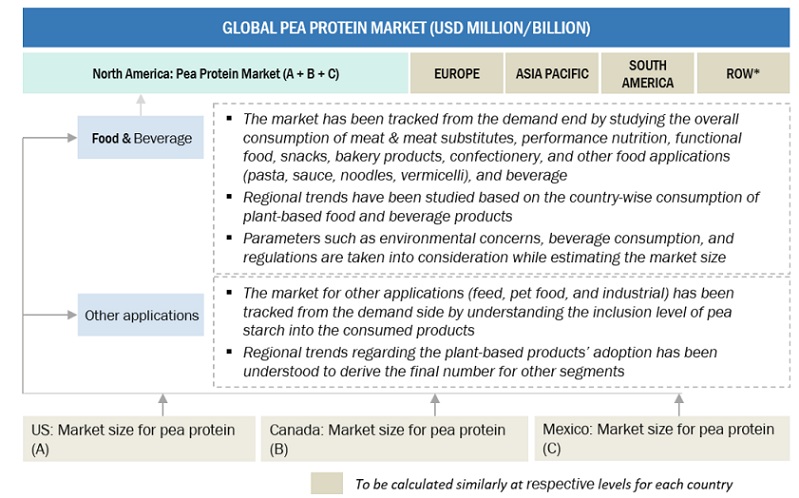
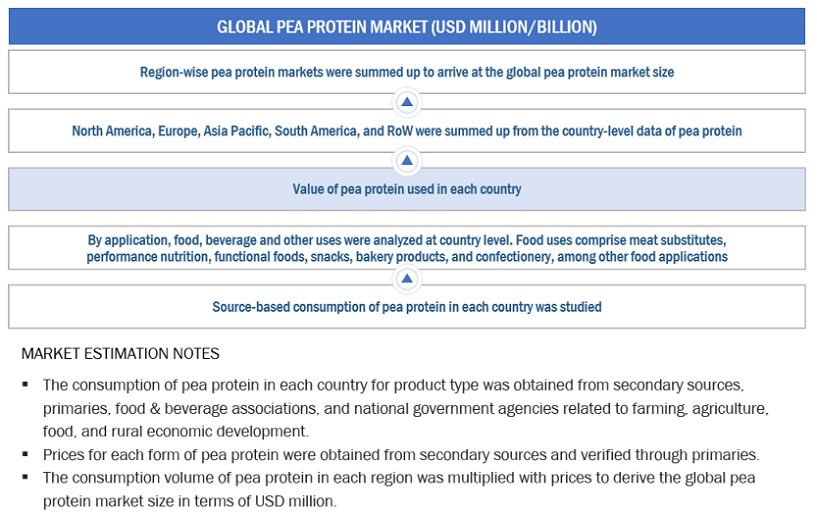
Both the top-down and bottom-up approaches have been used to estimate and validate the total size of the pea protein market. These approaches were extensive to determine the size of the subsegments in the market. The research methodology used to estimate the market size includes the following details:

  • Top-down approach:
    • The key players in the industry and the market were identified through extensive secondary research.
    • The industry's supply chain and market size were determined through primary and secondary research.
    • All percentage share splits and breakdowns were determined using secondary sources and verified through primary sources.
    • The parent market—the pea processed ingredients market—was considered to validate pea protein's market details further.
  • Bottom-up approach:
    • The market sizes were analyzed based on each type of pea protein share at regional and country levels. Thus, the global market for pea protein was estimated with a bottom-up approach of the type at the country level.
    • Based on the demand for the mode of application, offerings of key players, and the region-wise market share of major players, the global market for the mode of application was estimated.
    • Other factors considered include penetration rate of pea protein in end-user applications such as meat substitutes, performance nutrition, and functional foods, consumer awareness, and function trends, pricing trends, the adoption rate and price factors, patents registered, and organic and inorganic growth attempts.
  • All macroeconomic and microeconomic factors affecting the growth of the pea protein market were considered while estimating the market size.
  • All possible parameters that affect the market covered in this research study were accounted for, viewed in extensive detail, verified through primary research, and analyzed to obtain final quantitative and qualitative data.

Market size estimation: Top-Down approach
Pea Protein Market Top Down Approach

To know about the assumptions considered for the study, Request for Free Sample Report

Market size estimation methodology: Bottom-up approach
Pea Protein Market Bottom Up Approach

Data Triangulation

After arriving at the overall market size from the estimation process explained above, the total market was split into several segments and subsegments. The data triangulation and market breakdown procedures were employed, wherever applicable, to estimate the overall pea protein market and arrive at the exact statistics for all segments and subsegments. The data was triangulated by studying various factors and trends from the demand and supply sides. Along with this, the market size was validated using both the top-down and bottom-up approaches.

Market Definition

Pea protein is a vegetable protein with a neutral taste derived from different pea types such as chickpeas, yellow peas, lentils, and beans. It is produced as isolates, concentrated, and textured proteins and is highly nutritious. Pea protein is considered vegan and is not classified as a major allergen. Therefore, it is suitable for consumption for a wider consumer base. Pea protein also has a well-maintained amino acid profile and features high solubility and low viscosity, which add to its nutritional value.

Pea proteins can be used in various applications, including performance nutrition, bakery products, snack bars, beverages, meat alternatives, and dairy alternatives.

Key Stakeholders

  • Food manufacturers
  • Meat alternative manufacturers
  • Dairy alternative manufacturers
  • Sports nutrition manufacturers
  • Food importers and exporters
  • Intermediary suppliers include traders and distributors of plant-based sources such as soy, pea, corn, chia, and flax.
  • Government and research organizations
  • Associations and industry bodies:
    • Food and Agriculture Organization (FAO)
    • United States Department of Agriculture (USDA)
    • European Food Safety Authority (EFSA)
    • European Association of Specialty Feed Ingredients and their Mixtures (FEFANA)
    • Organization for Economic Co-operation and Development (OECD)
  • Venture capitalists and investors

Report Objectives

Market Intelligence

  • To determine and project the size of the pea protein market by source, type, application, form, and region over five years, ranging from 2024 to 2029.
  • To identify attractive opportunities in the market by determining the largest and fastest-growing segments across regions.
  • To analyze the demand-side factors based on the following:
    • Impact of macro and microeconomic factors on the market.
    • Shifts in demand patterns across different subsegments and regions.
  • To recognize the key drivers and restraints impacting the global pea protein market.

Competitive Intelligence

  • To profile the key players of the pea protein market and comprehensively analyze their market positions and core competencies
  • To provide a comparative analysis of the market leaders based on the following:
    • Product offerings
    • Business strategies
    • Strengths, weaknesses, opportunities, and threats
    • Key financials
  • To understand the competitive landscape and identify the major growth strategies adopted by players across the key regions
  • To provide insights on the key investments in product innovations and patent registrations

Available Customizations:

With the given market data, MarketsandMarkets offers customizations according to company-specific scientific needs.

The following customization options are available for the report:

Product Analysis

  • Product Matrix, which gives a detailed comparison of the product portfolio of each company.

Geographic Analysis

With the given market data, MarketsandMarkets offers customizations according to company-specific scientific needs.

  • Further breakdown of the Rest of European pea protein market, by key country
  • Further breakdown of the Rest of the South American pea protein market, by key country
  • Further breakdown of the Rest of Asia Pacific pea protein market, by key country

Company Information

  • Detailed analyses and profiling of additional market players

Previous Versions of this Report

Pea Protein Market by Type (Isolate, Concentrate, and Textured), Form (Dry and Wet), Source (Yellow Split Pea, Lentils and ChickPea), Application, and Region (North America, Europe, APAC, South America and ROW ) - Global Forecast to 2027

Report Code FB 2741
Published in Mar, 2022, By MarketsandMarkets™

Pea Protein Market by Type (Isolates, Concentrates, and Textured), Form (Dry and Wet), Source (Yellow split peas, Lentils, and Chickpeas), Application, and Region (North America, Europe, APAC, South America and RoW) - Global Forecast to 2026

Report Code FB 2741
Published in Dec, 2021, By MarketsandMarkets™

Pea Protein Market by Type (Isolates, Concentrates, and Textured), Form (Dry and Wet), Source (Yellow split peas, Lentils, and Chickpeas), Application, and Region (North America, Europe, Asia Pacific, South America, and Rest of the World) - Global Forecast to 2025

Report Code FB 2741
Published in Mar, 2020, By MarketsandMarkets™

Organic Pea Protein Market by Type (Isolates, Concentrates, Textured), Application (Nutritional supplements, Beverages, Meat extenders & analogs, Snacks & bakery products, and others), Form (Dry, Liquid), & Region - Global Trends & Forecast to 2021

Report Code FB 2741
Published in May, 2016, By MarketsandMarkets™

Pea Protein Market by Type (Isolates, Concentrates, Textured), Application (Meat extenders and analogs, Snacks & bakery products, Nutritional supplements, Beverages), Textured Pea Protein by Form (Dry, Wet), & Region - Global Trends & Forecast to 2020

Report Code FB 2741
Published in Nov, 2015, By MarketsandMarkets™

Pea Protein Market by Type [(Isolates, Concentrates, and Textured (Wet and Dry)], Application (Meat Extenders & Analogs, Snacks & Bakery Products, Nutritional Supplements, Beverages, and Others), & Geography - Global Trends & Forecasts to 2019

Report Code FB 2741
Published in Sep, 2014, By MarketsandMarkets™
"Our USP is "providing game-changing business opportunities reports with free customization" - so please feel free to provide us with your specific areas of interest / business challenges in much greater detail !!"

We appreciate your interest in this report. Once you fill out the form, you'll be immediately directed to an exclusive solution tailored to your needs. This high-value offering can help boost your revenue by 30% - a must-see opportunity for anyone looking to maximize growth.


By clicking the "Submit" button, you are agreeing to the Terms of Use and Privacy Policy.

Custom Market Research Services

We Will Customise The Research For You, In Case The Report Listed Above Does Not Meet With Your Requirements

Get 10% Free Customisation

Growth opportunities and latent adjacency in Pea Protein Market

DMCA.com Protection Status