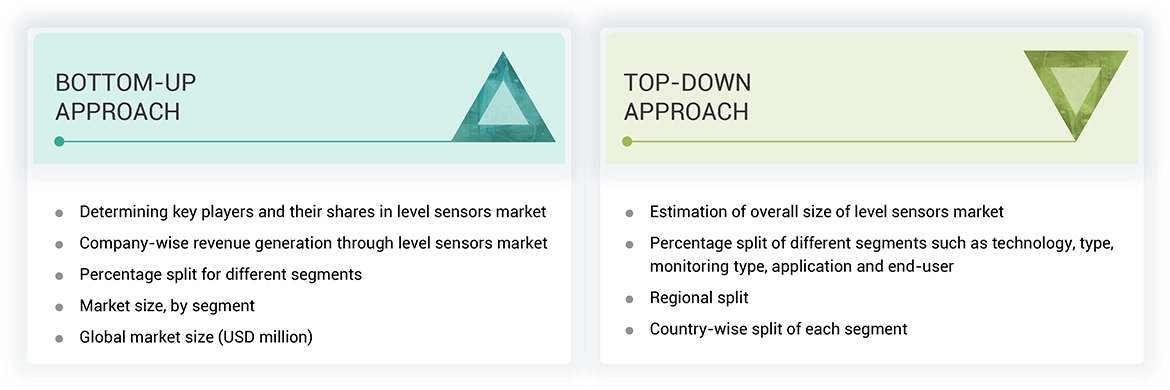
The study involved four major activities in estimating the current size of the level sensors market. Exhaustive secondary research has been done to collect information on the market, peer market, and parent market. To validate these findings, assumptions, and sizing with industry experts across the value chain through primary research has been the next step. Both top-down and bottom-up approaches have been employed to estimate the complete market size. After that, market breakdown and data triangulation methods have been used to estimate the market size of segments and subsegments. Two sources of information—secondary and primary—have been used to identify and collect information for an extensive technical and commercial study of the level sensors market.
Secondary Research
Various secondary sources have been referred to in the secondary research process to identify and collect information important for this study. The secondary sources include annual reports, press releases, and investor presentations of companies; white papers; journals and certified publications; and articles from recognized authors, websites, directories, and databases. Secondary research has been conducted to obtain key information about the industry’s supply chain, the market’s value chain, the total pool of key players, market segmentation according to the industry trends (to the bottom-most level), regional markets, and key developments from market- and technology-oriented perspectives. The secondary data has been collected and analyzed to determine the overall market size, further validated by primary research.
Primary Research
Extensive primary research was conducted after gaining knowledge about the current scenario of the level sensors market through secondary research. Several primary interviews were conducted with experts from the demand and supply sides across four major regions—North America, Europe, Asia Pacific and RoW. This primary data was collected through questionnaires, emails, and telephonic interviews.
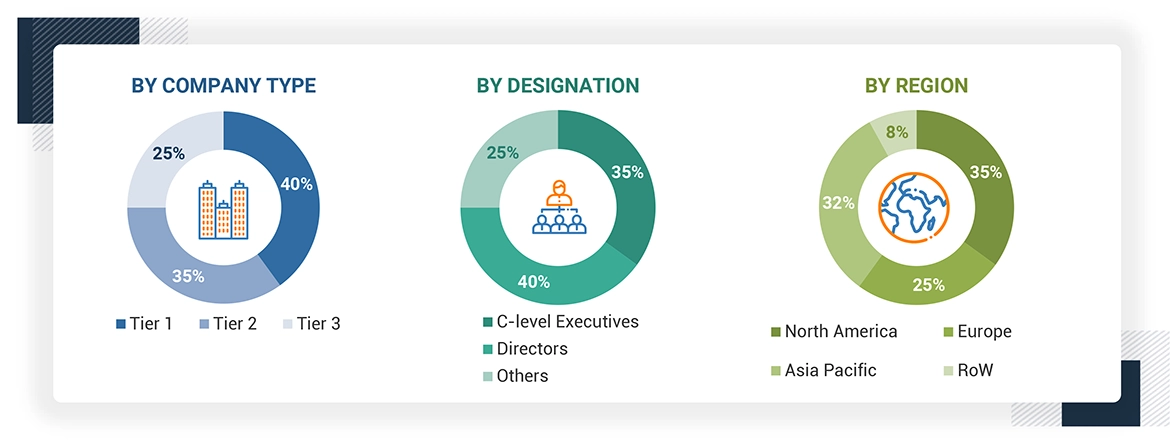
Note: The three tiers of the companies are defined based on their total revenue in 2023: Tier 1 - revenue greater than or equal to USD 1 billion; Tier 2 - revenue between USD 100 million and USD 1 billion; and Tier 3 revenue less than or equal to USD 100 million. Other designations include sales managers, marketing managers, and product managers.
About the assumptions considered for the study, To know download the pdf brochure


 HIGHEST CAGR MARKET IN 2024-2029
 INDIA FASTEST-GROWING MARKET IN THE REGION
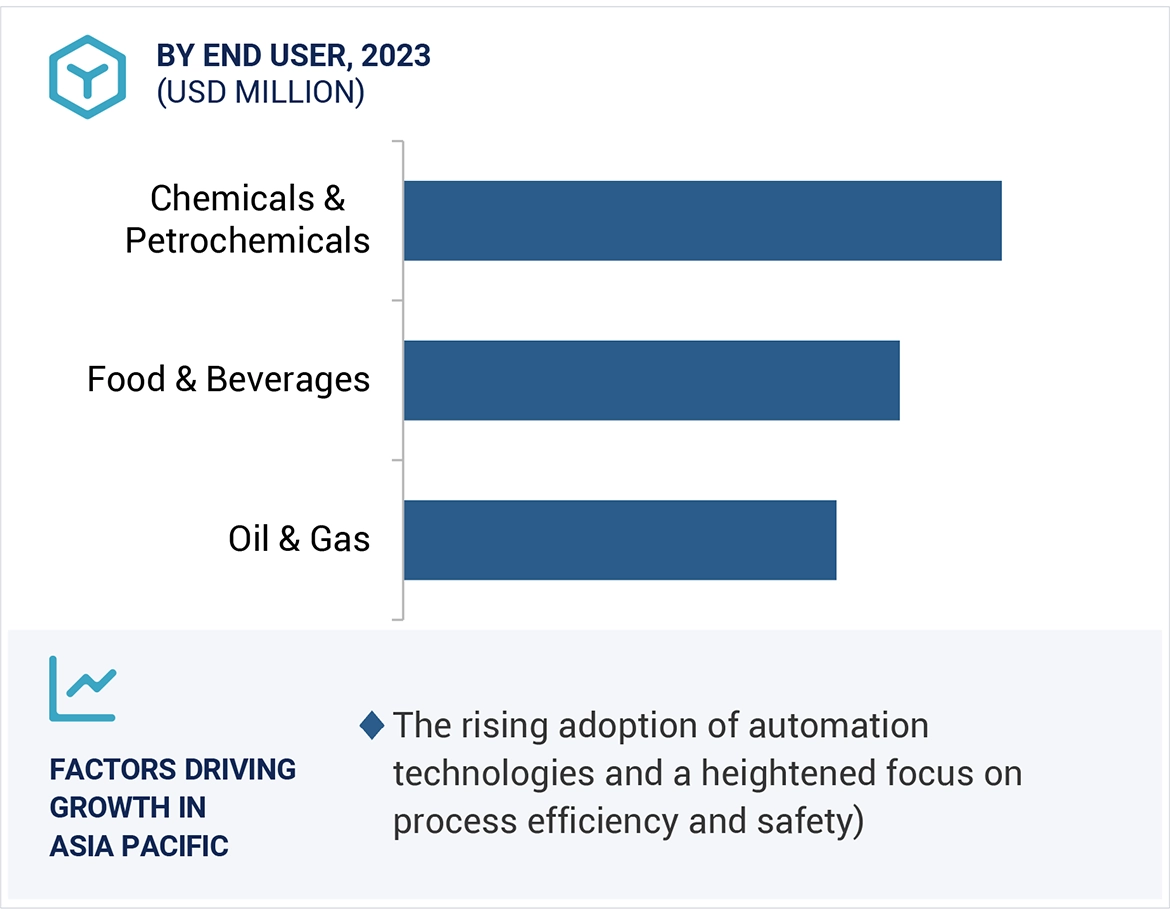


Marco
Sep, 2019
I am a student working on a project about level sensors and would like to use this document for some good inputs..
Martin
Feb, 2019
Looking for non-contacting radar level sensor market. And developments in IoT / wireless operating radar products to monitor levels of solids and liquids remotely..
Amritraj
Jan, 2015
I am specifically interested in the ultrasonic level sensing TAM numbers and we are now looking at different technologies to address level sensing applications..
Syed
Nov, 2016
Looking for Level Sensors Market by Technology[Contact Type and Non-Contact Type], End-User Industry, and Geography specifically UK..
david
Aug, 2015
I want more details on the end-use application section of level sensor market..
Yury
Jul, 2014
Interesting part for me is world distribution numbers of level sensors, like map or table with data on who are the first buyers..
Rachel
Jun, 2013
Is the Microwave/Radar category split into Contacting (Guided Wave) and Non-Contacting (Through Air) in the level sensor report?.
Rakesh
Mar, 2018
Can I get more details on what have you covered under monitoring section of the level sensor report?.
sudheendra.R
Feb, 2020
Wanted to know about the sensor commodity classification and also the off the shelf available supplier details..