Video Analytics Market by Offering, Application (Intrusion Management, Incident Detection, and Traffic Monitoring), Deployment Model, Type, Vertical (Critical Infrastructure, Government & Defense, and Manufacturing) and Region - Global Forecast to 2028
[312 Pages Report] The video analytics market size is expected to grow from USD 8.3 billion in 2023 to USD 22.6 billion by 2028 at a Compound Annual Growth Rate (CAGR) of 22.3% during the forecast period. Video analytics is gaining massive popularity, leading to the increasing adoption of video analytics software and services among governments and enterprises. The evolution of intelligent cameras and the rise of advanced technologies such as deep learning further add to the adoption of this software. Video analytics automates video analysis and alerts authorities in case of emergencies, thus eliminating the need for employee interactions. The edge-based architecture of video analytics coupled with intelligent cameras is expected to witness increased adoption due to its decreased latency. Several niche applications, such as aggression detection, are also developed in addition to regular video analytics applications, such as crowd counting or intrusion detection. The ability to offer multiple features such as intrusion detection, perimeter defense, camera tampering, loitering detection, tripwire counting, human traffic flow, people counting, crowd density, audience profiling, and face indexing have provided significant traction to the video analytics market. Various verticals such as critical infrastructure, government & defense, and transportation & logistics have opted for video analytics applications to increase security. High government investments in infrastructure modernization projects, such as smart city projects, are also expected to be critical adopters of video analytics software and services in the future.
To know about the assumptions considered for the study, Request for Free Sample Report
To know about the assumptions considered for the study, download the pdf brochure
Recession Impact on the Video Analytics Market
Various macroeconomic factors profoundly influence the global video analytics market, including recessions, rising interest rates, geopolitical tensions such as the Russia-Ukraine war, and inflation. During economic recessions, businesses across industries often face budget constraints, leading to a technological investment slowdown, including video analytics solutions. Rising interest rates can further exacerbate this situation by increasing the cost of capital for businesses, making them more cautious about adopting new technologies. The Russia-Ukraine war introduces geopolitical uncertainty, disrupting global supply chains and impacting the business environment. This uncertainty may lead to delayed decision-making and reduced investments in video analytics technologies as organizations prioritize stability. Moreover, inflationary pressures can increase business operational costs, potentially limiting their capacity to invest in advanced video analytics solutions. In such a challenging economic landscape, the video analytics market may experience a slowdown in growth as businesses navigate financial uncertainties and prioritize essential expenditures over technology upgrades.
Video Analytics Market Dynamics
Driver: Demand for enhanced video surveillance
With the increasing security concerns in various sectors, such as critical infrastructure, transportation, retail, and residential areas, a growing demand exists for more sophisticated and intelligent video surveillance solutions. These advanced video surveillance systems offer features like high-definition cameras, night vision capabilities, wide-angle lenses, and remote monitoring to provide a higher level of situational awareness and detailed event capturing. The need for enhanced security, reduced risk, and deterrence of criminal activities has made video analytics a crucial factor in the growth of the video analytics market. Furthermore, the rise of smart cities and the proliferation of IoT (Internet of Things) devices have fueled the demand for enhanced video surveillance to manage urban growth and improve overall safety. In urban environments, video analytics solutions offer real-time monitoring, crowd management, and traffic control. The ability to analyze video feeds to detect anomalies, identify potential threats, and provide data-driven insights has become indispensable. As a result, the video analytics market is rapidly evolving to meet this heightened demand by offering more sophisticated, integrated, and cost-effective surveillance solutions.
Restraint: Government regulations related to CCTV surveillance
Many countries and regions have introduced strict regulations to govern the use of surveillance cameras. These regulations aim to protect individuals' privacy rights and establish guidelines for the responsible use of video surveillance technology. Compliance with these regulations can be complex and costly, requiring organizations to invest in additional technology and personnel to ensure adherence to legal requirements. Failure to comply can result in legal consequences, fines, and reputational damage.
The need to navigate a complex web of regulations and maintain a transparent and ethical approach to video surveillance can deter potential users and limit the scope of applications for these technologies, particularly in sectors where privacy concerns are significant, such as healthcare and education. As the regulatory landscape continues to evolve, players in the video analytics market must remain vigilant and adaptable, which can be a challenge for vendors and users seeking to leverage the full potential of this technology.
Opportunity: Emergence of edge technologies and devices to increase the use of video analytics
Edge computing devices with powerful processors and AI capabilities are becoming more common and cost-effective; this allows video analytics to be performed directly on these edge devices without relying on centralized data centers and cloud computing. As a result, there is lower latency, faster real-time analysis, and reduced data transfer and storage costs, making video analytics more accessible and efficient for a wide range of applications. Moreover, edge-based video analytics is beneficial when immediate decision-making is crucial, such as in safety and security applications. Smart cameras and IoT sensors integrated into edge devices can analyze video feeds on-site, enabling quicker responses to events like intrusions, accidents, or anomalies. This improved responsiveness and efficiency enhance the overall utility of video analytics across various sectors, from smart cities and industrial automation to retail and healthcare. As the adoption of edge technologies continues to grow, the market for video analytics is poised to expand significantly, capitalizing on the advantages of real-time, localized processing.
Challenge: Interoperability complexities
Video analytics solutions often require integration with various hardware, software, and platforms, such as security cameras, access control systems, and data storage solutions. However, ensuring seamless communication and compatibility among these disparate components can be complex and time-consuming. The industry's lack of standardized protocols and interfaces further complicates interoperability, making it challenging for organizations to build cohesive, interconnected video analytics ecosystems.
Interoperability challenges can hinder the full realization of the potential benefits of video analytics. Inefficiencies, data silos, and compatibility issues can result in suboptimal system performance, increased maintenance costs, and difficulties in scaling the deployment. Moreover, these complexities can create barriers to innovation and customization, limiting the ability of organizations to adapt and evolve their video analytics solutions as their needs change.
Video Analytics Market Ecosystem
Based on application, the facial recognition segment will grow at a higher CAGR during the forecast period.
Facial recognition technology enables easy identification of individuals by comparing live images with digital images stored in a database. It is a vital aspect of video analytics software used for various purposes, such as access control and identifying wanted individuals. This technology is commonly used in physical stores to provide personalized solutions based on customers' previous interactions with the company. Loyal customers are identified using facial recognition and given special treatment during their next visit, resulting in improved customer satisfaction. Additionally, facial recognition can help place and monitor criminals inside stores, leading to improved operational performance and monitoring without increasing staff. In offices and government buildings, biometric facial recognition helps maintain secure access control. This technology reduces the risk of lost or misuse of stolen ID cards. Facial recognition is widely used worldwide in airports, crime investigation bodies, and law enforcement agencies.
Based on Vertical, the transportation & logistics segment is expected to grow at the highest CAGR during the forecast period.
The transportation and logistics industry covers all modes of travel, including airports, maritime, subways, railways, and other public transport. This industry faces various issues, such as accidents and crimes, and it is vital to have reliable insights during such emergencies. Video surveillance has become an essential part of the transportation and logistics industry. The various benefits of video analytics for this industry are the elimination of overcrowding, behavior analysis, enhanced safety measures, incident recording, and detection of blind spots. Video analytics can improve this industry for commuters while providing better safety benefits. The various features offered by video analytics, such as facial recognition, object tracking, unidentified object detection, cargo and train carriage recognition, and intelligent traffic monitoring, can help transportation and logistics companies prevent disasters and detect emerging threats that may lead to infrastructure destruction or vehicle crashes, resulting in the loss of life.
Based on Region, North America holds the largest market share during the forecast period.
The use of video analytics software in North America has increased due to significant investments in Information and Communication Technology (ICT), a higher focus on IT security, and investments in advanced security camera technologies. Many industry organizations use video analytics to improve safety, operational efficiency, and decision-making processes. North America has witnessed a surge in funding for advanced technologies like artificial intelligence and machine learning, which are vital in advancing video analytics capabilities. Companies are realizing the importance of integrating video analytics into their overall ICT strategies to gain actionable insights from visual data. Investments in security cameras, especially those with advanced features compatible with video analytics, have seen substantial growth in North America. Implementing the National Defense Authorization Act (NDAA)--compliant systems significantly influences organizations investing in security cameras that meet regulatory standards. For example, Honeywell's launch of the Pro-Watch Integrated Security Suite at Global Security Exchange (GSX) 2022, featuring Pro-Watch 6.0, Pro-Watch Video Management System (VMS) R750, and the 35 Series cameras, demonstrates the industry's commitment to providing comprehensive, compliant solutions. A convergence of technological advancements, sector-specific applications, and a growing awareness of the benefits of intelligent video analysis fuels adoption in North America.
Key Market Players
The video analytics market is dominated by a few globally established players such as Avigilion (Canada), Axis Communications (Sweden), Cisco (US), Honeywell International Inc. (US), and IBM (US), among others, are the key vendors that secured video processing platform contracts in last few years. These vendors can bring global processes and execution expertise; the local players only have local expertise. Driven by increased disposable incomes, easy access to knowledge, and fast adoption of technological products, buyers are more willing to experiment/test new things in the video analytics market.
Scope of Report
Report Metrics |
Details |
Market Size Available For Years |
2018–2028 |
Base Year Considered |
2022 |
Forecast Period |
2023–2028 |
Forecast Units |
Value (USD Million/Billion) |
Segments Covered |
Offering, Application, Deployment Model, Type, and Vertical |
Regions Covered |
North America, Europe, Asia Pacific, Middle East & Africa, and Latin America |
Companies Covered |
Avigilion (Canada), Axis Communications (Sweden), Cisco (US), Honeywell International Inc.( US), IBM (US), AllGoVision Technologies (India), Genetec Inc. (Canada), IntelliVision (US), Gorilla Technology (UK), Eagle Eye Networks (US), ADT (US), intuVision (US), Securitas AB (Sweden), and others |
This research report categorizes the video analytics market to forecast revenue and analyze trends in each of the following submarkets:
By Offering:
- Software
- Services
By Application:
- Incident Detection
- Intrusion Management
- People/Crowd Counting
- Traffic Monitoring
- Automatic Number Plate Recognition
- Facial Recognition
- Other Applications
By Deployment Model:
- Cloud
- On-premises
By Type:
- Server-based
- Edge-based
By Vertical:
- Banking, financial services, and insurance (BFSI)
- Critical Infrastructure
- Education
- Hospitality & Entertainment
- Manufacturing
- Government & Defense
- Retail
- Transportation & Logistics
- Other Verticals
By Region:
-
North America
- United States
- Canada
-
Europe
- United Kingdom
- Germany
- France
- Italy
- Spain
- Rest of Europe
-
Asia Pacific
- China
- Japan
- Australia and New Zealand
- India
- South Korea
- Rest of Asia Pacific
-
Middle East & Africa
-
GCC
- Saudi Arabia
- UAE
- Qatar
- Rest of the GCC Countries
- South Africa
- Rest of the Middle East & Africa
-
GCC
-
Latin America
- Brazil
- Mexico
- Rest of Latin America
Recent Developments:
- In March 2023, Motorola Solutions unveiled the Avigilon physical security suite, offering organizations worldwide secure, scalable, and flexible video security and access control solutions. The suite combines technologies from three strategic acquisitions: Avigilon, Openpath, and Ava Security, creating a comprehensive physical security platform under the modernized Avigilon brand. Powered by advanced analytics, the cloud-native Avigilon Alta and on-premises Avigilon Unity solutions aim to deliver an effortless user experience for enhanced security and control.
- In October 2022, IBM Intelligent Video Analytics version 2.5 introduced fresh cognitive video analysis features, enabling users to swiftly examine, categorize, and organize video content captured in real-time or from archived sources, including stationary and mobile cameras; this updated rapid and precise video analysis serves various industries, enabling organizations to unearth valuable insights, identify anomalies, and recognize patterns.
- In March 2022, Cisco Meraki unveiled an extended range of IoT and LAN solutions, incorporating innovative technologies to bolster the needs of global hybrid workforces, ensuring more intelligent and secure workplace settings. In today's fast-evolving business landscape, characterized by a shift toward digital-centric operations, ensuring exceptional user, employee, and customer experiences remains paramount. By expanding its technology offerings, Cisco Meraki makes it straightforward to provide these enhanced experiences by seamlessly integrating top-notch networking, security, and IoT capabilities.
- In April 2021, Axis Communications announced selling its subsidiary Citilog (France) to TagMaster (Sweden), an application-driven technology company with business areas including traffic and rail solutions.
Frequently Asked Questions (FAQ):
What is Video Analytics?
Video analytics is the technology used for computerized processing and analysis of video streams. It is also known as Video Content Analysis (VCA), intelligent video analysis, or video surveillance analytics. The video streams used for analysis are captured using various devices, such as network cameras, Digital Video Recorders (DVRs), and Network Video Recorders (NVRs). The captured video streams are then analyzed using video analytics software for various purposes, such as recognizing people, sending safety alerts, recognizing license plates, detecting unattended objects, and tracking footfalls.
Which country was the early adopter of video analytics software?
The US is at the initial stage of adopting video analytics software.
Which are the key vendors exploring Video Analytics Software ?
Some of the significant vendors offering video analytics software across the globe include Avigilion (Canada), Axis Communications (Sweden), Cisco (US), Honeywell International Inc.( US), IBM (US), AllGoVision Technologies (India), Genetec Inc. (Canada), IntelliVision (US), Gorilla Technology (UK), Eagle Eye Networks (US), ADT (US), intuVision (US), and Securitas AB (Sweden).
What is the total CAGR recorded for the Video analytics market during 2023-2028?
The Video analytics market will record a CAGR of 22.3% from 2023-2028
What is the projected market value of the video analytics market?
The video analytics market size will grow from USD 8.3 billion in 2023 to USD 22.6 billion by 2028 at a Compound Annual Growth Rate (CAGR) of 22.3% during the forecast period. .
To speak to our analyst for a discussion on the above findings, click Speak to Analyst
Exclusive indicates content/data unique to MarketsandMarkets and not available with any competitors.
- 5.1 INTRODUCTION
-
5.2 MARKET DYNAMICSDRIVERS- Increasing investments and focus of governing institutions on public safety- Need to utilize and examine unstructured video surveillance data in real time- Significant decrease in crime rate due to surveillance cameras- Growing need to leverage BI and actionable insights for advanced operations- Limitations of manual video analysis- Government initiatives to enhance public safety infrastructure- Reduced cost of video surveillance equipment and long-term ROI- Demand for enhanced video surveillanceRESTRAINTS- Increasing cyberattacks and data theft incidents- Government regulations related to CCTV surveillance- Investments in existing legacy surveillance systems to prevent adoption of new advanced solutions- Privacy concerns among citizensOPPORTUNITIES- Use of drone-based video analytics- Emergence of edge technologies and devices to increase use of video analytics- Predictive information using video analytics- Integration of AI and cloud technologies with video analytics- Surging demand for video analytics solutions in non-government sectors- Growing use of facial recognitionCHALLENGES- High initial costs of investment, installation, and maintenance- Interoperability complexities- Adverse weather conditions- Connectivity issues in isolated and remote locations- False alarms and lack of reliability
-
5.3 CASE STUDY ANALYSISCASE STUDY 1: TAITUNG COUNTY INCREASED POLICING AND INVESTIGATION EFFICIENCY WITH BRIEFCAM VIDEO ANALYTICS PLATFORMCASE STUDY 2: SEPHORA BEAUTY OFFERED REAL-TIME VISITOR STATISTICS BY DEPLOYING ALLGOVISION VIDEO ANALYTICSCASE STUDY 3: LINCOLN CENTER IMPROVED INCIDENT RESPONSE, ENHANCED GUEST EXPERIENCE, AND BOOSTED LAW ENFORCEMENT WITH GENETEC SECURITY CENTERCASE STUDY 4: BHARAT OMAN REFINERIES LIMITED OVERCAME SECURITY CHALLENGES IN OIL & GAS SECTOR WITH ALLGOVISION VIDEO ANALYTICS SOLUTIONCASE STUDY 5: EDUCATION INSTITUTE AUGMENTED VIDEO SEARCHABILITY DEPLOYING IDENTIV’S SOLUTIONS
- 5.4 VALUE CHAIN ANALYSIS
- 5.5 ECOSYSTEM/MARKET MAP
-
5.6 TECHNOLOGY ANALYSISKEY TECHNOLOGIES- Cybersecurity- Edge ComputingCOMPLEMENTARY TECHNOLOGIES- Big Data & Analytics- IoT- 5GADJACENT TECHNOLOGIES- Cloud Computing- AI/ML
-
5.7 PRICING ANALYSISAVERAGE SELLING PRICE (ASP) TREND OF KEY PLAYERS, BY SOFTWAREAVERAGE SELLING PRICE (ASP) OF VIDEO SURVEILLANCE CAMERAS: TOP 3 APPLICATIONSAVERAGE SELLING PRICE TREND, BY FORMINDICATIVE PRICING ANALYSIS
- 5.8 PATENT ANALYSIS
-
5.9 PORTER’S FIVE FORCES ANALYSISTHREAT OF NEW ENTRANTSTHREAT OF SUBSTITUTESBARGAINING POWER OF SUPPLIERSBARGAINING POWER OF BUYERSINTENSITY OF COMPETITIVE RIVALRY
-
5.10 REGULATORY LANDSCAPEREGULATORY BODIES, GOVERNMENT AGENCIES, AND OTHER ORGANIZATIONSREGULATIONS
- 5.11 TRENDS/DISRUPTIONS IMPACTING BUYERS
-
5.12 KEY STAKEHOLDERS & BUYING CRITERIAKEY STAKEHOLDERS IN BUYING PROCESSBUYING CRITERIA
- 5.13 BUSINESS MODEL ANALYSIS
- 5.14 KEY CONFERENCES AND EVENTS (2023 & 2024)
-
6.1 INTRODUCTIONOFFERING: VIDEO ANALYTICS MARKET DRIVERS
-
6.2 SOFTWARENEED TO COLLECT AND ANALYZE CRUCIAL DATA AND INTEGRATE WITH EXISTING CAMERAS TO DRIVE DEMAND FOR VIDEO ANALYTICS SOFTWAREVIDEO CONTENT ANALYSIS- Video content analysis to enhance security, operational efficiency, and decision-makingAI-DRIVEN VIDEO ANALYTICS- AI-driven video analytics to automatically detect and track people and vehicles and enhance security and surveillance
-
6.3 SERVICESVIDEO ANALYTICS SERVICES TO HELP IN REAL-TIME DATA CAPTURE AND VIDEO STREAM ANALYSISPROFESSIONAL SERVICES- Professional services to help businesses implement, manage, and derive value from video analytics solutions- Consulting- Integration & Implementation- Support & MaintenanceMANAGED SERVICES- Managed services to improve service quality, deliver speed, and enhance cost optimization and quality of service
-
7.1 INTRODUCTIONAPPLICATION: VIDEO ANALYTICS MARKET DRIVERS
-
7.2 INCIDENT DETECTIONINTELLIGENT TRAFFIC MANAGEMENT TO IDENTIFY AND ALERT UNUSUAL OR PREDEFINED EVENTS WITHIN VIDEO FOOTAGE
-
7.3 INTRUSION MANAGEMENTNEED TO IMPROVE SECURITY AND CRITICAL INFRASTRUCTURE TO FUEL DEMAND FOR INTRUSION MANAGEMENT
-
7.4 PEOPLE/CROWD COUNTINGNEED FOR REAL-TIME COUNTING OF VEHICLES AND PEOPLE AND MONITORING AND CONTROLLING CROWD TO DRIVE MARKET
-
7.5 TRAFFIC MONITORINGUNPRECEDENTED GROWTH OF CITY TRAFFIC LEVELS AND NEED TO PREVENT POTENTIAL ACCIDENTS AND OTHER SAFETY HAZARDS TO DRIVE MARKET
-
7.6 AUTOMATIC NUMBER PLATE RECOGNITIONANPR TO ENHANCE SECURITY, IMPROVE OPERATIONAL EFFICIENCY, AND SUPPORT VARIOUS APPLICATIONS IN TRANSPORTATION AND LAW ENFORCEMENT
-
7.7 FACIAL RECOGNITIONFACIAL RECOGNITION TO ACCESS CONTROL, IDENTIFY WANTED INDIVIDUALS, AND IMPROVE OPERATIONAL PERFORMANCE AND MONITORING
- 7.8 OTHER APPLICATIONS
-
8.1 INTRODUCTIONDEPLOYMENT MODEL: VIDEO ANALYTICS MARKET DRIVERS
-
8.2 ON-PREMISESON-PREMISES DEPLOYMENT TO HELP PROCESS SENSITIVE AND CONFIDENTIAL DATA VOLUMES AND REDUCE LATENCY
-
8.3 CLOUDCLOUD-BASED VIDEO ANALYTICS SOLUTIONS TO IMPROVE ACCURACY AND PROVIDE REAL-TIME MONITORING AND ALERTS AND BETTER UTILIZATION OF STAFF
-
9.1 INTRODUCTIONTYPE: VIDEO ANALYTICS MARKET DRIVERS
-
9.2 SERVER-BASEDNEED TO EMBED VIDEO ANALYTICS IN SPECIFIC SERVER AND TRACE AND ANALYZE VIDEO TO BOOST DEMAND FOR SERVER-BASED VIDEO ANALYTICS SOLUTIONS
-
9.3 EDGE-BASEDEDGE-BASED VIDEO ANALYTICS SOLUTIONS TO ALERT OPERATORS TO REAL-TIME VIDEO OR AUDIO EVENTS
-
10.1 INTRODUCTIONVERTICAL: VIDEO ANALYTICS MARKET DRIVERS
-
10.2 BANKING, FINANCIAL SERVICES, AND INSURANCE (BFSI)NEED FOR FRAUD PREVENTION, SECURITY AND SURVEILLANCE, AND ATM MONITORING AND MAINTENANCE TO DRIVE MARKETBFSI: APPLICATION AREASSECURITY & FRAUD DETECTIONATM MONITORING & PROTECTIONCUSTOMER EXPERIENCE AND QUEUE MANAGEMENTOTHER BFSI
-
10.3 CRITICAL INFRASTRUCTURECRITICAL INFRASTRUCTURE SOLUTIONS TO OFFER ASSET PROTECTION AND THEFT PREVENTION, PERIMETER SECURITY, AND FACIAL RECOGNITION FOR ACCESS CONTROLCRITICAL INFRASTRUCTURE: APPLICATION AREASPERIMETER SECURITY & INTRUSION DETECTIONACCESS CONTROL & IDENTITY VERIFICATIONSECURITY & THREAT ASSESSMENTOTHER CRITICAL INFRASTRUCTURE
-
10.4 EDUCATIONRISING DEMAND FOR INTRUSION DETECTION, CAMPUS SECURITY, AND VISITOR MANAGEMENT TO DRIVE MARKETEDUCATION: APPLICATION AREASSECURITY & SAFETYVISITOR MANAGEMENTACCESS CONTROL & IDENTITY VERIFICATIONOTHER EDUCATION
-
10.5 HOSPITALITY & ENTERTAINMENTNEED FOR ACCESS CONTROL AND IDENTITY VERIFICATION, SURVEILLANCE, AND PEOPLE COUNTING TO DRIVE MARKETHOSPITALITY & ENTERTAINMENT: APPLICATION AREASSECURITY & SURVEILLANCEFACIAL RECOGNITION & ACCESS CONTROLCROWD MANAGEMENTOTHER HOSPITALITY & ENTERTAINMENT
-
10.6 MANUFACTURINGNEED FOR OPERATIONAL MONITORING, QUALITY CONTROL, WORKPLACE SAFETY, AND SUPPLY CHAIN VISIBILITY TO PROPEL MARKETMANUFACTURING: APPLICATION AREASQUALITY CONTROL & INSPECTIONWORKER SAFETY & COMPLIANCEOTHER MANUFACTURING
-
10.7 GOVERNMENT & DEFENSERISING DEMAND FOR PERIMETER SECURITY, INTRUSION DETECTION, FACIAL RECOGNITION, AND CROWD MONITORING TO PROPEL MARKETGOVERNMENT & DEFENSE: APPLICATION AREASSECURITY & SURVEILLANCEFACIAL RECOGNITION & IDENTITY VERIFICATIONPERIMETER PROTECTIONOTHER GOVERNMENT & DEFENSE
-
10.8 RETAILNEED FOR FOOT TRAFFIC ANALYSIS, LOSS PREVENTION, QUEUE MANAGEMENT, AND FACIAL RECOGNITION FOR LOYALTY PROGRAMS TO PROPEL MARKETRETAIL: APPLICATION AREASLOSS PREVENTION & SECURITYQUEUE MANAGEMENTFACIAL RECOGNITION AND ACCESS CONTROL
-
10.9 TRANSPORTATION & LOGISTICSRISING DEMAND FOR VEHICLE AND CARGO TRACKING, LICENSE PLATE RECOGNITION, AND SECURITY SURVEILLANCE TO DRIVE MARKETTRANSPORTATION & LOGISTICS: APPLICATION AREASTRAFFIC MANAGEMENT & CONGESTION MONITORINGLICENSE PLATE RECOGNITION (LPR)OTHER TRANSPORTATION & LOGISTICS
- 10.10 OTHER VERTICALS
- 11.1 INTRODUCTION
-
11.2 NORTH AMERICANORTH AMERICA: VIDEO ANALYTICS MARKET DRIVERSNORTH AMERICA: RECESSION IMPACTUSCANADA
-
11.3 EUROPEEUROPE: VIDEO ANALYTICS MARKET DRIVERSEUROPE: RECESSION IMPACTUKGERMANYFRANCEITALYSPAINREST OF EUROPE
-
11.4 ASIA PACIFICASIA PACIFIC: VIDEO ANALYTICS MARKET DRIVERSASIA PACIFIC: RECESSION IMPACTCHINAJAPANAUSTRALIA & NEW ZEALANDINDIASOUTH KOREAREST OF ASIA PACIFIC
-
11.5 MIDDLE EAST & AFRICAMIDDLE EAST & AFRICA: VIDEO ANALYTICS MARKET DRIVERSMIDDLE EAST & AFRICA: RECESSION IMPACTGCC- Saudi Arabia- UAE- Qatar- Rest of GCC CountriesSOUTH AFRICAREST OF MIDDLE EAST & AFRICA
-
11.6 LATIN AMERICALATIN AMERICA: VIDEO ANALYTICS MARKET DRIVERSLATIN AMERICA: RECESSION IMPACTBRAZILMEXICOREST OF LATIN AMERICA
- 12.1 OVERVIEW
- 12.2 KEY PLAYER STRATEGIES/RIGHT TO WIN
- 12.3 REVENUE ANALYSIS
- 12.4 MARKET SHARE ANALYSIS
- 12.5 PRODUCT/BRAND COMPARISON
- 12.6 GLOBAL SNAPSHOT OF KEY MARKET PARTICIPANTS
-
12.7 COMPANY EVALUATION MATRIXSTARSEMERGING LEADERSPERVASIVE PLAYERSPARTICIPANTSCOMPANY FOOTPRINT
-
12.8 START-UP/SME EVALUATION MATRIXPROGRESSIVE COMPANIESRESPONSIVE VENDORSDYNAMIC COMPANIESSTARTING BLOCKSSTART-UPS/SMES FOOTPRINTCOMPETITIVE BENCHMARKING
- 12.9 COMPANY FINANCIAL METRICS
-
12.10 KEY MARKET DEVELOPMENTSPRODUCT LAUNCHES AND PRODUCT ENHANCEMENTSDEALS
- 13.1 INTRODUCTION
-
13.2 MAJOR PLAYERSAVIGILON- Business overview- Products/Solutions/Services offered- Recent developments- MnM viewAXIS COMMUNICATIONS- Business overview- Products/Solutions/Services offered- Recent developments- MnM viewCISCO- Business overview- Products/Solutions/Services offered- Recent developments- MnM viewHONEYWELL- Business overview- Products/Solutions/Services offered- Recent developments- MnM viewIBM- Business overview- Products/Solutions/Services offered- Recent developments- MnM viewALLGOVISION- Business overview- Products/Solutions/Services offered- Recent developmentsGENETEC- Business overview- Products/Solutions/Services offered- Recent developmentsINTELLIVISION- Business overview- Products/Solutions/Services offered- Recent developmentsGORILLA TECHNOLOGY- Business overview- Products/Solutions/Services offered- Recent developmentsEAGLE EYE NETWORKS- Business overview- Products/Solutions/Services offered- Recent developmentsADT- Business overview- Products/Solutions/Services offered- Recent developmentsINTUVISION- Business overview- Products/Solutions/Services offered- Recent developmentsSECURITAS- Business overview- Products/Solutions/Services offered- Recent developments
-
13.3 OTHER PLAYERSPURETECH SYSTEMSHIKVISIONDAHUA TECHNOLOGYIOMNISCIENTNECHUAWEIINTELLIGENT SECURITY SYSTEMSVERINT SYSTEMSVISEUMBRIEFCAMBOSCH SECURITY SYSTEMSI2VDIGITAL BARRIERSSENSTARQOGNIFYIDENTIVIPSOTEKDELOPT
-
13.4 SMES/START-UPSDRISHTINATIXDEEP NORTHCRONJMIOVISIONACTUATECALIPSACORSIGHT AIARCULESCAWAMOKOGNIZ
- 14.1 INTRODUCTION
- 14.2 LIMITATIONS
- 14.3 VIDEO ANALYTICS MARKET ECOSYSTEM AND ADJACENT MARKETS
-
14.4 FACIAL RECOGNITION MARKETFACIAL RECOGNITION MARKET, BY COMPONENTFACIAL RECOGNITION MARKET, BY APPLICATIONFACIAL RECOGNITION MARKET, BY VERTICALFACIAL RECOGNITION MARKET, BY REGION
-
14.5 STREAMING ANALYTICS MARKETSTREAMING ANALYTICS MARKET, BY COMPONENTSTREAMING ANALYTICS MARKET, BY APPLICATIONSTREAMING ANALYTICS MARKET, BY DEPLOYMENT MODESTREAMING ANALYTICS MARKET, BY ORGANIZATION SIZESTREAMING ANALYTICS MARKET, BY INDUSTRY VERTICALSTREAMING ANALYTICS MARKET, BY REGION
- 15.1 DISCUSSION GUIDE
- 15.2 KNOWLEDGESTORE: MARKETSANDMARKETS’ SUBSCRIPTION PORTAL
- 15.3 CUSTOMIZATION OPTIONS
- 15.4 RELATED REPORTS
- 15.5 AUTHOR DETAILS
- TABLE 1 USD EXCHANGE RATES, 2018–2022
- TABLE 2 FACTOR ANALYSIS
- TABLE 3 SINGLE UNIT PRICE OF VARIOUS FORMS OF ANALOG CAMERAS
- TABLE 4 SINGLE UNIT PRICE OF VARIOUS FORMS OF IP CAMERAS
- TABLE 5 INDICATIVE PRICING ANALYSIS OF VIDEO ANALYTICS SOLUTIONS
- TABLE 6 INDICATIVE PRICING ANALYSIS OF KEY PLAYERS, BY SOLUTION
- TABLE 7 TOP 10 PATENT APPLICANTS (US)
- TABLE 8 PORTER’S FIVE FORCES IMPACT ON VIDEO ANALYTICS
- TABLE 9 NORTH AMERICA: LIST OF REGULATORY BODIES, GOVERNMENT AGENCIES, AND OTHER ORGANIZATIONS
- TABLE 10 EUROPE: LIST OF REGULATORY BODIES, GOVERNMENT AGENCIES, AND OTHER ORGANIZATIONS
- TABLE 11 ASIA PACIFIC: LIST OF REGULATORY BODIES, GOVERNMENT AGENCIES, AND OTHER ORGANIZATIONS
- TABLE 12 REST OF THE WORLD: LIST OF REGULATORY BODIES, GOVERNMENT AGENCIES, AND OTHER ORGANIZATIONS
- TABLE 13 INFLUENCE OF STAKEHOLDERS ON BUYING PROCESS FOR END USERS (%)
- TABLE 14 KEY BUYING CRITERIA FOR END USERS
- TABLE 15 VIDEO ANALYTICS MARKET: DETAILED LIST OF CONFERENCES AND EVENTS, 2023–2024
- TABLE 16 VIDEO ANALYTICS MARKET, BY OFFERING, 2018–2022 (USD MILLION)
- TABLE 17 VIDEO ANALYTICS MARKET, BY OFFERING, 2023–2028 (USD MILLION)
- TABLE 18 SOFTWARE: VIDEO ANALYTICS MARKET, BY REGION, 2018–2022 (USD MILLION)
- TABLE 19 SOFTWARE: VIDEO ANALYTICS MARKET, BY REGION, 2023–2028 (USD MILLION)
- TABLE 20 SERVICES: VIDEO ANALYTICS MARKET, BY REGION, 2018–2022 (USD MILLION)
- TABLE 21 SERVICES: VIDEO ANALYTICS MARKET, BY REGION, 2023–2028 (USD MILLION)
- TABLE 22 VIDEO ANALYTICS MARKET, BY APPLICATION, 2018–2022 (USD MILLION)
- TABLE 23 VIDEO ANALYTICS MARKET, BY APPLICATION, 2023–2028 (USD MILLION)
- TABLE 24 INCIDENT DETECTION: VIDEO ANALYTICS MARKET, BY REGION, 2018–2022 (USD MILLION)
- TABLE 25 INCIDENT DETECTION: VIDEO ANALYTICS MARKET, BY REGION, 2023–2028 (USD MILLION)
- TABLE 26 INTRUSION MANAGEMENT: VIDEO ANALYTICS MARKET, BY REGION, 2018–2022 (USD MILLION)
- TABLE 27 INTRUSION MANAGEMENT: VIDEO ANALYTICS MARKET, BY REGION, 2023–2028 (USD MILLION)
- TABLE 28 PEOPLE/CROWD COUNTING: VIDEO ANALYTICS MARKET, BY REGION, 2018–2022 (USD MILLION)
- TABLE 29 PEOPLE/CROWD COUNTING: VIDEO ANALYTICS MARKET, BY REGION, 2023–2028 (USD MILLION)
- TABLE 30 TRAFFIC MONITORING: VIDEO ANALYTICS MARKET, BY REGION, 2018–2022 (USD MILLION)
- TABLE 31 TRAFFIC MONITORING: VIDEO ANALYTICS MARKET, BY REGION, 2023–2028 (USD MILLION)
- TABLE 32 AUTOMATIC NUMBER PLATE RECOGNITION: VIDEO ANALYTICS MARKET, BY REGION, 2018–2022 (USD MILLION)
- TABLE 33 AUTOMATIC NUMBER PLATE RECOGNITION: VIDEO ANALYTICS MARKET, BY REGION, 2023–2028 (USD MILLION)
- TABLE 34 FACIAL RECOGNITION: VIDEO ANALYTICS MARKET, BY REGION, 2018–2022 (USD MILLION)
- TABLE 35 FACIAL RECOGNITION: VIDEO ANALYTICS MARKET, BY REGION, 2023–2028 (USD MILLION)
- TABLE 36 OTHER APPLICATIONS: VIDEO ANALYTICS MARKET, BY REGION, 2018–2022 (USD MILLION)
- TABLE 37 OTHER APPLICATIONS: VIDEO ANALYTICS MARKET, BY REGION, 2023–2028 (USD MILLION)
- TABLE 38 VIDEO ANALYTICS MARKET, BY DEPLOYMENT MODEL, 2018–2022 (USD MILLION)
- TABLE 39 VIDEO ANALYTICS MARKET, BY DEPLOYMENT MODEL, 2023–2028 (USD MILLION)
- TABLE 40 ON-PREMISES: VIDEO ANALYTICS MARKET, BY REGION, 2018–2022 (USD MILLION)
- TABLE 41 ON-PREMISES: VIDEO ANALYTICS MARKET, BY REGION, 2023–2028 (USD MILLION)
- TABLE 42 CLOUD: VIDEO ANALYTICS MARKET, BY REGION, 2018–2022 (USD MILLION)
- TABLE 43 CLOUD: VIDEO ANALYTICS MARKET, BY REGION, 2023–2028 (USD MILLION)
- TABLE 44 VIDEO ANALYTICS MARKET, BY TYPE, 2018–2022 (USD MILLION)
- TABLE 45 VIDEO ANALYTICS MARKET, BY TYPE, 2023–2028 (USD MILLION)
- TABLE 46 SERVER-BASED: VIDEO ANALYTICS MARKET, BY REGION, 2018–2022 (USD MILLION)
- TABLE 47 SERVER-BASED: VIDEO ANALYTICS MARKET, BY REGION, 2023–2028 (USD MILLION)
- TABLE 48 EDGE-BASED: VIDEO ANALYTICS MARKET, BY REGION, 2018–2022 (USD MILLION)
- TABLE 49 EDGE-BASED: VIDEO ANALYTICS MARKET, BY REGION, 2023–2028 (USD MILLION)
- TABLE 50 VIDEO ANALYTICS MARKET, BY VERTICAL, 2018–2022 (USD MILLION)
- TABLE 51 VIDEO ANALYTICS MARKET, BY VERTICAL, 2023–2028 (USD MILLION)
- TABLE 52 BFSI: VIDEO ANALYTICS MARKET, BY REGION, 2018–2022 (USD MILLION)
- TABLE 53 BFSI: VIDEO ANALYTICS MARKET, BY REGION, 2023–2028 (USD MILLION)
- TABLE 54 CRITICAL INFRASTRUCTURE: VIDEO ANALYTICS MARKET, BY REGION, 2018–2022 (USD MILLION)
- TABLE 55 CRITICAL INFRASTRUCTURE: VIDEO ANALYTICS MARKET, BY REGION, 2023–2028 (USD MILLION)
- TABLE 56 EDUCATION: VIDEO ANALYTICS MARKET, BY REGION, 2018–2022 (USD MILLION)
- TABLE 57 EDUCATION: VIDEO ANALYTICS MARKET, BY REGION, 2023–2028 (USD MILLION)
- TABLE 58 HOSPITALITY & ENTERTAINMENT: VIDEO ANALYTICS MARKET, BY REGION, 2018–2022 (USD MILLION)
- TABLE 59 HOSPITALITY & ENTERTAINMENT: VIDEO ANALYTICS MARKET, BY REGION, 2023–2028 (USD MILLION)
- TABLE 60 MANUFACTURING: VIDEO ANALYTICS MARKET, BY REGION, 2018–2022 (USD MILLION)
- TABLE 61 MANUFACTURING: VIDEO ANALYTICS MARKET, BY REGION, 2023–2028 (USD MILLION)
- TABLE 62 GOVERNMENT & DEFENSE: VIDEO ANALYTICS MARKET, BY REGION, 2018–2022 (USD MILLION)
- TABLE 63 GOVERNMENT & DEFENSE: VIDEO ANALYTICS MARKET, BY REGION, 2023–2028 (USD MILLION)
- TABLE 64 RETAIL: VIDEO ANALYTICS MARKET, BY REGION, 2018–2022 (USD MILLION)
- TABLE 65 RETAIL: VIDEO ANALYTICS MARKET, BY REGION, 2023–2028 (USD MILLION)
- TABLE 66 TRANSPORTATION & LOGISTICS: VIDEO ANALYTICS MARKET, BY REGION, 2018–2022 (USD MILLION)
- TABLE 67 TRANSPORTATION & LOGISTICS: VIDEO ANALYTICS MARKET, BY REGION, 2023–2028 (USD MILLION)
- TABLE 68 OTHER VERTICALS: VIDEO ANALYTICS MARKET, BY REGION, 2018–2022 (USD MILLION)
- TABLE 69 OTHER VERTICALS: VIDEO ANALYTICS MARKET, BY REGION, 2023–2028 (USD MILLION)
- TABLE 70 VIDEO ANALYTICS MARKET, BY REGION, 2018–2022 (USD MILLION)
- TABLE 71 VIDEO ANALYTICS MARKET, BY REGION, 2023–2028 (USD MILLION)
- TABLE 72 NORTH AMERICA: VIDEO ANALYTICS MARKET, BY OFFERING, 2018–2022 (USD MILLION)
- TABLE 73 NORTH AMERICA: VIDEO ANALYTICS MARKET, BY OFFERING, 2023–2028 (USD MILLION)
- TABLE 74 NORTH AMERICA: VIDEO ANALYTICS MARKET, BY APPLICATION, 2018–2022 (USD MILLION)
- TABLE 75 NORTH AMERICA: VIDEO ANALYTICS MARKET, BY APPLICATION, 2023–2028 (USD MILLION)
- TABLE 76 NORTH AMERICA: VIDEO ANALYTICS MARKET, BY TYPE, 2018–2022 (USD MILLION)
- TABLE 77 NORTH AMERICA: VIDEO ANALYTICS MARKET, BY TYPE, 2023–2028 (USD MILLION)
- TABLE 78 NORTH AMERICA: VIDEO ANALYTICS MARKET, BY DEPLOYMENT MODEL, 2018–2022 (USD MILLION)
- TABLE 79 NORTH AMERICA: VIDEO ANALYTICS MARKET, BY DEPLOYMENT MODEL, 2023–2028 (USD MILLION)
- TABLE 80 NORTH AMERICA: VIDEO ANALYTICS MARKET, BY VERTICAL, 2018–2022 (USD MILLION)
- TABLE 81 NORTH AMERICA: VIDEO ANALYTICS MARKET, BY VERTICAL, 2023–2028 (USD MILLION)
- TABLE 82 NORTH AMERICA: VIDEO ANALYTICS MARKET, BY COUNTRY, 2018–2022 (USD MILLION)
- TABLE 83 NORTH AMERICA: VIDEO ANALYTICS MARKET, BY COUNTRY, 2023–2028 (USD MILLION)
- TABLE 84 US: VIDEO ANALYTICS MARKET, BY OFFERING, 2018–2022 (USD MILLION)
- TABLE 85 US: VIDEO ANALYTICS MARKET, BY OFFERING, 2023–2028 (USD MILLION)
- TABLE 86 US: VIDEO ANALYTICS MARKET, BY DEPLOYMENT MODEL, 2018–2022 (USD MILLION)
- TABLE 87 US: VIDEO ANALYTICS MARKET, BY DEPLOYMENT MODEL, 2023–2028 (USD MILLION)
- TABLE 88 CANADA: VIDEO ANALYTICS MARKET, BY OFFERING, 2018–2022 (USD MILLION)
- TABLE 89 CANADA: VIDEO ANALYTICS MARKET, BY OFFERING, 2023–2028 (USD MILLION)
- TABLE 90 CANADA: VIDEO ANALYTICS MARKET, BY DEPLOYMENT MODEL, 2018–2022 (USD MILLION)
- TABLE 91 CANADA: VIDEO ANALYTICS MARKET, BY DEPLOYMENT MODEL, 2023–2028 (USD MILLION)
- TABLE 92 EUROPE: VIDEO ANALYTICS MARKET, BY OFFERING, 2018–2022 (USD MILLION)
- TABLE 93 EUROPE: VIDEO ANALYTICS MARKET, BY OFFERING, 2023–2028 (USD MILLION)
- TABLE 94 EUROPE: VIDEO ANALYTICS MARKET, BY APPLICATION, 2018–2022 (USD MILLION)
- TABLE 95 EUROPE: VIDEO ANALYTICS MARKET, BY APPLICATION, 2023–2028 (USD MILLION)
- TABLE 96 EUROPE: VIDEO ANALYTICS MARKET, BY TYPE, 2018–2022 (USD MILLION)
- TABLE 97 EUROPE: VIDEO ANALYTICS MARKET, BY TYPE, 2023–2028 (USD MILLION)
- TABLE 98 EUROPE: VIDEO ANALYTICS MARKET, BY DEPLOYMENT MODEL, 2018–2022 (USD MILLION)
- TABLE 99 EUROPE: VIDEO ANALYTICS MARKET, BY DEPLOYMENT MODEL, 2023–2028 (USD MILLION)
- TABLE 100 EUROPE: VIDEO ANALYTICS MARKET, BY VERTICAL, 2018–2022 (USD MILLION)
- TABLE 101 EUROPE: VIDEO ANALYTICS MARKET, BY VERTICAL, 2023–2028 (USD MILLION)
- TABLE 102 EUROPE: VIDEO ANALYTICS MARKET, BY COUNTRY, 2018–2022 (USD MILLION)
- TABLE 103 EUROPE: VIDEO ANALYTICS MARKET, BY COUNTRY, 2023–2028 (USD MILLION)
- TABLE 104 UK: VIDEO ANALYTICS MARKET, BY OFFERING, 2018–2022 (USD MILLION)
- TABLE 105 UK: VIDEO ANALYTICS MARKET, BY OFFERING, 2023–2028 (USD MILLION)
- TABLE 106 UK: VIDEO ANALYTICS MARKET, BY DEPLOYMENT MODEL, 2018–2022 (USD MILLION)
- TABLE 107 UK: VIDEO ANALYTICS MARKET, BY DEPLOYMENT MODEL, 2023–2028 (USD MILLION)
- TABLE 108 GERMANY: VIDEO ANALYTICS MARKET, BY OFFERING, 2018–2022 (USD MILLION)
- TABLE 109 GERMANY: VIDEO ANALYTICS MARKET, BY OFFERING, 2023–2028 (USD MILLION)
- TABLE 110 GERMANY: VIDEO ANALYTICS MARKET, BY DEPLOYMENT MODEL, 2018–2022 (USD MILLION)
- TABLE 111 GERMANY: VIDEO ANALYTICS MARKET, BY DEPLOYMENT MODEL, 2023–2028 (USD MILLION)
- TABLE 112 FRANCE: VIDEO ANALYTICS MARKET, BY OFFERING, 2018–2022 (USD MILLION)
- TABLE 113 FRANCE: VIDEO ANALYTICS MARKET, BY OFFERING, 2023–2028 (USD MILLION)
- TABLE 114 FRANCE: VIDEO ANALYTICS MARKET, BY DEPLOYMENT MODEL, 2018–2022 (USD MILLION)
- TABLE 115 FRANCE: VIDEO ANALYTICS MARKET, BY DEPLOYMENT MODEL, 2023–2028 (USD MILLION)
- TABLE 116 ITALY: VIDEO ANALYTICS MARKET, BY OFFERING, 2018–2022 (USD MILLION)
- TABLE 117 ITALY: VIDEO ANALYTICS MARKET, BY OFFERING, 2023–2028 (USD MILLION)
- TABLE 118 ITALY: VIDEO ANALYTICS MARKET, BY DEPLOYMENT MODEL, 2018–2022 (USD MILLION)
- TABLE 119 ITALY: VIDEO ANALYTICS MARKET, BY DEPLOYMENT MODEL, 2023–2028 (USD MILLION)
- TABLE 120 SPAIN: VIDEO ANALYTICS MARKET, BY OFFERING, 2018–2022 (USD MILLION)
- TABLE 121 SPAIN: VIDEO ANALYTICS MARKET, BY OFFERING, 2023–2028 (USD MILLION)
- TABLE 122 SPAIN: VIDEO ANALYTICS MARKET, BY DEPLOYMENT MODEL, 2018–2022 (USD MILLION)
- TABLE 123 SPAIN: VIDEO ANALYTICS MARKET, BY DEPLOYMENT MODEL, 2023–2028 (USD MILLION)
- TABLE 124 REST OF EUROPE: VIDEO ANALYTICS MARKET, BY OFFERING, 2018–2022 (USD MILLION)
- TABLE 125 REST OF EUROPE: VIDEO ANALYTICS MARKET, BY OFFERING, 2023–2028 (USD MILLION)
- TABLE 126 REST OF EUROPE: VIDEO ANALYTICS MARKET, BY DEPLOYMENT MODEL, 2018–2022 (USD MILLION)
- TABLE 127 REST OF EUROPE: VIDEO ANALYTICS MARKET, BY DEPLOYMENT MODEL, 2023–2028 (USD MILLION)
- TABLE 128 ASIA PACIFIC: VIDEO ANALYTICS MARKET, BY OFFERING, 2018–2022 (USD MILLION)
- TABLE 129 ASIA PACIFIC: VIDEO ANALYTICS MARKET, BY OFFERING, 2023–2028 (USD MILLION)
- TABLE 130 ASIA PACIFIC: VIDEO ANALYTICS MARKET, BY APPLICATION, 2018–2022 (USD MILLION)
- TABLE 131 ASIA PACIFIC: VIDEO ANALYTICS MARKET, BY APPLICATION, 2023–2028 (USD MILLION)
- TABLE 132 ASIA PACIFIC: VIDEO ANALYTICS MARKET, BY TYPE, 2018–2022 (USD MILLION)
- TABLE 133 ASIA PACIFIC: VIDEO ANALYTICS MARKET, BY TYPE, 2023–2028 (USD MILLION)
- TABLE 134 ASIA PACIFIC: VIDEO ANALYTICS MARKET, BY DEPLOYMENT MODEL, 2018–2022 (USD MILLION)
- TABLE 135 ASIA PACIFIC: VIDEO ANALYTICS MARKET, BY DEPLOYMENT MODEL, 2023–2028 (USD MILLION)
- TABLE 136 ASIA PACIFIC: VIDEO ANALYTICS MARKET, BY VERTICAL, 2018–2022 (USD MILLION)
- TABLE 137 ASIA PACIFIC: VIDEO ANALYTICS MARKET, BY VERTICAL, 2023–2028 (USD MILLION)
- TABLE 138 ASIA PACIFIC: VIDEO ANALYTICS MARKET, BY COUNTRY, 2018–2022 (USD MILLION)
- TABLE 139 ASIA PACIFIC: VIDEO ANALYTICS MARKET, BY COUNTRY, 2023–2028 (USD MILLION)
- TABLE 140 CHINA: VIDEO ANALYTICS MARKET, BY OFFERING, 2018–2022 (USD MILLION)
- TABLE 141 CHINA: VIDEO ANALYTICS MARKET, BY OFFERING, 2023–2028 (USD MILLION)
- TABLE 142 CHINA: VIDEO ANALYTICS MARKET, BY DEPLOYMENT MODEL, 2018–2022 (USD MILLION)
- TABLE 143 CHINA: VIDEO ANALYTICS MARKET, BY DEPLOYMENT MODEL, 2023–2028 (USD MILLION)
- TABLE 144 JAPAN: VIDEO ANALYTICS MARKET, BY OFFERING, 2018–2022 (USD MILLION)
- TABLE 145 JAPAN: VIDEO ANALYTICS MARKET, BY OFFERING, 2023–2028 (USD MILLION)
- TABLE 146 JAPAN: VIDEO ANALYTICS MARKET, BY DEPLOYMENT MODEL, 2018–2022 (USD MILLION)
- TABLE 147 JAPAN: VIDEO ANALYTICS MARKET, BY DEPLOYMENT MODEL, 2023–2028 (USD MILLION)
- TABLE 148 AUSTRALIA & NEW ZEALAND: VIDEO ANALYTICS MARKET, BY OFFERING, 2018–2022 (USD MILLION)
- TABLE 149 AUSTRALIA & NEW ZEALAND: VIDEO ANALYTICS MARKET, BY OFFERING, 2023–2028 (USD MILLION)
- TABLE 150 AUSTRALIA & NEW ZEALAND: VIDEO ANALYTICS MARKET, BY DEPLOYMENT MODEL, 2018–2022 (USD MILLION)
- TABLE 151 AUSTRALIA & NEW ZEALAND: VIDEO ANALYTICS MARKET, BY DEPLOYMENT MODEL, 2023–2028 (USD MILLION)
- TABLE 152 INDIA: VIDEO ANALYTICS MARKET, BY OFFERING, 2018–2022 (USD MILLION)
- TABLE 153 INDIA: VIDEO ANALYTICS MARKET, BY OFFERING, 2023–2028 (USD MILLION)
- TABLE 154 INDIA: VIDEO ANALYTICS MARKET, BY DEPLOYMENT MODEL, 2018–2022 (USD MILLION)
- TABLE 155 INDIA: VIDEO ANALYTICS MARKET, BY DEPLOYMENT MODEL, 2023–2028 (USD MILLION)
- TABLE 156 SOUTH KOREA: VIDEO ANALYTICS MARKET, BY OFFERING, 2018–2022 (USD MILLION)
- TABLE 157 SOUTH KOREA: VIDEO ANALYTICS MARKET, BY OFFERING, 2023–2028 (USD MILLION)
- TABLE 158 SOUTH KOREA: VIDEO ANALYTICS MARKET, BY DEPLOYMENT MODEL, 2018–2022 (USD MILLION)
- TABLE 159 SOUTH KOREA: VIDEO ANALYTICS MARKET, BY DEPLOYMENT MODEL, 2023–2028 (USD MILLION)
- TABLE 160 REST OF ASIA PACIFIC: VIDEO ANALYTICS MARKET, BY OFFERING, 2018–2022 (USD MILLION)
- TABLE 161 REST OF ASIA PACIFIC: VIDEO ANALYTICS MARKET, BY OFFERING, 2023–2028 (USD MILLION)
- TABLE 162 REST OF ASIA PACIFIC: VIDEO ANALYTICS MARKET, BY DEPLOYMENT MODEL, 2018–2022 (USD MILLION)
- TABLE 163 REST OF ASIA PACIFIC: VIDEO ANALYTICS MARKET, BY DEPLOYMENT MODEL, 2023–2028 (USD MILLION)
- TABLE 164 MIDDLE EAST & AFRICA: VIDEO ANALYTICS MARKET, BY OFFERING, 2018–2022 (USD MILLION)
- TABLE 165 MIDDLE EAST & AFRICA: VIDEO ANALYTICS MARKET, BY OFFERING, 2023–2028 (USD MILLION)
- TABLE 166 MIDDLE EAST & AFRICA: VIDEO ANALYTICS MARKET, BY APPLICATION, 2018–2022 (USD MILLION)
- TABLE 167 MIDDLE EAST & AFRICA: VIDEO ANALYTICS MARKET, BY APPLICATION, 2023–2028 (USD MILLION)
- TABLE 168 MIDDLE EAST & AFRICA: VIDEO ANALYTICS MARKET, BY TYPE, 2018–2022 (USD MILLION)
- TABLE 169 MIDDLE EAST & AFRICA: VIDEO ANALYTICS MARKET, BY TYPE, 2023–2028 (USD MILLION)
- TABLE 170 MIDDLE EAST & AFRICA: VIDEO ANALYTICS MARKET, BY DEPLOYMENT MODEL, 2018–2022 (USD MILLION)
- TABLE 171 MIDDLE EAST & AFRICA: VIDEO ANALYTICS MARKET, BY DEPLOYMENT MODEL, 2023–2028 (USD MILLION)
- TABLE 172 MIDDLE EAST & AFRICA: VIDEO ANALYTICS MARKET, BY VERTICAL, 2018–2022 (USD MILLION)
- TABLE 173 MIDDLE EAST & AFRICA: VIDEO ANALYTICS MARKET, BY VERTICAL, 2023–2028 (USD MILLION)
- TABLE 174 MIDDLE EAST & AFRICA: VIDEO ANALYTICS MARKET, BY COUNTRY, 2018–2022 (USD MILLION)
- TABLE 175 MIDDLE EAST & AFRICA: VIDEO ANALYTICS MARKET, BY COUNTRY, 2023–2028 (USD MILLION)
- TABLE 176 GCC: VIDEO ANALYTICS MARKET, BY COUNTRY, 2018–2022 (USD MILLION)
- TABLE 177 GCC: VIDEO ANALYTICS MARKET, BY COUNTRY, 2023–2028 (USD MILLION)
- TABLE 178 SAUDI ARABIA: VIDEO ANALYTICS MARKET, BY OFFERING, 2018–2022 (USD MILLION)
- TABLE 179 SAUDI ARABIA: VIDEO ANALYTICS MARKET, BY OFFERING, 2023–2028 (USD MILLION)
- TABLE 180 SAUDI ARABIA: VIDEO ANALYTICS MARKET, BY DEPLOYMENT MODEL, 2018–2022 (USD MILLION)
- TABLE 181 SAUDI ARABIA: VIDEO ANALYTICS MARKET, BY DEPLOYMENT MODEL, 2023–2028 (USD MILLION)
- TABLE 182 UAE: VIDEO ANALYTICS MARKET, BY OFFERING, 2018–2022 (USD MILLION)
- TABLE 183 UAE: VIDEO ANALYTICS MARKET, BY OFFERING, 2023–2028 (USD MILLION)
- TABLE 184 UAE: VIDEO ANALYTICS MARKET, BY DEPLOYMENT MODEL, 2018–2022 (USD MILLION)
- TABLE 185 UAE: VIDEO ANALYTICS MARKET, BY DEPLOYMENT MODEL, 2023–2028 (USD MILLION)
- TABLE 186 QATAR: VIDEO ANALYTICS MARKET, BY OFFERING, 2018–2022 (USD MILLION)
- TABLE 187 QATAR: VIDEO ANALYTICS MARKET, BY OFFERING, 2023–2028 (USD MILLION)
- TABLE 188 QATAR: VIDEO ANALYTICS MARKET, BY DEPLOYMENT MODEL, 2018–2022 (USD MILLION)
- TABLE 189 QATAR: VIDEO ANALYTICS MARKET, BY DEPLOYMENT MODEL, 2023–2028 (USD MILLION)
- TABLE 190 REST OF GCC: VIDEO ANALYTICS MARKET, BY OFFERING, 2018–2022 (USD MILLION)
- TABLE 191 REST OF GCC: VIDEO ANALYTICS MARKET, BY OFFERING, 2023–2028 (USD MILLION)
- TABLE 192 REST OF GCC: VIDEO ANALYTICS MARKET, BY DEPLOYMENT MODEL, 2018–2022 (USD MILLION)
- TABLE 193 REST OF GCC: VIDEO ANALYTICS MARKET, BY DEPLOYMENT MODEL, 2023–2028 (USD MILLION)
- TABLE 194 SOUTH AFRICA: VIDEO ANALYTICS MARKET, BY OFFERING, 2018–2022 (USD MILLION)
- TABLE 195 SOUTH AFRICA: VIDEO ANALYTICS MARKET, BY OFFERING, 2023–2028 (USD MILLION)
- TABLE 196 SOUTH AFRICA: VIDEO ANALYTICS MARKET, BY DEPLOYMENT MODEL, 2018–2022 (USD MILLION)
- TABLE 197 SOUTH AFRICA: VIDEO ANALYTICS MARKET, BY DEPLOYMENT MODEL, 2023–2028 (USD MILLION)
- TABLE 198 REST OF MIDDLE EAST & AFRICA: VIDEO ANALYTICS MARKET, BY OFFERING, 2018–2022 (USD MILLION)
- TABLE 199 REST OF MIDDLE EAST & AFRICA: VIDEO ANALYTICS MARKET, BY OFFERING, 2023–2028 (USD MILLION)
- TABLE 200 REST OF MIDDLE EAST & AFRICA: VIDEO ANALYTICS MARKET, BY DEPLOYMENT MODEL, 2018–2022 (USD MILLION)
- TABLE 201 REST OF MIDDLE EAST & AFRICA: VIDEO ANALYTICS MARKET, BY DEPLOYMENT MODEL, 2023–2028 (USD MILLION)
- TABLE 202 LATIN AMERICA: VIDEO ANALYTICS MARKET, BY OFFERING, 2018–2022 (USD MILLION)
- TABLE 203 LATIN AMERICA: VIDEO ANALYTICS MARKET, BY OFFERING, 2023–2028 (USD MILLION)
- TABLE 204 LATIN AMERICA: VIDEO ANALYTICS MARKET, BY APPLICATION, 2018–2022 (USD MILLION)
- TABLE 205 LATIN AMERICA: VIDEO ANALYTICS MARKET, BY APPLICATION, 2023–2028 (USD MILLION)
- TABLE 206 LATIN AMERICA: VIDEO ANALYTICS MARKET, BY TYPE, 2018–2022 (USD MILLION)
- TABLE 207 LATIN AMERICA: VIDEO ANALYTICS MARKET, BY TYPE, 2023–2028 (USD MILLION)
- TABLE 208 LATIN AMERICA: VIDEO ANALYTICS MARKET, BY DEPLOYMENT MODEL, 2018–2022 (USD MILLION)
- TABLE 209 LATIN AMERICA: VIDEO ANALYTICS MARKET, BY DEPLOYMENT MODEL, 2023–2028 (USD MILLION)
- TABLE 210 LATIN AMERICA: VIDEO ANALYTICS MARKET, BY VERTICAL, 2018–2022 (USD MILLION)
- TABLE 211 LATIN AMERICA: VIDEO ANALYTICS MARKET, BY VERTICAL, 2023–2028 (USD MILLION)
- TABLE 212 LATIN AMERICA: VIDEO ANALYTICS MARKET, BY COUNTRY, 2018–2022 (USD MILLION)
- TABLE 213 LATIN AMERICA: VIDEO ANALYTICS MARKET, BY COUNTRY, 2023–2028 (USD MILLION)
- TABLE 214 BRAZIL: VIDEO ANALYTICS MARKET, BY OFFERING, 2018–2022 (USD MILLION)
- TABLE 215 BRAZIL: VIDEO ANALYTICS MARKET, BY OFFERING, 2023–2028 (USD MILLION)
- TABLE 216 BRAZIL: VIDEO ANALYTICS MARKET, BY DEPLOYMENT MODEL, 2018–2022 (USD MILLION)
- TABLE 217 BRAZIL: VIDEO ANALYTICS MARKET, BY DEPLOYMENT MODEL, 2023–2028 (USD MILLION)
- TABLE 218 MEXICO: VIDEO ANALYTICS MARKET, BY OFFERING, 2018–2022 (USD MILLION)
- TABLE 219 MEXICO: VIDEO ANALYTICS MARKET, BY OFFERING, 2023–2028 (USD MILLION)
- TABLE 220 MEXICO: VIDEO ANALYTICS MARKET, BY DEPLOYMENT MODEL, 2018–2022 (USD MILLION)
- TABLE 221 MEXICO: VIDEO ANALYTICS MARKET, BY DEPLOYMENT MODEL, 2023–2028 (USD MILLION)
- TABLE 222 REST OF LATIN AMERICA: VIDEO ANALYTICS MARKET, BY OFFERING, 2018–2022 (USD MILLION)
- TABLE 223 REST OF LATIN AMERICA: VIDEO ANALYTICS MARKET, BY OFFERING, 2023–2028 (USD MILLION)
- TABLE 224 REST OF LATIN AMERICA: VIDEO ANALYTICS MARKET, BY DEPLOYMENT MODEL, 2018–2022 (USD MILLION)
- TABLE 225 REST OF LATIN AMERICA: VIDEO ANALYTICS MARKET, BY DEPLOYMENT MODEL, 2023–2028 (USD MILLION)
- TABLE 226 OVERVIEW OF STRATEGIES ADOPTED BY KEY VIDEO ANALYTICS VENDORS
- TABLE 227 VIDEO ANALYTICS MARKET: DEGREE OF COMPETITION
- TABLE 228 VENDOR PRODUCTS/BRANDS COMPARISON
- TABLE 229 COMPANY REGION FOOTPRINT
- TABLE 230 COMPANY VERTICAL FOOTPRINT
- TABLE 231 COMPANY OFFERING FOOTPRINT
- TABLE 232 OVERALL COMPANY FOOTPRINT
- TABLE 233 START-UP/SME REGIONAL FOOTPRINT
- TABLE 234 START-UP/SME VERTICAL FOOTPRINT
- TABLE 235 START-UP/SME OFFERING FOOTPRINT
- TABLE 236 OVERALL START-UP/SME FOOTPRINT
- TABLE 237 VIDEO ANALYTICS MARKET: DETAILED LIST OF KEY START-UPS/SMES
- TABLE 238 VIDEO ANALYTICS MARKET: PRODUCT LAUNCHES
- TABLE 239 VIDEO ANALYTICS MARKET: DEALS
- TABLE 240 AVIGILON: COMPANY OVERVIEW
- TABLE 241 AVIGILON: PRODUCTS/SOLUTIONS/SERVICES OFFERED
- TABLE 242 AVIGILON: PRODUCT LAUNCHES AND ENHANCEMENTS
- TABLE 243 AVIGILON: DEALS
- TABLE 244 AVIGILON: OTHERS
- TABLE 245 AXIS COMMUNICATIONS: COMPANY OVERVIEW
- TABLE 246 AXIS COMMUNICATIONS: PRODUCTS/SOLUTIONS/SERVICES OFFERED
- TABLE 247 AXIS COMMUNICATIONS: PRODUCT LAUNCHES AND ENHANCEMENTS
- TABLE 248 AXIS COMMUNICATIONS: DEALS
- TABLE 249 AXIS COMMUNICATIONS: OTHERS
- TABLE 250 CISCO: COMPANY OVERVIEW
- TABLE 251 CISCO: PRODUCTS/SOLUTIONS/SERVICES OFFERED
- TABLE 252 CISCO: PRODUCT LAUNCHES AND ENHANCEMENTS
- TABLE 253 CISCO: DEALS
- TABLE 254 HONEYWELL: COMPANY OVERVIEW
- TABLE 255 HONEYWELL: PRODUCTS/SOLUTIONS/SERVICES OFFERED
- TABLE 256 HONEYWELL: PRODUCT LAUNCHES AND ENHANCEMENTS
- TABLE 257 HONEYWELL: DEALS
- TABLE 258 IBM: COMPANY OVERVIEW
- TABLE 259 IBM: PRODUCTS/SOLUTIONS/SERVICES OFFERED
- TABLE 260 IBM: PRODUCT LAUNCHES AND ENHANCEMENTS
- TABLE 261 ALLGOVISION: COMPANY OVERVIEW
- TABLE 262 ALLGOVISION: PRODUCTS/SOLUTIONS/SERVICES OFFERED
- TABLE 263 ALLGOVISION: PRODUCT LAUNCHES AND ENHANCEMENTS
- TABLE 264 ALLGOVISION: DEALS
- TABLE 265 GENETEC: COMPANY OVERVIEW
- TABLE 266 GENETEC: PRODUCTS/SOLUTIONS/SERVICES OFFERED
- TABLE 267 GENETEC: PRODUCT LAUNCHES AND ENHANCEMENTS
- TABLE 268 GENETEC: DEALS
- TABLE 269 GENETEC: OTHERS
- TABLE 270 INTELLIVISION: COMPANY OVERVIEW
- TABLE 271 INTELLIVISION: PRODUCTS/SERVICES OFFERED
- TABLE 272 INTELLIVISION: PRODUCT LAUNCHES AND ENHANCEMENTS
- TABLE 273 GORILLA TECHNOLOGY: COMPANY OVERVIEW
- TABLE 274 GORILLA TECHNOLOGY: PRODUCTS/SOLUTIONS/SERVICES OFFERED
- TABLE 275 GORILLA TECHNOLOGY: DEALS
- TABLE 276 EAGLE EYE NETWORKS: COMPANY OVERVIEW
- TABLE 277 EAGLE EYE NETWORKS: PRODUCTS/SOLUTIONS OFFERED
- TABLE 278 EAGLE EYE NETWORKS: PRODUCT LAUNCHES AND ENHANCEMENTS
- TABLE 279 EAGLE EYE NETWORKS: DEALS
- TABLE 280 EAGLE EYE NETWORKS: OTHERS
- TABLE 281 ADT: COMPANY OVERVIEW
- TABLE 282 ADT: PRODUCTS/SOLUTIONS/SERVICES OFFERED
- TABLE 283 ADT: DEALS
- TABLE 284 INTUVISION: BUSINESS OVERVIEW
- TABLE 285 INTUVISION: PRODUCTS/SOLUTIONS/SERVICES OFFERED
- TABLE 286 INTUVISION: DEALS
- TABLE 287 SECURITAS: COMPANY OVERVIEW
- TABLE 288 SECURITAS: PRODUCTS/SOLUTIONS/SERVICES OFFERED
- TABLE 289 SECURITAS: DEALS
- TABLE 290 ADJACENT MARKETS AND FORECASTS
- TABLE 291 FACIAL RECOGNITION MARKET, BY COMPONENT, 2014–2019 (USD MILLION)
- TABLE 292 FACIAL RECOGNITION MARKET, BY COMPONENT, 2019–2025 (USD MILLION)
- TABLE 293 FACIAL RECOGNITION MARKET, BY APPLICATION, 2014–2019 (USD MILLION)
- TABLE 294 FACIAL RECOGNITION MARKET, BY APPLICATION, 2019–2025 (USD MILLION)
- TABLE 295 FACIAL RECOGNITION MARKET, BY VERTICAL, 2014–2019 (USD MILLION)
- TABLE 296 FACIAL RECOGNITION MARKET, BY VERTICAL, 2019–2025 (USD MILLION)
- TABLE 297 FACIAL RECOGNITION MARKET, BY REGION, 2014–2019 (USD MILLION)
- TABLE 298 FACIAL RECOGNITION MARKET, BY REGION, 2019–2025 (USD MILLION)
- TABLE 299 STREAMING ANALYTICS MARKET, BY COMPONENT, 2015–2020 (USD MILLION)
- TABLE 300 STREAMING ANALYTICS MARKET, BY COMPONENT, 2021–2026 (USD MILLION)
- TABLE 301 STREAMING ANALYTICS MARKET, BY APPLICATION, 2015–2020 (USD MILLION)
- TABLE 302 STREAMING ANALYTICS MARKET, BY APPLICATION, 2021–2026 (USD MILLION)
- TABLE 303 STREAMING ANALYTICS MARKET, BY DEPLOYMENT MODE, 2015–2020 (USD MILLION)
- TABLE 304 STREAMING ANALYTICS MARKET, BY DEPLOYMENT MODE, 2021–2026 (USD MILLION)
- TABLE 305 STREAMING ANALYTICS MARKET, BY ORGANIZATION SIZE, 2015–2020 (USD MILLION)
- TABLE 306 STREAMING ANALYTICS MARKET, BY ORGANIZATION SIZE, 2021–2026 (USD MILLION)
- TABLE 307 STREAMING ANALYTICS MARKET, BY INDUSTRY VERTICAL, 2015–2020 (USD MILLION)
- TABLE 308 STREAMING ANALYTICS MARKET, BY INDUSTRY VERTICAL, 2021–2026 (USD MILLION)
- TABLE 309 STREAMING ANALYTICS MARKET, BY REGION, 2015–2020 (USD MILLION)
- TABLE 310 STREAMING ANALYTICS MARKET, BY REGION, 2021–2026 (USD MILLION)
- FIGURE 1 VIDEO ANALYTICS MARKET: RESEARCH DESIGN
- FIGURE 2 VIDEO ANALYTICS MARKET: DATA TRIANGULATION
- FIGURE 3 VIDEO ANALYTICS MARKET: TOP-DOWN AND BOTTOM-UP APPROACHES
- FIGURE 4 MARKET SIZE ESTIMATION METHODOLOGY: TOP-DOWN APPROACH
- FIGURE 5 MARKET SIZE ESTIMATION METHODOLOGY: BOTTOM-UP APPROACH
- FIGURE 6 VIDEO ANALYTICS MARKET: RESEARCH FLOW
- FIGURE 7 MARKET SIZE ESTIMATION METHODOLOGY: SUPPLY-SIDE ANALYSIS
- FIGURE 8 MARKET SIZE ESTIMATION METHODOLOGY: BOTTOM-UP APPROACH FROM SUPPLY SIDE – COLLECTIVE REVENUE OF VENDORS
- FIGURE 9 MARKET SIZE ESTIMATION METHODOLOGY – (SUPPLY SIDE): CAGR PROJECTIONS FROM SUPPLY SIDE
- FIGURE 10 VIDEO ANALYTICS MARKET: DEMAND-SIDE APPROACH
- FIGURE 11 FASTEST-GROWING SEGMENTS IN VIDEO ANALYTICS MARKET, 2023–2028
- FIGURE 12 SOFTWARE SEGMENT TO ACCOUNT FOR LARGER MARKET DURING FORECAST PERIOD
- FIGURE 13 INTRUSION MANAGEMENT SEGMENT TO ACCOUNT FOR LARGEST MARKET DURING FORECAST PERIOD
- FIGURE 14 ON-PREMISES SEGMENT TO ACCOUNT FOR LARGER MARKET DURING FORECAST PERIOD
- FIGURE 15 EDGE-BASED SEGMENT TO GROW AT HIGHER CAGR DURING FORECAST PERIOD
- FIGURE 16 GOVERNMENT & DEFENSE VERTICAL TO ACCOUNT FOR LARGEST MARKET DURING FORECAST PERIOD
- FIGURE 17 VIDEO ANALYTICS MARKET: REGIONAL ANALYSIS
- FIGURE 18 RISING NEED FOR CITY SURVEILLANCE AND IMPLEMENTATION OF SMART CITY INITIATIVES TO DRIVE MARKET
- FIGURE 19 SOFTWARE SEGMENT TO ACCOUNT FOR LARGER MARKET SHARE DURING FORECAST PERIOD
- FIGURE 20 INTRUSION MANAGEMENT TO ACCOUNT FOR LARGEST MARKET SHARE DURING FORECAST PERIOD
- FIGURE 21 SERVER-BASED SEGMENT TO ACCOUNT FOR LARGER MARKET SHARE DURING FORECAST PERIOD
- FIGURE 22 ON-PREMISES SEGMENT TO ACCOUNT FOR LARGER MARKET SHARE DURING FORECAST PERIOD
- FIGURE 23 BANKING, FINANCIAL SERVICES & INSURANCE (BFSI) VERTICAL TO ACCOUNT FOR LARGEST MARKET SHARE IN 2023
- FIGURE 24 ASIA PACIFIC TO EMERGE AS BEST MARKET FOR INVESTMENT IN NEXT FIVE YEARS
- FIGURE 25 DRIVERS, RESTRAINTS, OPPORTUNITIES, AND CHALLENGES: VIDEO ANALYTICS MARKET
- FIGURE 26 TOP TEN COUNTRIES WITH HIGHEST CRIME RATES IN 2022
- FIGURE 27 AVERAGE TOTAL COST OF DATA BREACH BY TOP FIVE INDUSTRIES
- FIGURE 28 TOP TEN USER GROUPS OF ARTIFICIAL INTELLIGENCE ACROSS ORGANIZATIONS, 2022
- FIGURE 29 TOP CLOUD INITIATIVES ACROSS ORGANIZATIONS, 2022
- FIGURE 30 VIDEO ANALYTICS MARKET: VALUE CHAIN ANALYSIS
- FIGURE 31 VIDEO ANALYTICS MARKET: ECOSYSTEM
- FIGURE 32 AVERAGE SELLING PRICE TREND OF KEY PLAYERS, BY SOFTWARE
- FIGURE 33 AVERAGE SELLING PRICE OF VIDEO SURVEILLANCE CAMERAS, TOP 3 APPLICATIONS
- FIGURE 34 LIST OF MAJOR PATENTS FOR VIDEO ANALYTICS
- FIGURE 35 TOP FIVE PATENT OWNERS (GLOBAL)
- FIGURE 36 VIDEO ANALYTICS MARKET: PORTER’S FIVE FORCES ANALYSIS
- FIGURE 37 REVENUE SHIFT FOR VIDEO ANALYTICS MARKET
- FIGURE 38 INFLUENCE OF STAKEHOLDERS ON BUYING PROCESS FOR TOP 2 END USERS
- FIGURE 39 KEY BUYING CRITERIA FOR END USERS
- FIGURE 40 VIDEO ANALYTICS MARKET: BUSINESS MODELS
- FIGURE 41 SERVICES SEGMENT TO GROW AT HIGHER CAGR DURING FORECAST PERIOD
- FIGURE 42 INTRUSION MANAGEMENT SEGMENT TO HOLD LARGEST MARKET DURING FORECAST PERIOD
- FIGURE 43 CLOUD SEGMENT TO GROW AT HIGHER CAGR DURING FORECAST PERIOD
- FIGURE 44 EDGE-BASED SEGMENT TO GROW AT HIGHER CAGR DURING FORECAST PERIOD
- FIGURE 45 VIDEO ANALYTICS MARKET: SERVER-BASED IMPLEMENTATION
- FIGURE 46 VIDEO ANALYTICS MARKET: EDGE-BASED IMPLEMENTATION
- FIGURE 47 GOVERNMENT & DEFENSE SEGMENT TO HOLD LARGEST MARKET DURING FORECAST PERIOD
- FIGURE 48 NORTH AMERICA TO HOLD LARGEST MARKET DURING FORECAST PERIOD
- FIGURE 49 NORTH AMERICA: MARKET SNAPSHOT
- FIGURE 50 ASIA PACIFIC: MARKET SNAPSHOT
- FIGURE 51 TOP 4 PLAYERS TO DOMINATE MARKET IN LAST 5 YEARS
- FIGURE 52 SHARE OF LEADING COMPANIES IN VIDEO ANALYTICS MARKET, 2022
- FIGURE 53 VIDEO ANALYTICS MARKET: GLOBAL SNAPSHOT OF KEY MARKET PARTICIPANTS, 2023
- FIGURE 54 COMPANY EVALUATION MATRIX FOR KEY PLAYERS: CRITERIA WEIGHTAGE
- FIGURE 55 GLOBAL VIDEO ANALYTICS MARKET: COMPANY EVALUATION MATRIX, 2022
- FIGURE 56 START-UP/SME EVALUATION MATRIX: CRITERIA WEIGHTAGE
- FIGURE 57 GLOBAL VIDEO ANALYTICS MARKET: START-UP/SME EVALUATION MATRIX, 2022
- FIGURE 58 VALUATION AND FINANCIAL METRICS
- FIGURE 59 AXIS COMMUNICATIONS: COMPANY SNAPSHOT
- FIGURE 60 CISCO: COMPANY SNAPSHOT
- FIGURE 61 HONEYWELL: COMPANY SNAPSHOT
- FIGURE 62 IBM: COMPANY SNAPSHOT
- FIGURE 63 GORILLA TECHNOLOGY: COMPANY SNAPSHOT
- FIGURE 64 ADT: COMPANY SNAPSHOT
- FIGURE 65 SECURITAS: COMPANY SNAPSHOT
The study involved four major activities in estimating the current video analytics market size. We performed extensive secondary research to collect information on the market, the competitive market, and the parent market. The next step was to validate these findings, assumptions, and sizing with industry experts across the value chain through primary research. Both top-down and bottom-up approaches were employed to estimate the complete market size. After that, we used the market breakup and data triangulation procedures to estimate the market size of the various segments in the video analytics market.
Secondary Research
This research study used extensive secondary sources, directories, and databases, such as D&B Hoovers, DiscoverOrg, Factiva, vendor data sheets, product demos, Cloud Computing Association (CCA), Vendor Surveys, Asia Cloud Computing Association, and The Software Alliance. We referred to these sources to identify and collect valuable information for this technical, market-oriented, and commercial study of the video analytics market.
Primary Research
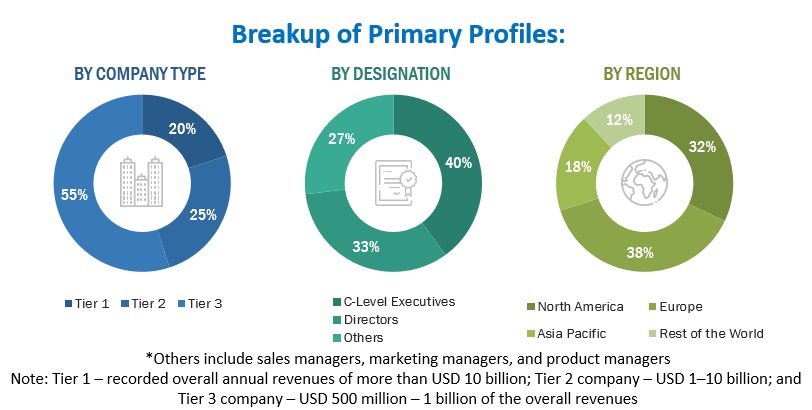
Primary sources were several industry experts from the core and related industries, preferred software providers, hardware manufacturers, distributors, service providers, technology developers, alliances, and organizations related to all segments of the industry's value chain. In-depth interviews were conducted with primary respondents, including key industry participants, subject-matter experts, C-level executives of key market players, and industry consultants, to obtain and verify critical qualitative and quantitative information and assess the market's prospects.
We conducted primary interviews to gather insights, such as market statistics, the latest trends disrupting the market, new use cases implemented, data on revenue collected from products and services, market breakups, market size estimations, market forecasts, and data triangulation. Primary research also helped understand various technology trends, segmentation types, industry trends, and regions. Demand-side stakeholders, such as Chief Information Officers (CIOs), Chief Technology Officers (CTOs), and Chief Security Officers (CSOs); the installation teams of governments/end users using video analytics software & services; and digital initiatives project teams, were interviewed to understand the buyer's perspective on suppliers, products, service providers, and their current use of services, which would affect the overall video analytics market.
To know about the assumptions considered for the study, download the pdf brochure
Market Size Estimation
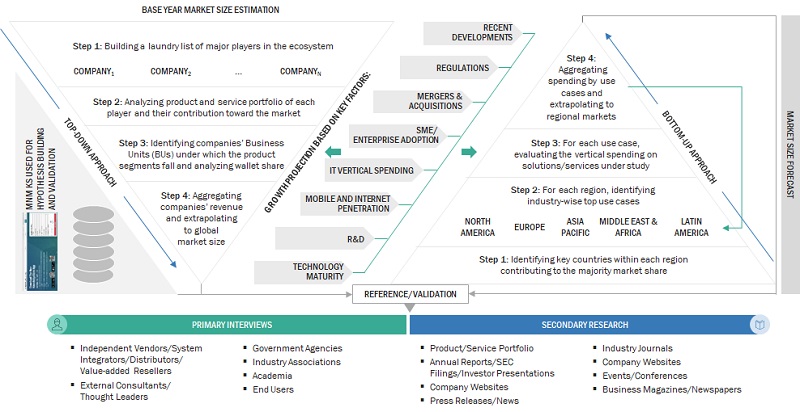
We used top-down and bottom-up approaches to estimate and forecast the video analytics market and other dependent submarkets. We deployed a bottom-up procedure to arrive at the overall market size using the revenues and offerings of key companies in the market. With data triangulation methods and validation through primary interviews, this study determined and confirmed the exact value of the overall parent market size. We used the overall market size in the top-down procedure to estimate the size of other individual markets via percentage splits of the market segments.
We used top-down and bottom-up approaches to estimate and validate the size of the video analytics market and various other dependent subsegments.
The research methodology used to estimate the market size included the following details:
- We identified key players in the market through secondary research. We then determined their revenue contributions in the respective countries through primary and secondary research.
- This entire procedure included studying top market players' annual and financial reports and extensive interviews for key insights from industry leaders, such as Chief Executive Officers (CEOs), VPs, directors, and marketing executives.
- All percentage splits and breakups were determined using secondary sources and verified through primary sources.
All the possible parameters that affect the market covered in this research study have been accounted for, viewed in extensive detail, verified through primary research, and analyzed to get the final quantitative and qualitative data. This data is consolidated and added with detailed inputs and analysis from MarketsandMarkets.
Video analytics market: Top-down and bottom-up approaches
Data Triangulation
The market was split into several segments and subsegments after arriving at the overall market size—using the market size estimation processes as explained above. Where applicable, data triangulation and market breakup procedures were employed to complete the overall market engineering process and arrive at the exact statistics of each market segment and subsegment. The data was triangulated by studying several factors and trends from both the demand and supply sides in the video analytics market.
Market Definition
Video analytics is the technology used for computerized processing and analysis of video streams. It is also known as Video Content Analysis (VCA), intelligent video analysis, or video surveillance analytics. The video streams used for analysis are captured using various devices, such as network cameras, Digital Video Recorders (DVRs), and Network Video Recorders (NVRs). The captured video streams are then analyzed using video analytics software for various purposes, such as recognizing people, sending safety alerts, recognizing license plates, detecting unattended objects, and tracking footfalls.
Key Stakeholders
- Video Analytics Software Providers
- Video Surveillance System Providers
- Video Management Software Providers
- Internet Service Providers (ISPs)
- Cloud Service Providers (CSPs)
- Security Camera Manufacturers
- System Integrators
- Networking Companies
- Third-party Providers
- Value-added Resellers (VARs)
- Government Agencies
- Law Enforcement Agencies
- Consultants/Consultancies/Advisory Firms
- Support and Maintenance Service Providers
- Artificial Intelligence (AI) Solutions Providers
- Facial Recognition Solution Providers
- Smart Initiatives Project Teams
Report Objectives
- To define, describe, and forecast the video analytics market based on offerings, applications, deployment models, types, industry verticals, and regions
- To forecast the market size of the five major regional segments: North America, Europe, Asia Pacific, Middle East & Africa, and Latin America
- To strategically analyze the market subsegments concerning individual growth trends, prospects, and contributions to the total market
- To provide detailed information related to the significant factors influencing the growth of the market (drivers, restraints, opportunities, and challenges)
- To strategically analyze the macro and micromarkets1 concerning growth trends, prospects, and their contributions to the overall market
- To analyze the industry trends, patents and innovations, and pricing data related to the video analytics market.
- To analyze the opportunities in the market for stakeholders and provide details of the competitive landscape for major players.
- To profile the key players in the market and comprehensively analyze their market share/ranking and core competencies across segments and subsegments.
- To track and analyze the competitive developments, such as mergers and acquisitions, product developments, and partnerships and collaborations in the market.
Available Customizations
With the given market data, MarketsandMarkets offers customizations per the company's specific needs. The following customization options are available for the report:
Product Analysis
- The product matrix provides a detailed comparison of the product portfolio of each company.
Geographic Analysis
- Further breakup of the Asia Pacific market into countries contributing 75% to the regional market size
- Further breakup of the North American market into countries contributing 75% to the regional market size
- Further breakup of the Latin American market into countries contributing 75% to the regional market size
- Further breakup of the Middle Eastern & African market into countries contributing 75% to the regional market size
- Further breakup of the European market into countries contributing 75% to the regional market size
Company Information
- Detailed analysis and profiling of additional market players (up to 5)
Growth opportunities and latent adjacency in Video Analytics Market