Automotive Transmission Market by Transmission Type (Manual Transmission, Automatic Transmission, CVT, DCT, AMT), Fuel Type, Vehicle Type, Hybrid Vehicle, Two-Wheeler Transmission, Number of Forward Gears and Region - Global Forecast to 2028
The global automotive transmission market size was valued at USD 62.4 billion in 2023 and is expected to reach USD 4.2 billion by 2028, at a CAGR of 6.2% during the forecast period. The growth in the market is primarily driven by technological advancements leading to more efficient transmission systems and stringent emissions regulations necessitating the adoption of fuel-efficient transmission solutions. Additionally, increasing vehicle production, rising demand for automatic transmissions, and the expanding market for electric and hybrid vehicles contribute to the market's growth.
To know about the assumptions considered for the study, Request for Free Sample Report
To know about the assumptions considered for the study, download the pdf brochure
Automotive Transmission Market Dynamics
DRIVER: Growing demand for lightweight transmission systems
The introduction of government regulations for safety, carbon emission, and lightweight vehicles is forcing OEMs to use components that will help in an overall weight reduction of the car. Technological advancements play a significant role, with the adoption of lightweight materials such as aluminum, magnesium, and high-strength steel composites in transmission components offering substantial weight reductions without compromising strength or durability. Additionally, additive manufacturing, such as 3D printing, enables the production of complex, lightweight transmission parts with optimized designs. Improved transmission architecture and gear designs further contribute to weight reduction.
Economically, lightweight transmissions offer several benefits. They enhanced fuel efficiency, lowering consumer operating costs and reducing CO2 emissions. Furthermore, weight reduction improves vehicle performance, including acceleration, handling, and braking. From a production standpoint, lighter components can reduce manufacturing costs due to decreased material usage and simplified manufacturing processes. Transmission suppliers invest in research and development to offer lighter, more efficient transmission solutions catering to the evolving automotive transmission systems market demand. Additionally, as the market diversifies with the increasing demand for electric and hybrid vehicles, there's a growing need for lightweight transmissions specifically designed for these powertrains.
RESTRAINT: High cost of adoption and frequent maintenance of advanced transmission systems
The high cost of adoption and maintenance of advanced transmission systems poses a significant barrier to their widespread acceptance. Systems like dual-clutch transmissions (DCTs) and continuously variable transmissions (CVTs) come with premium pricing due to their added complexity, limiting their appeal in cost-sensitive automotive transmission markets, particularly among small car buyers. Moreover, the complexity of these systems increases maintenance costs and requires specialized technicians, further deterring consumers concerned about long-term reliability and repair expenses. The lack of familiarity, fears of higher repair costs, and long-term durability uncertainty contribute to consumer aversion and preference for established transmission technologies.
Additionally, limited economies of scale and infrastructure challenges exacerbate the cost issue. The relatively low adoption rates of advanced systems hinder the realization of economies of scale, keeping production costs high. Moreover, the availability of skilled technicians and service infrastructure for these systems could be improved, particularly in certain regions, adding to maintenance complexities and consumer reluctance. Concerns about residual value also arise, impacting the resale market for vehicles equipped with advanced transmissions, as potential buyers weigh the perceived risks associated with higher maintenance costs and unknown long-term reliability.
OPPORTUNITY: Increasing adoption of automatic transmissions and development of hybrid drives
The automotive industry is witnessing a significant shift towards automatic transmissions, driven by urbanization, rising disposable income in developing automotive transmission markets, and technological advancements enhancing fuel efficiency and performance. Additionally, government regulations favoring lighter, more efficient vehicles and the integration of automatics with hybrid and electric powertrains further accelerate this trend. Furthermore, the increasing adoption of hybrid drives presents substantial growth opportunities fueled by environmental concerns, government incentives, and the potential for significant fuel savings and performance improvements. With expanding infrastructure and emerging markets, coupled with the potential synergy between automatic transmissions and autonomous driving systems, the future of the automotive industry is poised for transformative growth.
Moreover, opportunities extend beyond traditional markets, with emerging trends like car subscription services and personalized hybrid drive systems catering to evolving consumer preferences. As the industry continues to innovate and adapt to changing dynamics, embracing these opportunities will be crucial for stakeholders to stay competitive and capitalize on the growing demand for advanced transmission technologies and hybrid vehicles.
CHALLENGE: Reduction in costs for lightweight and efficient transmission
The dilemma faced by the automotive industry is between technological innovation and cost reduction. The automotive industry faces a crucial dilemma in harmonizing technological advancements with cost efficiency, particularly concerning lightweight and efficient transmission systems. While incorporating advanced materials like aluminum and carbon fiber composites shows potential for enhancing fuel economy and complying with emission standards, their higher costs pose significant obstacles. Manufacturing intricate components with these materials demands specialized techniques and equipment, further driving up production expenses. Additionally, challenges stemming from limited economies of scale and volatile raw material prices complicate efforts to attain cost competitiveness for lightweight transmission solutions.
To address these hurdles, substantial investments in research and development are imperative to spur innovation and streamline manufacturing processes. Moreover, optimizing supply chain logistics and establishing universal industry standards can bolster endeavors to reduce costs. However, effectively tackling consumer price sensitivity and ensuring accessible aftermarket support are essential considerations amidst fierce automotive transmission market competition and evolving regulatory landscapes. Striking the delicate balance between efficiency and affordability is a pivotal task for the automotive sector in surmounting the cost reduction challenge for lightweight and efficient transmission systems.
Automatic Transmission Market Ecosystem
The Automatic transmission segment is expected to be the most prominent automotive transmission market during the forecast period.
The manual transmission market is declining as it moves toward automated transmission technologies. The automatic transmission segment is poised to emerge as the most significant automotive transmission market in the future, driven by several key factors. Growing urbanization and rising disposable income in emerging automotive transmission markets propel demand for feature-rich vehicles, where automatic transmissions offer enhanced comfort and convenience, particularly in congested urban environments. Technological advancements, such as improved fuel efficiency and performance of modern automatics, address previous concerns and align with stringent government regulations promoting lighter, more efficient vehicles. Moreover, integrating automatic transmissions with hybrid and electric powertrains unlocks further efficiency gains, accelerating their adoption alongside shifting consumer preferences towards convenience and safety features.
Market trends further support the dominance of automatic transmissions, particularly in segments like SUVs and crossovers, where they are predominantly offered. Companies are working towards the development of transmissions. For instance, ZF is innovating transmission solutions tailored for electric and hybrid vehicles, incorporating features like multi-stage gear reduction for enhanced efficiency and optimized power delivery. They are also exploring two-speed transmission architectures to boost performance and range while investing in integrated electric drives to improve overall efficiency and sustainability. Continuous development of new automated technologies and customization options cater to diverse driving preferences, while the rapid growth in vehicle sales in developing countries presents significant opportunities for automotive automotic market expansion. However, challenges such as ensuring cost competitiveness, addressing maintenance complexities, and addressing consumer perception regarding reliability and repair costs remain crucial for maintaining the segment's sustained growth and leadership position.
The 6-8 Number of gears is projected to be the most prominent automotive transmission market during the forecast period.
These transmissions offer a balance of comfort, efficiency, and performance, making them increasingly favored by OEMs and consumers. With advancements in transmission technology, including lighter materials and optimized gear design, 6-8-speed transmissions can achieve superior fuel economy while maintaining durability and reliability. One of the key drivers of growth is the demand for improved fuel efficiency. The rising adoption of 6, 7, and 8-speed automatic transmissions is fueled by their fuel efficiency and performance enhancement benefits. These transmissions optimize fuel consumption, deliver smoother acceleration, and provide better control, especially in larger vehicles like SUVs.
Additionally, they offer improved driver comfort and convenience with smoother gear changes, integrated safety features, and options for a more engaging driving experience. More gears allow for better engine performance optimization across various speeds, which is particularly beneficial in urban driving conditions where frequent speed changes occur. Additionally, the enhanced performance provided by additional gears translates to smoother acceleration, quicker response times, and improved hill climbing ability, offering consumers a more dynamic driving experience.
Moreover, as fuel efficiency and emissions regulations become increasingly stringent, manufacturers are turning to transmissions with higher gear ratios to comply with these standards while meeting consumer expectations for performance and comfort. Furthermore, integrating 6-8 speed transmissions with hybrid and electric powertrains enhances their versatility and efficiency, making them an ideal choice for the evolving automotive landscape. Some of the companies offering 6-8-speed transmissions includes, VW Audi, BMW Mini, Stellantis Jeep, Porsche, Volvo, Mazda, etc. However, challenges such as higher transmission manufacturing complexity and costs and the need for skilled technicians for maintenance and repair must be addressed to ensure the continued growth and success of the 6-8-speed transmission segment in the automotive market.
The Asia Pacific automotive Transmission market is projected to hold the largest share by 2028
The Asia Pacific automotive transmission market is driven by robust growth, rising disposable incomes, and evolving consumer preferences favoring automatic transmissions. The region's rapid expansion in vehicle sales, particularly in countries like China and India, fuels demand for transmissions, with a notable shift towards automatics due to increasing urbanization and stringent government regulations on fuel efficiency and emissions. Localization efforts and cost competitiveness further propel this growth as international and domestic transmission manufacturers establish production facilities in APAC to cater to the growing market demand.
China dominates the APAC market, driven by its substantial automotive growth and demand for premium vehicles equipped with advanced transmissions. Meanwhile, the rise of smaller, fuel-efficient cars with automatic transmissions in India and Southeast Asia reflects shifting consumer preferences and urbanization trends. However, infrastructure development, consumer affordability, and intense market competition necessitate continuous innovation and strategic measures to maintain market leadership in the highly dynamic APAC automotive transmission landscape.
Key Market Players
The automotive transmission market companies are Aisin Corporation (Japan), ZF Friedrichshafen AG (Germany), Magna Iternational Inc. (Canada), JATCO Ltd. (Japan), Borgwarner Inc. (US), Eaton Corporation (Ireland), Hyundai Transys (South Korea), Allison transmissions (US), Vitesco Technologies (Germany), Schaeffler AG (Germany), GKN Automotive (UK), and more.
These companies adopted new product launches, partnerships, and joint ventures to gain traction in the automotive transmission market.
Want to explore hidden markets that can drive new revenue in Automotive Transmission Market?
Scope of the Report
Want to explore hidden markets that can drive new revenue in Automotive Transmission Market?
Report Metric |
Details |
The base year considered for estimation |
2022 |
Forecast period |
2023–2028 |
Market Growth and Revenue Forecast |
USD 84.2 Bn by 2028 at a CAGR of 6.2% |
Fastest Growing Market |
Latin America |
Largest Market |
Asia Pacific |
Forecast units |
Volume (Thousand Units) and Value (USD Million) |
Segments Covered |
Transmission Type, Number of forward gears, vehicle type, fuel type, Two-wheeler transmission type, Hybrid electric vehicle type and Region |
By Transmission Type |
Automatic Transmission, Automated Manual Transmission, Dual-Clutch Transmission, Continuously Variable Transmission, Manual Transmission. |
By Number of forward gears |
Up to 5, 6-8, 9-10, Above 10, CVT |
By Vehicle Type |
Passenger Car, LCVs, Trucks and Buses |
By Fuel Type |
Diesel, Gasoline, and Alternate fuel |
By Two-wheeler transmission |
Manual and Automatic |
By Region |
Asia Pacific, North America, Europe, Middle East, Africa and Latin America |
Companies Covered |
Aisin Corporation (Japan), ZF Friedrichshafen AG (Germany), Magna International Inc. (Canada), JATCO Ltd (Japan), Eaton Corporation (Ireland), Hyundai Transys (South Korea), Allison Transmissions (US), Schaeffler AG(Germany), BorgWarner Inc. (US), Vitesco Technologies (Germany), GKN Automotive(UK), and more. |
Along with the given market data, MarketsandMarkets offers customizations to the company’s specific needs.
Recent Developments
- In December 2023, ZF Friedrichshafen AG expanded the local production of transmissions and axles in Coimbatore, India. The expansion includes a new plant catering to domestic and selected export automotive transmission market. To fulfill customer expectations, the company aims to meet rising demands for intelligent systems, sustainable tech, and swift development cycles.
- In September 2023, Aisin Corporation presented a range of electrification technologies and innovations at the 2023 Detroit Auto Show. It includes advanced axles for enhanced energy efficiency, a 1-motor Hybrid Transmission, and a 2-motor Hybrid System for improved performance.
- In October 2022, Magna International Inc. and Stellantis developed a 48-volt hybrid dual-clutch transmission for the Jeep Renegade and Compass e-Hybrid. This 7-speed transmission delivers up to 320 Nm of torque and employs torque-split technology for optimized efficiency between the combustion engine and the e-motor.
- In July 2022, BluE Nexus, Aisin, and Denso collaborated on a 1-motor hybrid transmission for the new Toyota Crown Crossover RS version. This transmission combines a Direct Shift-6AT, drive motor, and inverter into a single unit, ensuring excellent acceleration and fuel efficiency.
- In May 2022, ZF Friedrichshafen AG developed the second generation of the EcoLife CoachLine, a 6-speed automatic transmission designed for urban, intercity, and mountainous routes. This transmission incorporates a start-stop function, delivering up to 3% fuel savings compared to the previous version.
- In March 2022, JATCO Ltd. introduced a novel surface machining technology for wet clutches, which offers increased stability, frictional characteristics, and durability. It is engaged in joint development with Tokuhatsu Co., Ltd. (Japan), leveraging micro press technology to prepare for mass production of AT, CVT, and e-axle for electrified vehicles.
Frequently Asked Questions (FAQ):
What is the current size of the global automotive transmission market?
The automotive transmission market is estimated to grow from USD 62.4 billion in 2023 to USD 84.2 billion by 2028 at a CAGR of 6.2% over the forecast period.
Which transmission type is currently leading the global automotive transmission market?
Automatic Transmissions are leading in the global automotive transmission market.
Many companies are operating in the global automotive transmission market space. Do you know who the front leaders are and what strategies they have adopted?
The automotive transmission market is dominated by a few globally established companies such as Aisin Corporation (Japan), ZF Friedrichshafen AG (Germany), Magna Iternational Inc. (Canada), JATCO Ltd. (Japan), Borgwarner Inc. (US), and Eaton Corporation (Ireland). These companies adopted new product launches, partnerships, and joint ventures to gain traction in the automotive transmission market.
How does the demand for the global automotive transmission market vary by region?
The Asia Pacific region is predicted to lead the automotive transmission market with a CAGR of 6.2%. The growing consumer demand for more convenient driving, growing demand for fuel-efficient vehicles, and the presence of some major market players in this region are some of the critical reasons for this region to also have the largest market for automotive transmissions, with USD 43,699 Million in 2028.
What are the growth opportunities for the global automotive transmission market supplier?
Developing automatic transmissions that are more fuel-efficient, lightweight, and affordable would create growth opportunities for the automotive transmission market. .
To speak to our analyst for a discussion on the above findings, click Speak to Analyst
Exclusive indicates content/data unique to MarketsandMarkets and not available with any competitors.
- 5.1 INTRODUCTION
-
5.2 MARKET DYNAMICSDRIVERS- Increasing consumer preference for enhanced driving experience and smooth gear shifting- Rising popularity of fuel-efficient cars- Growing demand for lightweight transmission systems- Collaboration of leading top automotive transmission manufacturers with domestic playersRESTRAINTS- High adoption cost and frequent maintenance of advanced transmission systems- Volatility in raw material pricesOPPORTUNITIES- Wide acceptance of CVT technology for fuel efficiency and lowering emissions- Increasing adoption of automatic transmissions and development of hybrid drives- Rising demand for electric vehicles- Growing need for transmission fluids in evolving automotive landscapeCHALLENGES- High cost of lightweight and efficient transmissions- Efficient power flow management
- 5.3 TRENDS/DISRUPTIONS IMPACTING CUSTOMER BUSINESS
-
5.4 PATENT ANALYSISINTRODUCTION
-
5.5 CASE STUDY ANALYSISLIFE CYCLE ASSESSMENT OF TRANSMISSION CASE: MAGNESIUM VS. ALUMINUMDESIGN ANALYSIS AND FABRICATION OF AUTOMOTIVE TRANSMISSION GEARBOX USING HOLLOW GEARS FOR WEIGHT REDUCTIONLIGHTWEIGHT ASSEMBLED GEARS: GREEN DESIGN SOLUTION FOR PASSENGER AND COMMERCIAL VEHICLESULTRA-LIGHTWEIGHT DESIGN OF SINGLE-SPEED TRANSMISSIONINTEGRATING PLANETARY DIFFERENTIAL FOR LIGHTER TRANSMISSION
-
5.6 TRADE ANALYSISIMPORT SCENARIOEXPORT SCENARIO
-
5.7 REGULATORY ANALYSISREGULATORY BODIES, GOVERNMENT AGENCIES, AND OTHER ORGANIZATIONS
-
5.8 ECOSYSTEM MAPAUTOMOTIVE EQUIPMENT SUPPLIERSAUTOMOTIVE TRANSMISSION MANUFACTURERSOEMSEND USERS
- 5.9 KEY CONFERENCES AND EVENTS
- 5.10 SUPPLY CHAIN ANALYSIS
- 5.11 PRICING ANALYSIS
-
5.12 KEY STAKEHOLDERS AND BUYING CRITERIAKEY STAKEHOLDERS IN BUYING PROCESSBUYING CRITERIA
-
5.13 TECHNOLOGICAL ANALYSISINTRODUCTIONDEDICATED HYBRID TRANSMISSION (DHT)800-VOLT POWER ELECTRONICS SYSTEM FOR ELECTRIC AXLESAUTOMATED MANUAL TRANSMISSIONELECTRIFICATION OF AUTOMOTIVE TRANSMISSIONINNOVATIVE GEARBOX DESIGN FOR ELECTRIC VEHICLESINGEAR 2-SPEED ELECTRIC VEHICLE TRANSMISSIONCVT TRANSMISSION FOR ELECTRIC VEHICLES
-
5.14 TOTAL COST OF OWNERSHIPAUTOMATIC TRANSMISSIONMANUAL TRANSMISSION
-
6.1 INTRODUCTIONOPERATIONAL DATAKEY INDUSTRY INSIGHTS
-
6.2 MANUAL TRANSMISSIONCONSUMER DEMAND FOR MORE ENGAGING DRIVING EXPERIENCE AND COST-EFFECTIVENESS TO DRIVE MARKET
-
6.3 AUTOMATIC TRANSMISSIONINCREASING DEMAND FOR CONVENIENCE, COMFORT, AND SMOOTH GEAR SHIFTING TO DRIVE MARKET
-
6.4 AUTOMATED MANUAL TRANSMISSIONCOST ADVANTAGES OFFERED BY AUTOMATED MANUAL TRANSMISSION TO DRIVE DEMAND IN ASIA PACIFIC
-
6.5 DUAL CLUTCH TRANSMISSIONINCREASING CONSUMER PREFERENCE FOR RESPONSIVE DRIVING EXPERIENCE TO DRIVE MARKET
-
6.6 CONTINUOUSLY VARIABLE TRANSMISSIONSMOOTHER OPERATION AND HIGHER FUEL ECONOMY TO DRIVE MARKET
-
7.1 INTRODUCTIONOPERATIONAL DATAKEY INDUSTRY INSIGHTS
-
7.2 DIESELHIGH FUEL EFFICIENCY AND INTEGRATION OF ADVANCED TRANSMISSIONS WITH DIESEL ENGINES TO DRIVE MARKET
-
7.3 GASOLINELIGHTER TRANSMISSION SYSTEMS IN GASOLINE CARS TO DRIVE MARKET
-
7.4 ALTERNATE FUELEMISSION REGULATIONS AND GOVERNMENT INCENTIVES TO DRIVE MARKET
-
8.1 INTRODUCTIONOPERATIONAL DATAINDUSTRY INSIGHTS
-
8.2 UP TO 5ENGINE DOWNSIZING TO REDUCE EMISSIONS TO HINDER MARKET GROWTH
-
8.3 6 TO 8GROWING DEMAND FOR FUEL EFFICIENCY TO DRIVE MARKET
-
8.4 9 TO 10DEMAND FOR HIGH PERFORMANCE, EFFICIENCY, AND DRIVING EXPERIENCE TO DRIVE MARKET
-
8.5 ABOVE 10HIGH DEMAND FOR HCVS WITH MANUAL TRANSMISSIONS IN ASIA PACIFIC TO DRIVE MARKET
-
8.6 CVTSMOOTH GEAR SHIFTING AND HIGH FUEL EFFICIENCY TO DRIVE MARKET
-
9.1 INTRODUCTIONOPERATIONAL DATAKEY INDUSTRY INSIGHTS
-
9.2 PASSENGER CARSGROWING DEMAND FOR FUEL-EFFICIENT VEHICLES TO DRIVE MARKET
-
9.3 LIGHT COMMERCIAL VEHICLESHIGH DEMAND IN NORTH AMERICA TO DRIVE MARKET
-
9.4 TRUCKSFUEL-SAVING AND DRIVER RETENTION BENEFITS TO DRIVE ADOPTION OF AMT AND AT SYSTEMS BY TRUCK COMPANIES
-
9.5 BUSESDRIVER PREFERENCE FOR ADVANCED AND RELIABLE TRANSMISSIONS TO DRIVE MARKET
-
10.1 INTRODUCTIONOPERATIONAL DATAKEY INDUSTRY INSIGHTS
- 10.2 AUTOMATIC TRANSMISSION
- 10.3 CVT TRANSMISSION
-
10.4 ASIA PACIFICPRESENCE OF MAJOR AUTOMAKERS TO DRIVE HYBRID VEHICLE ADOPTION
-
10.5 NORTH AMERICAGROWING ADOPTION OF HYBRID AND PLUG-IN HYBRID ELECTRIC VEHICLES TO DRIVE MARKET
-
10.6 EUROPEGOVERNMENT NORMS FOR CO2 REDUCTION AND INCREASE IN HYBRID VEHICLE ADOPTION DRIVE MARKET
-
11.1 INTRODUCTIONOPERATIONAL DATAINDUSTRY INSIGHTS
-
11.2 MANUAL TRANSMISSIONGROWING PREFERENCE FOR TWO-WHEELERS WITH CONVENTIONAL MANUAL SHIFTS TO DRIVE MARKET
-
11.3 AUTOMATIC TRANSMISSIONINCREASING PREFERENCE FOR COMFORT AND CONVENIENCE TO DRIVE MARKET
- 12.1 INTRODUCTION
-
12.2 ASIA PACIFICRECESSION IMPACTCHINA- Increasing traffic congestion and growing demand for electric vehicles to drive marketINDIA- Growing demand for passenger vehicles to drive marketJAPAN- Rising traffic congestion to drive marketSOUTH KOREA- Technological developments in automotive sector to drive marketTHAILAND- Tax exemption on import duties for raw materials to drive marketREST OF ASIA PACIFIC
-
12.3 EUROPERECESSION IMPACTGERMANY- Electrification of drivelines to drive marketFRANCE- Automatic transmissions to gain popularityITALY- Presence of major automotive companies to drive marketRUSSIA- Construction of new manufacturing facilities and investments in automotive industry to drive marketUK- Developments in automatic gearboxes and rising demand for electric vehicles to drive marketSPAIN- Rising production and exports of vehicles to drive marketREST OF EUROPE
-
12.4 NORTH AMERICARECESSION IMPACTCANADA- Increasing launch of electric vehicles to drive marketMEXICO- Growing demand for HCVs to drive marketUS- Rising sales of SUVs and pick-up trucks to drive market
-
12.5 LATIN AMERICABRAZIL- Growing adoption of DCTs and CVTs to impact marketARGENTINA- Increasing demand and supply of premium vehicles to drive marketREST OF LATIN AMERICA
-
12.6 MIDDLE EAST & AFRICAIRAN- Expansion of production lines for automatic gearboxes to drive marketSOUTH AFRICA- Growing demand for affordable automatic cars to decline manual transmission marketREST OF MIDDLE EAST & AFRICA
- 13.1 OVERVIEW
-
13.2 MARKET SHARE ANALYSISCVT MARKET SHARE ANALYSIS
- 13.3 REVENUE ANALYSIS
- 13.4 KEY PLAYERS’ STRATEGIES
-
13.5 COMPANY EVALUATION MATRIXSTARSEMERGING LEADERSPERVASIVE PLAYERSPARTICIPANTSCOMPANY FOOTPRINT
-
13.6 STARTUP/SME EVALUATION MATRIXPROGRESSIVE COMPANIESRESPONSIVE COMPANIESDYNAMIC COMPANIESSTARTING BLOCKSCOMPETITIVE BENCHMARKING
-
13.7 COMPETITIVE SCENARIOPRODUCT LAUNCHESDEALSEXPANSIONS
-
13.8 SUPPLIER ANALYSISMANUAL TRANSMISSIONAUTOMATIC TRANSMISSIONDUAL-CLUTCH TRANSMISSIONCONTINUOUSLY VARIABLE TRANSMISSION
- 13.9 PRODUCT COMPARISON
- 13.10 COMPANY VALUATION
-
14.1 KEY PLAYERSZF FRIEDRICHSHAFEN AG- Business overview- Products/Solutions/Services offered- Recent developments- MnM viewMAGNA INTERNATIONAL INC.- Business overview- Products/Solutions/Services offered- Recent developments- MnM viewAISIN CORPORATION- Business overview- Products/Solutions/Services offered- Recent developments- MnM viewEATON CORPORATION- Business overview- Products/Solutions/Services offered- Recent developments- MnM viewJATCO LTD.- Business overview- Products/Solutions/Services offered- Recent developments- MnM viewVITESCO TECHNOLOGIES- Business overview- Products/Solutions/Services offered- Recent developments- MnM viewSCHAEFFLER AG- Business overview- Products/Solutions/Services offered- Recent developmentsBORGWARNER INC.- Business overview- Products/Solutions/Services- Recent developmentsALLISON TRANSMISSION INC.- Business overview- Products/Solutions/Services offered- Recent developmentsGKN AUTOMOTIVE- Business overview- Products/Solutions/Services offered- Recent developmentsHYUNDAI TRANSYS- Business overview- Products/Solutions/Services offered- Recent developmentsDANA LIMITED- Business overview- Products/Solutions/Services offered- Recent developmentsWEICHAI POWER CO., LTD.- Business overview- Products/Solutions/Services offered- Recent developments
-
14.2 OTHER KEY PLAYERSGENERAL MOTORSKATE LLCMUHR UND BENDER KGSTARTRANSMISSION & STARASSEMBLYMACLEAN-FOGG COMPONENT SOLUTIONS, LLCMAZDAFORDDAIHATSUSUBARUTREMECPUNCH POWERTRAIN NVZEROSHIFTXTRAC LTD.
- 15.1 ASIA PACIFIC TO DOMINATE AUTOMOTIVE TRANSMISSION MARKET DURING FORECAST PERIOD
- 15.2 IVT TRANSMISSION FOR FUTURE APPLICATIONS - KEY FOCUS AREA
- 15.3 CONCLUSION
- 16.1 INSIGHTS FROM INDUSTRY EXPERTS
- 16.2 DISCUSSION GUIDE
- 16.3 KNOWLEDGESTORE: MARKETSANDMARKETS’ SUBSCRIPTION PORTAL
-
16.4 CUSTOMIZATION OPTIONSAUTOMOTIVE TRANSMISSION MARKET, BY FUEL TYPE & COUNTRY- Asia Pacific- Europe- North America- Latin America- Middle East & AfricaDETAILED ANALYSIS AND PROFILING OF ADDITIONAL MARKET PLAYERS (UP TO 3)
- 16.5 RELATED REPORTS
- 16.6 AUTHOR DETAILS
- TABLE 1 AUTOMOTIVE TRANSMISSION MARKET DEFINITION AND INCLUSIONS, BY TRANSMISSION TYPE
- TABLE 2 MARKET DEFINITION AND INCLUSIONS, BY VEHICLE TYPE
- TABLE 3 MARKET DEFINITION AND INCLUSIONS, BY HYBRID ELECTRIC VEHICLE TYPE
- TABLE 4 MARKET DEFINITION AND INCLUSIONS, BY FUEL TYPE
- TABLE 5 INCLUSIONS AND EXCLUSIONS FOR MARKET
- TABLE 6 CURRENCY EXCHANGE RATES
- TABLE 7 RESEARCH ASSUMPTIONS
- TABLE 8 RISK ASSESSMENT & RANGES
- TABLE 9 COMPARISON BETWEEN AT AND MT SYSTEMS
- TABLE 10 REDUCTION OF FUEL CONSUMPTION AND CO2 EMISSIONS
- TABLE 11 LIGHTWEIGHT MATERIALS FOR MODERN-DAY VEHICLES
- TABLE 12 COST ESTIMATION FOR TRANSMISSION SYSTEMS, DIESEL SEGMENT C, 2025
- TABLE 13 COMMODITY PRICES
- TABLE 14 TRANSMISSION TECHNOLOGIES AT DIFFERENT DEVELOPMENT STAGES IN CHINA
- TABLE 15 COMPARISON OF DIFFERENT FLUID TYPES OF AUTOMATIC TRANSMISSION SYSTEMS
- TABLE 16 AUTOMOTIVE TRANSMISSION MARKET: INNOVATIONS AND PATENT REGISTRATIONS
- TABLE 17 US: IMPORT SHARE, BY COUNTRY (VALUE %)
- TABLE 18 FRANCE: IMPORT SHARE, BY COUNTRY (VALUE %)
- TABLE 19 GERMANY: IMPORT SHARE, BY COUNTRY (VALUE %)
- TABLE 20 MEXICO: IMPORT SHARE, BY COUNTRY (VALUE %)
- TABLE 21 BELGIUM: IMPORT SHARE, BY COUNTRY (VALUE %)
- TABLE 22 US: EXPORT SHARE, BY COUNTRY (VALUE %)
- TABLE 23 FRANCE: EXPORT SHARE, BY COUNTRY (VALUE %)
- TABLE 24 GERMANY: EXPORT SHARE, BY COUNTRY (VALUE %)
- TABLE 25 MEXICO: EXPORT SHARE, BY COUNTRY (VALUE %)
- TABLE 26 BELGIUM: EXPORT SHARE, BY COUNTRY (VALUE %)
- TABLE 27 NORTH AMERICA: LIST OF REGULATORY BODIES, GOVERNMENT AGENCIES, AND OTHER ORGANIZATIONS
- TABLE 28 EUROPE: LIST OF REGULATORY BODIES, GOVERNMENT AGENCIES, AND OTHER ORGANIZATIONS
- TABLE 29 ASIA PACIFIC: LIST OF REGULATORY BODIES, GOVERNMENT AGENCIES, AND OTHER ORGANIZATIONS
- TABLE 30 REST OF THE WORLD: LIST OF REGULATORY BODIES, GOVERNMENT AGENCIES, AND OTHER ORGANIZATIONS
- TABLE 31 AUTOMOTIVE TRANSMISSION MARKET: ROLE OF COMPANIES IN ECOSYSTEM
- TABLE 32 MARKET: LIST OF KEY CONFERENCES AND EVENTS, 2024–2025
- TABLE 33 ASP OF AUTOMOTIVE TRANSMISSION, BY REGION, 2020–2023 (USD)
- TABLE 34 INFLUENCE OF STAKEHOLDERS ON BUYING PROCESS FOR AUTOMOTIVE TRANSMISSIONS (%)
- TABLE 35 KEY BUYING CRITERIA FOR AUTOMOTIVE TRANSMISSIONS
- TABLE 36 TOTAL COST OF OWNERSHIP OF AUTOMATIC AND MANUAL TRANSMISSIONS
- TABLE 37 DISTRIBUTION OF DUAL CLUTCH TRANSMISSION SOURCES FOR OEMS IN EUROPE
- TABLE 38 MARKET, BY TRANSMISSION TYPE, 2018–2022 (THOUSAND UNITS)
- TABLE 39 MARKET, BY TRANSMISSION TYPE, 2023–2028 (THOUSAND UNITS)
- TABLE 40 MARKET, BY TRANSMISSION TYPE, 2018–2022 (USD MILLION)
- TABLE 41 MARKET, BY TRANSMISSION TYPE, 2023–2028 (USD MILLION)
- TABLE 42 MANUAL TRANSMISSION MARKET, BY VEHICLE TYPE, 2018–2022 (THOUSAND UNITS)
- TABLE 43 MANUAL TRANSMISSION MARKET, BY VEHICLE TYPE, 2023–2028 (THOUSAND UNITS)
- TABLE 44 MANUAL TRANSMISSION MARKET, BY VEHICLE TYPE, 2018–2022 (USD MILLION)
- TABLE 45 MANUAL TRANSMISSION MARKET, BY VEHICLE TYPE, 2023–2028 (USD MILLION)
- TABLE 46 AUTOMATIC TRANSMISSION MARKET, BY VEHICLE TYPE, 2018–2022 (THOUSAND UNITS)
- TABLE 47 AUTOMATIC TRANSMISSION MARKET, BY VEHICLE TYPE, 2023–2028 (THOUSAND UNITS)
- TABLE 48 AUTOMATIC TRANSMISSION MARKET, BY VEHICLE TYPE, 2018–2022 (USD MILLION)
- TABLE 49 AUTOMATIC TRANSMISSION MARKET, BY VEHICLE TYPE, 2023–2028 (USD MILLION)
- TABLE 50 AUTOMATED MANUAL TRANSMISSION MARKET, BY VEHICLE TYPE, 2018–2022 (THOUSAND UNITS)
- TABLE 51 AUTOMATED MANUAL TRANSMISSION MARKET, BY VEHICLE TYPE, 2023–2028 (THOUSAND UNITS)
- TABLE 52 AUTOMATED MANUAL TRANSMISSION MARKET, BY VEHICLE TYPE, 2018–2022 (USD MILLION)
- TABLE 53 AUTOMATED MANUAL TRANSMISSION MARKET, BY VEHICLE TYPE, 2023–2028 (USD MILLION)
- TABLE 54 DUAL CLUTCH TRANSMISSION MARKET, BY VEHICLE TYPE, 2018–2022 (THOUSAND UNITS)
- TABLE 55 DUAL CLUTCH TRANSMISSION MARKET, BY VEHICLE TYPE, 2023–2028 (THOUSAND UNITS)
- TABLE 56 DUAL CLUTCH TRANSMISSION MARKET, BY VEHICLE TYPE, 2018–2022 (USD MILLION)
- TABLE 57 DUAL CLUTCH TRANSMISSION MARKET, BY VEHICLE TYPE, 2023–2028 (USD MILLION)
- TABLE 58 CONTINUOUSLY VARIABLE TRANSMISSION MARKET, BY VEHICLE TYPE, 2018–2022 (THOUSAND UNITS)
- TABLE 59 CONTINUOUSLY VARIABLE TRANSMISSION MARKET, BY VEHICLE TYPE, 2023–2028 (THOUSAND UNITS)
- TABLE 60 CONTINUOUSLY VARIABLE TRANSMISSION MARKET, BY VEHICLE TYPE, 2018–2022 (USD MILLION)
- TABLE 61 CONTINUOUSLY VARIABLE TRANSMISSION MARKET, BY VEHICLE TYPE, 2023–2028 (USD MILLION)
- TABLE 62 MARKET, BY FUEL TYPE, 2018–2022 (THOUSAND UNITS)
- TABLE 63 MARKET, BY FUEL TYPE, 2023–2028 (THOUSAND UNITS)
- TABLE 64 DIESEL: MARKET, BY REGION, 2018–2022 (THOUSAND UNITS)
- TABLE 65 DIESEL: MARKET, BY REGION, 2023–2028 (THOUSAND UNITS)
- TABLE 66 GASOLINE: MARKET, BY REGION, 2018–2022 (THOUSAND UNITS)
- TABLE 67 GASOLINE: MARKET, BY REGION, 2023–2028 (THOUSAND UNITS)
- TABLE 68 ALTERNATE FUEL: MARKET, BY REGION, 2018–2022 (THOUSAND UNITS)
- TABLE 69 ALTERNATE FUEL: MARKET, BY REGION, 2023–2028 (THOUSAND UNITS)
- TABLE 70 INDICATIVE LIST OF MODELS WITH >6 GEARS
- TABLE 71 MARKET, BY NUMBER OF FORWARD GEARS, 2018–2022 (THOUSAND UNITS)
- TABLE 72 MARKET, BY NUMBER OF FORWARD GEARS, 2023–2028 (THOUSAND UNITS)
- TABLE 73 UP TO 5: MARKET, BY REGION, 2018–2022 (THOUSAND UNITS)
- TABLE 74 UP TO 5: MARKET, BY REGION, 2023–2028 (THOUSAND UNITS)
- TABLE 75 6 TO 8: MARKET, BY REGION, 2018–2022 (THOUSAND UNITS)
- TABLE 76 6 TO 8: MARKET, BY REGION, 2023–2028 (THOUSAND UNITS)
- TABLE 77 9 TO 10: MARKET, BY REGION, 2018–2022 (THOUSAND UNITS)
- TABLE 78 9 TO 10: MARKET, BY REGION, 2023–2028 (THOUSAND UNITS)
- TABLE 79 ABOVE 10: MARKET, BY REGION, 2018–2022 (THOUSAND UNITS)
- TABLE 80 ABOVE 10: MARKET, BY REGION, 2023–2028 (THOUSAND UNITS)
- TABLE 81 CVT: AUTOMOTIVE TRANSMISSION MARKET, BY REGION, 2018–2022 (THOUSAND UNITS)
- TABLE 82 CVT: MARKET, BY REGION, 2023–2028 (THOUSAND UNITS)
- TABLE 83 MARKET, BY VEHICLE TYPE, 2018–2022 (THOUSAND UNITS)
- TABLE 84 MARKET, BY VEHICLE TYPE, 2023–2028 (THOUSAND UNITS)
- TABLE 85 MARKET, BY VEHICLE TYPE, 2018–2022 (USD MILLION)
- TABLE 86 MARKET, BY VEHICLE TYPE, 2023–2028 (USD MILLION)
- TABLE 87 PASSENGER CARS TRANSMISSION MARKET, BY TRANSMISSION TYPE, 2018–2022 (THOUSAND UNITS)
- TABLE 88 PASSENGER CARS TRANSMISSION MARKET, BY TRANSMISSION TYPE, 2023–2028 (THOUSAND UNITS)
- TABLE 89 PASSENGER CARS TRANSMISSION MARKET, BY TRANSMISSION TYPE, 2018–2022 (USD MILLION)
- TABLE 90 PASSENGER CARS TRANSMISSION MARKET, BY TRANSMISSION TYPE, 2023–2028 (USD MILLION)
- TABLE 91 LIGHT COMMERCIAL VEHICLES TRANSMISSION MARKET, BY TRANSMISSION TYPE, 2018–2022 (THOUSAND UNITS)
- TABLE 92 LIGHT COMMERCIAL VEHICLES TRANSMISSION MARKET, BY TRANSMISSION TYPE, 2023–2028 (THOUSAND UNITS)
- TABLE 93 LIGHT COMMERCIAL VEHICLES TRANSMISSION MARKET, BY TRANSMISSION TYPE, 2018–2022 (USD MILLION)
- TABLE 94 LIGHT COMMERCIAL VEHICLES TRANSMISSION MARKET, BY TRANSMISSION TYPE, 2023–2028 (USD MILLION)
- TABLE 95 TRUCKS TRANSMISSION MARKET, BY TRANSMISSION TYPE, 2018–2022 (THOUSAND UNITS)
- TABLE 96 TRUCKS TRANSMISSION MARKET, BY TRANSMISSION TYPE, 2023–2028 (THOUSAND UNITS)
- TABLE 97 TRUCKS TRANSMISSION MARKET, BY TRANSMISSION TYPE, 2018–2022 (USD MILLION)
- TABLE 98 TRUCKS TRANSMISSION MARKET, BY TRANSMISSION TYPE, 2023–2028 (USD MILLION)
- TABLE 99 BUS TRANSMISSION MARKET, BY TRANSMISSION TYPE, 2018–2022 (THOUSAND UNITS)
- TABLE 100 BUS TRANSMISSION MARKET, BY TRANSMISSION TYPE, 2023–2028 (THOUSAND UNITS)
- TABLE 101 BUS TRANSMISSION MARKET, BY TRANSMISSION TYPE, 2018–2022 (USD MILLION)
- TABLE 102 BUS TRANSMISSION MARKET, BY TRANSMISSION TYPE, 2023–2028 (USD MILLION)
- TABLE 103 MARKET FOR HYBRID ELECTRIC VEHICLES, BY REGION, 2018–2022 (THOUSAND UNITS)
- TABLE 104 MARKET FOR HYBRID ELECTRIC VEHICLES, BY REGION, 2023–2028 (THOUSAND UNITS)
- TABLE 105 ASIA PACIFIC: HYBRID ELECTRIC VEHICLES TRANSMISSION MARKET, BY TRANSMISSION TYPE, 2018–2022 (THOUSAND UNITS)
- TABLE 106 ASIA PACIFIC: HYBRID ELECTRIC VEHICLES TRANSMISSION MARKET, BY TRANSMISSION TYPE, 2023–2028 (THOUSAND UNITS)
- TABLE 107 NORTH AMERICA: HYBRID ELECTRIC VEHICLES TRANSMISSION MARKET, BY TRANSMISSION TYPE, 2018–2022 (THOUSAND UNITS)
- TABLE 108 NORTH AMERICA: HYBRID ELECTRIC VEHICLES TRANSMISSION MARKET, BY TRANSMISSION TYPE, 2023–2028 (THOUSAND UNITS)
- TABLE 109 EUROPE: HYBRID ELECTRIC VEHICLES TRANSMISSION MARKET, 2018–2022 (THOUSAND UNITS)
- TABLE 110 EUROPE: HYBRID ELECTRIC VEHICLES TRANSMISSION MARKET, 2023–2028 (THOUSAND UNITS)
- TABLE 111 TWO-WHEELERS AND THEIR FUEL ECONOMY
- TABLE 112 TWO-WHEELER TRANSMISSION MARKET, BY TYPE, 2018–2022 (THOUSAND UNITS)
- TABLE 113 TWO-WHEELER TRANSMISSION MARKET, BY TYPE, 2023–2028 (THOUSAND UNITS)
- TABLE 114 TWO-WHEELER MANUAL TRANSMISSION MARKET, BY REGION, 2018–2022 (THOUSAND UNITS)
- TABLE 115 TWO-WHEELER MANUAL TRANSMISSION MARKET, BY REGION, 2023–2028 (THOUSAND UNITS)
- TABLE 116 TWO-WHEELER AUTOMATIC TRANSMISSION MARKET, BY REGION, 2018–2022 (THOUSAND UNITS)
- TABLE 117 TWO-WHEELER AUTOMATIC TRANSMISSION MARKET, BY REGION, 2023–2028 (THOUSAND UNITS)
- TABLE 118 MARKET, BY REGION, 2018–2022 (THOUSAND UNITS)
- TABLE 119 MARKET, BY REGION, 2023–2028 (THOUSAND UNITS)
- TABLE 120 MARKET, BY REGION, 2018–2022 (USD MILLION)
- TABLE 121 MARKET, BY REGION, 2023–2028 (USD MILLION)
- TABLE 122 ASIA PACIFIC: MARKET, BY COUNTRY, 2018–2022 (THOUSAND UNITS)
- TABLE 123 ASIA PACIFIC: MARKET, BY COUNTRY, 2023–2028 (THOUSAND UNITS)
- TABLE 124 ASIA PACIFIC: MARKET, BY COUNTRY, 2018–2022 (USD MILLION)
- TABLE 125 ASIA PACIFIC: MARKET, BY COUNTRY, 2023–2028 (USD MILLION)
- TABLE 126 CHINA: MARKET, BY TRANSMISSION TYPE, 2018–2022 (THOUSAND UNITS)
- TABLE 127 CHINA: MARKET, BY TRANSMISSION TYPE, 2023–2028 (THOUSAND UNITS)
- TABLE 128 CHINA: MARKET, BY TRANSMISSION TYPE, 2018–2022 (USD MILLION)
- TABLE 129 CHINA: MARKET, BY TRANSMISSION TYPE, 2023–2028 (USD MILLION)
- TABLE 130 INDIA: MARKET, BY TRANSMISSION TYPE, 2018–2022 (THOUSAND UNITS)
- TABLE 131 INDIA: MARKET, BY TRANSMISSION TYPE, 2023–2028 (THOUSAND UNITS)
- TABLE 132 INDIA: MARKET, BY TRANSMISSION TYPE, 2018–2022 (USD MILLION)
- TABLE 133 INDIA: MARKET, BY TRANSMISSION TYPE, 2023–2028 (USD MILLION)
- TABLE 134 JAPAN: MARKET, BY TRANSMISSION TYPE, 2018–2022 (THOUSAND UNITS)
- TABLE 135 JAPAN: MARKET, BY TRANSMISSION TYPE, 2023–2028 (THOUSAND UNITS)
- TABLE 136 JAPAN: MARKET, BY TRANSMISSION TYPE, 2018–2022 (USD MILLION)
- TABLE 137 JAPAN: MARKET, BY TRANSMISSION TYPE, 2023–2028 (USD MILLION)
- TABLE 138 SOUTH KOREA: MARKET, BY TRANSMISSION TYPE, 2018–2022 (THOUSAND UNITS)
- TABLE 139 SOUTH KOREA: MARKET, BY TRANSMISSION TYPE, 2023–2028 (THOUSAND UNITS)
- TABLE 140 SOUTH KOREA: MARKET, BY TRANSMISSION TYPE, 2018–2022 (USD MILLION)
- TABLE 141 SOUTH KOREA: MARKET, BY TRANSMISSION TYPE, 2023–2028 (USD MILLION)
- TABLE 142 THAILAND: MARKET, BY TRANSMISSION TYPE, 2018–2022 (THOUSAND UNITS)
- TABLE 143 THAILAND: MARKET, BY TRANSMISSION TYPE, 2023–2028 (THOUSAND UNITS)
- TABLE 144 THAILAND: MARKET, BY TRANSMISSION TYPE, 2018–2022 (USD MILLION)
- TABLE 145 THAILAND: MARKET, BY TRANSMISSION TYPE, 2023–2028 (USD MILLION)
- TABLE 146 REST OF ASIA PACIFIC: MARKET, BY TRANSMISSION TYPE, 2018–2022 (THOUSAND UNITS)
- TABLE 147 REST OF ASIA PACIFIC: MARKET, BY TRANSMISSION TYPE, 2023–2028 (THOUSAND UNITS)
- TABLE 148 REST OF ASIA PACIFIC: MARKET, BY TRANSMISSION TYPE, 2018–2022 (USD MILLION)
- TABLE 149 REST OF ASIA PACIFIC: MARKET, BY TRANSMISSION TYPE, 2023–2028 (USD MILLION)
- TABLE 150 EUROPE: MARKET, BY COUNTRY, 2018–2022 (THOUSAND UNITS)
- TABLE 151 EUROPE: MARKET, BY COUNTRY, 2023–2028 (THOUSAND UNITS)
- TABLE 152 EUROPE: MARKET, BY COUNTRY, 2018–2022 (USD MILLION)
- TABLE 153 EUROPE: MARKET, BY COUNTRY, 2023–2028 (USD MILLION)
- TABLE 154 GERMANY: MARKET, BY TRANSMISSION TYPE, 2018–2022 (THOUSAND UNITS)
- TABLE 155 GERMANY: MARKET, BY TRANSMISSION TYPE, 2023–2028 (THOUSAND UNITS)
- TABLE 156 GERMANY: MARKET, BY TRANSMISSION TYPE, 2018–2022 (USD MILLION)
- TABLE 157 GERMANY: MARKET, BY TRANSMISSION TYPE, 2023–2028 (USD MILLION)
- TABLE 158 FRANCE: MARKET, BY TRANSMISSION TYPE, 2018–2022 (THOUSAND UNITS)
- TABLE 159 FRANCE: MARKET, BY TRANSMISSION TYPE, 2023–2028 (THOUSAND UNITS)
- TABLE 160 FRANCE: MARKET, BY TRANSMISSION TYPE, 2018–2022 (USD MILLION)
- TABLE 161 FRANCE: MARKET, BY TRANSMISSION TYPE, 2023–2028 (USD MILLION)
- TABLE 162 ITALY: MARKET, BY TRANSMISSION TYPE, 2018–2022 (THOUSAND UNITS)
- TABLE 163 ITALY: MARKET, BY TRANSMISSION TYPE, 2023–2028 (THOUSAND UNITS)
- TABLE 164 ITALY: MARKET, BY TRANSMISSION TYPE, 2018–2022 (USD MILLION)
- TABLE 165 ITALY: MARKET, BY TRANSMISSION TYPE, 2023–2028 (USD MILLION)
- TABLE 166 RUSSIA: MARKET, BY TRANSMISSION TYPE, 2018–2022 (THOUSAND UNITS)
- TABLE 167 RUSSIA: MARKET, BY TRANSMISSION TYPE, 2023–2028 THOUSAND UNITS)
- TABLE 168 RUSSIA: MARKET, BY TRANSMISSION TYPE, 2018–2022 (USD MILLION)
- TABLE 169 RUSSIA: MARKET, BY TRANSMISSION TYPE, 2023–2028 (USD MILLION)
- TABLE 170 UK: MARKET, BY TRANSMISSION TYPE, 2018–2022 (THOUSAND UNITS)
- TABLE 171 UK: MARKET, BY TRANSMISSION TYPE, 2023–2028 (THOUSAND UNITS)
- TABLE 172 UK: MARKET, BY TRANSMISSION TYPE, 2018–2022 (USD MILLION)
- TABLE 173 UK: MARKET, BY TRANSMISSION TYPE, 2023–2028 (USD MILLION)
- TABLE 174 SPAIN: MARKET, BY TRANSMISSION TYPE, 2018–2022 (THOUSAND UNITS)
- TABLE 175 SPAIN: MARKET, BY TRANSMISSION TYPE, 2023–2028 (THOUSAND UNITS)
- TABLE 176 SPAIN: MARKET, BY TRANSMISSION TYPE, 2018–2022 (USD MILLION)
- TABLE 177 SPAIN: MARKET, BY TRANSMISSION TYPE, 2023–2028 (USD MILLION)
- TABLE 178 REST OF EUROPE: MARKET, BY TRANSMISSION TYPE, 2018–2022 (THOUSAND UNITS)
- TABLE 179 REST OF EUROPE: MARKET, BY TRANSMISSION TYPE, 2023–2028 (THOUSAND UNITS)
- TABLE 180 REST OF EUROPE: MARKET, BY TRANSMISSION TYPE, 2018–2022 (USD MILLION)
- TABLE 181 REST OF EUROPE: MARKET, BY TRANSMISSION TYPE, 2023–2028 (USD MILLION)
- TABLE 182 NORTH AMERICA: MARKET, BY COUNTRY, 2018–2022 (THOUSAND UNITS)
- TABLE 183 NORTH AMERICA: MARKET, BY COUNTRY, 2023–2028 (THOUSAND UNITS)
- TABLE 184 NORTH AMERICA: MARKET, BY COUNTRY, 2018–2022 (USD MILLION)
- TABLE 185 NORTH AMERICA: MARKET, BY COUNTRY, 2023–2028 (USD MILLION)
- TABLE 186 CANADA: MARKET, BY TRANSMISSION TYPE, 2018–2022 (THOUSAND UNITS)
- TABLE 187 CANADA: MARKET, BY TRANSMISSION TYPE, 2023–2028 (THOUSAND UNITS)
- TABLE 188 CANADA: MARKET, BY TRANSMISSION TYPE, 2018–2022 (USD MILLION)
- TABLE 189 CANADA MARKET, BY TRANSMISSION TYPE, 2023–2028 (USD MILLION)
- TABLE 190 MEXICO: MARKET, BY TRANSMISSION TYPE, 2018–2022 (THOUSAND UNITS)
- TABLE 191 MEXICO: MARKET, BY TRANSMISSION TYPE, 2023–2028 (THOUSAND UNITS)
- TABLE 192 MEXICO: MARKET, BY TRANSMISSION TYPE, 2018–2022 (USD MILLION)
- TABLE 193 MEXICO: MARKET, BY TRANSMISSION TYPE, 2023–2028 (USD MILLION)
- TABLE 194 US: MARKET, BY TRANSMISSION TYPE, 2018–2022 (THOUSAND UNITS)
- TABLE 195 US: MARKET, BY TRANSMISSION TYPE, 2023–2028 (THOUSAND UNITS)
- TABLE 196 US: MARKET, BY TRANSMISSION TYPE, 2018–2022 (USD MILLION)
- TABLE 197 US: MARKET, BY TRANSMISSION TYPE, 2023–2028 (USD MILLION)
- TABLE 198 LATIN AMERICA: MARKET, BY COUNTRY, 2018–2022 (THOUSAND UNITS)
- TABLE 199 LATIN AMERICA: MARKET, BY COUNTRY, 2023–2028 (THOUSAND UNITS)
- TABLE 200 LATIN AMERICA: MARKET, BY COUNTRY, 2018–2022 (USD MILLION)
- TABLE 201 LATIN AMERICA: MARKET, BY COUNTRY, 2023–2028 (USD MILLION)
- TABLE 202 BRAZIL: MARKET, BY TRANSMISSION TYPE, 2018–2022 (THOUSAND UNITS)
- TABLE 203 BRAZIL: MARKET, BY TRANSMISSION TYPE, 2023–2028 (THOUSAND UNITS)
- TABLE 204 BRAZIL: MARKET, BY TRANSMISSION TYPE, 2018–2022 (USD MILLION)
- TABLE 205 BRAZIL: MARKET, BY TRANSMISSION TYPE, 2023–2028 (USD MILLION)
- TABLE 206 ARGENTINA: MARKET, BY TRANSMISSION TYPE, 2018–2022 (THOUSAND UNITS)
- TABLE 207 ARGENTINA: MARKET, BY TRANSMISSION TYPE, 2023–2028 (THOUSAND UNITS)
- TABLE 208 ARGENTINA: MARKET, BY TRANSMISSION TYPE, 2018–2022 (USD MILLION)
- TABLE 209 ARGENTINA: MARKET, BY TRANSMISSION TYPE, 2023–2028 (USD MILLION)
- TABLE 210 REST OF LATIN AMERICA: MARKET, BY TRANSMISSION TYPE, 2018–2022 (THOUSAND UNITS)
- TABLE 211 REST OF LATIN AMERICA: MARKET, BY TRANSMISSION TYPE, 2023–2028 (THOUSAND UNITS)
- TABLE 212 REST OF LATIN AMERICA: MARKET, BY TRANSMISSION TYPE, 2018–2022 (USD MILLION)
- TABLE 213 REST OF LATIN AMERICA: MARKET, BY TRANSMISSION TYPE, 2023–2028 (USD MILLION)
- TABLE 214 MIDDLE EAST & AFRICA: MARKET, BY COUNTRY, 2018–2022 (THOUSAND UNITS)
- TABLE 215 MIDDLE EAST & AFRICA: MARKET, BY COUNTRY, 2023–2028 (THOUSAND UNITS)
- TABLE 216 MIDDLE EAST & AFRICA: MARKET, BY COUNTRY, 2018–2022 (USD MILLION)
- TABLE 217 MIDDLE EAST & AFRICA: MARKET, BY COUNTRY, 2023–2028 (USD MILLION)
- TABLE 218 IRAN: MARKET, BY TRANSMISSION TYPE, 2018–2022 (THOUSAND UNITS)
- TABLE 219 IRAN: MARKET, BY TRANSMISSION TYPE, 2023–2028 (THOUSAND UNITS)
- TABLE 220 IRAN: MARKET, TRANSMISSION TYPE, 2018–2022 (USD MILLION)
- TABLE 221 IRAN: MARKET, BY TRANSMISSION TYPE, 2023–2028 (USD MILLION)
- TABLE 222 SOUTH AFRICA: MARKET, BY TRANSMISSION TYPE, 2018–2022 (THOUSAND UNITS)
- TABLE 223 SOUTH AFRICA: MARKET, BY TRANSMISSION TYPE, 2023–2028 (THOUSAND UNITS)
- TABLE 224 SOUTH AFRICA: MARKET, BY TRANSMISSION TYPE, 2018–2022 (USD MILLION)
- TABLE 225 SOUTH AFRICA: MARKET, BY TRANSMISSION TYPE, 2023–2028 (USD MILLION)
- TABLE 226 REST OF MIDDLE EAST & AFRICA: MARKET, BY TRANSMISSION TYPE, 2018–2022 (THOUSAND UNITS)
- TABLE 227 REST OF MIDDLE EAST & AFRICA: MARKET, BY TRANSMISSION TYPE, 2023–2028 (THOUSAND UNITS)
- TABLE 228 REST OF MIDDLE EAST & AFRICA: MARKET, BY TRANSMISSION TYPE, 2018–2022 (USD MILLION)
- TABLE 229 REST OF MIDDLE EAST & AFRICA: MARKET, BY TRANSMISSION TYPE, 2023–2028 (USD MILLION)
- TABLE 230 DEGREE OF COMPETITION, 2022
- TABLE 231 KEY PLAYER STRATEGIES
- TABLE 232 MARKET: OVERALL FOOTPRINT
- TABLE 233 MARKET: APPLICATION FOOTPRINT
- TABLE 234 MARKET: REGION FOOTPRINT
- TABLE 235 MARKET: KEY STARTUPS/SMES
- TABLE 236 COMPETITIVE BENCHMARKING OF KEY STARTUPS/SMES
- TABLE 237 MARKET: PRODUCT LAUNCHES, DECEMBER 2019–DECEMBER 2023
- TABLE 238 MARKET: DEALS, MARCH 2019–DECEMBER 2023
- TABLE 239 MARKET: EXPANSIONS, SEPTEMBER 2020–DECEMBER 2023
- TABLE 240 MANUAL TRANSMISSION SUPPLIERS LIST, 2019–2023
- TABLE 241 AUTOMATIC TRANSMISSION SUPPLIERS LIST, 2019–2023
- TABLE 242 DUAL-CLUTCH TRANSMISSION SUPPLIERS LIST, 2019–2023
- TABLE 243 CONTINUOUSLY VARIABLE TRANSMISSION SUPPLIERS LIST, 2019–2023
- TABLE 244 ZF FRIEDRICHSHAFEN AG: COMPANY OVERVIEW
- TABLE 245 ZF FRIEDRICHSHAFEN AG: PRODUCTS/SOLUTIONS/SERVICES OFFERED
- TABLE 246 ZF FRIEDRICHSHAFEN AG: PRODUCT LAUNCHES/DEVELOPMENTS
- TABLE 247 ZF FRIEDRICHSHAFEN AG: DEALS
- TABLE 248 ZF FRIEDRICHSHAFEN AG: EXPANSIONS
- TABLE 249 MAGNA INTERNATIONAL INC.: COMPANY OVERVIEW
- TABLE 250 MAGNA INTERNATIONAL INC.: PRODUCTS/SOLUTIONS/SERVICES OFFERED
- TABLE 251 MAGNA INTERNATIONAL INC.: PRODUCT LAUNCHES/DEVELOPMENTS
- TABLE 252 MAGNA INTERNATIONAL INC.: DEALS
- TABLE 253 MAGNA INTERNATIONAL INC.: EXPANSIONS
- TABLE 254 AISIN CORPORATION: COMPANY OVERVIEW
- TABLE 255 AISIN CORPORATION: PRODUCTS/SOLUTIONS/SERVICES OFFERED
- TABLE 256 AISIN CORPORATION: DEALS
- TABLE 257 AISIN CORPORATION: OTHER DEVELOPMENTS
- TABLE 258 EATON CORPORATION: COMPANY OVERVIEW
- TABLE 259 EATON CORPORATION: PRODUCTS/SOLUTIONS/SERVICES OFFERED
- TABLE 260 EATON CORPORATION: PRODUCT LAUNCHES/DEVELOPMENTS
- TABLE 261 EATON CORPORATION: DEALS
- TABLE 262 JATCO LTD.: COMPANY OVERVIEW
- TABLE 263 JATCO LTD.: PRODUCTS/SOLUTIONS/SERVICES OFFERED
- TABLE 264 JATCO LTD.: PRODUCT LAUNCHES/DEVELOPMENTS
- TABLE 265 JATCO LTD.: DEALS
- TABLE 266 JATCO LTD.: EXPANSIONS
- TABLE 267 VITESCO TECHNOLOGIES: COMPANY OVERVIEW
- TABLE 268 VITESCO TECHNOLOGIES: PRODUCTS/SOLUTIONS/SERVICES OFFERED
- TABLE 269 VITESCO TECHNOLOGIES: PRODUCT LAUNCHES/DEVELOPMENTS
- TABLE 270 VITESCO TECHNOLOGIES: DEALS
- TABLE 271 VITESCO TECHNOLOGIES: EXPANSIONS
- TABLE 272 VITESCO TECHNOLOGIES: OTHER DEVELOPMENTS
- TABLE 273 SCHAEFFLER AG: COMPANY OVERVIEW
- TABLE 274 SCHAEFFLER AG: PRODUCTS/SOLUTIONS/SERVICES OFFERED
- TABLE 275 SCHAEFFLER AG: PRODUCT LAUNCHES/DEVELOPMENTS
- TABLE 276 SCHAEFFLER AG: DEALS
- TABLE 277 SCHAEFFLER AG: EXPANSIONS
- TABLE 278 SCHAEFFLER AG: OTHER DEVELOPMENTS
- TABLE 279 BORGWARNER INC.: COMPANY OVERVIEW
- TABLE 280 BORGWARNER INC.: PRODUCTS/SOLUTIONS/SERVICES OFFERED
- TABLE 281 BORGWARNER INC.: DEALS
- TABLE 282 BORGWARNER INC.: EXPANSIONS
- TABLE 283 ALLISON TRANSMISSION INC.: COMPANY OVERVIEW
- TABLE 284 ALLISON TRANSMISSION INC.: PRODUCTS/SOLUTIONS/SERVICES OFFERED
- TABLE 285 ALLISON TRANSMISSION INC.: PRODUCT LAUNCHES/DEVELOPMENTS
- TABLE 286 ALLISON TRANSMISSION INC.: DEALS
- TABLE 287 GKN AUTOMOTIVE: COMPANY OVERVIEW
- TABLE 288 GKN AUTOMOTIVE: PRODUCTS/SOLUTIONS/SERVICES OFFERED
- TABLE 289 GKN AUTOMOTIVE: PRODUCT LAUNCHES/DEVELOPMENTS
- TABLE 290 GKN AUTOMOTIVE: DEALS
- TABLE 291 GKN AUTOMOTIVE: EXPANSIONS
- TABLE 292 HYUNDAI TRANSYS: COMPANY OVERVIEW
- TABLE 293 HYUNDAI TRANSYS: PRODUCTS/SOLUTIONS/SERVICES OFFERED
- TABLE 294 HYUNDAI TRANSYS: DEALS
- TABLE 295 HYUNDAI TRANSYS: EXPANSIONS
- TABLE 296 DANA LIMITED: COMPANY OVERVIEW
- TABLE 297 DANA LIMITED: PRODUCTS/SOLUTIONS/SERVICES OFFERED
- TABLE 298 DANA LIMITED.: PRODUCT LAUNCHES/DEVELOPMENTS
- TABLE 299 DANA LIMITED: DEALS
- TABLE 300 WEICHAI POWER CO., LTD.: COMPANY OVERVIEW
- TABLE 301 WEICHAI POWER CO., LTD.: PRODUCTS/SOLUTIONS/SERVICES OFFERED
- TABLE 302 WEICHAI POWER CO., LTD.: DEALS
- TABLE 303 GENERAL MOTORS: COMPANY OVERVIEW
- TABLE 304 KATE LLC: COMPANY OVERVIEW
- TABLE 305 MUHR UND BENDER KG: COMPANY OVERVIEW
- TABLE 306 STARTRANSMISSION & STARASSEMBLY: COMPANY OVERVIEW
- TABLE 307 MACLEAN-FOGG COMPONENT SOLUTIONS, LLC: COMPANY OVERVIEW
- TABLE 308 MAZDA: COMPANY OVERVIEW
- TABLE 309 FORD: COMPANY OVERVIEW
- TABLE 310 DAIHATSU: COMPANY OVERVIEW
- TABLE 311 SUBARU: COMPANY OVERVIEW
- TABLE 312 TREMEC: COMPANY OVERVIEW
- TABLE 313 PUNCH POWERTRAIN NV: COMPANY OVERVIEW
- TABLE 314 ZEROSHIFT TRANSMISSIONS LTD.: COMPANY OVERVIEW
- TABLE 315 XTRAC LTD.: COMPANY OVERVIEW
- FIGURE 1 AUTOMOTIVE TRANSMISSION MARKET SEGMENTATION
- FIGURE 2 MARKET: RESEARCH DESIGN
- FIGURE 3 RESEARCH METHODOLOGY MODEL
- FIGURE 4 BREAKDOWN OF PRIMARY INTERVIEWS: BY COMPANY TYPE, DESIGNATION, AND REGION
- FIGURE 5 RESEARCH METHODOLOGY: HYPOTHESIS BUILDING
- FIGURE 6 MARKET SIZE: BOTTOM-UP APPROACH (TRANSMISSION TYPE AND REGION)
- FIGURE 7 MARKET SIZE: TOP-DOWN APPROACH (BY FUEL TYPE)
- FIGURE 8 MARKET: RESEARCH DESIGN AND METHODOLOGY
- FIGURE 9 MARKET: RESEARCH METHODOLOGY ILLUSTRATION OF SUPPLY-SIDE REVENUE ESTIMATION
- FIGURE 10 DATA TRIANGULATION METHODOLOGY
- FIGURE 11 MARKET, BY VEHICLE TYPE, 2023 VS. 2028
- FIGURE 12 GROWING DEMAND FOR FUEL-EFFICIENT VEHICLES TO DRIVE MARKET
- FIGURE 13 AUTOMATIC TRANSMISSION SEGMENT TO LEAD MARKET DURING FORECAST PERIOD
- FIGURE 14 PASSENGER CARS SEGMENT TO LEAD MARKET DURING FORECAST PERIOD
- FIGURE 15 ALTERNATE FUEL SEGMENT TO GROW AT HIGHEST RATE FROM 2023 TO 2028
- FIGURE 16 UP TO 5 SEGMENT TO LEAD MARKET DURING FORECAST PERIOD
- FIGURE 17 NORTH AMERICA TO REGISTER HIGHEST CAGR DURING FORECAST PERIOD
- FIGURE 18 AUTOMATIC TRANSMISSION SEGMENT TO GROW AT HIGHER RATE THAN MANUAL TRANSMISSION SEGMENT DURING FORECAST PERIOD
- FIGURE 19 ASIA PACIFIC TO ACCOUNT FOR LARGEST MARKET SHARE IN 2023
- FIGURE 20 AUTOMOTIVE TRANSMISSION MARKET: DRIVERS, RESTRAINTS, OPPORTUNITIES, AND CHALLENGES
- FIGURE 21 GLOBAL ELECTRIC & HYBRID VEHICLE SALES, 2018–2022
- FIGURE 22 REVENUE SHIFT FOR MARKET
- FIGURE 23 MARKET ECOSYSTEM
- FIGURE 24 ECOSYSTEM MAP FOR MARKET
- FIGURE 25 MARKET: SUPPLY CHAIN ANALYSIS
- FIGURE 26 PASSENGER CARS: ASP OF AUTOMOTIVE TRANSMISSION, 2021–2024 (USD)
- FIGURE 27 INFLUENCE OF STAKEHOLDERS ON BUYING PROCESS FOR AUTOMOTIVE TRANSMISSIONS
- FIGURE 28 KEY BUYING CRITERIA FOR AUTOMOTIVE TRANSMISSIONS
- FIGURE 29 DEDICATED HYBRID TRANSMISSION
- FIGURE 30 AUTOMATED MANUAL TRANSMISSION
- FIGURE 31 MARKET, BY TRANSMISSION TYPE, 2023 VS. 2028 (USD MILLION)
- FIGURE 32 INDIA: DIESEL AND NON-DIESEL CAR MARKET SHARE
- FIGURE 33 EUROPE: NEW CAR REGISTRATIONS, BY POWER SOURCE, 2022–2023
- FIGURE 34 US: DIESEL, GASOLINE, EV, AND PHEV CAR MARKET SHARE
- FIGURE 35 MARKET, BY FUEL TYPE, 2023 VS. 2028 (THOUSAND UNITS)
- FIGURE 36 MARKET, BY NUMBER OF FORWARD GEARS, 2023 VS. 2028 (THOUSAND UNITS)
- FIGURE 37 EX-SHOWROOM PRICE OF AUTOMATIC AND MANUAL MODELS OF INDIAN CARS (USD)
- FIGURE 38 MARKET, BY VEHICLE TYPE, 2023 VS. 2028 (USD MILLION)
- FIGURE 39 NEW EU CAR REGISTRATIONS, BY POWER SOURCE, 2023
- FIGURE 40 MARKET FOR HYBRID ELECTRIC VEHICLES, BY REGION, 2023 VS. 2028 (THOUSAND UNITS)
- FIGURE 41 TWO-WHEELER TRANSMISSION MARKET, BY TYPE, 2023 VS. 2028 (THOUSAND UNITS)
- FIGURE 42 MARKET, BY REGION, 2023 VS. 2028 (USD MILLION)
- FIGURE 43 ASIA PACIFIC: MARKET SNAPSHOT
- FIGURE 44 EUROPE: MARKET SNAPSHOT
- FIGURE 45 NORTH AMERICA: MARKET SNAPSHOT, 2023 VS. 2028 (USD MILLION)
- FIGURE 46 LATIN AMERICA: MARKET SNAPSHOT, 2023 VS. 2028 (USD MILLION)
- FIGURE 47 MIDDLE EAST & AFRICA: MARKET SNAPSHOT, 2023 VS. 2028 (USD MILLION)
- FIGURE 48 MARKET SHARE ANALYSIS, 2022
- FIGURE 49 CVT MARKET SHARE BY KEY COMPANIES, 2019
- FIGURE 50 REVENUE ANALYSIS OF TOP LISTED/PUBLIC PLAYERS, 2020–2022
- FIGURE 51 COMPANY EVALUATION MATRIX, 2022
- FIGURE 52 STARTUP/SME EVALUATION MATRIX, 2022
- FIGURE 53 KEY DEVELOPMENTS BY LEADING PLAYERS
- FIGURE 54 PRODUCT COMPARISON
- FIGURE 55 COMPANY VALUATION
- FIGURE 56 ZF FRIEDRICHSHAFEN AG: COMPANY SNAPSHOT
- FIGURE 57 MAGNA INTERNATIONAL INC.: COMPANY SNAPSHOT
- FIGURE 58 AISIN CORPORATION: COMPANY SNAPSHOT
- FIGURE 59 EATON CORPORATION: COMPANY SNAPSHOT
- FIGURE 60 JATCO LTD.: COMPANY SNAPSHOT
- FIGURE 61 VITESCO TECHNOLOGIES: COMPANY SNAPSHOT
- FIGURE 62 SCHAEFFLER AG: COMPANY SNAPSHOT
- FIGURE 63 BORGWARNER INC.: COMPANY SNAPSHOT
- FIGURE 64 ALLISON TRANSMISSION INC.: COMPANY SNAPSHOT
- FIGURE 65 GKN AUTOMOTIVE: COMPANY SNAPSHOT
- FIGURE 66 HYUNDAI TRANSYS: COMPANY SNAPSHOT
- FIGURE 67 DANA LIMITED: COMPANY SNAPSHOT
- FIGURE 68 WEICHAI POWER CO., LTD.: COMPANY SNAPSHOT
The study involves four main activities to estimate the current size of the automotive transmission market.
- Exhaustive secondary research and country-wise model mapping to collect the information on such as transmission type, vehicle type, number of forward gears, fuel type, hybrid electric transmissions and two-wheeler transmissions.
- The next step was to validate these findings, assumptions, and market analysis with industry experts across value chains through primary research.
- Bottom-up and top-down approaches were employed to estimate the complete market size for different segments considered in this study.
- After that, market breakdown and data triangulation processes were used to estimate the market size of segments and subsegments.
Secondary Research
In the secondary research process, various secondary sources were used to identify and collect information for this study. The secondary sources included annual reports, press releases, and investor presentations of manufacturers; white papers, certified publications; articles from recognized authors, directories, industry databases; and articles from recognized associations and government publishing sources.
Secondary research was used to obtain critical information about the industry’s value chain, the overall pool of key players, market classification and segmentation according to industry trends to the bottom-most level, regional markets, and key developments from the market and technology-oriented perspectives.
Primary Research
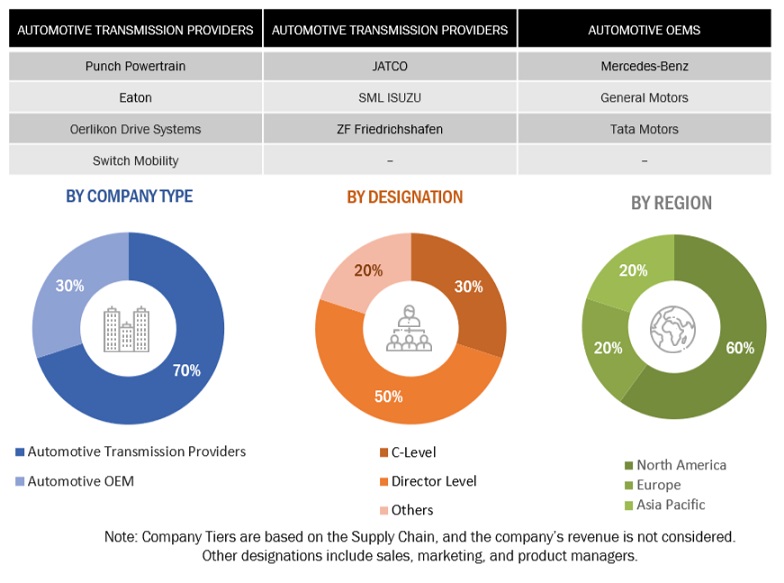
After understanding the automotive transmission market scenario, extensive primary research was conducted. Several industry experts from automotive transmission providers, component/system providers, and end-user organizations across three major regions: North America, Europe, and Asia Pacific were reached out to for the primary interviews. Most of the interviews were conducted from the supply side and some from OEMs. Primary data was collected through questionnaires, emails, and telephonic interviews. Various departments within organizations, including sales, operations, and administration, were contacted to provide a holistic viewpoint in the report while canvassing primaries. After interacting with industry participants, some brief sessions were conducted with experienced independent consultants to reinforce the findings from the primaries. This and the opinions of in-house subject matter experts led to the conclusions delineated in the rest of this report.
To know about the assumptions considered for the study, download the pdf brochure
Market Size Estimation
A detailed market estimation approach was followed to estimate and validate the value and volume of the automotive transmission market and other dependent submarkets, as mentioned below:
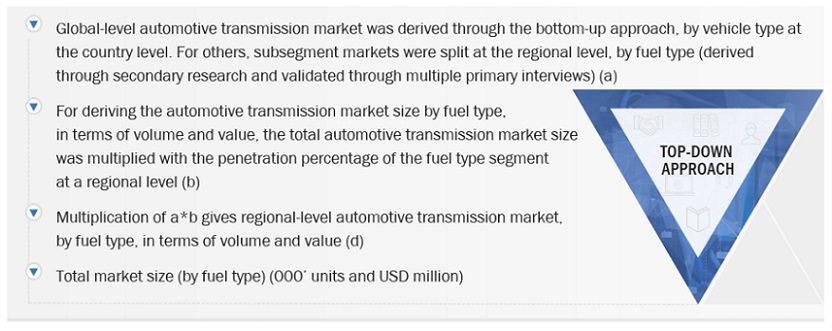
The top-down approach was used to estimate and validate the size of the market by fuel type, number of forward gears, and two-wheeler transmission type by volume and value. For others, subsegment markets were split at the regional level by fuel type (derived through secondary research and validated through multiple primary interviews)
The region-level market by transmission type by volume is multiplied by the region-level average selling price (ASP) for each application to get the market for each transmission by value.
The summation of the region-level market would give the global automotive transmission market by transmission type (Automatic Transmission, Automated Manual Transmission, Dual-Clutch Transmission, Continuously Variable Transmission, Manual Transmission). The total value of each region was then summed up to derive the total value of the market by transmission type.
All key macro indicators affecting the revenue growth of the market segments and subsegments were accounted for, viewed in extensive detail, verified through primary research, and analyzed to get the validated and verified quantitative and qualitative data.
The gathered market data was consolidated and added with detailed inputs, analyzed, and presented in this report.
Automotive Transmission Market Size: Top-Down Approach
To know about the assumptions considered for the study, Request for Free Sample Report
The top-down approach was used to estimate and validate the market size of automotive transmission by fuel type, number of forward gears, and two-wheeler transmission type by volume and value. The global market size in terms of volume and value was divided into diesel and gasoline using the percentage split to derive the market size of fuel type. The global market was further segmented at the regional level. A similar approach was used to derive the market size of the number of forward gears and two-wheeler transmission type segments in terms of volume and value.
Market Definition:
Automotive transmission is the system that extracts the maximum torque from an engine and delivers it to the wheels. The evolution of automatic transmission and its integration with electronic controls have allowed for more significant progress in automobile technologies in recent years. Modern automatic transmission helps achieve better fuel economy, reduced engine emissions, more excellent shift system reliability, improved shift feel and speed, and improved vehicle handling. There are five major types of automotive transmission: manual transmission, automatic transmission, automated manual transmission, dual-clutch transmission, and continuously variable transmission.
Stakeholders:
- Automobile Manufacturers (OEMs)
- Automotive Transmission Manufacturers
- Automotive Electronic Hardware Suppliers & integrators
- Automotive SoC and ECU Manufacturers
- Automotive Transmission Component Suppliers
- Government & Research Organizations
- Traders, Distributors, and Suppliers of Automotive Transmission Components
- Automobile Organizations/Associations
Report Objectives
-
To define, describe, and forecast the automotive transmission market size by volume (thousand units) and value (USD million) based on:
- Transmission type [manual transmission (MT), automatic transmission (AT), continuously variable transmission (CVT), automated manual transmission (AMT), and dual-clutch transmission (DCT)]
- Hybrid electric vehicle type by region (Asia Pacific, Europe, and North America)
- Fuel type (diesel, gasoline, and alternate fuel)
- Number of forward gears (CVT, up to 5, 6 to 8, 9 to 10, and above 10)
- Vehicle type (passenger cars, light commercial vehicles, trucks, and buses)
- Two-wheeler transmission type (manual transmission and automatic transmission)
- Region (North America, Europe, Asia Pacific, Latin America, and the Middle East & Africa)
- To provide detailed information regarding the major factors (drivers, opportunities, restraints, and challenges) influencing the growth of the market
- To analyze the opportunities in the market for stakeholders and provide details of the competitive landscape for market leaders
- To strategically analyze the key player strategies/right to win
- To study the market with supply chain analysis, ecosystem analysis, trade analysis, case study analysis, pricing analysis, patent analysis, trends/disruptions impacting buyers, technology trends, regulatory analysis, and recession impact analysis
- To analyze the competitive leadership mapping of the global automotive transmission manufacturers and automotive transmission component suppliers in the market and understand their market position with the help of a company evaluation matrix.
- To track and analyze competitive developments, such as joint ventures, collaborations, partnerships, mergers & acquisitions, new product developments, and expansions, in the automotive transmission market
Available customizations
Along with the given market data, MarketsandMarkets offers customizations to a company’s specific needs
- Automotive transmission market, by Fuel Type & Country
-
Asia Pacific
- C h i n a
- I n d i a
- J a p a n
- S o u t h K o r e a
- R e s t o f A s i a P a c i f i c
-
E u r o p e
- G e r m a n y
- F r a n c e
- U K
- S p a i n
- I t a l y
- R e s t o f E u r o p e
-
No r t h Ame r i c a
- U S
- C a n a d a
- M e x i c o
-
L a t i n Ame r i c a
- B r a z i l
- A r g e n t i n a
- R e s t o f L a t i n A m e r i c a
-
Mi d d l e E a s t & A f r i c a S o u t h A f r i c a
- I r a n
- R e s t o f M i d d l e E a s t & A f r i c a
Growth opportunities and latent adjacency in Automotive Transmission Market
Who are the top vendors in the Automotive Transmission Market? What is the competitive scenario among them?
Pls send TOC and can it be customised for 2W AMT market for India and for ASEAN region including after market requirement for 2W AMT for a Bolt on design of AMT for 2W
I am looking for commercial vehicle transmission data at a global level with deep dive into India, China, Brazil, Russia and South Africa. In this database, I am looking for Tier-1 and Tier-2 transmission suppliers mapping by different OEMs and models for the mentioned countries.
I am interested in new technologies relevance in commercial vehicles in developing countries context. Request if you can send me the free sample report portion relevant to only commercial vehicle regions covering other than Europe and North America
I am interested to know just in the Automotive Transmission Market by vehicle and transmission type just in Mexico.
Looking for opportunities to exploit new technologies in the automotive industry in particular for smaller engines and related industries.
Ideally would like to see Program and/or Platform included. Also EVT/Reduction breakouts if possible.
Market share, past, present, forecast (2008-2018) with splits for: Supplier OEM Vehicle Class Technology Type Global Region
LOW CARBON TRANSPORT – 16.67 Co2e g/km Transport, Automotive, Rail, Ship, Missile, JET Plane. Technology: Double Speed, 1/3 Fuel for same Ton-HP-Vehicle. 6 x kmpl; 16.67 Co2e g/km; g/t-km.
Architecture,Transmission,Motor Output,final drive,Drive Type, Power Electronics, Vehicle type, Region-Global Forecast to 2025