Train Battery Market

Train Battery Market by Type & Technology (Lead-acid Tubular, VRLA, Conventional; Ni-Cd Sinter, Fiber, Pocket, & Li-ion; LFP, LTO), Advanced Train (Fully Battery-Operated and Hybrid), Rolling Stock Type, Application and Region - Global Forecast to 2030

Report Code: AT 6676 Oct, 2023, by marketsandmarkets.com

[326 Pages Report] The train battery market is projected to grow from USD 277 million in 2023 to USD 378 million by 2030 at a CAGR of 4.6% during the forecast period. The train battery market growth is expected due to several factors, such as - the growing development of high-speed trains and metros and the expansion of railway networks. The rail sector’s emission regulations and high energy consumption remain major challenges. Energy storage systems such as batteries are expected to reduce the energy demand and thus reduce overall operational costs. These factors will contribute to the increased demand for train batteries in developed and developing countries.

Train Battery Market

To know about the assumptions considered for the study, Request for Free Sample Report

Train Battery Market

To know about the assumptions considered for the study, download the pdf brochure

Market Dynamics

DRIVER: Growth in adoption of autonomous and high-speed railways

Power lines generally power high-speed rail and are the fastest ground-based method of commercial transportation. According to the US Department of Energy, a conventional passenger rail carries 2.83 times as many passengers per hour per meter width as a road. As of 2022, more than 44 countries worldwide have under construction or operational high-speed rail lines, as opposed to 16 in 2017. The High-speed railway network had grown to ~59,000 km in 2022 as against 44,000 km in 2020. Hence, for performance improvement, many energy-saving and storage systems are utilized. For example, regenerative braking techniques are adapted to convert braking energy into electricity and store it onboard energy storage systems.

In addition to this, many rolling stock manufacturers are focusing on building autonomous trains around the world. For instance, in June 2023, Hitachi Rail completed the first phase of Honolulu’s ‘Skyline,’ the US's first fully autonomous metro system.

Thus, Adapting batteries for high-speed railways as well as partial and fully autonomous train systems holds the potential to lower operational and capital expenses. The funds saved through this adaptation can be redirected to offset the extra financial requirements associated with project implementation and to encourage further research and development efforts.

List of Semi-autonomous and autonomous Metros

Country

Train Type

Autonomous Level

Name of System

Year

Turkey

Metro

Semi-Autonomous

Istanbul Metro

January, 2023

Brazil

Metro

Fully Autonomous

São Paulo Metro

December, 2022

Canada

Metro

Fully Autonomous

REM (Réseau Express Metropolitain)

July 2023 (Partially opened; rest of the line under construction)

Australia

Metro

Fully Autonomous

Sydney Metro

December 2022, 20 Metros are in operation. The remaining three will be in operation by mid of 2024

Germany

Metro

Fully Autonomous

Montreal Metro

July 2023, 80 Metro is in operation.

China

Metro

Fully Autonomous

Shanghai Metro Line 14

December 2021

India

Metro

Fully Autonomous

Bengaluru Metro

October 2023

RESTRAINT: High capital investment and operating cost of the high-speed rail network

The benefits of a high-speed train network, such as short travel time, energy efficiency with fewer carbon emissions, and comfort and safety, have been incentivized in several countries for popularity. However, the high infrastructure cost and government budget constraints have hampered the adoption of high-speed train networks in various emerging economies, such as Brazil, South Africa, Malaysia, the Philippines, Mexico, and Indonesia.

In october 2021, it is reported that the California bullet train was facing potential cost increases of at least one billion dollars, proposed by its contractors. These ongoing escalations in expenses, coupled with the likelihood of encountering similar issues in the coming years, exacerbate the already troublesome financial situation of the USD 100-billion project. In March 2021, Malaysia paid Singapore nearly USD 76.30 million (equivalent to Singapore Dollar 102.8 million) as a settlement for canceling the Kuala Lumpur-Singapore High-Speed Rail (HSR) project that was planned between the two countries.

Meanwhile, in the UK, the completion timeline for the high-speed rail line to Birmingham has recently been extended to 2031, and for the Manchester/Leeds branch, to 2040. Furthermore, the projected cost of the project has nearly doubled from its initial budget of USD 65 billion to approximately USD 130 billion due to elevated costs and environmental considerations. Indonesia also suspended a 150 km long high-speed train project back in 2016. As a result, the substantial infrastructure costs are anticipated to impede the growth of high-speed train networks in emerging economies, consequently affecting the demand for train batteries.

Hence, the high-speed rail network is witnessing sluggish growth due to the high investment costs, especially in developing economies. According to the International Energy Agency (IEA) report, rail networks have not increased significantly during the last 20 years. As a result, there are only a few high-speed trains. Therefore, the demand for train batteries is expected to be affected owing to the slow growth rate in the expansion of rail networks.

OPPORTUNITY: Expansion of IoT, AI, and DAS technologies

The railway sector has integrated cutting-edge technologies like the Internet of Things (IoT), artificial intelligence (AI), deep learning, and Distributed Antenna Systems (DAS) to boost operational efficiency and elevate the quality of the passenger journey. These enhancements in resource management, passenger satisfaction, and decision-making, coupled with the optimization of onboard equipment like Air Conditioning Systems (ACS), heaters, braking systems, and other onboard devices, are anticipated to drive the wider acceptance of train batteries.

The introduction of multiple intelligent infrastructure initiatives within rail networks is projected to promote the utilization of IoT, AI, and deep learning in the railway industry. As an illustration, as reported by IOT Times, in 2019, Network Rail initiated the Intelligent Infrastructure (II) program with the aim of transforming data into smart insights, ultimately enhancing the quality of services offered to both passenger and freight customers.

The II program leverages the data captured by its sensors and sends it back to the central cloud platform for processing. Data consolidated by workstreams on Network Rail’s cloud platform is uploaded to Microsoft’s Azure Cloud, where AI algorithms turn the information into actionable predictive maintenance schedules. Moreover, many companies are focusing on developing IOT-enabled battery voltage monitoring systems for different rolling stock. For instance, Stimio has developed a battery voltage monitoring system based on a certified rail solution. Railnode boxes are linked directly to the locomotive’s battery system, continuously gauging and overseeing voltage levels. Immediate alerts are triggered when voltage readings fall beneath a predetermined critical threshold.

Thus, the growing implementation of IoT, AI, deep learning, and DAS is expected to improve travel time and passenger experience. Since these systems are heavily dependent on electricity, batteries would become a more reliable and stable source for power backup purposes. The adoption of IoT and DAS is projected to drive the market for train batteries in the medium term.

CHALLENGES: Technical Challenges related to lead-acid and lithium-ion batteries.

Rail batteries should have extended durability and quick charging capabilities. Within the rail sector, lead-acid and Nickel Cadmium (Ni-Cd) batteries find widespread use. These batteries present challenges related to disposal due to their toxic chemical composition. Furthermore, they exhibit a substantial self-discharge rate and a limited charge cycle. While Ni-Cd batteries offer a 60% energy capacity advantage over other battery types, they are susceptible to a recharging issue known as the "memory effect." The memory effect occurs when the battery recalls its prior discharge performance and subsequently recharges to that level, leading to a decrease in overall performance.

Enhancing the cell's capacity has the potential to boost battery performance; however, it may come at the expense of compromising the safety of the entire system. Furthermore, rail batteries are a type of electrochemical battery that relies on chemical reactions to generate an electric current. Given that temperature variations can impact all chemical reactions, fluctuations can have adverse effects on the performance of rail batteries. Cold temperatures, in particular, can lead to a decrease in cell performance, consequently impacting the specific energy gradient of the battery. Lithium-ion batteries operate with better efficiency against temperature changes, but the heating can reduce the capacity of the batteries over time. Further, lithium-ion (Li-ion) batteries require lithium mining, which has brought forward many environmental challenges. The manufacturing cost of Li-ion batteries is also 40% higher than Ni-Cd batteries.

Hence, as the adoption of batteries for both traction and auxiliary purposes continues to grow, battery producers are anticipated to encounter obstacles related to battery design, cost efficiency, and the weight of these batteries. Moreover, manufacturers are dedicating their efforts to enhancing battery technology to minimize energy losses, enhance onboard charging methods, and decrease downtime resulting from discharges.

Train Battery Market Ecosystem:

The ecosystem analysis highlights various players in the train battery market ecosystem, primarily represented by Train Battery Manufacturers, Raw material/component manufacturers (tier I), Train Manufacturers, Service and repair providers,  and Regulatory Bodies.

Train Battery Market

Based on the Rolling Stock Aftermarket, The Passenger coaches segment is anticipated to dominate the battery aftermarket.

Passenger coaches and lead acid battery types are expected to be the largest train battery aftermarket owing to its largest fleet among locomotives and multiple units worldwide. Train battery aftermarket is still dominated by VRLA battery, which is a lead-acid battery type. It is a conventional battery technology with a unique design to stop the leakage of hydrogen and oxygen gas during charging and discharging. Because of this, they are both safer and more effective than conventional lead-acid batteries. Due to the lower cost and adequate performance delivery, OEMs initially preferred it when they bought and found a replacement with older ones. However, in the coming years, nickel-cadmium is expected to gain momentum as some older rolling stock fleets are getting upgraded with Ni-Cd batteries for improved performance and cost benefits in the long run. This trend is more prevalent in Europe and North American regions. Furthermore, technological developments, lowering production costs, and declining battery prices would prompt the shift toward new-age batteries. Various government initiatives to electrify rail networks and the growing popularity of retrofitting locomotives with the latest battery solutions would subsequently thrive to boost train battery aftermarket demand.

The fully Battery-operated trains segment of the train battery market is projected to witness the highest CAGR during the forecast period.

During the review period, battery-operated trains would grow at the highest CAGR within the advanced train battery market. These trains are usually installed with 2-5 MWh of battery capacity, and few can also be offered with up to 9 or 14 MWh of battery depending upon the heavy loads it need to pull on a non-electric track. These advanced trains are powered by lithium-ion batteries, gradually gaining momentum in the railway industry. For instance, Wabtec Corporation launched the world’s first battery-electric heavy haul locomotive, named FLXdrive, in September 2021, designed with 500 lithium-ion battery modules that have cut fuel consumption by 11%. In August 2023, Alstom and VMS unveiled its fully battery-operated train with a range of 120 km. Lithium Iron Phosphate (LFP), Nickel Manganese Cobalt Oxide (NMC), and Lithium Titanate Oxide (LTO) are the prominent lithium-ion battery technologies that are preferred to run the battery-operated locomotives. With continuous investments, rising strategic collaborations, and new product developments, the market for train batteries in fully battery-powered trains is expected to showcase prominent growth in the coming years.

The lithium battery segment in terms of volume is projected to grow at the fastest CAGR by 2030 in the train battery OE market.

Lithium is projected to grow at the fastest rate for the train battery market during the forecast period. Lithium is prominently used in metro trains and high-speed railway applications. Lithium batteries are lightweight and have higher energy density than NiCd and lead-acid batteries, which makes them an ideal choice for traction purposes enabling reduced weight and increased energy efficiency. This enhances acceleration and deceleration capabilities, improving operational performance and shorter travel times. Although this technology is in its early stages of development based on significant investments and technological advancement, the demand for lithium batteries is growing for traction and auxiliary functions. For instance, in July 2020, Central Japan Railway Co. started operating its N700S bullet train commercially. This train is equipped with lithium-ion self-propulsion battery technology, which begins during power shortages. Till 2022, there were 40 N700S trains in operation. Major rolling stock manufacturers such as Alstom and Siemens use lithium batteries in the newly developed fast trains as a primary power source. Thus, with the advancements in battery technology, particularly lithium-ion, the demand for battery-based energy storage systems used in trains is expected to rise significantly in the coming years.?

The Asia Pacific market is projected to contribute the largest share of the train battery market.

Asia Pacific holds the maximum share in the global train battery market, in terms of value, in 2022. The higher demand is mainly due to the extensive railway network for most Asian countries. According to CEIC statistics,  in 2022, China had more than 150,000 km of track length, India had approximately 128,305 km, Japan had 27,520 km, and South Korea had a track length of about 4,128 km. Along with an extensive railway network, the region has been experiencing an expansion of the network, electrification of lines, and rapid urbanization, leading to increased passenger and freight transportation. Approximately 80,000 km of rail track out of 1,15,000 km of track is electrified in China, considered the world’s largest electrification. In China, the government plans to extend its rail network by adding 40,000 km of track length by 2025 to deploy passenger trains. India is one of the fastest-growing markets for electric locomotives due to the increasing investments by the Indian Government in rail electrification. According to the Indian Railways, approximately 90% of its broad-gauge routes have completed electrification. Out of the 65,350 km broad gauge route, 59,046 Km route had been electrified till June 2023. The number of electric tracks is expected to grow with the increase in investments in rail infrastructure.

Furthermore, China and Japan have a growing demand for nickel-cadmium and lithium batteries owing to their advantages over lead-acid batteries (in terms of energy density, maintenance, reliability, and efficiency). Nickel-cadmium batteries are widely accepted in various rolling stocks, such as locomotives, metros, light rail, trams, and high-speed trains. Lithium batteries are gaining acceptance in metros and high-speed trains for traction applications.

Additionally, Asian countries are at the forefront of adopting high-speed, suburban, and urban transit trains. For instance, in India, the Mumbai-Ahmedabad bullet train corridor trials will be conducted between Gujarat’s Bilimora and Surat in 2026. Indian Railways is also expected to launch semi-luxury passenger trains, metros, and high-speed trains. Thus, the rising need for electric locomotives, EMUs, and passenger coaches, and ongoing developments and progress in high-speed train projects will likely witness a higher demand for train batteries in conventional and advanced trains than in other regions. A strong presence of global train battery manufacturers like Saft and EnerSys, along with regional players such as Exide Industries (India), Amara Raja Batteries (India), GS Yuasa Corporation (Japan), Furukawa Battery Co., Ltd. (Japan), Hitachi Rail (Japan), Toshiba (Japan), Hunan Fengri Power & Electric Co. Ltd (China), and China Shoto (China) would excel the train battery market in the Asia Pacific region.

Train Battery Market Size, and Share

Key Market Players & Startups

The train battery market is dominated by players such as Saft (France), Enersys (US), Exide Industries (India),  GS Yuasa Corporation (Japan), Amara Raja Batteries Ltd (India), Hoppecke Batterien Gmbh & Co. Kg (Germany), SEC Battery (UK), First National Battery (South Africa), Power & Industrial Battery Systems GmbH (Germany), Exide Technologies (US) and Toshiba Corporation (Japan). These companies have developed new products, adopted expansion strategies, and undertaken collaborations, partnerships, and mergers & acquisitions to gain traction in the growing train battery market.

Get online access to the report on the World's First Market Intelligence Cloud

  • Easy to Download Historical Data & Forecast Numbers
  • Company Analysis Dashboard for high growth potential opportunities
  • Research Analyst Access for customization & queries
  • Competitor Analysis with Interactive dashboard
  • Latest News, Updates & Trend analysis
Request Sample

Scope of the Report

Report Metric

Details

Market size available for years

2018–2030

Base year considered

2022

Forecast period

2023–2030

Forecast volume

Units

Forecast value

USD Million

Segments Covered

By Battery Type, Battery Technology, Application, engines/head, application, advanced train type, aftermarket by rolling stock, aftermarket by battery type, application, and region, and OE by Region

Geographies Covered

Asia Pacific, Europe, North America, and the Rest of the World

Companies Covered

EnerSys (US), Exide Industries (India), Saft (France), Amara Raja Batteries (India), and GS Yuasa Corporation (Japan) (Total of 25 companies)

The study categorizes the train battery market based on by battery type, technology type, application, advanced train, rolling stock, Engines/head, and By application, and region.

By Battery Type
  • Lead Acid Battery
  • Nickel Cadmium Battery
  • Lithium Ion Battery
By Battery Technology
  • Conventional Lead Acid Battery
  • Valve Regulated Lead Acid Battery
  • Gel Tubular Lead Acid Battery
  • Sinter/PNE Ni-Cd Battery
  • Pocket Plate Ni-Cd Battery
  • Fiber/PNE Ni-Cd Battery
  • Lithium Iron Phosphate (LFP)
  • Lithium Titanate Oxide (LTO)
  • Others
By Engines/Head
  • Diesel Locomotives
  • Diesel Multiple Units (DMUs)
  • Electric Locomotives
  • Electric Multiple Units (EMUs)
By Application
  • Metros
  • High-speed Trains
  • Light Rails/Trams/Monorails
  • Passenger Coaches
By Application
  • Starter Battery
  • Auxiliary Battery
By Advance Train
By Region
  • Asia Pacific
  • Europe
  • North America
  • Rest of the World

Recent Developments

  • In April 2023, EnerSys acquired Industrial Battery and Charger Services Limited (IBCS) based out in the UK to strengthen its motive power service offerings in the UK.  The acquisition is a strategic maneuver by EnerSys aimed at broadening the scope of its motive power services and fortifying its position within the UK market.
  • In January 2023, EnerSys and Verkor SAS, a European battery technology company, initiated a non-binding Memorandum of Understanding to investigate establishing a lithium battery gigafactory in the US. This upcoming factory will provide a growth opportunity for both companies and allow EnerSys to optimize cell sizing in battery solutions for its customers.
  • In September 2022, Saft formed a supplier contract with Alstom to deliver MRX batteries for Grand Paris Express backup power applications. Saft has successfully delivered the initial ten battery systems intended for five trains, which are part of the overall requirement of up to 183 trains essential for the completion of three new lines (lines 15, 16, and 17) by 2030.
  • In May 2022, Saft, a subsidiary of TotalEnergies, started the supply of backup battery systems for Alstom’s Metropolis metro trains, which will be used on lines 15, 16, and 17 of the Grand Paris Express projects, the most extensive transportation initiative in Europe.
  • In March 2022, Exide Industries Ltd. entered a technological partnership with SVOLT Technology Ltd., China. The partnership will provide the necessary technology and know-how to establish India’s lithium-ion battery production unit.
  • In June 2020, Amara Raja Batteries Ltd. entered into a technological partnership with Gridtential Energy, Inc. to develop bipolar battery technology. Under the agreement, both companies will work on developing Silicon Joule bipolar reference batteries to determine improvements in cycle life, energy density, battery efficiency, charging rates, and manufacturability.

Frequently Asked Questions (FAQ):

To speak to our analyst for a discussion on the above findings, click Speak to Analyst

TABLE OF CONTENTS
 
1 INTRODUCTION (Page No. - 38)
    1.1 STUDY OBJECTIVES 
    1.2 MARKET DEFINITION 
           1.2.1 INCLUSIONS AND EXCLUSIONS
                    TABLE 1 SEGMENT-WISE INCLUSIONS AND EXCLUSIONS
    1.3 MARKET SCOPE 
           FIGURE 1 MARKETS COVERED
           1.3.1 REGIONS COVERED
           1.3.2 YEARS CONSIDERED
    1.4 CURRENCY CONSIDERED 
           TABLE 2 CURRENCY EXCHANGE RATES
    1.5 STAKEHOLDERS 
    1.6 SUMMARY OF CHANGES 
 
2 RESEARCH METHODOLOGY (Page No. - 45)
    2.1 RESEARCH DATA 
           FIGURE 2 RESEARCH DESIGN
           FIGURE 3 RESEARCH METHODOLOGY MODEL
           2.1.1 SECONDARY DATA
                    2.1.1.1 List of key secondary sources to estimate base numbers and market size (Locomotive & Rolling Stock)
                    2.1.1.2 Key data from secondary sources
           2.1.2 PRIMARY DATA
                    FIGURE 4 BREAKDOWN OF PRIMARY INTERVIEWS
                    2.1.2.1 Sampling techniques and data collection methods
           2.1.3 PRIMARY PARTICIPANTS
    2.2 MARKET SIZE ESTIMATION 
           FIGURE 5 RESEARCH METHODOLOGY: HYPOTHESIS BUILDING
           2.2.1 BOTTOM-UP APPROACH: TRAIN BATTERY MARKET, BY BATTERY TYPE AND ROLLING STOCK
                    FIGURE 6 BOTTOM-UP APPROACH, BY BATTERY TYPE AND ROLLING STOCK
           2.2.2 TOP-DOWN APPROACH: TRAIN BATTERY MARKET, BY BATTERY TECHNOLOGY
                    FIGURE 7 TOP-DOWN APPROACH, BY BATTERY TECHNOLOGY
    2.3 FACTOR ANALYSIS FOR MARKET SIZING: DEMAND AND SUPPLY SIDES 
    2.4 FACTOR ANALYSIS 
    2.5 RECESSION IMPACT 
    2.6 MARKET BREAKDOWN AND DATA TRIANGULATION 
           FIGURE 8 DATA TRIANGULATION
    2.7 RISKS AND ASSUMPTIONS 
           2.7.1 RESEARCH ASSUMPTIONS
           2.7.2 MARKET ASSUMPTIONS
                    TABLE 3 MARKET ASSUMPTIONS: NUMBER OF BATTERIES COUNT IN EACH ROLLING STOCK
                    TABLE 4 MARKET ASSUMPTIONS: NUMBER OF BATTERIES COUNT IN ADVANCED TRAINS
                    TABLE 5 MARKET ASSUMPTIONS AND RISK ANALYSIS
    2.8 RESEARCH LIMITATIONS 
 
3 EXECUTIVE SUMMARY (Page No. - 62)
    3.1 REPORT SUMMARY 
           FIGURE 9 TRAIN BATTERY MARKET OUTLOOK
           FIGURE 10 MARKET, BY REGION, 2023 VS. 2030 (USD MILLION)
 
4 PREMIUM INSIGHTS (Page No. - 65)
    4.1 ATTRACTIVE OPPORTUNITIES FOR PLAYERS IN TRAIN BATTERY MARKET 
           FIGURE 11 DEVELOPMENT OF HIGH-SPEED TRAINS AND EXPANSION OF URBAN RAIL NETWORKS TO DRIVE MARKET
    4.2 MARKET, BY BATTERY TYPE 
           FIGURE 12 NICKEL-CADMIUM BATTERIES SEGMENT TO HOLD LARGEST MARKET SHARE DURING FORECAST PERIOD
    4.3 MARKET, BY APPLICATION 
           FIGURE 13 AUXILIARY BATTERIES SEGMENT TO REGISTER HIGHEST CAGR DURING FORECAST PERIOD
    4.4 MARKET, BY BATTERY TECHNOLOGY 
           FIGURE 14 SINTER/PNE NI-CD SEGMENT TO LEAD MARKET DURING FORECAST PERIOD
    4.5 MARKET, BY ENGINE/HEAD 
           FIGURE 15 ELECTRIC LOCOMOTIVES SEGMENT TO REGISTER HIGHEST CAGR DURING FORECAST PERIOD
    4.6 MARKET, BY RAILWAY APPLICATION 
           FIGURE 16 PASSENGER COACHES SEGMENT TO HOLD LARGEST MARKET SHARE DURING FORECAST PERIOD
    4.7 MARKET, BY ADVANCED TRAIN TYPE 
           FIGURE 17 FULLY BATTERY-OPERATED TRAINS SEGMENT TO WITNESS HIGHER CAGR THAN HYBRID TRAINS SEGMENT DURING FORECAST PERIOD
    4.8 TRAIN BATTERY AFTERMARKET, BY ROLLING STOCK 
           FIGURE 18 COACHES SEGMENT TO LEAD AFTERMARKET DURING FORECAST PERIOD
    4.9 TRAIN BATTERY AFTERMARKET, BY BATTERY TYPE 
           FIGURE 19 LEAD-ACID BATTERIES SEGMENT TO HOLD LARGER MARKET SHARE THAN NICKEL-CADMIUM BATTERIES SEGMENT DURING FORECAST PERIOD
    4.10 TRAIN BATTERY AFTERMARKET, BY APPLICATION 
           FIGURE 20 AUXILIARY BATTERIES SEGMENT TO REGISTER HIGHER CAGR THAN STARTER BATTERIES SEGMENT DURING FORECAST PERIOD
    4.11 TRAIN BATTERY AFTERMARKET, BY REGION 
                    FIGURE 21 ASIA PACIFIC TO LEAD AFTERMARKET DURING FORECAST PERIOD
    4.12 MARKET, BY REGION 
                    FIGURE 22 ASIA PACIFIC ESTIMATED TO ACCOUNT FOR LARGEST MARKET SHARE IN 2023
 
5 MARKET OVERVIEW (Page No. - 71)
    5.1 INTRODUCTION 
    5.2 MARKET DYNAMICS 
           FIGURE 23 TRAIN BATTERY MARKET: DRIVERS, RESTRAINTS, OPPORTUNITIES, AND CHALLENGES
           5.2.1 DRIVERS
                    5.2.1.1 Increasing adoption of autonomous and high-speed railways
                               FIGURE 24 LENGTH OF HIGH-SPEED RAIL LINES IN OPERATION, BY REGION, 2022
                               TABLE 6 GRADE OF RAIL AUTOMATION
                               TABLE 7 LIST OF SEMI-AUTONOMOUS AND AUTONOMOUS METROS
                               FIGURE 25 EVOLUTION OF GOA4 INFRASTRUCTURE, 2012–2020
                    5.2.1.2 Stringent emission regulations
                               FIGURE 26 TOTAL COST OF OWNERSHIP COMPARISON FOR AVERAGE US CLASS I LINE-HAUL ELECTRIC AND DIESEL FREIGHT LOCOMOTIVES, 2001–2021
                               TABLE 8 RECENT DEVELOPMENTS IN BATTERY OR HYDROGEN FUEL CELL-BASED LOCOMOTIVES
                    5.2.1.3 Expansion of railway networks
                               TABLE 9 UPCOMING KEY RAIL PROJECTS, BY COUNTRY
           5.2.2 RESTRAINTS
                    5.2.2.1 High capital investment and operating cost of high-speed rail networks
           5.2.3 OPPORTUNITIES
                    5.2.3.1 Expansion of IoT, AI, and DAS technologies
                    5.2.3.2 Improvements in battery technology
                    5.2.3.3 Retrofitting of diesel-electric trains
           5.2.4 CHALLENGES
                    5.2.4.1 Technical challenges related to lead-acid and lithium-ion batteries
                               FIGURE 27 BATTERY CHEMISTRY COMPARISON
                    5.2.4.2 High cost of charging infrastructure and replacement
    5.3 TRENDS AND DISRUPTIONS IMPACTING CUSTOMER BUSINESS 
    5.4 MARKET ECOSYSTEM 
           FIGURE 28 TRAIN BATTERY MARKET ECOSYSTEM
           5.4.1 TRAIN BATTERY MANUFACTURERS
           5.4.2 COMPONENT/RAW MATERIAL SUPPLIERS
           5.4.3 TRAIN OEMS
           5.4.4 GOVERNMENT AND REGULATORY AUTHORITIES
                    FIGURE 29 MARKET SEGMENT ECOSYSTEM
           5.4.5 DEALERS AND DISTRIBUTORS
           5.4.6 SERVICE & REPAIR PROVIDERS
                    TABLE 10 MARKET: ROLE OF COMPANIES IN ECOSYSTEM
    5.5 VALUE CHAIN ANALYSIS 
           FIGURE 30 MARKET: VALUE CHAIN ANALYSIS
    5.6 SUPPLY CHAIN ANALYSIS 
           FIGURE 31 MARKET: SUPPLY CHAIN ANALYSIS
    5.7 REGULATORY LANDSCAPE 
           TABLE 11 NORTH AMERICA: LOCOMOTIVE AND BATTERY SYSTEMS REGULATIONS
           TABLE 12 EUROPE: LOCOMOTIVE AND BATTERY SYSTEMS REGULATIONS
           TABLE 13 ASIA PACIFIC: LOCOMOTIVE AND BATTERY SYSTEMS REGULATIONS
           5.7.1 REGULATORY BODIES, GOVERNMENT AGENCIES, AND OTHER ORGANIZATIONS
                    TABLE 14 NORTH AMERICA: LIST OF REGULATORY BODIES, GOVERNMENT AGENCIES, AND OTHER ORGANIZATIONS
                    TABLE 15 EUROPE: LIST OF REGULATORY BODIES, GOVERNMENT AGENCIES, AND OTHER ORGANIZATIONS
                    TABLE 16 ASIA PACIFIC: LIST OF REGULATORY BODIES, GOVERNMENT AGENCIES, AND OTHER ORGANIZATIONS
    5.8 TRADE ANALYSIS 
           5.8.1 IMPORT DATA
                    5.8.1.1 US
                               TABLE 17 US: RAIL LOCOMOTIVES POWERED BY ELECTRIC ACTUATORS (BATTERIES), BY COUNTRY (IMPORT VALUE %)
                    5.8.1.2 Canada
                               TABLE 18 CANADA: RAIL LOCOMOTIVES POWERED BY ELECTRIC ACTUATORS (BATTERIES), BY COUNTRY (IMPORT VALUE %)
                    5.8.1.3 Japan
                               TABLE 19 JAPAN: RAIL LOCOMOTIVES POWERED BY ELECTRIC ACTUATORS (BATTERIES), BY COUNTRY (IMPORT VALUE %)
                    5.8.1.4 India
                               TABLE 20 INDIA: RAIL LOCOMOTIVES POWERED BY ELECTRIC ACTUATORS (BATTERIES), BY COUNTRY (IMPORT VALUE %)
                    5.8.1.5 Germany
                               TABLE 21 GERMANY: RAIL LOCOMOTIVES POWERED BY ELECTRIC ACTUATORS (BATTERIES), BY COUNTRY (IMPORT VALUE %)
                    5.8.1.6 France
                               TABLE 22 FRANCE: RAIL LOCOMOTIVES POWERED BY ELECTRIC ACTUATORS (BATTERIES), BY COUNTRY (IMPORT VALUE %)
                    5.8.1.7 Spain
                               TABLE 23 SPAIN: RAIL LOCOMOTIVES POWERED BY ELECTRIC ACTUATORS (BATTERIES), BY COUNTRY (IMPORT VALUE %)
                    5.8.1.8 UK
                               TABLE 24 UK: RAIL LOCOMOTIVES POWERED BY ELECTRIC ACTUATORS (BATTERIES), BY COUNTRY (IMPORT VALUE %)
           5.8.2 EXPORT DATA
                    5.8.2.1 US
                               TABLE 25 US: RAIL LOCOMOTIVES POWERED BY ELECTRIC ACTUATORS (BATTERIES), BY COUNTRY (EXPORT VALUE %)
                    5.8.2.2 China
                               TABLE 26 CHINA: RAIL LOCOMOTIVES POWERED BY ELECTRIC ACTUATORS (BATTERIES), BY COUNTRY (EXPORT VALUE %)
                    5.8.2.3 Japan
                               TABLE 27 JAPAN: RAIL LOCOMOTIVES POWERED BY ELECTRIC ACTUATORS (BATTERIES), BY COUNTRY (EXPORT VALUE %)
                    5.8.2.4 Germany
                               TABLE 28 GERMANY: RAIL LOCOMOTIVES POWERED BY ELECTRIC ACTUATORS (BATTERIES), BY COUNTRY (EXPORT VALUE %)
                    5.8.2.5 France
                               TABLE 29 FRANCE: RAIL LOCOMOTIVES POWERED BY ELECTRIC ACTUATORS (BATTERIES), BY COUNTRY (EXPORT VALUE %)
                    5.8.2.6 Spain
                               TABLE 30 SPAIN: RAIL LOCOMOTIVES POWERED BY ELECTRIC ACTUATORS (BATTERIES), BY COUNTRY (EXPORT VALUE %)
                    5.8.2.7 UK
                               TABLE 31 UK: RAIL LOCOMOTIVES POWERED BY ELECTRIC ACTUATORS (BATTERIES), BY COUNTRY (EXPORT VALUE %)
    5.9 PRICING ANALYSIS 
           5.9.1 TRAIN BATTERY PRICING, BY REGION
                    TABLE 32 AVERAGE SELLING PRICE TREND, BY REGION, 2020 VS. 2022
           5.9.2 TRAIN BATTERY PRICING, BY BATTERY TYPE
                    TABLE 33 AVERAGE SELLING PRICE TREND, BY BATTERY TYPE, 2020 VS. 2022
    5.10 TECHNOLOGICAL ANALYSIS 
           5.10.1 OVERVIEW
                    5.10.1.1 MITRAC pulse traction batteries
                    5.10.1.2 MRX nickel batteries
                    5.10.1.3 Solid-state batteries
                    5.10.1.4 Lithium-sulfur batteries
    5.11 PATENT ANALYSIS 
    5.12 CASE STUDY ANALYSIS 
           5.12.1 CASE STUDY 1: PROJECT OF SEPTA AND VIRIDITY ENERGY TO INCREASE OPERATIONAL EFFICIENCY WITH LESS ENERGY CONSUMPTION
           5.12.2 CASE STUDY 2: RELIABLE AUTONOMOUS BATTERY SOLUTIONS FOR HARSH WEATHER FROM SAFT TO VR GROUP
           5.12.3 CASE STUDY 3: EMERGENCY BATTERY SYSTEM FROM SAFT TO CHENGDU METRO
           5.12.4 CASE STUDY 4: LITHIUM-ION BATTERY SOLUTIONS FROM SAFT TO ALSTROM TRANSPORT FOR DIFFERENT WEATHER CONDITIONS AND HIGH-VIBRATING ENVIRONMENTS
           5.12.5 CASE STUDY 5: DEVELOPMENT OF HYBRID TRAIN FOR NON-ELECTRIFIED SUBSECTIONS OF LINE
           5.12.6 CASE STUDY 6: ELECTRIFICATION OF RAIL MILLING TRAINS FOR EMISSION-FREE TRACK MAINTENANCE
           5.12.7 CASE STUDY 7: PARTNERSHIP BETWEEN HITACHI AND TURNTIDE TECHNOLOGIES TO PROVIDE MORE SUSTAINABLE RAIL JOURNEYS IN UK
    5.13 KEY CONFERENCES AND EVENTS 
           5.13.1 TRAIN BATTERY MARKET: LIST OF CONFERENCES AND EVENTS, 2023–2024
    5.14 BUYING CRITERIA 
                    FIGURE 32 KEY BUYING CRITERIA FOR NICKEL-CADMIUM VS. LITHIUM-ION BATTERIES
                    TABLE 34 KEY BUYING CRITERIA FOR NICKEL-CADMIUM VS. LITHIUM-ION BATTERIES
    5.15 BILL OF MATERIALS 
                    FIGURE 33 COMPARISON OF BILL OF MATERIALS OF LEAD-ACID AND NI-CD BATTERIES, 2023
 
6 TRAIN BATTERY MARKET, BY APPLICATION & BATTERY TYPE (Page No. - 110)
    6.1 INTRODUCTION 
           6.1.1 INDUSTRY INSIGHTS
                    FIGURE 34 MARKET, BY APPLICATION, 2023 VS. 2030 (USD MILLION)
                    TABLE 35 MARKET, BY APPLICATION, 2018–2022 (UNITS)
                    TABLE 36 MARKET, BY APPLICATION, 2023–2030 (UNITS)
                    TABLE 37 MARKET, BY APPLICATION, 2018–2022 (USD MILLION)
                    TABLE 38 MARKET, BY APPLICATION, 2023–2030 (USD MILLION)
    6.2 STARTER BATTERIES 
           TABLE 39 STARTER BATTERY MARKET, BY BATTERY TYPE, 2018–2022 (UNITS)
           TABLE 40 STARTER BATTERY MARKET, BY BATTERY TYPE, 2023–2030 (UNITS)
           TABLE 41 STARTER BATTERY MARKET, BY BATTERY TYPE, 2018–2022 (USD MILLION)
           TABLE 42 STARTER BATTERY MARKET, BY BATTERY TYPE, 2023–2030 (USD MILLION)
           6.2.1 LEAD-ACID BATTERIES
                    6.2.1.1 Easy transportation and value for cost to increase demand in rail sector
                               TABLE 43 LEAD-ACID: STARTER BATTERY MARKET, BY REGION, 2018–2022 (UNITS)
                               TABLE 44 LEAD-ACID: STARTER BATTERY MARKET, BY REGION, 2023–2030 (UNITS)
                               TABLE 45 LEAD-ACID: STARTER BATTERY MARKET, BY REGION, 2018–2022 (USD MILLION)
                               TABLE 46 LEAD-ACID: STARTER BATTERY MARKET, BY REGION, 2023–2030 (USD MILLION)
           6.2.2 NI-CD BATTERIES
                    6.2.2.1 Uninterruptible power supply and high current supply for diesel starting motors to drive demand
                               TABLE 47 NI-CD: STARTER BATTERY MARKET, BY REGION, 2018–2022 (UNITS)
                               TABLE 48 NI-CD: STARTER BATTERY MARKET, BY REGION, 2023–2030 (UNITS)
                               TABLE 49 NI-CD: STARTER BATTERY MARKET, BY REGION, 2018–2022 (USD MILLION)
                               TABLE 50 NI-CD: STARTER BATTERY MARKET, BY REGION, 2023–2030 (USD MILLION)
    6.3 AUXILIARY BATTERIES 
           TABLE 51 AUXILIARY BATTERY MARKET, BY BATTERY TYPE, 2018–2022 (UNITS)
           TABLE 52 AUXILIARY BATTERY MARKET, BY BATTERY TYPE, 2023–2030 (UNITS)
           TABLE 53 AUXILIARY BATTERY MARKET, BY BATTERY TYPE, 2018–2022 (USD MILLION)
           TABLE 54 AUXILIARY BATTERY MARKET, BY BATTERY TYPE, 2023–2030 (USD MILLION)
           6.3.1 LEAD-ACID BATTERIES
                    6.3.1.1 Cost competitiveness and durability to increase demand in rail sector
                               TABLE 55 LEAD-ACID: AUXILIARY BATTERY MARKET, BY REGION, 2018–2022 (UNITS)
                               TABLE 56 LEAD-ACID: AUXILIARY BATTERY MARKET, BY REGION, 2023–2030 (UNITS)
                               TABLE 57 LEAD-ACID: AUXILIARY BATTERY MARKET, BY REGION, 2018–2022 (USD MILLION)
                               TABLE 58 LEAD-ACID: AUXILIARY BATTERY MARKET, BY REGION, 2023–2030 (USD MILLION)
           6.3.2 NI-CD BATTERIES
                    6.3.2.1 High energy density, longer lifespan, and ability to deliver high currents to increase market penetration
                               TABLE 59 NI-CD: AUXILIARY BATTERY MARKET, BY REGION, 2018–2022 (UNITS)
                               TABLE 60 NI-CD: AUXILIARY BATTERY MARKET, BY REGION, 2023–2030 (UNITS)
                               TABLE 61 NI-CD: AUXILIARY BATTERY MARKET, BY REGION, 2018–2022 (USD MILLION)
                               TABLE 62 NI-CD: AUXILIARY BATTERY MARKET, BY REGION, 2023–2030 (USD MILLION)
           6.3.3 LITHIUM-ION BATTERIES
                    6.3.3.1 Fast charging time, longer lifespan, and high energy density to drive adoption in rolling stock
                               TABLE 63 LITHIUM-ION: AUXILIARY BATTERY MARKET, BY REGION, 2018–2022 (UNITS)
                               TABLE 64 LITHIUM-ION: AUXILIARY BATTERY MARKET, BY REGION, 2023–2030 (UNITS)
                               TABLE 65 LITHIUM-ION: AUXILIARY BATTERY MARKET, BY REGION, 2018–2022 (USD MILLION)
                               TABLE 66 LITHIUM-ION: AUXILIARY BATTERY MARKET, BY REGION, 2023–2030 (USD MILLION)
 
7 TRAIN BATTERY MARKET, BY BATTERY TYPE & BATTERY TECHNOLOGY (Page No. - 125)
    7.1 INTRODUCTION 
           7.1.1 INDUSTRY INSIGHTS
                    FIGURE 35 MARKET, BY BATTERY TYPE, 2023 VS. 2030 (USD MILLION)
                    TABLE 67 MARKET, BY BATTERY TYPE, 2018–2022 (UNITS)
                    TABLE 68 MARKET, BY BATTERY TYPE, 2023–2030 (UNITS)
                    TABLE 69 MARKET, BY BATTERY TYPE, 2018–2022 (USD MILLION)
                    TABLE 70 MARKET, BY BATTERY TYPE, 2023–2030 (USD MILLION)
    7.2 LEAD-ACID BATTERIES 
           TABLE 71 LEAD-ACID BATTERY MARKET, BY BATTERY TECHNOLOGY, 2018–2022 (UNITS)
           TABLE 72 LEAD-ACID BATTERY MARKET, BY BATTERY TECHNOLOGY, 2023–2030 (UNITS)
           7.2.1 CONVENTIONAL LEAD-ACID BATTERIES
                    7.2.1.1 Growing popularity of VRLA batteries to impact demand for conventional lead-acid batteries
                               TABLE 73 CONVENTIONAL LEAD-ACID BATTERY MARKET, BY REGION, 2018–2022 (UNITS)
                               TABLE 74 CONVENTIONAL LEAD-ACID BATTERY MARKET, BY REGION, 2023–2030 (UNITS)
           7.2.2 VALVE-REGULATED LEAD-ACID BATTERIES
                    7.2.2.1 High reliability and low cost of ownership to drive market
                               TABLE 75 VALVE-REGULATED LEAD-ACID BATTERY MARKET, BY REGION, 2018–2022 (UNITS)
                               TABLE 76 VALVE-REGULATED LEAD-ACID BATTERY MARKET, BY REGION, 2023–2030 (UNITS)
           7.2.3 GEL TUBULAR LEAD-ACID BATTERIES
                    7.2.3.1 High current applications to increase demand
                               TABLE 77 GEL TUBULAR LEAD-ACID BATTERY MARKET, BY REGION, 2018–2022 (UNITS)
                               TABLE 78 GEL TUBULAR LEAD-ACID BATTERY MARKET, BY REGION, 2023–2030 (UNITS)
    7.3 NICKEL-CADMIUM BATTERIES 
           TABLE 79 NICKEL-CADMIUM BATTERY MARKET, BY BATTERY TECHNOLOGY, 2018–2022 (UNITS)
           TABLE 80 NICKEL-CADMIUM BATTERY MARKET, BY BATTERY TECHNOLOGY, 2023–2030 (UNITS)
           7.3.1 SINTER/PNE NICKEL-CADMIUM BATTERIES
                    7.3.1.1 Good chargeability and longer life cycle to drive demand
                               TABLE 81 SINTER/PNE NICKEL-CADMIUM BATTERY MARKET, BY REGION, 2018–2022 (UNITS)
                               TABLE 82 SINTER/PNE NICKEL-CADMIUM BATTERY MARKET, BY REGION, 2023–2030 (UNITS)
           7.3.2 POCKET PLATE NICKEL-CADMIUM BATTERIES
                    7.3.2.1 Lower energy density capacity and short lifetime to impact demand
                               TABLE 83 POCKET PLATE NICKEL-CADMIUM BATTERY MARKET, BY REGION, 2018–2022 (UNITS)
                               TABLE 84 POCKET PLATE NICKEL-CADMIUM BATTERY MARKET, BY REGION, 2023–2030 (UNITS)
           7.3.3 FIBER/PNE NICKEL-CADMIUM BATTERIES
                    7.3.3.1 Reduction in shortcomings of second-generation nickel-cadmium battery technology to drive demand
                               TABLE 85 FIBER/PNE NICKEL-CADMIUM BATTERY MARKET, BY REGION, 2018–2022 (UNITS)
                               TABLE 86 FIBER/PNE NICKEL-CADMIUM BATTERY MARKET, BY REGION, 2023–2030 (UNITS)
    7.4 LITHIUM-ION BATTERIES 
           TABLE 87 LITHIUM-ION BATTERY MARKET, BY BATTERY TECHNOLOGY, 2018–2022 (UNITS)
           TABLE 88 LITHIUM-ION BATTERY MARKET, BY BATTERY TECHNOLOGY, 2023–2030 (UNITS)
           7.4.1 LITHIUM IRON PHOSPHATE BATTERIES
                    7.4.1.1 Good chargeability and longer life cycle to drive demand
                               TABLE 89 LITHIUM IRON PHOSPHATE BATTERY MARKET, BY REGION, 2018–2022 (UNITS)
                               TABLE 90 LITHIUM IRON PHOSPHATE BATTERY MARKET, BY REGION, 2023–2030 (UNITS)
           7.4.2 LITHIUM TITANATE OXIDE BATTERIES
                    7.4.2.1 Fast charging capability to drive demand
                               TABLE 91 LITHIUM TITANATE OXIDE BATTERY MARKET, BY REGION, 2018–2022 (UNITS)
                               TABLE 92 LITHIUM TITANATE OXIDE BATTERY MARKET, BY REGION, 2023–2030 (UNITS)
           7.4.3 OTHERS
                    TABLE 93 OTHER LITHIUM-ION BATTERY MARKET, BY REGION, 2018–2022 (UNITS)
                    TABLE 94 OTHER LITHIUM-ION BATTERY MARKET, BY REGION, 2023–2030 (UNITS)
 
8 TRAIN BATTERY MARKET, BY ENGINE/HEAD (Page No. - 140)
    8.1 INTRODUCTION 
           8.1.1 INDUSTRY INSIGHTS
                    FIGURE 36 MARKET, BY ENGINE/HEAD, 2023 VS. 2030 (USD MILLION)
                    TABLE 95 MARKET, BY ENGINE/HEAD, 2018–2022 (UNITS)
                    TABLE 96 MARKET, BY ENGINE/HEAD, 2023–2030 (UNITS)
                    TABLE 97 MARKET, BY ENGINE/HEAD, 2018–2022 (USD MILLION)
                    TABLE 98 MARKET, BY ENGINE/HEAD, 2023–2030 (USD MILLION)
    8.2 DIESEL LOCOMOTIVES 
           8.2.1 DEVELOPMENT OF FREIGHT TRAINS AND RAIL NETWORKS IN EMERGING ECONOMIES TO DRIVE MARKET
                    TABLE 99 DIESEL LOCOMOTIVES: TRAIN BATTERY MARKET, BY REGION, 2018–2022 (UNITS)
                    TABLE 100 DIESEL LOCOMOTIVES: MARKET, BY REGION, 2023–2030 (UNITS)
                    TABLE 101 DIESEL LOCOMOTIVES: MARKET, BY REGION, 2018–2022 (USD MILLION)
                    TABLE 102 DIESEL LOCOMOTIVES: MARKET, BY REGION, 2023–2030 (USD MILLION)
    8.3 DIESEL MULTIPLE UNITS 
           8.3.1 EXPANSION OF INTERCITY RAIL NETWORKS TO DRIVE MARKET
                    TABLE 103 DIESEL MULTIPLE UNITS: MARKET, BY REGION, 2018–2022 (UNITS)
                    TABLE 104 DIESEL MULTIPLE UNITS: MARKET, BY REGION, 2023–2030 (UNITS)
                    TABLE 105 DIESEL MULTIPLE UNITS: MARKET, BY REGION, 2018–2022 (USD MILLION)
                    TABLE 106 DIESEL MULTIPLE UNITS: MARKET, BY REGION, 2023–2030 (USD MILLION)
    8.4 ELECTRIC LOCOMOTIVES 
           8.4.1 LOW MAINTENANCE COST AND HIGHER OPERATIONAL EFFICIENCY TO DRIVE MARKET
                    TABLE 107 ELECTRIC LOCOMOTIVES: TRAIN BATTERY MARKET, BY REGION, 2018–2022 (UNITS)
                    TABLE 108 ELECTRIC LOCOMOTIVES: MARKET, BY REGION, 2023–2030 (UNITS)
                    TABLE 109 ELECTRIC LOCOMOTIVES: MARKET, BY REGION, 2018–2022 (USD MILLION)
                    TABLE 110 ELECTRIC LOCOMOTIVES: MARKET, BY REGION, 2023–2030 (USD MILLION)
    8.5 ELECTRIC MULTIPLE UNITS 
           8.5.1 ADVANCEMENTS IN LIGHTING SOLUTIONS, SAFETY DOORS, AND HVACS TO DRIVE MARKET
                    TABLE 111 ELECTRIC MULTIPLE UNITS: MARKET, BY REGION, 2018–2022 (UNITS)
                    TABLE 112 ELECTRIC MULTIPLE UNIT: MARKET, BY REGION, 2023–2030 (UNITS)
                    TABLE 113 ELECTRIC MULTIPLE UNITS: MARKET, BY REGION, 2018–2022 (USD MILLION)
                    TABLE 114 ELECTRIC MULTIPLE UNITS: MARKET, BY REGION, 2023–2030 (USD MILLION)
 
9 TRAIN BATTERY MARKET, BY RAILWAY APPLICATION (Page No. - 151)
    9.1 INTRODUCTION 
           9.1.1 INDUSTRY INSIGHTS
                    FIGURE 37 MARKET, BY RAILWAY APPLICATION, 2023 VS. 2030 (USD MILLION)
                    TABLE 115 MARKET, BY RAILWAY APPLICATION, 2018–2022 (UNITS)
                    TABLE 116 MARKET, BY RAILWAY APPLICATION, 2023–2030 (UNITS)
                    TABLE 117 MARKET, BY RAILWAY APPLICATION, 2018–2022 (USD MILLION)
                    TABLE 118 MARKET, BY RAILWAY APPLICATION, 2023–2030 (USD MILLION)
    9.2 METROS 
           9.2.1 EXPANSION OF URBAN RAIL NETWORK TO DRIVE DEMAND
                    TABLE 119 METROS: TRAIN BATTERY MARKET, BY REGION, 2018–2022 (UNITS)
                    TABLE 120 METROS: MARKET, BY REGION, 2023–2030 (UNITS)
                    TABLE 121 METROS: MARKET, BY REGION, 2018–2022 (USD MILLION)
                    TABLE 122 METROS: MARKET, BY REGION, 2023–2030 (USD MILLION)
    9.3 HIGH-SPEED TRAINS 
           9.3.1 INFRASTRUCTURE DEVELOPMENT AND NEED FOR CHEAPER AND FASTER TRANSPORTATION MODES TO DRIVE DEMAND
                    TABLE 123 HIGH-SPEED TRAINS: TRAIN BATTERY MARKET, BY REGION, 2018–2022 (UNITS)
                    TABLE 124 HIGH-SPEED TRAINS: MARKET, BY REGION, 2023–2030 (UNITS)
                    TABLE 125 HIGH-SPEED TRAINS: MARKET, BY REGION, 2018–2022 (USD MILLION)
                    TABLE 126 HIGH-SPEED TRAINS: MARKET, BY REGION, 2023–2030 (USD MILLION)
    9.4 LIGHT RAILS/TRAMS/MONORAILS 
           9.4.1 RAPID URBANIZATION AND AESTHETIC VALUE TO DRIVE DEMAND
                    TABLE 127 LIGHT RAILS/TRAMS/MONORAILS: TRAIN BATTERY MARKET, BY REGION, 2018–2022 (UNITS)
                    TABLE 128 LIGHT RAILS/TRAMS/MONORAILS: MARKET, BY REGION, 2023–2030 (UNITS)
                    TABLE 129 LIGHT RAILS/TRAMS/MONORAILS: MARKET, BY REGION, 2018–2022 (USD MILLION)
                    TABLE 130 LIGHT RAILS/TRAMS/MONORAILS: MARKET, BY REGION, 2023–2030 (USD MILLION)
    9.5 PASSENGER COACHES 
           9.5.1 RAIL EXPANSION PROJECTS AND INCREASING NUMBER OF PASSENGERS TO DRIVE DEMAND
                    TABLE 131 PASSENGER COACHES: MARKET, BY REGION, 2018–2022 (UNITS)
                    TABLE 132 PASSENGER COACHES: MARKET, BY REGION, 2023–2030 (UNITS)
                    TABLE 133 PASSENGER COACHES: MARKET, BY REGION, 2018–2022 (USD MILLION)
                    TABLE 134 PASSENGER COACHES: MARKET, BY REGION, 2023–2030 (USD MILLION)
 
10 TRAIN BATTERY MARKET, BY ADVANCED TRAIN TYPE (Page No. - 161)
     10.1 INTRODUCTION 
             10.1.1 INDUSTRY INSIGHTS
                       FIGURE 38 TRAIN BATTERY MARKET, BY ADVANCED TRAIN TYPE, 2023 VS. 2030 (USD MILLION)
                       TABLE 135 MARKET, BY ADVANCED TRAIN TYPE, 2018–2022 (UNITS)
                       TABLE 136 MARKET, BY ADVANCED TRAIN TYPE, 2023–2030 (UNITS)
                       TABLE 137 MARKET, BY ADVANCED TRAIN TYPE, 2018–2022 (USD MILLION)
                       TABLE 138 MARKET, BY ADVANCED TRAIN TYPE, 2023–2030 (USD MILLION)
     10.2 HYBRID TRAINS 
             10.2.1 REDUCTION IN ENERGY CONSUMPTION AND REDUCED LIFECYCLE COST TO DRIVE DEMAND
             10.2.2 OPERATIONAL DATA
                       TABLE 139 HYBRID TRAINS WITH PROPULSION TYPE
                       TABLE 140 HYBRID TRAIN BATTERY MARKET, BY REGION, 2018–2022 (UNITS)
                       TABLE 141 MARKET, BY REGION, 2023–2030 (UNITS)
                       TABLE 142 MARKET, BY REGION, 2018–2022 (USD MILLION)
                       TABLE 143 MARKET, BY REGION, 2023–2030 (USD MILLION)
     10.3 FULLY BATTERY-OPERATED TRAINS 
             10.3.1 EXPANSION OF RAIL NETWORK AND HIGHER COST OF ELECTRIFICATION TO DRIVE DEMAND
                       TABLE 144 FULLY BATTERY-OPERATED TRAIN BATTERY MARKET, BY REGION, 2018–2022 (UNITS)
                       TABLE 145 MARKET, BY REGION, 2023–2030 (UNITS)
                       TABLE 146 MARKET, BY REGION, 2018–2022 (USD MILLION)
                       TABLE 147 MARKET, BY REGION, 2023–2030 (USD MILLION)
     10.4 AUTONOMOUS TRAINS 
             10.4.1 CONTINUOUS DEVELOPMENTS, LOW COST OF OPERATION, AND LOW ENERGY CONSUMPTION TO DRIVE DEMAND
 
11 TRAIN BATTERY MARKET, BY REGION (Page No. - 169)
     11.1 INTRODUCTION 
             11.1.1 INDUSTRY INSIGHTS
                       FIGURE 39 TRAIN BATTERY MARKET, BY REGION, 2023–2030 (USD MILLION)
                       TABLE 148 MARKET, BY REGION, 2018–2022 (UNITS)
                       TABLE 149 MARKET, BY REGION, 2023–2030 (UNITS)
                       TABLE 150 MARKET, BY REGION, 2018–2022 (USD MILLION)
                       TABLE 151 MARKET, BY REGION, 2023–2030 (USD MILLION)
     11.2 ASIA PACIFIC 
             11.2.1 RECESSION IMPACT
                       FIGURE 40 ASIA PACIFIC: TRAIN BATTERY MARKET SNAPSHOT
                       TABLE 152 ASIA PACIFIC: MARKET, BY COUNTRY, 2018–2022 (UNITS)
                       TABLE 153 ASIA PACIFIC: MARKET, BY COUNTRY, 2023–2030 (UNITS)
                       TABLE 154 ASIA PACIFIC: MARKET, BY COUNTRY, 2018–2022 (USD MILLION)
                       TABLE 155 ASIA PACIFIC: MARKET, BY COUNTRY, 2023–2030 (USD MILLION)
             11.2.2 CHINA
                       11.2.2.1 Rail expansion projects to drive market
                                   TABLE 156 CHINA: TRAIN BATTERY MARKET, BY BATTERY TYPE, 2018–2022 (UNITS)
                                   TABLE 157 CHINA: MARKET, BY BATTERY TYPE, 2023–2030 (UNITS)
                                   TABLE 158 CHINA: MARKET, BY BATTERY TYPE, 2018–2022 (USD MILLION)
                                   TABLE 159 CHINA: MARKET, BY BATTERY TYPE, 2023–2030 (USD MILLION)
             11.2.3 INDIA
                       11.2.3.1 Electrification of rail routes to drive market
                                   TABLE 160 LIST OF APPROVED UPCOMING HIGH-SPEED RAILWAY PROJECTS IN INDIA
                                   TABLE 161 INDIA: MARKET, BY BATTERY TYPE, 2018–2022 (UNITS)
                                   TABLE 162 INDIA: MARKET, BY BATTERY TYPE, 2023–2030 (UNITS)
                                   TABLE 163 INDIA: MARKET, BY BATTERY TYPE, 2018–2022 (USD MILLION)
                                   TABLE 164 INDIA: MARKET, BY BATTERY TYPE, 2023–2030 (USD MILLION)
             11.2.4 JAPAN
                       11.2.4.1 Development of high-speed EMUs to drive market
                                   TABLE 165 JAPAN: MARKET, BY BATTERY TYPE, 2018–2022 (UNITS)
                                   TABLE 166 JAPAN: MARKET, BY BATTERY TYPE, 2023–2030 (UNITS)
                                   TABLE 167 JAPAN: MARKET, BY BATTERY TYPE, 2018–2022 (USD MILLION)
                                   TABLE 168 JAPAN: MARKET, BY BATTERY TYPE, 2023–2030 (USD MILLION)
             11.2.5 SOUTH KOREA
                       11.2.5.1 Strong urban rail network and development of high-speed rail service to drive market
                                   TABLE 169 SOUTH KOREA: MARKET, BY BATTERY TYPE, 2018–2022 (UNITS)
                                   TABLE 170 SOUTH KOREA: MARKET, BY BATTERY TYPE, 2023–2030 (UNITS)
                                   TABLE 171 SOUTH KOREA: MARKET, BY BATTERY TYPE, 2018–2022 (USD MILLION)
                                   TABLE 172 SOUTH KOREA: MARKET, BY BATTERY TYPE, 2023–2030 (USD MILLION)
     11.3 EUROPE 
             11.3.1 RECESSION IMPACT
                       FIGURE 41 EUROPE: MARKET SNAPSHOT
                       TABLE 173 EUROPE: MARKET, BY COUNTRY, 2018–2022 (UNITS)
                       TABLE 174 EUROPE: MARKET, BY COUNTRY, 2023–2030 (UNITS)
                       TABLE 175 EUROPE: MARKET, BY COUNTRY, 2018–2022 (USD MILLION)
                       TABLE 176 EUROPE: MARKET, BY COUNTRY, 2023–2030 (USD MILLION)
             11.3.2 GERMANY
                       11.3.2.1 Replacement of diesel locomotives with battery-operated trains to drive market
                                   TABLE 177 GERMANY: MARKET, BY BATTERY TYPE, 2018–2022 (UNITS)
                                   TABLE 178 GERMANY: MARKET, BY BATTERY TYPE, 2023–2030 (UNITS)
                                   TABLE 179 GERMANY: MARKET, BY BATTERY TYPE, 2018–2022 (USD MILLION)
                                   TABLE 180 GERMANY: MARKET, BY BATTERY TYPE, 2023–2030 (USD MILLION)
             11.3.3 FRANCE
                       11.3.3.1 Stringent emission norms for locomotives to boost demand for train batteries
                                   TABLE 181 FRANCE: MARKET, BY BATTERY TYPE, 2018–2022 (UNITS)
                                   TABLE 182 FRANCE: MARKET, BY BATTERY TYPE, 2023–2030 (UNITS)
                                   TABLE 183 FRANCE: MARKET, BY BATTERY TYPE, 2018–2022 (USD MILLION)
                                   TABLE 184 FRANCE: MARKET, BY BATTERY TYPE, 2023–2030 (USD MILLION)
             11.3.4 ITALY
                       11.3.4.1 Increasing demand for batteries for EMUs and light rails to drive market
                                   TABLE 185 ITALY: MARKET, BY BATTERY TYPE, 2018–2022 (UNITS)
                                   TABLE 186 ITALY: MARKET, BY BATTERY TYPE, 2023–2030 (UNITS)
                                   TABLE 187 ITALY: MARKET, BY BATTERY TYPE, 2018–2022 (USD MILLION)
                                   TABLE 188 ITALY: MARKET, BY BATTERY TYPE, 2023–2030 (USD MILLION)
             11.3.5 UK
                       11.3.5.1 Urban rail developments to drive market
                                   TABLE 189 UK: MARKET, BY BATTERY TYPE, 2018–2022 (UNITS)
                                   TABLE 190 UK: MARKET, BY BATTERY TYPE, 2023–2030 (UNITS)
                                   TABLE 191 UK: MARKET, BY BATTERY TYPE, 2018–2022 (USD MILLION)
                                   TABLE 192 UK: MARKET, BY BATTERY TYPE, 2023–2030 (USD MILLION)
             11.3.6 SPAIN
                       11.3.6.1 Investment in high-speed rail networks to drive market
                                   TABLE 193 SPAIN: MARKET, BY BATTERY TYPE, 2018–2022 (UNITS)
                                   TABLE 194 SPAIN: MARKET, BY BATTERY TYPE, 2023–2030 (UNITS)
                                   TABLE 195 SPAIN: MARKET, BY BATTERY TYPE, 2018–2022 (USD MILLION)
                                   TABLE 196 SPAIN: MARKET, BY BATTERY TYPE, 2023–2030 (USD MILLION)
             11.3.7 SWITZERLAND
                       11.3.7.1 Growing development of passenger trains to drive demand for batteries
                                   TABLE 197 SWITZERLAND: MARKET, BY BATTERY TYPE, 2018–2022 (UNITS)
                                   TABLE 198 SWITZERLAND: MARKET, BY BATTERY TYPE, 2023–2030 (UNITS)
                                   TABLE 199 SWITZERLAND: MARKET, BY BATTERY TYPE, 2018–2022 (USD MILLION)
                                   TABLE 200 SWITZERLAND: MARKET, BY BATTERY TYPE, 2023–2030 (USD MILLION)
             11.3.8 POLAND
                       11.3.8.1 Development of intercity trains to drive demand for batteries
                                   TABLE 201 POLAND: MARKET, BY BATTERY TYPE, 2018–2022 (UNITS)
                                   TABLE 202 POLAND: MARKET, BY BATTERY TYPE, 2023–2030 (UNITS)
                                   TABLE 203 POLAND: MARKET, BY BATTERY TYPE, 2018–2022 (USD MILLION)
                                   TABLE 204 POLAND: MARKET, BY BATTERY TYPE, 2023–2030 (USD MILLION)
             11.3.9 SWEDEN
                       11.3.9.1 Rising demand for regional trains to drive market
                                   TABLE 205 SWEDEN: MARKET, BY BATTERY TYPE, 2018–2022 (UNITS)
                                   TABLE 206 SWEDEN: MARKET, BY BATTERY TYPE, 2023–2030 (UNITS)
                                   TABLE 207 SWEDEN: MARKET, BY BATTERY TYPE, 2018–2022 (USD MILLION)
                                   TABLE 208 SWEDEN: MARKET, BY BATTERY TYPE, 2023–2030 (USD MILLION)
     11.4 NORTH AMERICA 
             11.4.1 RECESSION IMPACT
                       FIGURE 42 NORTH AMERICA: MARKET SNAPSHOT
                       TABLE 209 NORTH AMERICA: MARKET, BY COUNTRY, 2018–2022 (UNITS)
                       TABLE 210 NORTH AMERICA: MARKET, BY COUNTRY, 2023–2030 (UNITS)
                       TABLE 211 NORTH AMERICA: MARKET, BY COUNTRY, 2018–2022 (USD MILLION)
                       TABLE 212 NORTH AMERICA: MARKET, BY COUNTRY, 2023–2030 (USD MILLION)
             11.4.2 US
                       11.4.2.1 Rising diesel prices to drive market
                                   TABLE 213 US: MARKET, BY BATTERY TYPE, 2018–2022 (UNITS)
                                   TABLE 214 US: MARKET, BY BATTERY TYPE, 2023–2030 (UNITS)
                                   TABLE 215 US: MARKET, BY BATTERY TYPE, 2018–2022 (USD MILLION)
                                   TABLE 216 US: MARKET, BY BATTERY TYPE, 2023–2030 (USD MILLION)
             11.4.3 CANADA
                       11.4.3.1 Development of commuter trains like metros and passenger rails to drive demand for batteries
                                   TABLE 217 CANADA: MARKET, BY BATTERY TYPE, 2018–2022 (UNITS)
                                   TABLE 218 CANADA: MARKET, BY BATTERY TYPE, 2023–2030 (UNITS)
                                   TABLE 219 CANADA: MARKET, BY BATTERY TYPE, 2018–2022 (USD MILLION)
                                   TABLE 220 CANADA: MARKET, BY BATTERY TYPE, 2023–2030 (USD MILLION)
             11.4.4 MEXICO
                       11.4.4.1 Growing development of catenary-free rail tracks to drive market
                                   TABLE 221 MEXICO: MARKET, BY BATTERY TYPE, 2018–2022 (UNITS)
                                   TABLE 222 MEXICO: MARKET, BY BATTERY TYPE, 2023–2030 (UNITS)
                                   TABLE 223 MEXICO: MARKET, BY BATTERY TYPE, 2018–2022 (USD MILLION)
                                   TABLE 224 MEXICO: MARKET, BY BATTERY TYPE, 2023–2030 (USD MILLION)
     11.5 REST OF THE WORLD 
             11.5.1 RECESSION IMPACT
                       FIGURE 43 REST OF THE WORLD: MARKET, 2023 VS. 2030 (USD MILLION)
                       TABLE 225 REST OF THE WORLD: MARKET, BY COUNTRY, 2018–2022 (UNITS)
                       TABLE 226 REST OF THE WORLD: MARKET, BY COUNTRY, 2023–2030 (UNITS)
                       TABLE 227 REST OF THE WORLD: MARKET, BY COUNTRY, 2018–2022 (USD MILLION)
                       TABLE 228 REST OF THE WORLD: MARKET, BY COUNTRY, 2023–2030 (USD MILLION)
             11.5.2 BRAZIL
                       11.5.2.1 Growing demand for auxiliary function batteries to drive market
                                   TABLE 229 BRAZIL: MARKET, BY BATTERY TYPE, 2018–2022 (UNITS)
                                   TABLE 230 BRAZIL: MARKET, BY BATTERY TYPE, 2023–2030 (UNITS)
                                   TABLE 231 BRAZIL: MARKET, BY BATTERY TYPE, 2018–2022 (USD MILLION)
                                   TABLE 232 BRAZIL: MARKET, BY BATTERY TYPE, 2023–2030 (USD MILLION)
             11.5.3 RUSSIA
                       11.5.3.1 Increasing demand for wide temperature-range rail batteries to drive market
                                   TABLE 233 RUSSIA: MARKET, BY BATTERY TYPE, 2018–2022 (UNITS)
                                   TABLE 234 RUSSIA: MARKET, BY BATTERY TYPE, 2023–2030 (UNITS)
                                   TABLE 235 RUSSIA: MARKET, BY BATTERY TYPE, 2018–2022 (USD MILLION)
                                   TABLE 236 RUSSIA: MARKET, BY BATTERY TYPE, 2023–2030 (USD MILLION)
 
12 TRAIN BATTERY AFTERMARKET, BY ROLLING STOCK (Page No. - 212)
     12.1 INTRODUCTION 
             12.1.1 INDUSTRY INSIGHTS
                       FIGURE 44 TRAIN BATTERY AFTERMARKET, BY ROLLING STOCK, 2023 VS. 2030 (USD MILLION)
                       TABLE 237 TRAIN BATTERY AFTERMARKET, BY ROLLING STOCK, 2018–2022 (UNITS)
                       TABLE 238 TRAIN BATTERY AFTERMARKET, BY ROLLING STOCK, 2023–2030 (UNITS)
                       TABLE 239 TRAIN BATTERY AFTERMARKET, BY ROLLING STOCK, 2018–2022 (USD MILLION)
                       TABLE 240 TRAIN BATTERY AFTERMARKET, BY ROLLING STOCK, 2023–2030 (USD MILLION)
     12.2 LOCOMOTIVES 
             12.2.1 IMPROVED LIFE CYCLE OF LOCOMOTIVES TO DRIVE DEMAND FOR TRAIN BATTERIES
                       TABLE 241 LOCOMOTIVES: TRAIN BATTERY AFTERMARKET, BY REGION, 2018–2022 (UNITS)
                       TABLE 242 LOCOMOTIVES: TRAIN BATTERY AFTERMARKET, BY REGION, 2023–2030 (UNITS)
                       TABLE 243 LOCOMOTIVES: TRAIN BATTERY AFTERMARKET, BY REGION, 2018–2022 (USD MILLION)
                       TABLE 244 LOCOMOTIVES: TRAIN BATTERY AFTERMARKET, BY REGION, 2023–2030 (USD MILLION)
     12.3 MULTIPLE UNITS 
             12.3.1 ADVANCED FEATURES IN URBAN TRANSIT SYSTEMS TO INCREASE TRAIN BATTERY ADOPTION IN MULTIPLE UNITS
                       TABLE 245 MULTIPLE UNITS: TRAIN BATTERY AFTERMARKET, BY REGION, 2018–2022 (UNITS)
                       TABLE 246 MULTIPLE UNITS: TRAIN BATTERY AFTERMARKET, BY REGION, 2023–2030 (UNITS)
                       TABLE 247 MULTIPLE UNITS: TRAIN BATTERY AFTERMARKET, BY REGION, 2018–2022 (USD MILLION)
                       TABLE 248 MULTIPLE UNITS: TRAIN BATTERY AFTERMARKET, BY REGION, 2023–2030 (USD MILLION)
     12.4 PASSENGER COACHES 
             12.4.1 REFURBISHMENT PROJECTS TO EXTEND OPERATIONAL LIFE OF PASSENGER COACHES TO BOOST DEMAND
                       TABLE 249 PASSENGER COACHES: TRAIN BATTERY AFTERMARKET, BY REGION, 2018–2022 (UNITS)
                       TABLE 250 PASSENGER COACHES: TRAIN BATTERY AFTERMARKET, BY REGION, 2023–2030 (UNITS)
                       TABLE 251 PASSENGER COACHES: TRAIN BATTERY AFTERMARKET, BY REGION, 2018–2022 (USD MILLION)
                       TABLE 252 PASSENGER COACHES: TRAIN BATTERY AFTERMARKET, BY REGION, 2023–2030 (USD MILLION)
 
13 TRAIN BATTERY AFTERMARKET, BY BATTERY TYPE (Page No. - 221)
     13.1 INTRODUCTION 
             13.1.1 INDUSTRY INSIGHTS
                       FIGURE 45 TRAIN BATTERY AFTERMARKET, BY BATTERY TYPE, 2023 VS. 2030 (USD MILLION)
                       TABLE 253 TRAIN BATTERY AFTERMARKET, BY BATTERY TYPE, 2018–2022 (UNITS)
                       TABLE 254 TRAIN BATTERY AFTERMARKET, BY BATTERY TYPE, 2023–2030 (UNITS)
                       TABLE 255 TRAIN BATTERY AFTERMARKET, BY BATTERY TYPE, 2018–2022 (USD MILLION)
                       TABLE 256 TRAIN BATTERY AFTERMARKET, BY BATTERY TYPE, 2023–2030 (USD MILLION)
     13.2 LEAD-ACID BATTERIES 
             13.2.1 FREQUENT REPLACEMENT RATE AND LOW CYCLE LIFE TO DRIVE DEMAND
                       TABLE 257 LEAD-ACID BATTERY AFTERMARKET, BY REGION, 2018–2022 (UNITS)
                       TABLE 258 LEAD-ACID BATTERY AFTERMARKET, BY REGION, 2023–2030 (UNITS)
                       TABLE 259 LEAD-ACID BATTERY AFTERMARKET, BY REGION, 2018–2022 (USD MILLION)
                       TABLE 260 LEAD-ACID BATTERY AFTERMARKET, BY REGION, 2023–2030 (USD MILLION)
     13.3 NICKEL-CADMIUM BATTERIES 
             13.3.1 LONGER LIFE AND EASY MAINTENANCE TO BOOST MARKET SHARE
                       TABLE 261 NICKEL-CADMIUM BATTERY AFTERMARKET, BY REGION, 2018–2022 (UNITS)
                       TABLE 262 NICKEL-CADMIUM BATTERY AFTERMARKET, BY REGION, 2023–2030 (UNITS)
                       TABLE 263 NICKEL-CADMIUM BATTERY AFTERMARKET, BY REGION, 2018–2022 (USD MILLION)
                       TABLE 264 NICKEL-CADMIUM BATTERY AFTERMARKET, BY REGION, 2023–2030 (USD MILLION)
 
14 TRAIN BATTERY AFTERMARKET, BY APPLICATION (Page No. - 227)
     14.1 INTRODUCTION 
             14.1.1 INDUSTRY INSIGHTS
                       FIGURE 46 TRAIN BATTERY AFTERMARKET, BY APPLICATION, 2023 VS. 2030 (USD MILLION)
                       TABLE 265 TRAIN BATTERY AFTERMARKET, BY APPLICATION, 2018–2022 (UNITS)
                       TABLE 266 TRAIN BATTERY AFTERMARKET, BY APPLICATION, 2023–2030 (UNITS)
                       TABLE 267 TRAIN BATTERY AFTERMARKET, BY APPLICATION, 2018–2022 (USD MILLION)
                       TABLE 268 TRAIN BATTERY AFTERMARKET, BY APPLICATION, 2023–2030 (USD MILLION)
     14.2 STARTER BATTERIES 
             14.2.1 REQUIREMENT FOR REPLACEMENT BATTERIES IN DMUS AND DIESEL LOCOMOTIVES TO DRIVE DEMAND
                       TABLE 269 STARTER BATTERY AFTERMARKET, BY REGION, 2018–2022 (UNITS)
                       TABLE 270 STARTER BATTERY AFTERMARKET, BY REGION, 2023–2030 (UNITS)
                       TABLE 271 STARTER BATTERY AFTERMARKET, BY REGION, 2018–2022 (USD MILLION)
                       TABLE 272 STARTER BATTERY AFTERMARKET, BY REGION, 2023–2030 (USD MILLION)
     14.3 AUXILIARY BATTERIES 
             14.3.1 GROWING POWER REQUIREMENT FOR ONBOARD ELECTRIC SYSTEMS TO RAISE DEMAND
                       TABLE 273 AUXILIARY BATTERY AFTERMARKET, BY REGION, 2018–2022 (UNITS)
                       TABLE 274 AUXILIARY BATTERY AFTERMARKET, BY REGION, 2023–2030 (UNITS)
                       TABLE 275 AUXILIARY BATTERY AFTERMARKET, BY REGION, 2018–2022 (USD MILLION)
                       TABLE 276 AUXILIARY BATTERY AFTERMARKET, BY REGION, 2023–2030 (USD MILLION)
 
15 TRAIN BATTERY AFTERMARKET, BY REGION (Page No. - 233)
     15.1 INTRODUCTION 
             15.1.1 INDUSTRY INSIGHTS
                       FIGURE 47 TRAIN BATTERY AFTERMARKET, BY REGION, 2023 VS. 2030 (USD MILLION)
                       TABLE 277 TRAIN BATTERY AFTERMARKET, BY REGION, 2018–2022 (UNITS)
                       TABLE 278 TRAIN BATTERY AFTERMARKET, BY REGION, 2023–2030 (UNITS)
                       TABLE 279 TRAIN BATTERY AFTERMARKET, BY REGION, 2018–2022 (USD MILLION)
                       TABLE 280 TRAIN BATTERY AFTERMARKET, BY REGION, 2023–2030 (USD MILLION)
     15.2 ASIA PACIFIC 
             15.2.1 HIGH NUMBER OF ROLLING STOCKS TO DRIVE REPLACEMENT DEMAND
     15.3 EUROPE 
             15.3.1 EXPANSION OF INTERCITY RAIL NETWORKS TO DRIVE DEMAND
     15.4 NORTH AMERICA 
             15.4.1 GROWING DIESEL LOCOMOTIVE RETROFITTING AND REFURBISHMENT TO DRIVE DEMAND
 
16 COMPETITIVE LANDSCAPE (Page No. - 237)
     16.1 OVERVIEW 
     16.2 MARKET SHARE ANALYSIS, 2022 
               TABLE 281 TRAIN BATTERY MARKET SHARE ANALYSIS, 2022
     16.3 MARKET SHARE ANALYSIS, 2022 
               FIGURE 48 MARKET SHARE ANALYSIS, 2022
     16.4 REVENUE ANALYSIS OF TOP LISTED/PUBLIC PLAYERS 
               FIGURE 49 REVENUE ANALYSIS OF TOP 5 MARKET PLAYERS, 2020–2022
     16.5 COMPANY EVALUATION MATRIX 
             16.5.1 STARS
             16.5.2 EMERGING LEADERS
             16.5.3 PERVASIVE PLAYERS
             16.5.4 PARTICIPANTS
                       FIGURE 50 COMPANY EVALUATION MATRIX: TRAIN BATTERY MANUFACTURERS, 2022
             16.5.5 COMPANY FOOTPRINT
                       TABLE 282 MARKET: COMPANY PRODUCT FOOTPRINT, 2022
                       TABLE 283 MARKET: COMPANY APPLICATION FOOTPRINT, 2022
                       TABLE 284 TRAIN BATTERY MARKET: COMPANY REGION FOOTPRINT, 2022
     16.6 COMPANY EVALUATION MATRIX – BATTERY MANUFACTURERS FOR FULLY BATTERY-OPERATED TRAINS 
             16.6.1 STARS
             16.6.2 EMERGING LEADERS
             16.6.3 PERVASIVE PLAYERS
             16.6.4 PARTICIPANTS
                       FIGURE 51 COMPANY EVALUATION MATRIX: BATTERY MANUFACTURERS FOR FULLY BATTERY-OPERATED TRAINS, 2022
             16.6.5 COMPANY FOOTPRINT
                       TABLE 285 COMPANY PRODUCT FOOTPRINT, 2022
                       TABLE 286 COMPANY APPLICATION FOOTPRINT, 2022
                       TABLE 287 COMPANY REGION FOOTPRINT, 2022
     16.7 COMPETITIVE SCENARIO 
             16.7.1 PRODUCT LAUNCHES
                       TABLE 288 PRODUCT LAUNCHES, 2018–2023
             16.7.2 DEALS
                       TABLE 289 DEALS, 2018–2023
             16.7.3 OTHERS
                       TABLE 290 OTHERS, 2018–2023
     16.8 KEY PLAYER STRATEGIES/RIGHT TO WIN, 2018–2022 
               TABLE 291 COMPANIES ADOPTED PRODUCT DEVELOPMENTS AND EXPANSIONS AS KEY GROWTH STRATEGIES, 2018–2022
     16.9 MAJOR BATTERY SUPPLIERS – CURRENT PRODUCT OFFERINGS AND FUTURE PRODUCT PLANS 
               TABLE 292 CURRENT VS. FUTURE PRODUCT PLANS
 
17 COMPANY PROFILES (Page No. - 261)
     17.1 KEY PLAYERS 
(Business Overview, Products/Services/Solutions Offered, MnM View, Key Strengths and Right to Win, Strategic Choices Made, Weaknesses and Competitive Threats, Recent Developments)*
             17.1.1 ENERSYS
                       TABLE 293 ENERSYS: COMPANY OVERVIEW
                       FIGURE 52 ENERSYS: COMPANY SNAPSHOT
                       TABLE 294 ENERSYS: PRODUCT LAUNCHES
                       TABLE 295 ENERSYS: DEALS
             17.1.2 SAFT
                       TABLE 296 SAFT: COMPANY OVERVIEW
                       TABLE 297 SAFT: DEALS
                       TABLE 298 SAFT: OTHERS
             17.1.3 GS YUASA INTERNATIONAL LTD.
                       TABLE 299 GS YUASA INTERNATIONAL LTD.: COMPANY OVERVIEW
                       FIGURE 53 GS YUASA INTERNATIONAL LTD.: COMPANY SNAPSHOT
                       TABLE 300 GS YUASA INTERNATIONAL LTD.: PRODUCT LAUNCHES
                       TABLE 301 GS YUASA INTERNATIONAL LTD.: OTHERS
             17.1.4 EXIDE INDUSTRIES LTD.
                       TABLE 302 EXIDE INDUSTRIES LTD.: COMPANY OVERVIEW
                       FIGURE 54 EXIDE INDUSTRIES LTD.: COMPANY SNAPSHOT
                       TABLE 303 EXIDE INDUSTRIES LTD.: DEALS
                       TABLE 304 EXIDE INDUSTRIES LTD.: OTHERS
             17.1.5 AMARA RAJA BATTERIES LIMITED
                       TABLE 305 AMARA RAJA BATTERIES LIMITED: COMPANY OVERVIEW
                       FIGURE 55 AMARA RAJA BATTERIES LIMITED: COMPANY SNAPSHOT
                       TABLE 306 AMARA RAJA BATTERIES LIMITED: DEALS
                       TABLE 307 AMARA RAJA BATTERIES LIMITED: OTHERS
             17.1.6 HOPPECKE BATTERIEN GMBH & CO. KG
                       TABLE 308 HOPPECKE BATTERIEN GMBH & CO. KG: COMPANY OVERVIEW
                       TABLE 309 HOPPECKE BATTERIEN GMBH & CO. KG: DEALS
                       TABLE 310 HOPPECKE BATTERIEN GMBH & CO. KG: OTHERS
             17.1.7 SEC BATTERY
                       TABLE 311 SEC BATTERY: COMPANY OVERVIEW
             17.1.8 FIRST NATIONAL BATTERY
                       TABLE 312 FIRST NATIONAL BATTERY: COMPANY OVERVIEW
             17.1.9 POWER & INDUSTRIAL BATTERY SYSTEMS GMBH
                       TABLE 313 POWER & INDUSTRIAL BATTERY SYSTEMS GMBH: COMPANY OVERVIEW
             17.1.10 EXIDE TECHNOLOGIES
                       TABLE 314 EXIDE TECHNOLOGIES: COMPANY OVERVIEW
             17.1.11 TOSHIBA CORPORATION
                       TABLE 315 TOSHIBA CORPORATION: COMPANY OVERVIEW
                       FIGURE 56 TOSHIBA CORPORATION: COMPANY SNAPSHOT
                       TABLE 316 TOSHIBA CORPORATION: PRODUCT LAUNCHES
                       TABLE 317 TOSHIBA CORPORATION: DEALS
                       TABLE 318 TOSHIBA CORPORATION: OTHERS
*Business Overview, Products/Services/Solutions Offered, MnM View, Key Strengths and Right to Win, Strategic Choices Made, Weaknesses and Competitive Threats, Recent Developments might not be captured in case of unlisted companies.
     17.2 OTHER PLAYERS 
             17.2.1 EAST PENN MANUFACTURING COMPANY
                       TABLE 319 EAST PENN MANUFACTURING COMPANY: COMPANY OVERVIEW
             17.2.2 MICROTEX ENERGY PRIVATE LIMITED
                       TABLE 320 MICROTEX ENERGY PRIVATE LIMITED: COMPANY OVERVIEW
             17.2.3 AEG POWER SOLUTIONS
                       TABLE 321 AEG POWER SOLUTIONS: COMPANY OVERVIEW
             17.2.4 FURUKAWA ELECTRIC CO., LTD.
                       TABLE 322 FURUKAWA ELECTRIC CO., LTD.: COMPANY OVERVIEW
             17.2.5 HUNAN FENGRI POWER & ELECTRIC CO., LTD.
                       TABLE 323 HUNAN FENGRI POWER & ELECTRIC CO., LTD.: COMPANY OVERVIEW
             17.2.6 SHUANGDENG GROUP CO., LTD.
                       TABLE 324 SHUANGDENG GROUP CO., LTD.: COMPANY OVERVIEW
             17.2.7 COSLIGHT INDIA
                       TABLE 325 COSLIGHT INDIA: COMPANY OVERVIEW
             17.2.8 SHIELD BATTERIES LIMITED
                       TABLE 326 SHIELD BATTERIES LIMITED: COMPANY OVERVIEW
             17.2.9 AKASOL AG
                       TABLE 327 AKASOL AG: COMPANY OVERVIEW
             17.2.10 DMS TECHNOLOGIES
                       TABLE 328 DMS TECHNOLOGIES: COMPANY OVERVIEW
             17.2.11 NATIONAL RAILWAY SUPPLY
                       TABLE 329 NATIONAL RAILWAY SUPPLY: COMPANY OVERVIEW
             17.2.12 LECLANCHÉ SA
                       TABLE 330 LECLANCHÉ SA: COMPANY OVERVIEW
             17.2.13 ECOBAT
                       TABLE 331 ECOBAT: COMPANY OVERVIEW
             17.2.14 HBL BATTERIES
                       TABLE 332 HBL BATTERIES: COMPANY OVERVIEW
             17.2.15 STAR BATTERY LTD.
                       TABLE 333 STAR BATTERY LTD.: COMPANY OVERVIEW
             17.2.16 HITACHI, LTD.
                       TABLE 334 HITACHI, LTD.: COMPANY OVERVIEW
 
18 RECOMMENDATIONS FROM MARKETSANDMARKETS (Page No. - 315)
     18.1 ASIA PACIFIC: POTENTIAL MARKET FOR TRAIN BATTERY MANUFACTURERS TO FOCUS ON 
     18.2 COST-EFFECTIVE BATTERY TECHNOLOGIES WITH HIGH ENERGY DENSITY: NEED OF FUTURE 
     18.3 CONCLUSION 
 
19 APPENDIX (Page No. - 317)
     19.1 INSIGHTS FROM INDUSTRY EXPERTS 
     19.2 DISCUSSION GUIDE 
     19.3 KNOWLEDGESTORE: MARKETSANDMARKETS’ SUBSCRIPTION PORTAL 
     19.4 CUSTOMIZATION OPTIONS 
             19.4.1 TRAIN BATTERY MARKET, BY APPLICATION AND ROLLING STOCK
                       19.4.1.1 Engine Starters
                       19.4.1.2 Auxiliary Functions
             19.4.2 TRAIN BATTERY MARKET, BY ROLLING STOCK AND BY BATTERY TYPE
                       19.4.2.1 Lead-acid
                       19.4.2.2 Nickel-Cadmium
                       19.4.2.3 Lithium-ion
             19.4.3 US TRAIN BATTERY AFTERMARKET, BY ROLLING STOCK
                       19.4.3.1 Locomotives
                       19.4.3.2 Multiple Units
                       19.4.3.3 Passenger Coaches
     19.5 RELATED REPORTS 
     19.6 AUTHOR DETAILS

The study involved four major activities in estimating the current size of the train battery market. Exhaustive secondary research was done to collect information on the market, the peer market, and the parent market. The next step was to validate these findings, assumptions, and sizing with the industry experts across value chains through primary research. The bottom-up and top-down approaches were employed to estimate the complete market size. Thereafter, market breakdown and data triangulation processes were used to estimate the market size of segments and subsegments.

Secondary Research

The secondary sources referred to for this research study include corporate filings (such as annual reports, investor presentations, and financial statements), and trade, business, and industry associations. Secondary data has been collected and analyzed to arrive at the overall market size, which is further validated by primary research.

Primary Research

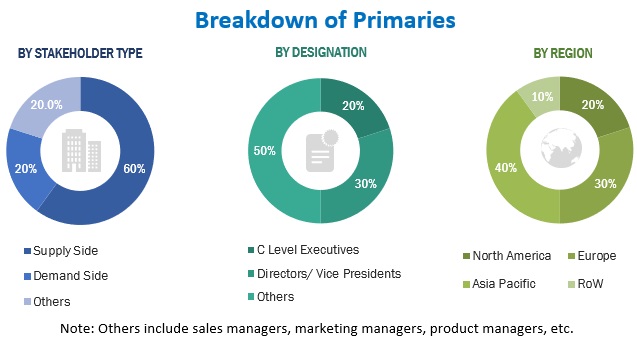
Extensive primary research has been conducted after acquiring an understanding of the train battery market through secondary research. Several primary interviews have been conducted with market experts from both, demand- (locomotive & rolling stock manufacturers) and supply-side (battery manufacturers) across major regions, namely, North America, Europe, Asia Pacific, and RoW. Approximately 60%, 20%, and 20% of primary interviews were conducted from the supply-side, demand-side, and others respectively. Primary data has been collected through questionnaires, emails, and telephonic interviews. In the primary research, we have strived to cover various departments within organizations, such as sales, operations, and administration, to enable a holistic approach in our report.

After interacting with industry experts, we also conducted brief sessions with highly experienced independent consultants to reinforce the findings through the primaries conducted by us. This, along with the opinions of in-house subject matter experts, led us to the findings that have been delineated in this report.
Train Battery Market Size, and Share

To know about the assumptions considered for the study, download the pdf brochure

Market Size Estimation

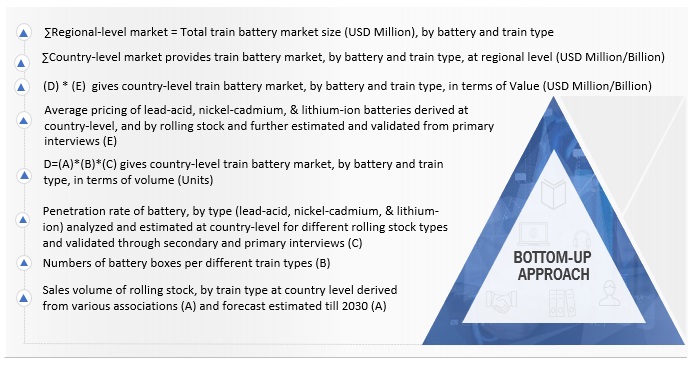
The study uses the bottom-up approach to estimate the market size and forecast the same for segments such as train type and battery type for each country considered under the scope of the study. The study covers the impact of the COVID-19 pandemic on the demand for various train types. The country-level forecast of train types is based on various secondary sources to understand the recovery period of the market and validate the same from industry experts. Once the base numbers were calculated, each train type was studied for the penetration of battery types in the same for all countries under the scope of the study. Then the Average Selling Price (ASP) was multiplied by each battery type for all train types to arrive at the country-wise value of the train and battery types. These numbers when collated represent the regional and global market size and forecast (volume as well as value) for train and battery types.

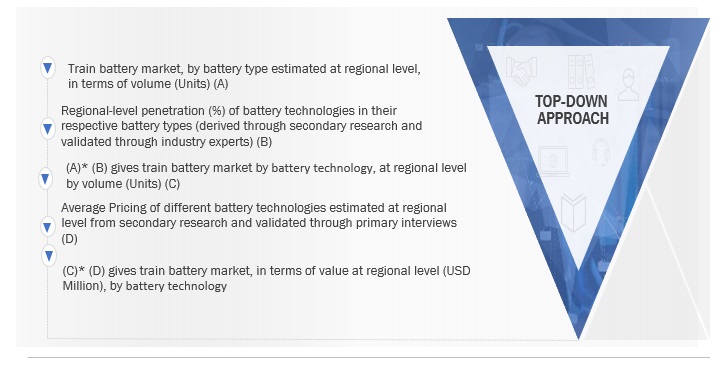
The top-down approach was used to estimate and validate the market size of the segment – battery technology. The market for battery type was arrived at using the bottom-down approach to estimate the battery technology market. For instance, the market for the three types of lead-acid batteries (conventional lead-acid, VRLA, gel tubular) was arrived at using the base number of lead-acid batteries. This is done by referring to multiple secondary sources and validating the penetration of battery technologies (in each battery type) from various industry experts.

Bottom-up approach: Train Battery market, by Battery type and region
Train Battery Market Size, and Share

To know about the assumptions considered for the study, Request for Free Sample Report

Top-down approach: by Battery Technology, Application
Train Battery Market Size, and Share

Data Triangulation

After arriving at the overall market size—using the market size estimation processes as explained above—the market was split into several segments and subsegments. To complete the overall market engineering process and arrive at the exact statistics of each market segment and subsegment, data triangulation and market breakdown procedures were employed, wherever applicable. The data was triangulated by studying various factors and trends from both the demand and supply sides

Market Definition:

According to Saft, rail batteries are an important component of energy storage systems that are used for end-use applications such as starters, lighting, air conditioning, access mechanisms, water-filling systems, isolators, connectors, and battery management control (BMC) systems.

According to Exide Industries, The Train battery is securely housed within a battery enclosure located beneath the coach. In railway application, the battery operates in a dusty environment, experiences moderate to high levels of vibration, encounters fluctuating temperatures, has limited windows for inspection and maintenance, and operates continuously in a charge-discharge cycle. This represents the most rigorous evaluation of a battery's performance and longevity, emphasizing the critical significance of reliability.

Key Stakeholders:

  • Sales Head
  • Marketing Head
  • Design Manager
  • R&D Head

Report Objectives

  • To define, segment, analyze, and forecast (2023–2030) the train battery market size, in terms of volume (units) and value (USD million) based on:
    • OE By Battery Type (Lead-Acid, Nickel-Cadmium, and Lithium-ion)
    • OE By Battery Technology (Conventional Lead-Acid, Valve Regulated Lead-Acid, Gel Tubular Lead-Acid, Sinter/PNE Ni-Cd Battery, Pocket Plate Ni-Cd Battery, Fiber/PNE Ni-Cd Battery, Lithium Iron Phosphate, Lithium, Titanate Oxide, and Others)
    • OE By Application (Starter, and Auxiliary)
    • OE By Engines/Head (Diesel Locomotive, Diesel Multiple Units (DMUs), Electric Locomotive, and Electric Multiple Units (EMUs))
    • OE By Application (Metro, High-Speed Trains, Light Rail/ Trams/Monorail, Passenger Coaches)
    • OE By Advanced Train Type (Fully Battery-Powered Train, and Hybrid Train)
    • Aftermarket By battery type (Lead-Acid, Nickel-Cadmium)
    • Aftermarket By application (Starter, and Auxiliary)
    • Aftermarket By Rolling Stock (Locomotives, Multiple Units, and Passenger Coaches)
    • Aftermarket By Region (Asia Pacific, Europe, and North America)
    • OE By Region (North America, Europe, Asia Pacific, and the Rest of the World (RoW))
  • To analyze the recession impact on the train battery market
  • To understand the market dynamics (drivers, restraints, opportunities, and challenges) of the train battery market
  • To study the following with respect to the market
    • Supply Chain Analysis
    • Market Ecosystem
    • Technology Analysis
    • Trade Analysis
    • Case Study Analysis
    • Patent Analysis
    • Buying Criteria
    • Regulatory Landscape
    • Bill of Material
  • To estimate the following with respect to the market
    • Average Price Analysis
    • Market Share Analysis
  • To analyze the competitive landscape and prepare a competitive evaluation quadrant for the global players operating in the train battery market.
  • To analyze recent developments, alliances, joint ventures, mergers & acquisitions, new product launches, and other activities carried out by key industry participants in the train battery market

Available Customizations

With the given market data, MarketsandMarkets offers customizations in accordance with a company’s specific needs.

The following customization options are available for the report:

Train Battery Market, By Application, By Rolling Stock

  • Engine Starter
  • Auxiliary Function

Note: The segment would be further segmented by region.

Train Battery Market, By Rolling Stock, By Battery Type

  • Lead Acid
  • Nickel-Cadmium
  • Lithium-Ion

Note: The segment would be further segmented by region

US Train Battery Aftermarket, By Rolling Stock, By Battery Type

  • Locomotives
  • Multiple Units
  • Passenger Coaches
Custom Market Research Services

We will customize the research for you, in case the report listed above does not meet with your exact requirements. Our custom research will comprehensively cover the business information you require to help you arrive at strategic and profitable business decisions.

Request Customization

Instant Answers with GPT - Ask Now!

Ask real questions. Get complete answers !
Report Code
AT 6676
Published ON
Oct, 2023
Choose License Type
BUY NOW
  • SHARE
X
Request Customization
Speak to Analyst
Speak to Analyst
OR FACE-TO-FACE MEETING
PERSONALIZE THIS RESEARCH
  • Triangulate with your Own Data
  • Get Data as per your Format and Definition
  • Gain a Deeper Dive on a Specific Application, Geography, Customer or Competitor
  • Any level of Personalization
REQUEST A FREE CUSTOMIZATION
LET US HELP YOU!
  • What are the Known and Unknown Adjacencies Impacting the Train Battery Market
  • What will your New Revenue Sources be?
  • Who will be your Top Customer; what will make them switch?
  • Defend your Market Share or Win Competitors
  • Get a Scorecard for Target Partners
CUSTOMIZED WORKSHOP REQUEST
+1-888-600-6441
  • Call Us
  • +1-888-600-6441 (Corporate office hours)
  • +1-888-600-6441 (US/Can toll free)
  • +44-800-368-9399 (UK office hours)
CONNECT WITH US
ABOUT TRUST ONLINE
©2024 MarketsandMarkets Research Private Ltd. All rights reserved
DMCA.com Protection Status Website Feedback