5.2 MARKET DYNAMICS
DRIVERS
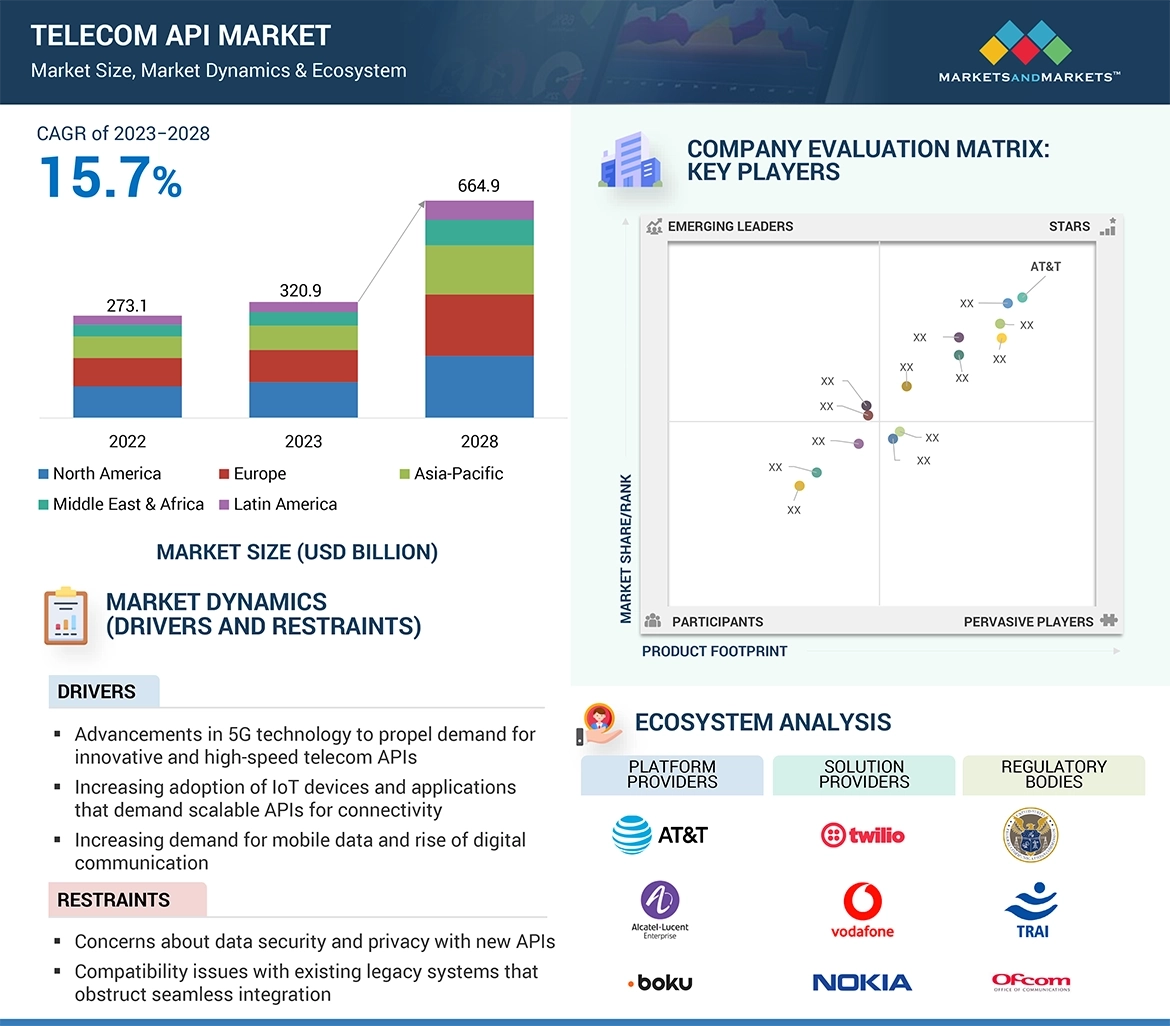
- Advancements in 5G technology to propel demand for innovative and high-speed telecom APIs
- Increasing adoption of IoT devices and applications that demand scalable APIs for connectivity
- Increasing demand for mobile data and rise of digital communication
- Increasing popularity of open APIs
RESTRAINTS
- Concerns about data security and privacy with new APIs
- Compatibility issues with existing legacy systems that obstruct seamless integration
OPPORTUNITIES
- Development of marketplaces for buying and selling APIs
- Valuable insights through API data analytics and creation of new revenue channels
CHALLENGES
- Technical complexity in management of various protocols and frameworks across different APIs
- Interoperability among diverse APIs and platforms hindered by absence of standardized protocols
5.3 INDUSTRY TRENDS
BRIEF HISTORY OF TELECOM API
- 1980s–1990s
- 1990s–2000s
- 2000–2010
- 2010–2020
- 2020–present
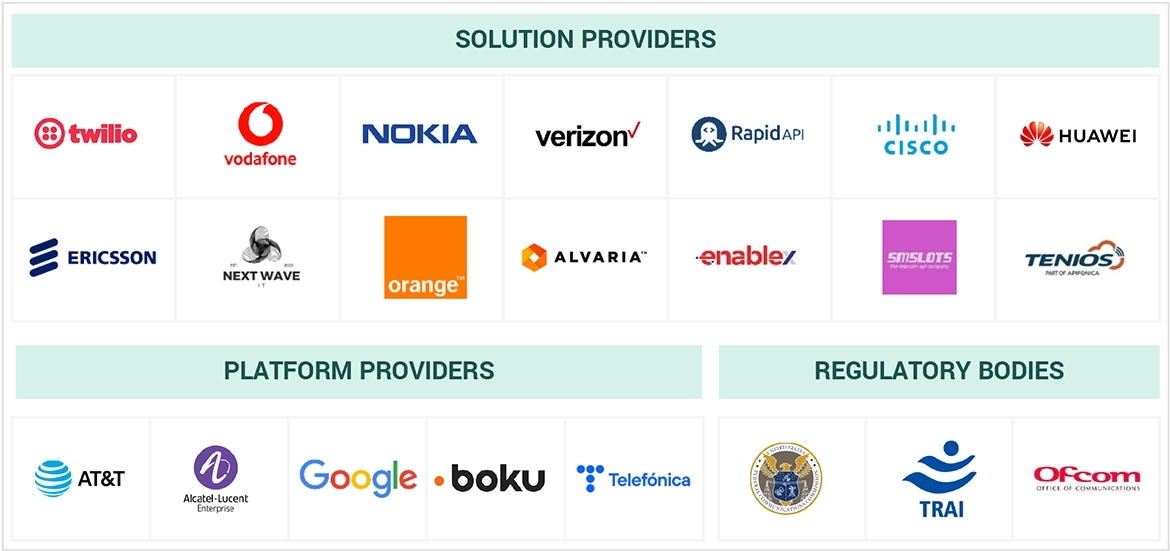
ECOSYSTEM: TELECOM API MARKET
CASE STUDY ANALYSIS
- Case Study 1: Twilio improves University of Warwick's student engagement and communication and security of student accounts
- Case Study 2: SmarterKey overcomes challenge of letting guests into rental properties with Twilio's two-way SMS capabilities
- Case Study 3: Wrizto Healthcare implements EnableX’s Live Video Calling API
- Case study 4: AT&T saves 2 million work hours annually with implementation of MuleSoft adopting API-led connectivity
- Case study 5: Apigee NeosAlpha helps Vodafone Network as a Platform to boost its API proxies performance
VALUE CHAIN ANALYSIS
REGULATORY LANDSCAPE
- Regulatory bodies, government agencies, and other organizations
- North America
- Europe
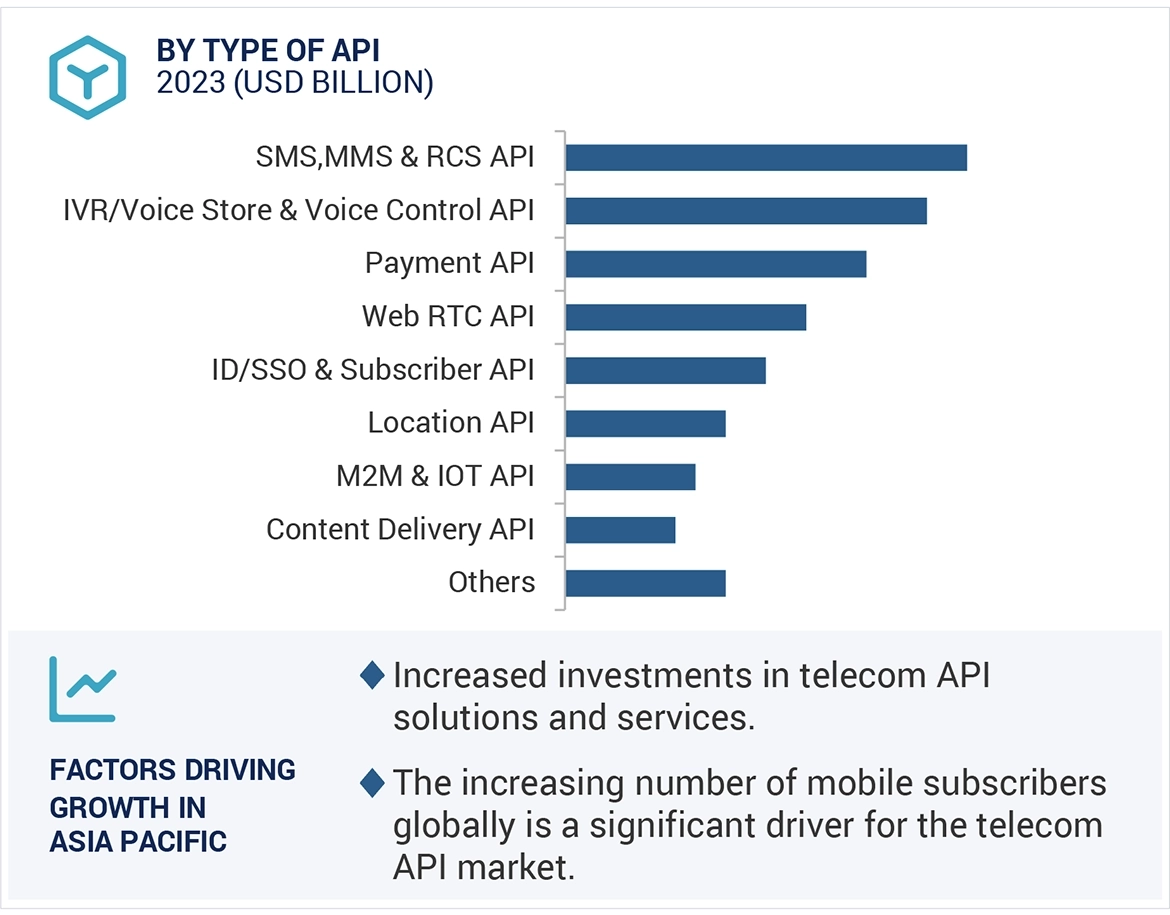
- Asia Pacific
- Middle East & Africa
- Latin America
PRICING ANALYSIS
- Average selling price trend of key players, by type of API
- Indicative pricing analysis, by type of API
TECHNOLOGY ANALYSIS
- Key technologies
- Complementary technologies
- Adjacent technologies
PATENT ANALYSIS
- Methodology
- List of major patents
KEY STAKEHOLDERS & BUYING CRITERIA
- Key stakeholders in buying criteria
- Buying criteria
KEY CONFERENCES & EVENTS, 2023–2024
PORTER’S FIVE FORCES ANALYSIS
- Threat of new entrants
- Threat of substitutes
- Bargaining power of buyers
- Bargaining power of suppliers
- Intensity of competitive rivalry
TRENDS AND DISRUPTIONS IMPACTING CUSTOMER'S BUSINESS
BEST PRACTICES IN TELECOM API MARKET
- Authentication and Authorization
- Use of Standard Protocols and Data Formats
- Placement of API beyond Gateway
- Optimized Requests and Responses
- Comprehensive Documentation
- Unit and Integration Testing
CURRENT AND EMERGING BUSINESS MODELS
- Direct Monetization Model
- Indirect Monetization Model
- API-as-a-service (AaaS)Model
- API Marketplaces Model
TELECOM API TOOLS, FRAMEWORKS, AND TECHNIQUES
FUTURE LANDSCAPE OF TELECOM API MARKET
- Telecom API Technology Roadmap till 2030


Growth opportunities and latent adjacency in Telecom API Market