Satellite Communication (SATCOM) Equipment Market Size & Growth

Report Code AS 6169
Published in Nov, 2024, By MarketsandMarkets™
Download PDF

Choose License Type

Buy Report Now Inquire Before Buying

Satellite Communication (SATCOM) Equipment Market by Solution (Product (Antennas, Transceivers, Power Amplifiers, Converters), Service (Engineering)), Platform, Type, Vertical, Frequency, Connectivity, and Region- Global Forecast to 2029

Overview

The satellite communication (SATCOM) equipment market is projected to grow from USD 24.27 billion in 2024 to USD 41.51 billion by 2029 at a CAGR of 11.3% from 2024 to 2029. The SATCOM equipment market has grown significantly over the past few years, driven by the need for high-speed, reliable communications networks in remote areas, the development of the commercial space industry, and the wide use of satellite technology in both military and government applications. Technological advancements, such as smaller, more efficient satellites and software-defined networking (SDN) and virtualization technologies, are also boosting the market. The surging demand for Ku- and Ka-band satellites and the growing fleet of autonomous and connected vehicles in the military and commercial sectors are adding to the growth. The market is also witnessing the development and deployment of LEO satellites and advanced antenna systems.

Attractive Opportunities in the SATCOM Equipment Market

North America

North America accounts for the maximum share of the SATCOM equipment market. The US is the largest user of SATCOM equipment globally

Market growth can be attributed to the increasing need for secure SATCOM equipment to support missions from command centers.

Product launches and contracts are expected to offer lucrative opportunities to market players in the next five years.

Technological advancements in SATCOM equipment, such as phased array antenna technologies, drive the market.

Market growth in North America can be attributed to the presence of leading manufacturers of SATCOM equipment systems.

Global SATCOM Equipment Market Dynamics

DRIVER: Increasing launches of LEO satellites and constellations

LEO satellites populate the 500–2,000 km band. These satellites offer rapid communication, lower latency, and higher bandwidths per user than GEO satellites. CubeSats and other small satellites are also achieving acceptance. There is a growing demand for low-cost small satellites with increased capacity for enterprise data (retail and banking), the energy sector (oil, gas, and mining), and governments of many countries with increased industrialization. This is driving investments in smallsat-based LEO constellations. If all planned GEO HTS satellites and LEO constellations succeed, the supply could be much higher than the expected demand, which would drive the price per megabit down. This expansion directly increases the need for SATCOM terminals, antennas, modems, and RF equipment capable of handling high-frequency signals and wideband data transmission from low-orbit satellites. Additionally, tracking and telemetry equipment is required to manage the movement and positioning of fast-moving LEO satellites. Ground stations are being upgraded or newly developed to facilitate the growing number of satellite handovers, data relays, and network management between satellite constellations and end users. Satellite constellations by SpaceX (US), Orbcomm (US), SES SA (Luxembourg), and Planet Labs (US) are present in the orbit. OneWeb (UK), Boeing (US), Telesat (Canada), and Amazon (US) are developing their constellation of small satellites.

RESTRAINT: Stringent Government regulations and policies

Government regulations and policies significantly impact the deployment of SATCOM systems. Some governments may have restrictions requiring a license to use these systems. Also, governments may prohibit the use of SATCOM systems for national security or other reasons. In the US, the UK, and Germany, the government controls specific frequency bands to prevent interference with military or other government communications systems.

In the US, the Federal Communications Commission (FCC) regulates the use of spectrum for satellite communication. FCC has allocated specific bands of spectrum for satellite communication, and companies that want to use this spectrum must obtain a license. The European Union (EU) also has regulations governing the use of spectrum for satellite communication. These restrictions limit the growth potential for SATCOM equipment manufacturers. In April 2024, the Government of India announced new regulatory changes aimed at the development of the Indian satellite communication market among rising interest from companies such as Eutelsat (US), Starlink (US), and Kuiper (US). The announcement of new regulatory changes creates uncertainties among SATCOM companies.


Opportunity: Need for high-speed, reliable communications networks in remote areas

One of the major opportunities for the SATCOM equipment market is the growing demand for high-speed internet connectivity and reliable communications in remote locations. SATCOM technology facilitates communication in those areas where traditional communication infrastructure is either not present or not feasible. The technology, therefore, is highly imperative for industries such as oil & gas, mining, and forestry. SATCOM equipment offers high-speed internet connectivity, voice communication, and data transfer services to users in remote settings. This provides a remote worker with access to critical information for conducting business activities; emergency or first responders can coordinate during emergencies.

With SATCOM equipment, it is possible to use the same system for telemedicine, education, remote equipment, and systems monitoring. Doctors can utilize the equipment to diagnose and treat patients in remote areas. Schools and universities can use the technology to educate and train students in remote areas. Consumer-grade satellite internet services with relatively high data speeds can be offered by geostationary satellites, such as the new generation of satellites by Ku-band, which can provide speeds as high as 506 Mbit/s for downloads. The African Development Bank is heading a syndicate of development banks that will provide the required funding of USD 260 million to help O3b Networks Ltd. (Luxembourg) establish its satellite system.

Challenge: Electromagnetic compatibility-related challenges associated with satellites

Electromagnetic compatibility (EMC) design is integral to every electrical component and system, specifically modern communication spacecraft. Satellites face significant EMC-related challenges due to the everyday use of high-power communication payloads and external sources within the UHF to Ka frequency bands. Some of the difficulties related to EMC for satellites are antenna system compatibility, electrostatic discharge, plasma charging, conducted and radiated emission, electromagnetic interferences between electronic units, compatibility of a system to operate in a specific environment that is subject to electromagnetic interference caused by radio frequency or electrical noise from many sources.

The SATCOM equipment market is also challenged by the threat of cybersecurity attacks. Common threats include unauthorized access, data breaches, denial-of-service attacks, malware and ransomware, insider threats, supply chain vulnerabilities, and social engineering attacks. In February 2023, Viasat (US), a satellite communications company, encountered a targeted cyberattack from Russian state-sponsored hackers. The hackers successfully attacked the Viasat Ka-SAT network, which shut down communication crucial for Ukraine for mobilization of troops. Therefore, airborne SATCOM manufacturers have undertaken various security measures to safeguard their communications systems.

Global SATCOM Equipment Market Ecosystem Analysis

In the green SATCOM Equipment market ecosystem, key stakeholders includes OEM and Solution and Service providers. Influential forces shaping the industry include investors, funders, academic researchers, distributors, service providers, and defense procurement authorities. This intricate network of participants collaboratively drives market dynamics, innovation, and strategic decisions.


Based on platform, the airborne SATCOM segment is estimated to lead the SATCOM equipment market from 2024 to 2029

Based on platform, the airborne SATCOM segment is estimated to lead the SATCOM equipment market from 2024 to 2029. North American and European countries have been focusing on modernizing and overhauling their aircraft communications systems using customized SATCOM on-the-move solutions. Modernization of aircraft communications systems is necessary to increase the safety of aircraft and reduce flight delays. It helps improve routing decisions for aircraft, enhance pilot communication, and increase efficiency. Modernization programs include the adoption of new technologies and components in aircraft and aviation infrastructure for efficient communication with air traffic managers, performing multi-dimensional aircraft tracking, and improving aircraft navigation by generating images of the approaching external topography.

These modernization programs are expected to increase the demand for advanced airborne SATCOM in new aircraft. Airborne SATCOM equipment can also be installed in the existing fleet as a part of retrofitting or upgrading activities. The Single European Sky ATM Research (SESAR) involves the installation of innovative SATCOM on-the-move solutions to eliminate inefficiencies associated with European air traffic management.

Based on solution, the product segment of the SATCOM equipment market is projected to capture the largest share during the forecast period.

Based on solution, the product segment is projected to lead the SATCOM equipment market from 2024 to 2029. This is due to the increasing demand for transceivers and phased-array antenna systems in naval and airborne platforms. The need for reliable connectivity, the deployment of high-throughput satellites (HTS), integration with terrestrial networks, IoT applications, and advancements in antenna technologies are driving the demand for antennas in the SATCOM equipment market. Antennas are further divided into phased arrays, multiple input and multiple output (MIMO), and others. Advancements in these antennas provide improved performance, beamforming capabilities, and adaptability to changing communication requirements. SATCOM antennas include reflectors, feed horns, feed networks, and low noise block (LNB) converters.

Transceivers combine the functions of transmitters and receivers into a single device and enable seamless two-way communication by converting signals for transmission and reception. They are further categorized into receivers and transmitters. The transceiver segment has the largest share due to the development of HTS and LEO satellite constellations that require highly sophisticated and capable transceivers to handle the increased data traffic and provide higher bandwidth capabilities.

Based on type, the SOTM segment is projected to account for the larger share of the SATCOM equipment market than the SOTP segment from 2024 to 2029.

Based on type, the SATCOM equipment market has been segmented into SATCOM-on-the-move (SOTM/COTM) and SATCOM-on-the-pause (SOTP). SOTM/COTM terminals provide reliable, high data rate satellite communications while on the move, enabling secure, beyond-line-of-sight communications for vehicles in motion for land, marine, and air applications. SOTP terminals are designed for automatic deployment and reliable communications through existing military satellites. They are ideal for covering extensive geographical areas or can be used by emergency units for fast communication.

The SOTM segment is projected to acquire a larger market share than the SOTP segment during the forecast period. This is due to the increasing integration of SOTM systems in sectors such as defense, transportation, emergency services, and media broadcasting. Military applications benefit from SOTM's ability to maintain secure and resilient communication links during tactical operations and deployments in remote or hostile environments. In commercial applications, SOTM supports real-time data transmission for fleet management, logistics, and passenger connectivity in trains, buses, and airplanes. Also, advancements in satellite technology, including HTS and adaptive antennas, enhance the performance and efficiency of SOTM systems by improving bandwidth availability and signal reliability.

The Asia Pacific market is projected to grow at the highest CAGR from 2024 to 2029 in the SATCOM equipment market.

The Asia Pacific market is projected to register the highest CAGR from 2024 to 2029 in the SATCOM equipment market. Asia Pacific is considered a lucrative market for domestic and regional manufacturers of SATCOM equipment. Major factors driving the market include the growing demand for launch & early orbit support, TT&C services, and data handling & processing services. The rising demand for telecommunications and mobile broadband services are the other important factors driving the market in the region. In this region, technological advancements in the field of SATCOM have led to the development of advanced SATCOM equipment with improved designs and functionalities and enhanced integration capabilities. China is a leading manufacturer of military and commercial SATCOM equipment. The booming satellite broadband market in the country and the increasing use of satellites for military applications are governing market growth. In October 2023, China announced that the Quantum key distribution satellite for hackproof allows two parties to communicate, encrypt, and decrypt data using keys created with quantum properties. The country is planning to use this technology to monitor its borders and ocean areas and protect against breaches of communications.

HIGHEST CAGR MARKET IN 2024
INDIA FASTEST GROWING MARKET IN THE REGION

Recent Developments of SATCOM Equipment Market

  • In July 2024, The French Defence Procurement Agency (DGA) awarded Thales the Neptune contract to supply 30 dual-band X/Ka satellite communication stations for the French Army's Serval vehicles under the Scorpion Program. These stations will provide high-throughput tactical communication. This contract is part of the SYRACUSE IV Program, following previous orders for the French Navy and land and air forces.
  • In May 2024, EchoStar Corporation (US) was awarded an IDIQ contract by the US Navy for the US Naval Supply Systems Command Spiral 4 Program. Through its subsidiaries, Hughes Network Systems (US) and Boost Mobile (US), EchoStar will provide 5G devices and services to DoD in the US territories and overseas. This contract is designed to support DoD as well as other federal agencies with mobile devices and service plans.
  • In May 2023, Gilat Satellite Networks Ltd. (Israel) announced that it had received a multi-million dollar VSAT order to expand a complex disaster response network in Asia. The order will help the national program to fortify the disaster prevention and management system. The network will enable secure, bandwidth-efficient voice services, video feeds, multicasts, emergency alerts, mobility services, and data services, boosting effective disaster response capabilities for governmental bodies, the public, and first responders.
  • In May 2023, Viasat Inc. (US) and Inmarsat (UK) received approval from the UK's Competition & Markets Authority (CMA) to close the proposed acquisition deal. The CMA finally concluded its Phase II review, determining that the acquisition did not raise competition concerns, and so it gave an all-clear for the implementation of the deal without any remedies. This is the final step in finalizing the deal, which has already been cleared by the UK government under the National Security and Investment Act, the Australian government's Foreign Investment Review Board, and the Committee on Foreign Investment in the United States. Viasat (US) will acquire Inmarsat (UK) to create new high-skill technology jobs in the UK while deepening Viasat's capabilities and supporting the UK's National Space Strategy goals. Viasat’s CEO, Mark Dankberg commented, "The CMA has undertaken an extensive review and significant efforts to clear the transaction."
  • In April 2023, Aselsan (Türkiye) delivered a satellite communication system produced for AKINCI Armed UAV. Aselsan delivered the system that was developed in the framework of the AKINCI Armed UAV. The system was completed six months after the Presidency of Defence Industries (SSB) (Türkiye) and Aselsan (Türkiye) concluded their contract for air satellite communication terminals and portable satellite communication systems. With this system, AKINCI can communicate beyond the line of sight (LOS), and it participated in cross-border operations for the first time.
  • In March 2023, Cobham Satcom (Denmark) and SES (Luxembourg), the leading provider of global satellite connectivity solutions, announced a contract for several Communications on the Pause (COTP) terminals enabled by O3b mPOWER. The contract includes Cobham Satcom's (Denmark) TACTICAL TRACKER terminal series, ranging from 1.35 to 2.64 meters, suitable for LEO/MEO/GEO environments, including the wide-successful EXPLORER 8120 vehicle mount tracking antenna. The TACTICAL TRACKER terminal series is designed specifically to serve the government and defense sectors. In contrast, government agencies, carriers, and enterprise customers will use the EXPLORER terminals for service augmentation and restoration.

Key Market Players

KEY PLAYERS IN THE SATCOM EQUIPMENT MARKET INCLUDE

Want to explore hidden markets that can drive new revenue in Satellite Communication (SATCOM) Equipment Market?

Scope of the Report

Report Metric Details
Market size available for years 2020-2029
Base Year Considered 2024
Forecast period 2024-2029
Forecast units Value (USD Million/USD Billion)
Segments covered By platform, technology, solution, vertical, frequency, connectivity.
Geographies covered North America, Europe, Asia Pacific, Middle East & Africa, and Latin America


Key Questions Addressed by the Report

Which are the major companies in the SATCOM equipment market? What are their major strategies to strengthen their market presence?
Some of the key players in the SATCOM equipment market are EchoStar Corporation (US), L3Harris Technologies (US), Thales (France), RTX (US), and General Dynamics Corporation (US). Contract was the key strategy these companies adopted to strengthen their presence in the market.
What are the drivers and opportunities for the SATCOM Equipment market?
Key drivers include technological advancements, such as the development of smaller sizes of satellites with better efficiency and good use of software-defined networking and virtualization technologies. The growing demand for Ku- and Ka-band satellites and autonomous and connected vehicle fleets widely used for varied applications in both military and commercial sectors that demand customized SATCOM-on-the-move antennas are the other drivers.
Which region is expected to grow at the highest rate in the next five years?
The Asia Pacific market is projected to grow at the highest CAGR from 2024 to 2029, showcasing strong demand for SATCOM equipment in the region. Rising demand for launch & early orbit support, TT&C services, and data handling & processing services are some of the most important factors driving the Asia Pacific market.
Which type of SATCOM equipment will significantly lead in the coming years?
The land-fixed SATCOM segment of the SATCOM equipment market is projected to witness the highest CAGR due to the increasing use of command and control (C2) centers and the increasing need for the fastest, most secure, and most comprehensive coverage of international and intercontinental data network for enterprise systems between 2024 and 2029.
What are the key technology trends prevailing in the SATCOM equipment market?
Key technology trends dominating the SATCOM equipment market include high-throughput satellites (HTS) with high data rates; software-defined networking (SDN) for centralized control; cognitive radio technology for better spectrum utilization; virtualization and NFV for flexibility; integration with IoT for seamless connectivity; enhanced cybersecurity measures; advanced antenna technologies; and connectivity to terrestrial networks, 5G, and 6G. These trends drive performance, efficiency, and connectivity advancements, enabling the industry to meet evolving communication needs.


Personalize This Research

  • Triangulate with your Own Data
  • Get Data as per your Format and Definition
  • Gain a Deeper Dive on a Specific Application, Geography, Customer or Competitor
  • Any level of Personalization
Request A Free Customisation

Let Us Help You

  • What are the Known and Unknown Adjacencies Impacting the Satellite Communication (SATCOM) Equipment Market
  • What will your New Revenue Sources be?
  • Who will be your Top Customer; what will make them switch?
  • Defend your Market Share or Win Competitors
  • Get a Scorecard for Target Partners
Customized Workshop Request

Table of Contents

Exclusive indicates content/data unique to MarketsandMarkets and not available with any competitors.

TITLE
PAGE NO
INTRODUCTION
30
RESEARCH METHODOLOGY
35
EXECUTIVE SUMMARY
45
PREMIUM INSIGHTS
50
MARKET OVERVIEW
53
  • 5.1 INTRODUCTION
  • 5.2 MARKET DYNAMICS
    DRIVERS
    - Large-scale adoption of electronically steered phased antennas
    - Increasing LEO satellite launches
    - Integration of SOTM solutions into unmanned ground vehicles
    - Need for Earth observation imagery and analytics
    - Surge in demand for high-speed data and voice services from aviation and maritime sectors
    - Growing preference for connected devices and IoT
    RESTRAINTS
    - High development and maintenance cost of SATCOM infrastructure
    - Stringent government regulations and policies
    OPPORTUNITIES
    - Need for high-speed, reliable communication networks in remote locations
    - Rapid adoption of cloud-based services
    - Development of ultra-compact SATCOM terminals for ground combat vehicles
    - Extensive use of portable SATCOM terminals by retail consumers
    - Deployment of SATCOM systems in healthcare and emergency response sectors
    CHALLENGES
    - Electromagnetic compatibility-related challenges associated with satellites
    - Threat of cybersecurity attacks
  • 5.3 VALUE CHAIN ANALYSIS
  • 5.4 TRENDS AND DISRUPTIONS IMPACTING CUSTOMER BUSINESS
  • 5.5 ECOSYSTEM ANALYSIS
    PROMINENT COMPANIES
    PRIVATE AND SMALL ENTERPRISES
    END USERS
  • 5.6 BUSINESS MODELS
  • 5.7 TOTAL COST OF OWNERSHIP
  • 5.8 BILL OF MATERIALS
  • 5.9 TECHNOLOGY ROADMAP
  • 5.10 VOLUME DATA
  • 5.11 PRICING ANALYSIS
    INDICATIVE PRICING ANALYSIS OF PORTABLE SATCOM EQUIPMENT
    INDICATIVE PRICING ANALYSIS OF MARITIME SATCOM EQUIPMENT
    INDICATIVE PRICING ANALYSIS OF LAND MOBILE SATCOM EQUIPMENT
  • 5.12 CASE STUDY ANALYSIS
    MULTI-LINK ROUTING
    METAMATERIAL ANTENNA
    SATELLITE-BASED IOT NETWORK
    MARITIME NETWORK CONNECTION
  • 5.13 REGULATORY LANDSCAPE
  • 5.14 KEY STAKEHOLDERS AND BUYING CRITERIA
    KEY STAKEHOLDERS IN BUYING PROCESS
    BUYING CRITERIA
  • 5.15 TRADE ANALYSIS
    IMPORT DATA
    EXPORT DATA
  • 5.16 KEY CONFERENCES AND EVENTS, 2024–2025
  • 5.17 INVESTMENT AND FUNDING SCENARIO
  • 5.18 TECHNOLOGY ANALYSIS
    KEY TECHNOLOGIES
    - Power amplifiers
    - Low-noise block downconverters
    COMPLEMENTARY TECHNOLOGIES
    - Beamforming
    - Multiple input multiple output
  • 5.19 MACROECONOMIC OUTLOOK
    INTRODUCTION
    NORTH AMERICA
    EUROPE
    ASIA PACIFIC
    MIDDLE EAST
    LATIN AMERICA AND AFRICA
INDUSTRY TRENDS
90
  • 6.1 INTRODUCTION
  • 6.2 TECHNOLOGY TRENDS
    TERRESTRIAL NETWORKS
    HIGH-THROUGHPUT SATELLITES
    ON-THE-MOVE TERMINALS
    ACTIVE ELECTRONICALLY SCANNED ARRAYS
    GALLIUM ARSENIDE AND GALLIUM NITRIDE RF TECHNOLOGY
    DIGITALIZED SATELLITE COMMUNICATION PAYLOAD TECHNOLOGY
    FLAT ANTENNA TECHNOLOGY
  • 6.3 IMPACT OF MEGATRENDS
    LEO/MEO MISSION ANTENNAS
    MULTI-BAND MULTI-MISSION ANTENNAS
    SMART ANTENNAS
    HYBRID BEAMFORMING
    5G
    INTERNET OF THINGS
  • 6.4 SUPPLY CHAIN ANALYSIS
  • 6.5 PATENT ANALYSIS
  • 6.6 IMPACT OF GENERATIVE AI
    INTRODUCTION
    ADOPTION OF AI IN SPACE BY TOP COUNTRIES
    IMPACT OF AI ON SATCOM EQUIPMENT USE CASES
    IMPACT OF AI ON SATCOM EQUIPMENT MARKET
SATCOM EQUIPMENT MARKET, BY CONNECTIVITY
104
  • 7.1 INTRODUCTION
  • 7.2 LEO
    FASTER SPEED AND LOWER LATENCY THAN TRADITIONAL GEOSTATIONARY SATELLITES TO DRIVE MARKET
  • 7.3 MEO/GEO
    ADVANCEMENTS IN HIGH-THROUGHPUT SATELLITES TO DRIVE MARKET
SATCOM EQUIPMENT MARKET, BY FREQUENCY
107
  • 8.1 INTRODUCTION
  • 8.2 C-BAND
    PREVALENCE IN MODERATE- TO HIGH-SPEED DATA TRANSMISSION APPLICATIONS TO DRIVE MARKET
  • 8.3 L & S-BAND
    SHIFT TOWARD SATELLITE-BASED SERVICES FOR CRITICAL INFRASTRUCTURE TO DRIVE MARKET
  • 8.4 X-BAND
    EMPHASIS ON NATIONAL SECURITY TO DRIVE MARKET
  • 8.5 KA-BAND
    ELEVATED DEMAND FOR HIGH-SPEED COMMUNICATION TO DRIVE MARKET
  • 8.6 KU-BAND
    FASTER TRANSMISSION SPEED THAN KA-BAND TO DRIVE MARKET
  • 8.7 VHF/UHF-BAND
    LARGE-SCALE USE IN DIGITAL AUDIO AND FM RADIO BROADCASTING TO DRIVE MARKET
  • 8.8 EHF/SHF-BAND
    NEED FOR ULTRA-FAST INTERNET IN DATA-INTENSIVE APPLICATIONS TO DRIVE MARKET
  • 8.9 MULTI-BAND
    GROWING CONSUMER DEMAND FOR SEAMLESS CONNECTIVITY TO DRIVE DEMAND
  • 8.10 Q-BAND
    FOCUS ON MITIGATING SIGNAL FADING TO DRIVE MARKET
SATCOM EQUIPMENT MARKET, BY TYPE
113
  • 9.1 INTRODUCTION
  • 9.2 SATCOM-ON-THE-MOVE
    INCREASING INTEGRATION IN DEFENSE AND TRANSPORTATION SECTORS TO DRIVE MARKET
  • 9.3 SATCOM-ON-THE-PAUSE
    EXTENSIVE USE IN DISASTER-PRONE AND TOUGH TERRAIN LOCATIONS TO DRIVE MARKET
SATCOM EQUIPMENT MARKET, BY VERTICAL
116
  • 10.1 INTRODUCTION
  • 10.2 COMMERCIAL
    TELECOMMUNICATIONS & CELLULAR BACKHAUL
    - Surge in demand for reliable wireless connections to drive market
    MEDIA & ENTERTAINMENT
    - Growing reliance on satellite communication to drive market
    BUSINESS & ENTERPRISE
    - Increased funding in small satellites to drive market
    TRANSPORTATION & LOGISTICS
    - Need for real-time tracking and communication solutions to drive market
    SCIENTIFIC RESEARCH & DEVELOPMENT
    - Miniaturization of SATCOM equipment to drive market
    AVIATION
    - Escalating demand for in-flight connectivity to drive market
    MARINE
    - Rising adoption of very small aperture terminals to drive market
    RETAIL & CONSUMER
    - Growth in e-commerce to drive market
    OTHERS
  • 10.3 GOVERNMENT & DEFENSE
    MILITARY
    - High demand for ISR capabilities to drive market
    HOMELAND SECURITY & EMERGENCY MANAGEMENT
    - Rapid deployment of SATCOM equipment in emergency scenarios to drive market
SATCOM EQUIPMENT MARKET, BY SOLUTION
124
  • 11.1 INTRODUCTION
  • 11.2 PRODUCT
    GROWING INVESTMENTS IN SATELLITE INFRASTRUCTURE TO DRIVE MARKET
    ANTENNA
    - Phased array
    - Multiple input and multiple output array
    - Others
    TRANSCEIVER
    - Receiver
    - Transmitter
    POWER AMPLIFIER
    CONVERTER
    GYRO STABILIZER
    MODEM & ROUTER
    RADIO
    RADOME
    OTHER PRODUCTS
  • 11.3 SERVICE
    INCREASING LEO SATELLITE LAUNCHES TO DRIVE MARKET
    ENGINEERING & INTEGRATION
    INSTALLATION
    LOGISTICS & MAINTENANCE
SATCOM EQUIPMENT MARKET, BY PLATFORM
134
  • 12.1 INTRODUCTION
  • 12.2 PORTABLE
    MANPACK
    HANDHELD
    DEPLOYABLE/FLYAWAY
  • 12.3 LAND MOBILE
    COMMERCIAL VEHICLE
    MILITARY VEHICLE
    EMERGENCY VEHICLE
    UNMANNED GROUND VEHICLE
    TRAIN
  • 12.4 LAND FIXED
    COMMAND & CONTROL CENTER
    EARTH/GROUND STATION
    DIRECT-TO-HOME (DTH)/SATELLITE TV
    ENTERPRISE SYSTEM
  • 12.5 AIRBORNE
    COMMERCIAL AIRCRAFT
    MILITARY AIRCRAFT
    BUSINESS JET
    UNMANNED AERIAL VEHICLE
  • 12.6 MARITIME
    COMMERCIAL SHIP
    MILITARY SHIP
    SUBMARINE
    UNMANNED MARITIME VEHICLE
SATCOM EQUIPMENT MARKET, BY TERMINAL
148
  • 13.1 INTRODUCTION
  • 13.2 LTE-BASED
  • 13.3 NON-LTE-BASED
SATCOM EQUIPMENT MARKET, BY TECHNOLOGY
149
  • 14.1 INTRODUCTION
  • 14.2 NEXT-GENERATION
  • 14.3 LEGACY
SATCOM EQUIPMENT MARKET, BY REGION
150
  • 15.1 INTRODUCTION
  • 15.2 NORTH AMERICA
    PESTLE ANALYSIS
    US
    - Presence of prominent SATCOM equipment manufacturers to drive market
    CANADA
    - Favorable government initiatives for development of SATCOM equipment to drive market
  • 15.3 EUROPE
    PESTLE ANALYSIS
    RUSSIA
    - Ongoing development of radio broadcasting, navigation, and remote sensing technologies to drive market
    GERMANY
    - Booming satellite industry to drive market
    FRANCE
    - Advancements in ground SATCOM systems to drive market
    UK
    - Rising number of LEO constellations and high-throughput satellites to drive market
    ITALY
    - Development of secure SATCOM systems to drive market
    SPAIN
    - Increasing government investments in SATCOM infrastructure to drive market
    REST OF EUROPE
  • 15.4 ASIA PACIFIC
    PESTLE ANALYSIS
    CHINA
    - Extensive use of SATCOM terminals in military applications to drive market
    INDIA
    - High demand for satellite communication in remote areas to drive market
    JAPAN
    - Need for satellites for surveillance activities to drive market
    SOUTH KOREA
    - Government support for domestic production of SATCOM equipment to drive market
    AUSTRALIA
    - Installation of SATCOM antenna systems for ground network to drive market
    REST OF ASIA PACIFIC
  • 15.5 MIDDLE EAST & AFRICA
    PESTLE ANALYSIS
    GULF COOPERATION COUNCIL (GCC)
    - Saudi Arabia
    - UAE
    ISRAEL
    - Incorporation of latest technologies in SATCOM equipment manufacturing to drive market
    TURKEY
    - Regular updates of communication systems to drive market
    AFRICA
    - Flourishing telecommunications infrastructure to drive market
  • 15.6 LATIN AMERICA
    PESTLE ANALYSIS
    BRAZIL
    - Expansion of telecommunications services to drive market
    MEXICO
    - Focus on improving national security to drive market
    ARGENTINA
    - Development of modern satellite infrastructure with innovative ground systems to drive market
COMPETITIVE LANDSCAPE
216
  • 16.1 INTRODUCTION
  • 16.2 KEY PLAYER STRATEGIES/RIGHT TO WIN, 2020–2024
  • 16.3 REVENUE ANALYSIS, 2020–2023
  • 16.4 MARKET SHARE ANALYSIS, 2023
  • 16.5 COMPANY VALUATION AND FINANCIAL METRICS
  • 16.6 COMPANY EVALUATION MATRIX: KEY PLAYERS, 2023
    STARS
    EMERGING LEADERS
    PERVASIVE PLAYERS
    PARTICIPANTS
    COMPANY FOOTPRINT
    - Company footprint
    - Solution footprint
    - Vertical footprint
    - Platform footprint
    - Region footprint
  • 16.7 COMPANY EVALUATION MATRIX: START-UPS/SMES, 2023
    PROGRESSIVE COMPANIES
    RESPONSIVE COMPANIES
    DYNAMIC COMPANIES
    STARTING BLOCKS
    COMPETITIVE BENCHMARKING
    - List of start-ups/SMEs
    - Competitive benchmarking of start-ups/SMEs
  • 16.8 BRAND/PRODUCT COMPARISON
  • 16.9 COMPETITIVE SCENARIO
    PRODUCT/SERVICE LAUNCHES
    DEALS
    OTHERS
COMPANY PROFILES
260
  • 17.1 KEY PLAYERS
    ECHOSTAR CORPORATION
    - Business overview
    - Products/Solutions/Services offered
    - Recent developments
    - MnM view
    L3HARRIS TECHNOLOGIES, INC.
    - Business overview
    - Products/Solutions/Services offered
    - Recent developments
    - MnM view
    THALES
    - Business overview
    - Products/Solutions/Services offered
    - Recent developments
    - MnM view
    RTX
    - Business overview
    - Products/Solutions/Services offered
    - Recent developments
    - MnM view
    GENERAL DYNAMICS CORPORATION
    - Business overview
    - Products/Solutions/Services offered
    - Recent developments
    - MnM view
    COBHAM SATCOM
    - Business overview
    - Products/Solutions/Services offered
    - Recent developments
    HONEYWELL INTERNATIONAL INC.
    - Business overview
    - Products/Solutions/Services offered
    - Recent developments
    VIASAT, INC.
    - Business overview
    - Products/Solutions/Services offered
    - Recent developments
    GILAT SATELLITE NETWORKS
    - Business overview
    - Products/Solutions/Services offered
    - Recent developments
    IRIDIUM COMMUNICATIONS INC.
    - Business overview
    - Products/Solutions/Services offered
    - Recent developments
    ASELSAN A.S.
    - Business overview
    - Products/Solutions/Services offered
    - Recent developments
    INTELLIAN TECHNOLOGIES, INC.
    - Business overview
    - Products/Solutions/Services offered
    - Recent developments
    ST ENGINEERING
    - Business overview
    - Products/Solutions/Services offered
    - Recent developments
    SPACEX
    - Business overview
    - Products/Solutions/Services offered
    - Recent developments
    ELBIT SYSTEMS LTD.
    - Business overview
    - Products/Solutions/Services offered
    - Recent developments
  • 17.2 OTHER PLAYERS
    CAMPBELL SCIENTIFIC, INC.
    ND SATCOM GMBH
    SATCOM GLOBAL
    HOLKIRK COMMUNICATIONS LTD.
    AVL TECHNOLOGIES
    ONEWEB
    THINKOM SOLUTIONS INC.
    VIKING SATCOM
    NORSAT INTERNATIONAL INC.
    CESIUMASTRO, INC.
APPENDIX
342
  • 18.1 DISCUSSION GUIDE
  • 18.2 ANNEXURE A: OTHER MAPPED COMPANIES
  • 18.3 ANNEXURE B: DEFENSE PROGRAM MAPPING
  • 18.4 KNOWLEDGESTORE: MARKETSANDMARKETS’ SUBSCRIPTION PORTAL
  • 18.5 CUSTOMIZATION OPTIONS
  • 18.6 RELATED REPORTS
  • 18.7 AUTHOR DETAILS
LIST OF TABLES
 
  • TABLE 1 INCLUSIONS AND EXCLUSIONS
  • TABLE 2 USD EXCHANGE RATES
  • TABLE 3 OPERATIONAL INFORMATION ON LEO AND MEO CONSTELLATIONS
  • TABLE 4 DEVELOPMENT INFORMATION ON LEO AND MEO CONSTELLATIONS
  • TABLE 5 ROLE OF COMPANIES IN ECOSYSTEM
  • TABLE 6 BUSINESS MODELS OF SATCOM EQUIPMENT MARKET
  • TABLE 7 TOTAL COST OF OWNERSHIP OF SATCOM EQUIPMENT
  • TABLE 8 INDICATIVE PRICING ANALYSIS OF PORTABLE SATCOM EQUIPMENT (USD)
  • TABLE 9 INDICATIVE PRICING ANALYSIS OF MARITIME SATCOM EQUIPMENT (USD)
  • TABLE 10 INDICATIVE PRICING ANALYSIS OF LAND MOBILE SATCOM EQUIPMENT (USD)
  • TABLE 11 NORTH AMERICA: REGULATORY BODIES, GOVERNMENT AGENCIES, AND OTHER ORGANIZATIONS
  • TABLE 12 EUROPE: REGULATORY BODIES, GOVERNMENT AGENCIES, AND OTHER ORGANIZATIONS
  • TABLE 13 ASIA PACIFIC: REGULATORY BODIES, GOVERNMENT AGENCIES, AND OTHER ORGANIZATIONS
  • TABLE 14 REST OF THE WORLD: REGULATORY BODIES, GOVERNMENT AGENCIES, AND OTHER ORGANIZATIONS
  • TABLE 15 INFLUENCE OF STAKEHOLDERS ON BUYING PROCESS, BY VERTICAL (%)
  • TABLE 16 KEY BUYING CRITERIA FOR SATCOM EQUIPMENT, BY VERTICAL
  • TABLE 17 IMPORT DATA FOR HS CODE 880260, BY COUNTRY, 2020–2023 (USD THOUSAND)
  • TABLE 18 EXPORT DATA FOR HS CODE 880260, BY COUNTRY, 2020–2023 (USD THOUSAND)
  • TABLE 19 KEY CONFERENCES AND EVENTS
  • TABLE 20 PATENT ANALYSIS, 2017–2023
  • TABLE 21 SATCOM EQUIPMENT MARKET, BY CONNECTIVITY, 2020–2023 (USD MILLION)
  • TABLE 22 SATCOM EQUIPMENT MARKET, BY CONNECTIVITY, 2024–2029 (USD MILLION)
  • TABLE 23 SATCOM EQUIPMENT MARKET, BY FREQUENCY, 2020–2023 (USD MILLION)
  • TABLE 24 SATCOM EQUIPMENT MARKET, BY FREQUENCY, 2024–2029 (USD MILLION)
  • TABLE 25 SATCOM EQUIPMENT MARKET, BY TYPE, 2020–2023 (USD MILLION)
  • TABLE 26 SATCOM EQUIPMENT MARKET, BY TYPE, 2024–2029 (USD MILLION)
  • TABLE 27 SATCOM EQUIPMENT MARKET, BY VERTICAL, 2020–2023 (USD MILLION)
  • TABLE 28 SATCOM EQUIPMENT MARKET, BY VERTICAL, 2024–2029 (USD MILLION)
  • TABLE 29 COMMERCIAL: SATCOM EQUIPMENT MARKET, BY TYPE, 2020–2023 (USD MILLION)
  • TABLE 30 COMMERCIAL: SATCOM EQUIPMENT MARKET, BY TYPE, 2024–2029 (USD MILLION)
  • TABLE 31 GOVERNMENT & DEFENSE: SATCOM EQUIPMENT MARKET, BY TYPE, 2020–2023 (USD MILLION)
  • TABLE 32 GOVERNMENT & DEFENSE: SATCOM EQUIPMENT MARKET, BY TYPE, 2024–2029 (USD MILLION)
  • TABLE 33 SATCOM EQUIPMENT MARKET, BY SOLUTION, 2020–2023 (USD MILLION)
  • TABLE 34 SATCOM EQUIPMENT MARKET, BY SOLUTION, 2024–2029 (USD MILLION)
  • TABLE 35 PRODUCT: SATCOM EQUIPMENT MARKET, BY TYPE, 2020–2023 (USD MILLION)
  • TABLE 36 PRODUCT: SATCOM EQUIPMENT MARKET, BY TYPE, 2024–2029 (USD MILLION)
  • TABLE 37 SATCOM EQUIPMENT MARKET, BY ANTENNA TYPE, 2020–2023 (USD MILLION)
  • TABLE 38 SATCOM EQUIPMENT MARKET, BY ANTENNA TYPE, 2024–2029 (USD MILLION)
  • TABLE 39 SATCOM EQUIPMENT MARKET, BY TRANSCEIVER TYPE, 2020–2023 (USD MILLION)
  • TABLE 40 SATCOM EQUIPMENT MARKET, BY TRANSCEIVER TYPE, 2024–2029 (USD MILLION)
  • TABLE 41 SERVICE: SATCOM EQUIPMENT MARKET, BY TYPE, 2020–2023 (USD MILLION)
  • TABLE 42 SERVICE: SATCOM EQUIPMENT MARKET, BY TYPE, 2024–2029 (USD MILLION)
  • TABLE 43 SATCOM EQUIPMENT MARKET, BY PLATFORM, 2020–2023 (USD MILLION)
  • TABLE 44 SATCOM EQUIPMENT MARKET, BY PLATFORM, 2024–2029 (USD MILLION)
  • TABLE 45 PORTABLE: SATCOM EQUIPMENT MARKET, BY TYPE, 2020–2023 (USD MILLION)
  • TABLE 46 PORTABLE: SATCOM EQUIPMENT MARKET, BY TYPE, 2024–2029 (USD MILLION)
  • TABLE 47 LAND MOBILE: SATCOM EQUIPMENT MARKET, BY TYPE, 2020–2023 (USD MILLION)
  • TABLE 48 LAND MOBILE: SATCOM EQUIPMENT MARKET, BY TYPE, 2024–2029 (USD MILLION)
  • TABLE 49 LAND FIXED: SATCOM EQUIPMENT MARKET, BY TYPE, 2020–2023 (USD MILLION)
  • TABLE 50 LAND FIXED: SATCOM EQUIPMENT MARKET, BY TYPE, 2024–2029 (USD MILLION)
  • TABLE 51 AIRBORNE: SATCOM EQUIPMENT MARKET, BY TYPE, 2020–2023 (USD MILLION)
  • TABLE 52 AIRBORNE: SATCOM EQUIPMENT MARKET, BY TYPE, 2024–2029 (USD MILLION)
  • TABLE 53 MARITIME: SATCOM EQUIPMENT MARKET, BY TYPE, 2020–2023 (USD MILLION)
  • TABLE 54 MARITIME: SATCOM EQUIPMENT MARKET, BY TYPE, 2024–2029 (USD MILLION)
  • TABLE 55 SATCOM EQUIPMENT MARKET, BY REGION, 2020–2023 (USD MILLION)
  • TABLE 56 SATCOM EQUIPMENT MARKET, BY REGION, 2024–2029 (USD MILLION)
  • TABLE 57 NORTH AMERICA: SATCOM EQUIPMENT MARKET, BY PLATFORM, 2020–2023 (USD MILLION)
  • TABLE 58 NORTH AMERICA: SATCOM EQUIPMENT MARKET, BY PLATFORM, 2024–2029 (USD MILLION)
  • TABLE 59 NORTH AMERICA: SATCOM EQUIPMENT MARKET, BY VERTICAL, 2020–2023 (USD MILLION)
  • TABLE 60 NORTH AMERICA: SATCOM EQUIPMENT MARKET, BY VERTICAL, 2024–2029 (USD MILLION)
  • TABLE 61 NORTH AMERICA: SATCOM EQUIPMENT MARKET, BY TECHNOLOGY, 2020–2023 (USD MILLION)
  • TABLE 62 NORTH AMERICA: SATCOM EQUIPMENT MARKET, BY TECHNOLOGY, 2024–2029 (USD MILLION)
  • TABLE 63 NORTH AMERICA: SATCOM EQUIPMENT MARKET, BY COUNTRY, 2020–2023 (USD MILLION)
  • TABLE 64 NORTH AMERICA: SATCOM EQUIPMENT MARKET, BY COUNTRY, 2024–2029 (USD MILLION)
  • TABLE 65 US: SATCOM EQUIPMENT MARKET, BY PLATFORM, 2020–2023 (USD MILLION)
  • TABLE 66 US: SATCOM EQUIPMENT MARKET, BY PLATFORM, 2024–2029 (USD MILLION)
  • TABLE 67 US: SATCOM EQUIPMENT MARKET, BY VERTICAL, 2020–2023 (USD MILLION)
  • TABLE 68 US: SATCOM EQUIPMENT MARKET, BY VERTICAL, 2024–2029 (USD MILLION)
  • TABLE 69 US: SATCOM EQUIPMENT MARKET, BY TECHNOLOGY, 2020–2023 (USD MILLION)
  • TABLE 70 US: SATCOM EQUIPMENT MARKET, BY TECHNOLOGY, 2024–2029 (USD MILLION)
  • TABLE 71 CANADA: SATCOM EQUIPMENT MARKET, BY PLATFORM, 2020–2023 (USD MILLION)
  • TABLE 72 CANADA: SATCOM EQUIPMENT MARKET, BY PLATFORM, 2024–2029 (USD MILLION)
  • TABLE 73 CANADA: SATCOM EQUIPMENT MARKET, BY VERTICAL, 2020–2023 (USD MILLION)
  • TABLE 74 CANADA: SATCOM EQUIPMENT MARKET, BY VERTICAL, 2024–2029 (USD MILLION)
  • TABLE 75 CANADA: SATCOM EQUIPMENT MARKET, BY TECHNOLOGY, 2020–2023 (USD MILLION)
  • TABLE 76 CANADA: SATCOM EQUIPMENT MARKET, BY TECHNOLOGY, 2024–2029 (USD MILLION)
  • TABLE 77 EUROPE: SATCOM EQUIPMENT MARKET, BY PLATFORM, 2020–2023 (USD MILLION)
  • TABLE 78 EUROPE: SATCOM EQUIPMENT MARKET, BY PLATFORM, 2024–2029 (USD MILLION)
  • TABLE 79 EUROPE: SATCOM EQUIPMENT MARKET, BY VERTICAL, 2020–2023 (USD MILLION)
  • TABLE 80 EUROPE: SATCOM EQUIPMENT MARKET, BY VERTICAL, 2024–2029 (USD MILLION)
  • TABLE 81 EUROPE: SATCOM EQUIPMENT MARKET, BY TECHNOLOGY, 2020–2023 (USD MILLION)
  • TABLE 82 EUROPE: SATCOM EQUIPMENT MARKET, BY TECHNOLOGY, 2024–2029 (USD MILLION)
  • TABLE 83 EUROPE: SATCOM EQUIPMENT MARKET, BY COUNTRY, 2020–2023 (USD MILLION)
  • TABLE 84 EUROPE: SATCOM EQUIPMENT MARKET, BY COUNTRY, 2024–2029 (USD MILLION)
  • TABLE 85 RUSSIA: SATCOM EQUIPMENT MARKET, BY PLATFORM, 2020–2023 (USD MILLION)
  • TABLE 86 RUSSIA: SATCOM EQUIPMENT MARKET, BY PLATFORM, 2024–2029 (USD MILLION)
  • TABLE 87 RUSSIA: SATCOM EQUIPMENT MARKET, BY VERTICAL, 2020–2023 (USD MILLION)
  • TABLE 88 RUSSIA: SATCOM EQUIPMENT MARKET, BY VERTICAL, 2024–2029 (USD MILLION)
  • TABLE 89 RUSSIA: SATCOM EQUIPMENT MARKET, BY TECHNOLOGY, 2020–2023 (USD MILLION)
  • TABLE 90 RUSSIA: SATCOM EQUIPMENT MARKET, BY TECHNOLOGY, 2024–2029 (USD MILLION)
  • TABLE 91 GERMANY: SATCOM EQUIPMENT MARKET, BY PLATFORM, 2020–2023 (USD MILLION)
  • TABLE 92 GERMANY: SATCOM EQUIPMENT MARKET, BY PLATFORM, 2024–2029 (USD MILLION)
  • TABLE 93 GERMANY: SATCOM EQUIPMENT MARKET, BY VERTICAL, 2020–2023 (USD MILLION)
  • TABLE 94 GERMANY: SATCOM EQUIPMENT MARKET, BY VERTICAL, 2024–2029 (USD MILLION)
  • TABLE 95 GERMANY: SATCOM EQUIPMENT MARKET, BY TECHNOLOGY, 2020–2023 (USD MILLION)
  • TABLE 96 GERMANY: SATCOM EQUIPMENT MARKET, BY TECHNOLOGY, 2024–2029 (USD MILLION)
  • TABLE 97 FRANCE: SATCOM EQUIPMENT MARKET, BY PLATFORM, 2020–2023 (USD MILLION)
  • TABLE 98 FRANCE: SATCOM EQUIPMENT MARKET, BY PLATFORM, 2024–2029 (USD MILLION)
  • TABLE 99 FRANCE: SATCOM EQUIPMENT MARKET, BY VERTICAL, 2020–2023 (USD MILLION)
  • TABLE 100 FRANCE: SATCOM EQUIPMENT MARKET, BY VERTICAL, 2024–2029 (USD MILLION)
  • TABLE 101 FRANCE: SATCOM EQUIPMENT MARKET, BY TECHNOLOGY, 2020–2023 (USD MILLION)
  • TABLE 102 FRANCE: SATCOM EQUIPMENT MARKET, BY TECHNOLOGY, 2024–2029 (USD MILLION)
  • TABLE 103 UK: SATCOM EQUIPMENT MARKET, BY PLATFORM, 2020–2023 (USD MILLION)
  • TABLE 104 UK: SATCOM EQUIPMENT MARKET, BY PLATFORM, 2024–2029 (USD MILLION)
  • TABLE 105 UK: SATCOM EQUIPMENT MARKET, BY VERTICAL, 2020–2023 (USD MILLION)
  • TABLE 106 UK: SATCOM EQUIPMENT MARKET, BY VERTICAL, 2024–2029 (USD MILLION)
  • TABLE 107 UK: SATCOM EQUIPMENT MARKET, BY TECHNOLOGY, 2020–2023 (USD MILLION)
  • TABLE 108 UK: SATCOM EQUIPMENT MARKET, BY TECHNOLOGY, 2024–2029 (USD MILLION)
  • TABLE 109 ITALY: SATCOM EQUIPMENT MARKET, BY PLATFORM, 2020–2023 (USD MILLION)
  • TABLE 110 ITALY: SATCOM EQUIPMENT MARKET, BY PLATFORM, 2024–2029 (USD MILLION)
  • TABLE 111 ITALY: SATCOM EQUIPMENT MARKET, BY VERTICAL, 2020–2023 (USD MILLION)
  • TABLE 112 ITALY: SATCOM EQUIPMENT MARKET, BY VERTICAL, 2024–2029 (USD MILLION)
  • TABLE 113 ITALY: SATCOM EQUIPMENT MARKET, BY TECHNOLOGY, 2020–2023 (USD MILLION)
  • TABLE 114 ITALY: SATCOM EQUIPMENT MARKET, BY TECHNOLOGY, 2024–2029 (USD MILLION)
  • TABLE 115 SPAIN: SATCOM EQUIPMENT MARKET, BY PLATFORM, 2020–2023 (USD MILLION)
  • TABLE 116 SPAIN: SATCOM EQUIPMENT MARKET, BY PLATFORM, 2024–2029 (USD MILLION)
  • TABLE 117 SPAIN: SATCOM EQUIPMENT MARKET, BY VERTICAL, 2020–2023 (USD MILLION)
  • TABLE 118 SPAIN: SATCOM EQUIPMENT MARKET, BY VERTICAL, 2024–2029 (USD MILLION)
  • TABLE 119 SPAIN: SATCOM EQUIPMENT MARKET, BY TECHNOLOGY, 2020–2023 (USD MILLION)
  • TABLE 120 SPAIN: SATCOM EQUIPMENT MARKET, BY TECHNOLOGY, 2024–2029 (USD MILLION)
  • TABLE 121 REST OF EUROPE: SATCOM EQUIPMENT MARKET, BY PLATFORM, 2020–2023 (USD MILLION)
  • TABLE 122 REST OF EUROPE: SATCOM EQUIPMENT MARKET, BY PLATFORM, 2024–2029 (USD MILLION)
  • TABLE 123 REST OF EUROPE: SATCOM EQUIPMENT MARKET, BY VERTICAL, 2020–2023 (USD MILLION)
  • TABLE 124 REST OF EUROPE: SATCOM EQUIPMENT MARKET, BY VERTICAL, 2024–2029 (USD MILLION)
  • TABLE 125 REST OF EUROPE: SATCOM EQUIPMENT MARKET, BY TECHNOLOGY, 2020–2023 (USD MILLION)
  • TABLE 126 REST OF EUROPE: SATCOM EQUIPMENT MARKET, BY TECHNOLOGY, 2024–2029 (USD MILLION)
  • TABLE 127 ASIA PACIFIC: SATCOM EQUIPMENT MARKET, BY PLATFORM, 2020–2023 (USD MILLION)
  • TABLE 128 ASIA PACIFIC: SATCOM EQUIPMENT MARKET, BY PLATFORM, 2024–2029 (USD MILLION)
  • TABLE 129 ASIA PACIFIC: SATCOM EQUIPMENT MARKET, BY VERTICAL, 2020–2023 (USD MILLION)
  • TABLE 130 ASIA PACIFIC: SATCOM EQUIPMENT MARKET, BY VERTICAL, 2024–2029 (USD MILLION)
  • TABLE 131 ASIA PACIFIC: SATCOM EQUIPMENT MARKET, BY TECHNOLOGY, 2020–2023 (USD MILLION)
  • TABLE 132 ASIA PACIFIC: SATCOM EQUIPMENT MARKET, BY TECHNOLOGY, 2024–2029 (USD MILLION)
  • TABLE 133 ASIA PACIFIC: SATCOM EQUIPMENT MARKET, BY COUNTRY, 2020–2023 (USD MILLION)
  • TABLE 134 ASIA PACIFIC: SATCOM EQUIPMENT MARKET, BY COUNTRY, 2024–2029 (USD MILLION)
  • TABLE 135 CHINA: SATCOM EQUIPMENT MARKET, BY PLATFORM, 2020–2023 (USD MILLION)
  • TABLE 136 CHINA: SATCOM EQUIPMENT MARKET, BY PLATFORM, 2024–2029 (USD MILLION)
  • TABLE 137 CHINA: SATCOM EQUIPMENT MARKET, BY VERTICAL, 2020–2023 (USD MILLION)
  • TABLE 138 CHINA: SATCOM EQUIPMENT MARKET, BY VERTICAL, 2024–2029 (USD MILLION)
  • TABLE 139 CHINA: SATCOM EQUIPMENT MARKET, BY TECHNOLOGY, 2020–2023 (USD MILLION)
  • TABLE 140 CHINA: SATCOM EQUIPMENT MARKET, BY TECHNOLOGY, 2024–2029 (USD MILLION)
  • TABLE 141 INDIA: SATCOM EQUIPMENT MARKET, BY PLATFORM, 2020–2023 (USD MILLION)
  • TABLE 142 INDIA: SATCOM EQUIPMENT MARKET, BY PLATFORM, 2024–2029 (USD MILLION)
  • TABLE 143 INDIA: SATCOM EQUIPMENT MARKET, BY VERTICAL, 2020–2023 (USD MILLION)
  • TABLE 144 INDIA: SATCOM EQUIPMENT MARKET, BY VERTICAL, 2024–2029 (USD MILLION)
  • TABLE 145 INDIA: SATCOM EQUIPMENT MARKET, BY TECHNOLOGY, 2020–2023 (USD MILLION)
  • TABLE 146 INDIA: SATCOM EQUIPMENT MARKET, BY TECHNOLOGY, 2024–2029 (USD MILLION)
  • TABLE 147 JAPAN: SATCOM EQUIPMENT MARKET, BY PLATFORM, 2020–2023 (USD MILLION)
  • TABLE 148 JAPAN: SATCOM EQUIPMENT MARKET, BY PLATFORM, 2024–2029 (USD MILLION)
  • TABLE 149 JAPAN: SATCOM EQUIPMENT MARKET, BY VERTICAL, 2020–2023 (USD MILLION)
  • TABLE 150 JAPAN: SATCOM EQUIPMENT MARKET, BY VERTICAL, 2024–2029 (USD MILLION)
  • TABLE 151 JAPAN: SATCOM EQUIPMENT MARKET, BY TECHNOLOGY, 2020–2023 (USD MILLION)
  • TABLE 152 JAPAN: SATCOM EQUIPMENT MARKET, BY TECHNOLOGY, 2024–2029 (USD MILLION)
  • TABLE 153 SOUTH KOREA: SATCOM EQUIPMENT MARKET, BY PLATFORM, 2020–2023 (USD MILLION)
  • TABLE 154 SOUTH KOREA: SATCOM EQUIPMENT MARKET, BY PLATFORM, 2024–2029 (USD MILLION)
  • TABLE 155 SOUTH KOREA: SATCOM EQUIPMENT MARKET, BY VERTICAL, 2020–2023 (USD MILLION)
  • TABLE 156 SOUTH KOREA: SATCOM EQUIPMENT MARKET, BY VERTICAL, 2024–2029 (USD MILLION)
  • TABLE 157 SOUTH KOREA: SATCOM EQUIPMENT MARKET, BY TECHNOLOGY, 2020–2023 (USD MILLION)
  • TABLE 158 SOUTH KOREA: SATCOM EQUIPMENT MARKET, BY TECHNOLOGY, 2024–2029 (USD MILLION)
  • TABLE 159 AUSTRALIA: SATCOM EQUIPMENT MARKET, BY PLATFORM, 2020–2023 (USD MILLION)
  • TABLE 160 AUSTRALIA: SATCOM EQUIPMENT MARKET, BY PLATFORM, 2024–2029 (USD MILLION)
  • TABLE 161 AUSTRALIA: SATCOM EQUIPMENT MARKET, BY VERTICAL, 2020–2023 (USD MILLION)
  • TABLE 162 AUSTRALIA: SATCOM EQUIPMENT MARKET, BY VERTICAL, 2024–2029 (USD MILLION)
  • TABLE 163 AUSTRALIA: SATCOM EQUIPMENT MARKET, BY TECHNOLOGY, 2020–2023 (USD MILLION)
  • TABLE 164 AUSTRALIA: SATCOM EQUIPMENT MARKET, BY TECHNOLOGY, 2024–2029 (USD MILLION)
  • TABLE 165 REST OF ASIA PACIFIC: SATCOM EQUIPMENT MARKET, BY PLATFORM, 2020–2023 (USD MILLION)
  • TABLE 166 REST OF ASIA PACIFIC: SATCOM EQUIPMENT MARKET, BY PLATFORM, 2024–2029 (USD MILLION)
  • TABLE 167 REST OF ASIA PACIFIC: SATCOM EQUIPMENT MARKET, BY VERTICAL, 2020–2023 (USD MILLION)
  • TABLE 168 REST OF ASIA PACIFIC: SATCOM EQUIPMENT MARKET, BY VERTICAL, 2024–2029 (USD MILLION)
  • TABLE 169 REST OF ASIA PACIFIC: SATCOM EQUIPMENT MARKET, BY TECHNOLOGY, 2020–2023 (USD MILLION)
  • TABLE 170 REST OF ASIA PACIFIC: SATCOM EQUIPMENT MARKET, BY TECHNOLOGY, 2024–2029 (USD MILLION)
  • TABLE 171 MIDDLE EAST & AFRICA: SATCOM EQUIPMENT MARKET, BY PLATFORM, 2020–2023 (USD MILLION)
  • TABLE 172 MIDDLE EAST & AFRICA: SATCOM EQUIPMENT MARKET, BY PLATFORM, 2024–2029 (USD MILLION)
  • TABLE 173 MIDDLE EAST & AFRICA: SATCOM EQUIPMENT MARKET, BY VERTICAL, 2020–2023 (USD MILLION)
  • TABLE 174 MIDDLE EAST & AFRICA: SATCOM EQUIPMENT MARKET, BY VERTICAL, 2024–2029 (USD MILLION)
  • TABLE 175 MIDDLE EAST & AFRICA: SATCOM EQUIPMENT MARKET, BY TECHNOLOGY, 2020–2023 (USD MILLION)
  • TABLE 176 MIDDLE EAST & AFRICA: SATCOM EQUIPMENT MARKET, BY TECHNOLOGY, 2024–2029 (USD MILLION)
  • TABLE 177 MIDDLE EAST & AFRICA: SATCOM EQUIPMENT MARKET, BY COUNTRY, 2020–2023 (USD MILLION)
  • TABLE 178 MIDDLE EAST & AFRICA: SATCOM EQUIPMENT MARKET, BY COUNTRY, 2024–2029 (USD MILLION)
  • TABLE 179 SAUDI ARABIA: SATCOM EQUIPMENT MARKET, BY PLATFORM, 2020–2023 (USD MILLION)
  • TABLE 180 SAUDI ARABIA: SATCOM EQUIPMENT MARKET, BY PLATFORM, 2024–2029 (USD MILLION)
  • TABLE 181 SAUDI ARABIA: SATCOM EQUIPMENT MARKET, BY VERTICAL, 2020–2023 (USD MILLION)
  • TABLE 182 SAUDI ARABIA: SATCOM EQUIPMENT MARKET, BY VERTICAL, 2024–2029 (USD MILLION)
  • TABLE 183 SAUDI ARABIA: SATCOM EQUIPMENT MARKET, BY TECHNOLOGY, 2020–2023 (USD MILLION)
  • TABLE 184 SAUDI ARABIA: SATCOM EQUIPMENT MARKET, BY TECHNOLOGY, 2024–2029 (USD MILLION)
  • TABLE 185 UAE: SATCOM EQUIPMENT MARKET, BY PLATFORM, 2020–2023 (USD MILLION)
  • TABLE 186 UAE: SATCOM EQUIPMENT MARKET, BY PLATFORM, 2024–2029 (USD MILLION)
  • TABLE 187 UAE: SATCOM EQUIPMENT MARKET, BY VERTICAL, 2020–2023 (USD MILLION)
  • TABLE 188 UAE: SATCOM EQUIPMENT MARKET, BY VERTICAL, 2024–2029 (USD MILLION)
  • TABLE 189 UAE: SATCOM EQUIPMENT MARKET, BY TECHNOLOGY, 2020–2023 (USD MILLION)
  • TABLE 190 UAE: SATCOM EQUIPMENT MARKET, BY TECHNOLOGY, 2024–2029 (USD MILLION)
  • TABLE 191 ISRAEL: SATCOM EQUIPMENT MARKET, BY PLATFORM, 2020–2023 (USD MILLION)
  • TABLE 192 ISRAEL: SATCOM EQUIPMENT MARKET, BY PLATFORM, 2024–2029 (USD MILLION)
  • TABLE 193 ISRAEL: SATCOM EQUIPMENT MARKET, BY VERTICAL, 2020–2023 (USD MILLION)
  • TABLE 194 ISRAEL: SATCOM EQUIPMENT MARKET, BY VERTICAL, 2024–2029 (USD MILLION)
  • TABLE 195 ISRAEL: SATCOM EQUIPMENT MARKET, BY TECHNOLOGY, 2020–2023 (USD MILLION)
  • TABLE 196 ISRAEL: SATCOM EQUIPMENT MARKET, BY TECHNOLOGY, 2024–2029 (USD MILLION)
  • TABLE 197 TURKEY: SATCOM EQUIPMENT MARKET, BY PLATFORM, 2020–2023 (USD MILLION)
  • TABLE 198 TURKEY: SATCOM EQUIPMENT MARKET, BY PLATFORM, 2024–2029 (USD MILLION)
  • TABLE 199 TURKEY: SATCOM EQUIPMENT MARKET, BY VERTICAL, 2020–2023 (USD MILLION)
  • TABLE 200 TURKEY: SATCOM EQUIPMENT MARKET, BY VERTICAL, 2024–2029 (USD MILLION)
  • TABLE 201 TURKEY: SATCOM EQUIPMENT MARKET, BY TECHNOLOGY, 2020–2023 (USD MILLION)
  • TABLE 202 TURKEY: SATCOM EQUIPMENT MARKET, BY TECHNOLOGY, 2024–2029 (USD MILLION)
  • TABLE 203 AFRICA: SATCOM EQUIPMENT MARKET, BY PLATFORM, 2020–2023 (USD MILLION)
  • TABLE 204 AFRICA: SATCOM EQUIPMENT MARKET, BY PLATFORM, 2024–2029 (USD MILLION)
  • TABLE 205 AFRICA: SATCOM EQUIPMENT MARKET, BY VERTICAL, 2020–2023 (USD MILLION)
  • TABLE 206 AFRICA: SATCOM EQUIPMENT MARKET, BY VERTICAL, 2024–2029 (USD MILLION)
  • TABLE 207 AFRICA: SATCOM EQUIPMENT MARKET, BY TECHNOLOGY, 2020–2023 (USD MILLION)
  • TABLE 208 AFRICA: SATCOM EQUIPMENT MARKET, BY TECHNOLOGY, 2024–2029 (USD MILLION)
  • TABLE 209 LATIN AMERICA: SATCOM EQUIPMENT MARKET, BY PLATFORM, 2020–2023 (USD MILLION)
  • TABLE 210 LATIN AMERICA: SATCOM EQUIPMENT MARKET, BY PLATFORM, 2024–2029 (USD MILLION)
  • TABLE 211 LATIN AMERICA: SATCOM EQUIPMENT MARKET, BY VERTICAL, 2020–2023 (USD MILLION)
  • TABLE 212 LATIN AMERICA: SATCOM EQUIPMENT MARKET, BY VERTICAL, 2024–2029 (USD MILLION)
  • TABLE 213 LATIN AMERICA: SATCOM EQUIPMENT MARKET, BY TECHNOLOGY, 2020–2023 (USD MILLION)
  • TABLE 214 LATIN AMERICA: SATCOM EQUIPMENT MARKET, BY TECHNOLOGY, 2024–2029 (USD MILLION)
  • TABLE 215 LATIN AMERICA: SATCOM EQUIPMENT MARKET, BY COUNTRY, 2020–2023 (USD MILLION)
  • TABLE 216 LATIN AMERICA: SATCOM EQUIPMENT MARKET, BY COUNTRY, 2024–2029 (USD MILLION)
  • TABLE 217 BRAZIL: SATCOM EQUIPMENT MARKET, BY PLATFORM, 2020–2023 (USD MILLION)
  • TABLE 218 BRAZIL: SATCOM EQUIPMENT MARKET, BY PLATFORM, 2024–2029 (USD MILLION)
  • TABLE 219 BRAZIL: SATCOM EQUIPMENT MARKET, BY VERTICAL, 2020–2023 (USD MILLION)
  • TABLE 220 BRAZIL: SATCOM EQUIPMENT MARKET, BY VERTICAL, 2024–2029 (USD MILLION)
  • TABLE 221 BRAZIL: SATCOM EQUIPMENT MARKET, BY TECHNOLOGY, 2020–2023 (USD MILLION)
  • TABLE 222 BRAZIL: SATCOM EQUIPMENT MARKET, BY TECHNOLOGY, 2024–2029 (USD MILLION)
  • TABLE 223 MEXICO: SATCOM EQUIPMENT MARKET, BY PLATFORM, 2020–2023 (USD MILLION)
  • TABLE 224 MEXICO: SATCOM EQUIPMENT MARKET, BY PLATFORM, 2024–2029 (USD MILLION)
  • TABLE 225 MEXICO: SATCOM EQUIPMENT MARKET, BY VERTICAL, 2020–2023 (USD MILLION)
  • TABLE 226 MEXICO: SATCOM EQUIPMENT MARKET, BY VERTICAL, 2024–2029 (USD MILLION)
  • TABLE 227 MEXICO: SATCOM EQUIPMENT MARKET, BY TECHNOLOGY, 2020–2023 (USD MILLION)
  • TABLE 228 MEXICO: SATCOM EQUIPMENT MARKET, BY TECHNOLOGY, 2024–2029 (USD MILLION)
  • TABLE 229 ARGENTINA: SATCOM EQUIPMENT MARKET, BY PLATFORM, 2020–2023 (USD MILLION)
  • TABLE 230 ARGENTINA: SATCOM EQUIPMENT MARKET, BY PLATFORM, 2024–2029 (USD MILLION)
  • TABLE 231 ARGENTINA: SATCOM EQUIPMENT MARKET, BY VERTICAL, 2020–2023 (USD MILLION)
  • TABLE 232 ARGENTINA: SATCOM EQUIPMENT MARKET, BY VERTICAL, 2024–2029 (USD MILLION)
  • TABLE 233 ARGENTINA: SATCOM EQUIPMENT MARKET, BY TECHNOLOGY, 2020–2023 (USD MILLION)
  • TABLE 234 ARGENTINA: SATCOM EQUIPMENT MARKET, BY TECHNOLOGY, 2024–2029 (USD MILLION)
  • TABLE 235 KEY PLAYER STRATEGIES/RIGHT TO WIN, 2020–2024
  • TABLE 236 SATCOM EQUIPMENT MARKET: DEGREE OF COMPETITION
  • TABLE 237 SOLUTION FOOTPRINT
  • TABLE 238 VERTICAL FOOTPRINT
  • TABLE 239 PLATFORM FOOTPRINT
  • TABLE 240 REGION FOOTPRINT
  • TABLE 241 LIST OF START-UPS/SMES
  • TABLE 242 COMPETITIVE BENCHMARKING OF START-UPS/SMES
  • TABLE 243 SATCOM EQUIPMENT MARKET: PRODUCT/SERVICE LAUNCHES, 2020–2024
  • TABLE 244 SATCOM EQUIPMENT MARKET: DEALS, 2020–2024
  • TABLE 245 SATCOM EQUIPMENT MARKET: OTHERS, 2020–2024
  • TABLE 246 ECHOSTAR CORPORATION: COMPANY OVERVIEW
  • TABLE 247 ECHOSTAR CORPORATION: PRODUCTS/SOLUTIONS/SERVICES OFFERED
  • TABLE 248 ECHOSTAR CORPORATION: PRODUCT/SERVICE LAUNCHES
  • TABLE 249 ECHOSTAR CORPORATION: DEALS
  • TABLE 250 ECHOSTAR CORPORATION: OTHERS
  • TABLE 251 L3HARRIS TECHNOLOGIES, INC.: COMPANY OVERVIEW
  • TABLE 252 L3HARRIS TECHNOLOGIES, INC.: PRODUCTS/SOLUTIONS/SERVICES OFFERED
  • TABLE 253 L3HARRIS TECHNOLOGIES, INC.: PRODUCT/SERVICE LAUNCHES
  • TABLE 254 L3HARRIS TECHNOLOGIES, INC.: DEALS
  • TABLE 255 L3HARRIS TECHNOLOGIES, INC.: OTHERS
  • TABLE 256 THALES: COMPANY OVERVIEW
  • TABLE 257 THALES: PRODUCTS/SOLUTIONS/SERVICES OFFERED
  • TABLE 258 THALES: DEALS
  • TABLE 259 THALES: OTHERS
  • TABLE 260 RTX: COMPANY OVERVIEW
  • TABLE 261 RTX: PRODUCTS/SOLUTIONS/SERVICES OFFERED
  • TABLE 262 RTX: OTHERS
  • TABLE 263 GENERAL DYNAMICS CORPORATION: COMPANY OVERVIEW
  • TABLE 264 GENERAL DYNAMICS CORPORATION: PRODUCTS/SOLUTIONS/SERVICES OFFERED
  • TABLE 265 GENERAL DYNAMICS CORPORATION: OTHERS
  • TABLE 266 COBHAM SATCOM: COMPANY OVERVIEW
  • TABLE 267 COBHAM SATCOM: PRODUCTS/SOLUTIONS/SERVICES OFFERED
  • TABLE 268 COBHAM SATCOM: PRODUCT/SERVICE LAUNCHES
  • TABLE 269 COBHAM SATCOM: DEALS
  • TABLE 270 COBHAM SATCOM: OTHERS
  • TABLE 271 HONEYWELL INTERNATIONAL INC.: COMPANY OVERVIEW
  • TABLE 272 HONEYWELL INTERNATIONAL INC.: PRODUCTS/SOLUTIONS/SERVICES OFFERED
  • TABLE 273 HONEYWELL INTERNATIONAL INC.: PRODUCT/SERVICE LAUNCHES
  • TABLE 274 HONEYWELL INTERNATIONAL INC.: DEALS
  • TABLE 275 HONEYWELL INTERNATIONAL INC.: OTHERS
  • TABLE 276 VIASAT, INC.: COMPANY OVERVIEW
  • TABLE 277 VIASAT, INC.: PRODUCTS/SOLUTIONS/SERVICES OFFERED
  • TABLE 278 VIASAT, INC.: DEALS
  • TABLE 279 VIASAT, INC.: OTHERS
  • TABLE 280 GILAT SATELLITE NETWORKS: COMPANY OVERVIEW
  • TABLE 281 GILAT SATELLITE NETWORKS: PRODUCTS/SOLUTIONS/SERVICES OFFERED
  • TABLE 282 GILAT SATELLITE NETWORKS: DEALS
  • TABLE 283 GILAT SATELLITE NETWORKS: OTHERS
  • TABLE 284 IRIDIUM COMMUNICATIONS INC.: COMPANY OVERVIEW
  • TABLE 285 IRIDIUM COMMUNICATIONS INC.: PRODUCTS/SOLUTIONS/SERVICES OFFERED
  • TABLE 286 IRIDIUM COMMUNICATIONS INC.: PRODUCT/SERVICE LAUNCHES
  • TABLE 287 IRIDIUM COMMUNICATIONS INC.: DEALS
  • TABLE 288 IRIDIUM COMMUNICATIONS INC.: OTHERS
  • TABLE 289 ASELSAN A.S.: COMPANY OVERVIEW
  • TABLE 290 ASELSAN A.S.: PRODUCTS/SOLUTIONS/SERVICES OFFERED
  • TABLE 291 ASELSAN A.S.: PRODUCT/SERVICE LAUNCHES
  • TABLE 292 ASELSAN A.S.: OTHERS
  • TABLE 293 INTELLIAN TECHNOLOGIES, INC.: COMPANY OVERVIEW
  • TABLE 294 INTELLIAN TECHNOLOGIES, INC.: PRODUCTS/SOLUTIONS/SERVICES OFFERED
  • TABLE 295 INTELLIAN TECHNOLOGIES, INC.: PRODUCT/SERVICE LAUNCHES
  • TABLE 296 INTELLIAN TECHNOLOGIES, INC.: DEALS
  • TABLE 297 INTELLIAN TECHNOLOGIES, INC.: OTHERS
  • TABLE 298 ST ENGINEERING: COMPANY OVERVIEW
  • TABLE 299 ST ENGINEERING: PRODUCTS/SOLUTIONS/SERVICES OFFERED
  • TABLE 300 ST ENGINEERING: PRODUCT/SERVICE LAUNCHES
  • TABLE 301 ST ENGINEERING: DEALS
  • TABLE 302 ST ENGINEERING: OTHERS
  • TABLE 303 SPACEX: COMPANY OVERVIEW
  • TABLE 304 SPACEX: PRODUCTS/SOLUTIONS/SERVICES OFFERED
  • TABLE 305 SPACEX: PRODUCT/SERVICE LAUNCHES
  • TABLE 306 ELBIT SYSTEMS LTD.: COMPANY OVERVIEW
  • TABLE 307 ELBIT SYSTEMS LTD.: PRODUCTS/SOLUTIONS/SERVICES OFFERED
  • TABLE 308 ELBIT SYSTEMS LTD.: PRODUCT/SERVICE LAUNCHES
  • TABLE 309 ELBIT SYSTEMS LTD.: DEALS
  • TABLE 310 ELBIT SYSTEMS LTD.: OTHERS
  • TABLE 311 CAMPBELL SCIENTIFIC, INC.: COMPANY OVERVIEW
  • TABLE 312 ND SATCOM GMBH: COMPANY OVERVIEW
  • TABLE 313 SATCOM GLOBAL: COMPANY OVERVIEW
  • TABLE 314 HOLKIRK COMMUNICATIONS LTD.: COMPANY OVERVIEW
  • TABLE 315 AVL TECHNOLOGIES: COMPANY OVERVIEW
  • TABLE 316 ONEWEB: COMPANY OVERVIEW
  • TABLE 317 THINKOM SOLUTIONS INC.: COMPANY OVERVIEW
  • TABLE 318 VIKING SATCOM: COMPANY OVERVIEW
  • TABLE 319 NORSAT INTERNATIONAL INC.: COMPANY OVERVIEW
  • TABLE 320 CESIUMASTRO, INC.: COMPANY OVERVIEW
LIST OF FIGURES
 
  • FIGURE 1 SATCOM EQUIPMENT MARKET SEGMENTATION
  • FIGURE 2 RESEARCH DESIGN MODEL
  • FIGURE 3 RESEARCH DESIGN
  • FIGURE 4 BOTTOM-UP APPROACH
  • FIGURE 5 TOP-DOWN APPROACH
  • FIGURE 6 DATA TRIANGULATION
  • FIGURE 7 AIRBORNE SEGMENT TO HOLD LEADING POSITION DURING FORECAST PERIOD
  • FIGURE 8 SATCOM-ON-THE-MOVE SEGMENT TO BE DOMINANT DURING FORECAST PERIOD
  • FIGURE 9 PRODUCT SEGMENT TO SECURE HIGHER SHARE THAN SERVICE SEGMENT IN 2029
  • FIGURE 10 COMMERCIAL SEGMENT TO BE LARGER THAN GOVERNMENT & DEFENSE SEGMENT DURING FORECAST PERIOD
  • FIGURE 11 LEO TO BE FASTEST-GROWING SEGMENT DURING FORECAST PERIOD
  • FIGURE 12 MULTI-BAND SEGMENT TO EXHIBIT FASTEST GROWTH DURING FORECAST PERIOD
  • FIGURE 13 NORTH AMERICA TO BE LARGEST MARKET FOR SATCOM EQUIPMENT DURING FORECAST PERIOD
  • FIGURE 14 EXTENSIVE USE OF SATCOM EQUIPMENT FOR TRACKING, MONITORING, AND SURVEILLANCE TO DRIVE MARKET
  • FIGURE 15 AIRBORNE SEGMENT TO BE PREVALENT DURING FORECAST PERIOD
  • FIGURE 16 COMMERCIAL AIRCRAFT TO BE LARGEST SEGMENT DURING FORECAST PERIOD
  • FIGURE 17 RETAIL & CONSUMER TO SURPASS OTHER SEGMENTS DURING FORECAST PERIOD
  • FIGURE 18 SATCOM-ON-THE-MOVE SEGMENT TO ACCOUNT FOR MAXIMUM SHARE IN 2024
  • FIGURE 19 SATCOM EQUIPMENT MARKET DYNAMICS
  • FIGURE 20 VALUE CHAIN ANALYSIS
  • FIGURE 21 TRENDS AND DISRUPTIONS IMPACTING CUSTOMER BUSINESS
  • FIGURE 22 ECOSYSTEM ANALYSIS
  • FIGURE 23 BUSINESS MODELS OF SATCOM EQUIPMENT MARKET
  • FIGURE 24 BREAKDOWN OF TOTAL COST OF OWNERSHIP OF SATCOM EQUIPMENT
  • FIGURE 25 BILL OF MATERIALS FOR PORTABLE SATCOM EQUIPMENT
  • FIGURE 26 BILL OF MATERIALS FOR LAND MOBILE SATCOM EQUIPMENT
  • FIGURE 27 BILL OF MATERIALS FOR LAND FIXED SATCOM EQUIPMENT
  • FIGURE 28 BILL OF MATERIALS FOR AIRBORNE SATCOM EQUIPMENT
  • FIGURE 29 BILL OF MATERIALS FOR MARITIME SATCOM EQUIPMENT
  • FIGURE 30 EVOLUTION OF SATCOM EQUIPMENT TECHNOLOGY
  • FIGURE 31 INTRODUCTION TO TECHNOLOGY ROADMAP
  • FIGURE 32 EMERGING TRENDS
  • FIGURE 33 INDICATIVE PRICING OF SATCOM EQUIPMENT, BY PLATFORM (USD)
  • FIGURE 34 INFLUENCE OF STAKEHOLDERS ON BUYING PROCESS, BY VERTICAL
  • FIGURE 35 KEY BUYING CRITERIA FOR SATCOM EQUIPMENT, BY VERTICAL
  • FIGURE 36 IMPORT DATA FOR HS CODE 880260, BY COUNTRY, 2020–2023 (USD THOUSAND)
  • FIGURE 37 EXPORT DATA FOR HS CODE 880260, BY COUNTRY, 2020–2023 (USD THOUSAND)
  • FIGURE 38 INVESTMENTS IN START-UP SATELLITE COMPANIES, 2022
  • FIGURE 39 VENTURE CAPITAL FUNDING, 2017–2022 (USD BILLION)
  • FIGURE 40 SUPPLY CHAIN ANALYSIS
  • FIGURE 41 PATENT ANALYSIS, 2013–2023
  • FIGURE 42 AI IN SATCOM INDUSTRY
  • FIGURE 43 ADOPTION OF AI IN SPACE BY TOP COUNTRIES
  • FIGURE 44 IMPACT OF AI ON SATCOM PLATFORMS
  • FIGURE 45 IMPACT OF AI ON SATCOM EQUIPMENT MARKET
  • FIGURE 46 SATCOM EQUIPMENT MARKET, BY CONNECTIVITY, 2024–2029 (USD MILLION)
  • FIGURE 47 SATCOM EQUIPMENT MARKET, BY FREQUENCY, 2024–2029 (USD MILLION)
  • FIGURE 48 SATCOM EQUIPMENT MARKET, BY TYPE, 2024–2029 (USD MILLION)
  • FIGURE 49 SATCOM EQUIPMENT MARKET, BY VERTICAL, 2024–2029 (USD MILLION)
  • FIGURE 50 SATCOM EQUIPMENT MARKET, BY SOLUTION, 2024–2029 (USD MILLION)
  • FIGURE 51 SATCOM EQUIPMENT MARKET, BY PLATFORM, 2024–2029 (USD MILLION)
  • FIGURE 52 SATCOM EQUIPMENT MARKET, BY REGION, 2024–2029
  • FIGURE 53 NORTH AMERICA: SATCOM EQUIPMENT MARKET SNAPSHOT
  • FIGURE 54 EUROPE: SATCOM EQUIPMENT MARKET SNAPSHOT
  • FIGURE 55 ASIA PACIFIC: SATCOM EQUIPMENT MARKET SNAPSHOT
  • FIGURE 56 MIDDLE EAST & AFRICA: SATCOM EQUIPMENT MARKET SNAPSHOT
  • FIGURE 57 LATIN AMERICA: SATCOM EQUIPMENT MARKET SNAPSHOT
  • FIGURE 58 REVENUE ANALYSIS OF TOP FIVE PLAYERS, 2020–2023 (USD MILLION)
  • FIGURE 59 MARKET SHARE ANALYSIS OF KEY PLAYERS, 2023
  • FIGURE 60 VALUATION OF PROMINENT MARKET PLAYERS
  • FIGURE 61 EV/EBIDTA OF PROMINENT MARKET PLAYERS
  • FIGURE 62 COMPANY EVALUATION MATRIX (KEY PLAYERS), 2023
  • FIGURE 63 COMPANY FOOTPRINT
  • FIGURE 64 COMPANY EVALUATION MATRIX (START-UPS/SMES), 2023
  • FIGURE 65 BRAND/PRODUCT COMPARISON
  • FIGURE 66 ECHOSTAR CORPORATION: COMPANY SNAPSHOT
  • FIGURE 67 L3HARRIS TECHNOLOGIES, INC.: COMPANY SNAPSHOT
  • FIGURE 68 THALES: COMPANY SNAPSHOT
  • FIGURE 69 RTX: COMPANY SNAPSHOT
  • FIGURE 70 GENERAL DYNAMICS CORPORATION: COMPANY SNAPSHOT
  • FIGURE 71 HONEYWELL INTERNATIONAL INC.: COMPANY SNAPSHOT
  • FIGURE 72 VIASAT, INC.: COMPANY SNAPSHOT
  • FIGURE 73 GILAT SATELLITE NETWORKS: COMPANY SNAPSHOT
  • FIGURE 74 IRIDIUM COMMUNICATIONS INC.: COMPANY SNAPSHOT
  • FIGURE 75 ASELSAN A.S.: COMPANY SNAPSHOT
  • FIGURE 76 INTELLIAN TECHNOLOGIES, INC.: COMPANY SNAPSHOT
  • FIGURE 77 ST ENGINEERING: COMPANY SNAPSHOT
  • FIGURE 78 ELBIT SYSTEMS LTD.: COMPANY SNAPSHOT

This research study involved the extensive use of secondary sources, directories, and databases, such as D&B Hoovers, Bloomberg Businessweek, and Factiva, to identify and collect information relevant to the SATCOM Equipment market. Primary sources included industry experts from the core and related industries, as well as preferred suppliers, manufacturers, solution providers, technology developers, alliances, and organizations related to all the segments of this industry’s value chain. All primary sources were interviewed to obtain and verify critical qualitative and quantitative information and assess prospects for market growth during the forecast period.

Secondary Research

The share of companies in the SATCOM Equipment market was determined using secondary data made available through paid and unpaid sources and analyzing product portfolios of major companies in the SATCOM market. These companies were rated based on the performance and quality of their products. These data points were further validated by primary sources.

Secondary sources referred to for this research study on the SATCOM Equipment market included financial statements of companies offering and developing SATCOM Equipment and information from various trade, business, and professional associations, among others. Secondary data was collected and analyzed to determine the total size of the green methanol ships market, which primary respondents further validated.

Primary Research

Extensive primary research was conducted after obtaining information about the current scenario of the SATCOM Equipment market through secondary research. Several primary interviews were conducted with market experts from the demand and supply sides across North America, Europe, Asia Pacific, the Middle East, and Latin America. This primary data was collected through questionnaires, emails, and telephonic interviews. In the primary research process, varied primary sources from the supply and demand sides were interviewed to get qualitative and quantitative information on the market. Primary sources from the supply side include different industry experts like vice presidents, directors, regional managers, technology providers, product development teams, distributors, and end users.

Primary research has been done through interviews to get information that includes market statistics, revenue collection data from the products and services, and market breakups, size estimations, market forecasting, and data triangulation. Through primary research, the trends of technology, application, platform, and region were also understood. Demand-side stakeholders, such as CXOs, production managers, engineers, and installation teams of end users of SATCOM Equipment, were interviewed to understand the buyer’s perspective on the suppliers, products, service providers, and their current usage and future outlook of their business, which could affect the SATCOM Equipment market.
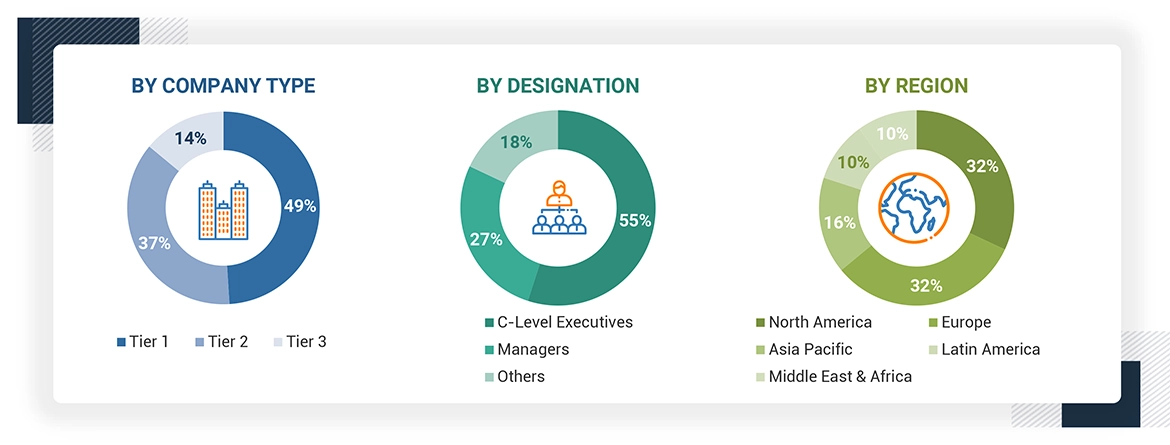
Note: C-level Executives include the CEO, COO, and CTO, among others.

*Others include Sales Managers, Marketing Managers, and Product Managers.

The tiers of the companies have been defined based on their total revenue as of 2022.

Tier 1 = > USD 1 billion, Tier 2 = USD 100 million to USD 1 billion, and Tier 3 = < USD 100 million

To know about the assumptions considered for the study, download the pdf brochure

Market Size Estimation

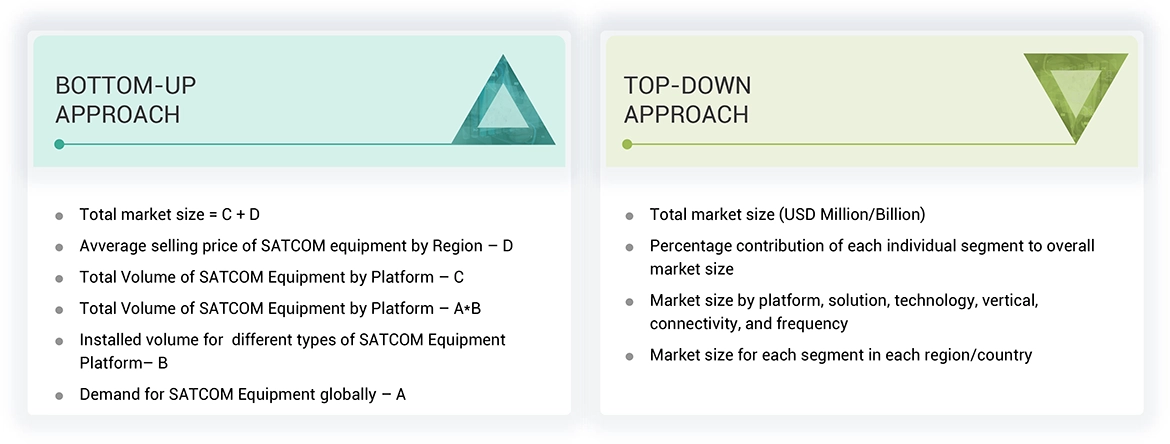
Both top-down and bottom-up approaches were used to estimate and validate the size of the SATCOM Equipment market. The research methodology used to estimate the market size includes the following details:

  • Key players were identified through secondary research, and their market ranking was determined through primary and secondary research. This included a study of annual and financial reports of the top market players and extensive interviews of leaders, including CEOs, directors, and marketing executives.
  • All percentage shares, splits, and breakdowns were determined using secondary sources and verified through primary sources. All possible parameters that affect the markets covered in this research study were accounted for, viewed in extensive detail, verified through primary research, and analyzed to obtain the final quantitative and qualitative data. This data was consolidated, enhanced with detailed inputs, analyzed by MarketsandMarkets, and presented in this report.
Data Triangulation

After arriving at the overall size of the SATCOM Equipment market from the market size estimation process explained above, the total market was split into several segments and subsegments. To complete the overall market engineering process and arrive at the exact statistics for various market segments and sub-segments, the data triangulation and market breakdown procedures explained below were implemented, wherever applicable. The data was triangulated by studying various factors and trends from both the demand and supply sides. The market size was also validated using both the top-down and bottom-up approaches.

Market Definition

SATCOM equipment refers to devices used in satellite communication systems. These devices are designed to facilitate the transmission and reception of signals between satellite networks and ground-based stations or user terminals. They are pivotal in establishing reliable communication links, enabling applications such as broadband internet access, voice communication, data transfer, video broadcasting, remote sensing, and IoT connectivity. SATCOM equipment can handle multiple frequencies, bandwidths, and transmission protocols, making it instrumental in connecting remote areas, maritime and aviation communication, disaster response, and other communications needs.

Stakeholders

  • Military Antenna Manufacturers
  • System Integrators
  • Original Equipment Manufacturers
  • Military Service Providers
  • Research Organizations
  • Investors and Venture Capitalists
  • Ministries of Defense
  • R&D Companies

Report Objectives

  • To define, describe, segment, and forecast the size of the green methanol ships market based on platform, technology, solution, vertical, frequency, connectivity, and region.
  • To forecast the size of various segments of the market with respect to five major regions, namely North America, Europe, Asia Pacific, Middle East & Africa, and Latin America, along with major countries in each of these regions.
  • To identify and analyze key drivers, restraints, opportunities, and challenges influencing the growth of the market across the globe.
  • To identify industry trends, market trends, and technology trends currently prevailing in the market.
  • To provide an overview of the regulatory landscape with respect to SATCOM Equipment regulations across regions
  • To analyze micromarkets1 with respect to individual growth trends, prospects, and their contribution to the overall market
  • To analyze opportunities in the market for stakeholders by identifying key market trends
  • To profile key market players and comprehensively analyze their market share and core competencies2.
  • To analyze the degree of competition in the market by identifying key growth strategies, such as, agreements, acquisitions, contracts, and partnerships, adopted by leading market players.
  • To identify detailed financial positions, key products, and unique selling points of leading companies in the market
  • To provide a detailed competitive landscape of the market, along with market ranking analysis, market share analysis, and revenue analysis of key players


Previous Versions of this Report

Satellite Communication (SATCOM) Equipment Market by Solution (Products and Services), Platform (Portable, Land Mobile, Land Fixed, Airborne, Maritime), Technology (SOTM/COTM, SOTP), Vertical, Connectivity, Frequency, and Region (2021-2026)

Report Code AS 6169
Published in May, 2023, By MarketsandMarkets™

Satellite Communication (SATCOM) Equipment Market by Solution (Products and Services), Platform (Portable, Land Mobile, Land Fixed, Airborne, Maritime), Technology (SOTM/COTM, SOTP), Vertical, Connectivity, Frequency, and Region - Forecast to 2026

Report Code AS 6169
Published in Sep, 2021, By MarketsandMarkets™

Satellite Communication (SATCOM) Equipment Market by Solution (Products and Services), Platform (Portable, Land Mobile, Land Fixed, Airborne, Maritime), Technology (SOTM/COTM, SOTP), Vertical, Connectivity, Frequency, and Region - Forecast to 2026

Report Code AS 6169
Published in Apr, 2018, By MarketsandMarkets™
"Our USP is "providing game-changing business opportunities reports with free customization" - so please feel free to provide us with your specific areas of interest / business challenges in much greater detail !!"

We appreciate your interest in this report. Once you fill out the form, you'll be immediately directed to an exclusive solution tailored to your needs. This high-value offering can help boost your revenue by 30% - a must-see opportunity for anyone looking to maximize growth.


By clicking the "Submit" button, you are agreeing to the Terms of Use and Privacy Policy.

Custom Market Research Services

We Will Customise The Research For You, In Case The Report Listed Above Does Not Meet With Your Requirements

Get 10% Free Customisation

Growth opportunities and latent adjacency in Satellite Communication (SATCOM) Equipment Market

DMCA.com Protection Status