Refinery Catalysts Market

Refinery Catalysts Market by Type (FCC Catalysts, Hydrotreating Catalysts, Hydrocracking Catalysts, Catalytic Reforming Catalysts), Ingredients (Zeolites, Metals, Chemical Compounds), and Region - Global Forecast to 2029

Report Code: CH 2913 Aug, 2024, by marketsandmarkets.com

Refinery Catalyst Market

The global refinery catalyst market is valued at USD 5.6 billion in 2024 and is projected to reach USD 6.8 billion by 2029, growing at 4.0% cagr from 2024 to 2029.

The refinery catalyst market is projected to grow at a moderate rate during the forecast year. They are an essential part of systems where regulating heat is an important factor. Refinery catalysts enable efficient oil refining process by significantly enhancing its efficiency and sustainability.  The catalysts help in quickly converting low value crude oil into high-quality petroleum products such as gasoline, diesel, and other fuels. The growth in this market is driven by various factors like increasing demand for cleaner fuels, high octane number requirement, and technological advancements. The innovation in catalyst composition will further allow improved conversion rates, higher selectivity, and better tolerance to impurities. The research is also driven by the need for best solution for sustainability and emission control.

Global Refinery Catalyst Market Trend

Refinery Catalyst Market

To know about the assumptions considered for the study, Request for Free Sample Report

Refinery Catalyst Market

Refinery Catalyst Market Dynamics

Driver: High octane number requirement

High octane fuels are essential for improving the engine performance and efficiency of vehicles. In recent years, the requirement of high-octane fuel is significantly increasing due to increasing awareness and growing consumer expenditure. These fuels are essential in resisting knock backs, which can damage engines. In addition, they improve the overall combustion process in modern, high-performance engines. These factors are in line with the growing demand of high-performance vehicles. They also help in increasing fuel efficiency and regulating emission. For producing high-octane fuels, refiners use advanced catalytic processes such as catalytic reforming and isomerization. High quality catalysts are needed for refining high-octane fuels. The growing need for such fuels is driving the refiners develop advanced catalyst technologies. This will directly drive the refinery catalyst market.

Restraint: Declining crude oil reserves

The ever-decreasing crude oil reserves are the largest restraint faced by the refinery catalyst market. The depleting fields pose a significant threat to refiners in securing reliable and sufficient supply of crude oil reserve for processing. The growing scarcity disrupts the refining operations and limits the reserves for performing refining process with the use of refinery catalysts. In addition, as the reserves decrease, the price for procuring crude oil increases. This increases the uncertainty of future of crude oil refining and the by products produced. The use of catalysts in refining will also suffer an impact due to the depleting reserves.

Opportunity: Shift towards renewable fuels

The increasing use of renewable fuels are providing catalyst manufacturers enough opportunity in the refinery catalyst market. The stringent environmental regulations are marking manufacturers increase their sustainability efforts for achieving green economy. This will drive the demand for catalysts which are used in processing renewable feedstocks like biofuels & biogas. They also help in converting biomass and waste materials into cleaner, high-quality transportation fuels with reduced emissions. Advancement of technology for improving conversion efficiency, selectivity, and sustainability to produce fuels will benefit the catalyst manufacturers. The increase in R&D will support refinery catalysts in penetrating new refining sectors for renewable energy along with maintaining environmental sustainability. 

Challenges: Rise of electric vehicles (EVs)

The growing market of Electric Vehicles (EVs) are hampering the growth in the market of refinery catalysts. The traditional vehicles majorly use petroleum based fuels, the adoption of EVs will limit the requirement of petroleum based products in the automotive sector. The increasing focus on environmental sustainability and carbon emission are influencing more and more use of EVs. Government organizations in some countries are also providing economic assistance to the manufacturers as well as the buyers of EVs. This will see an increase in manufacturing and demand of EVs, however, will decrease the sale of traditional petroleum based fuel vehicles. Thus, hampering the growth in the market of refinery catalysts.

Refinery Catalyst Market Ecosystem

Refinery Catalyst Market Ecosystem

By ingredient, zeolites are the fastest growing segment in refinery catalyst market, in 2023.

Zeolites, metals, and chemical compounds are often used as a catalyst in refining process. Among these zeolites captures a significant share in terms of volume and is also among the fastest growing refinery catalyst. Zeolites are porous in nature. These pores act as a trap for atoms and molecules, which lead to chemical reaction. In addition, their pore size is beneficial for selective catalytic reactions for certain molecules. Zeolites are highly reactive catalyst for oil refining. They are used in major refining processes like naptha isomerization, olefin alkylation, catalytic reforming, fluid catalytic cracking, and hydrocracking. Y-zeolite, ZSM-5, and mordenite are the most commonly used variants for the refining process.

By type, FCC catalyst captures the largest share in refinery catalyst market, in 2023.

FCC catalyst, hydrotreating catalyst, hydrocracking catalyst, catalytic reforming catalyst are the catalysts used in various refining processes. FCC catalyst is the most common refining process. In this process, heavy crude oils, like gas oils and residues are converted into valuable lighter products like gasoline and olefins. The use for FCC catalyst goes in hand with the growing demand for high octane fuels. They are most profitable in refining process due to their capability of producing high octane fuels and other petroleum feedstocks. The catalyst in this process is continuously circulated between the reactor and regenerator. A wide variety of feedstock can be handled by FCC units.

Asia Pacific accounted for the largest market share in the refinery catalyst market, in terms of value.

Based on region, Asia Pacific is a key market to produce refinery catalysts and is projected to grow at a CAGR of 4.5% in terms of value during the forecasted period. The availability of low-cost raw materials and labor, coupled with increasing domestic demand, makes the region an attractive investment destination for refinery catalyst manufacturers. The rising population, urbanization, industrialization, and growing concerns related to environmental sustainability are some of the factors that will drive the refinery catalyst market in this region. The leniency of regulations also drives the manufacturing market of refinery catalysts in Asia Pacific.

Refinery Catalyst Market by Region

To know about the assumptions considered for the study, download the pdf brochure

Refinery Catalyst Market Players

Some of the key players operating in the refinery catalyst market include Albemarle Corporation (US), W R Grace (US), BASF (Germany), Haldor Topsoe (Denmark), Honeywell UOP (US), Clariant (Switzerland), Axens (France), Johnson Matthey (UK), China Petroleum and Chemical Corporation (Sinopec) (China), and Shell Catalyst & Technologies (Netherlands) among others.

These companies have adopted various organic as well as inorganic growth strategies between 2019 and 2023 to strengthen their positions in the market. The expansion is the key growth strategy adopted by these leading players to enhance regional presence and develop product portfolios to meet the growing demand for refinery catalystfrom emerging economies.

Refinery Catalyst Scope

Report Metric

Details

Years considered for the study

2020-2029

Base Year

2023

Forecast period

2024–2029

Units considered

Kiloton; Value (USD Million)

Segments

Type, Ingredient, and Region

Regions

Asia Pacific, North America, Europe, Middle East & Africa, and South America

Companies

Albemarle Corporation (US), W R Grace (US), BASF (Germany), Haldor Topsoe (Denmark), Honeywell UOP (US), Clariant (Switzerland), Axens (France), Johnson Matthey (UK), China Petroleum and Chemical Corporation (Sinopec) (China), and Shell Catalyst & Technologies (Netherlands).

This report categorizes the global refinery catalyst market based on type, ingredient, and region.

Based on the type:
  • FCC Catalysts
  • Hydrotreating Catalysts
  • Hydrocracking Catalysts
  • Catalytic Reforming Catalysts
  • Other Types
Based on the ingredients:
  • Zeolites
  • Metals
  • Chemical Compounds
Based on the region:
  • Asia Pacific
  • Europe
  • North America
  • South America
  • Middle East & Africa

Recent Developments

  • In November 2021, Axens launched its P/PR 200 Series. The new P/PR 200 Series allows for the option to short-load the unit, process additional naphtha, or extend the time-on-stream factor, all while enhancing average selectivity.
  • In January 2024, The Albemarle Corporation has formally introduced Ketjen, a wholly owned subsidiary that creates customized, innovative catalyst solutions for the specialty chemicals, petrochemical, and refining industries. As a separate brand, Ketjen supports customers in spanning fluidized catalytic cracking, clean fuels, hydro-processing, organometallics, and curatives.
  • In March 2023, Haldor Topsoe has built a new catalyst plant in Pasadena, Texas to produce catalysts for traditional refining as well as renewable diesel and jet fuel using its HydroFlex technology.

Frequently Asked Questions (FAQ):

To speak to our analyst for a discussion on the above findings, click Speak to Analyst

Exclusive indicates content/data unique to MarketsandMarkets and not available with any competitors.

INTRODUCTION
23
RESEARCH METHODOLOGY
27
EXECUTIVE SUMMARY
36
PREMIUM INSIGHTS
38
MARKET OVERVIEW
40
  • 5.1 INTRODUCTION
  • 5.2 MARKET DYNAMICS
    DRIVERS
    - Increasing demand for cleaner fuels
    - High octane number requirement
    - Technological advancements
    RESTRAINTS
    - Availability of substitute materials
    - Declining crude oil reserves
    OPPORTUNITIES
    - Shift toward renewable fuels
    - Backward integration by major refinery catalyst manufacturers
    CHALLENGES
    - Volatile prices of precious group metals
    - Rise of electric vehicles
  • 5.3 PORTER’S FIVE FORCES ANALYSIS
    THREAT OF SUBSTITUTES
    BARGAINING POWER OF SUPPLIERS
    THREAT OF NEW ENTRANTS
    BARGAINING POWER OF BUYERS
    INTENSITY OF COMPETITIVE RIVALRY
  • 5.4 KEY STAKEHOLDERS AND BUYING CRITERIA
    KEY STAKEHOLDERS IN BUYING PROCESS
    QUALITY
    SERVICE
  • 5.5 VALUE CHAIN ANALYSIS
    RAW MATERIAL SOURCING
    MANUFACTURING
    DISTRIBUTION
    END USERS
  • 5.6 ECOSYSTEM
  • 5.7 TECHNOLOGY ANALYSIS
    KEY TECHNOLOGIES
    - Nanotechnology
    - Bimetallic catalyst technology
    COMPLEMENTARY TECHNOLOGIES
    - AI & machine learning integration
  • 5.8 KEY CONFERENCES AND EVENTS, 2024–2025
  • 5.9 REGULATORY LANDSCAPE
    REGULATIONS
    NORTH AMERICA
    ASIA PACIFIC
    EUROPE
    REGULATORY BODIES, GOVERNMENT AGENCIES, AND OTHER ORGANIZATIONS
  • 5.10 TRADE ANALYSIS
    IMPORT TRADE ANALYSIS: HS CODE 381511
    EXPORT TRADE ANALYSIS: HS CODE 381511
    IMPORT TRADE ANALYSIS: HS CODE 381512
    EXPORT TRADE ANALYSIS: HS CODE 381512
    IMPORT TRADE ANALYSIS: HS CODE 381519
    EXPORT TRADE ANALYSIS: HS CODE 381519
  • 5.11 INVESTMENT AND FUNDING SCENARIO
  • 5.12 CASE STUDY
    SELECTIVE CATALYTIC REDUCTION
    BASF TECHNOLOGY CLEANS UP BOSTON’S BIG DIG PROJECT
  • 5.13 MACROECONOMIC INDICATORS
    GDP TRENDS AND FORECASTS
    GLOBAL OIL PRODUCTION
    WORLD REFINERY CAPACITY
  • 5.14 TRENDS/DISRUPTIONS IMPACTING CUSTOMER BUSINESS
  • 5.15 PATENT ANALYSIS
    INTRODUCTION
    DOCUMENT TYPES
    PUBLICATION TRENDS IN LAST 10 YEARS
    INSIGHTS
    LEGAL STATUS OF PATENTS
    JURISDICTION ANALYSIS
    TOP APPLICANTS
  • 5.16 PRICING ANALYSIS
    AVERAGE SELLING PRICE TREND, BY REGION
    AVERAGE SELLING PRICE, BY INGREDIENT
    AVERAGE SELLING PRICE, BY TYPE
  • 5.17 IMPACT OF AI/GEN AI
REFINERY CATALYSTS MARKET, BY TYPE
74
  • 6.1 INTRODUCTION
  • 6.2 FCC CATALYSTS
    PLAY KEY ROLE IN REFINING PROCESS
  • 6.3 HYDROPROCESSING CATALYSTS
    HYDROTREATING CATALYSTS
    - Essential in petroleum refining process
    HYDROCRACKING CATALYSTS
    - Help convert heavy hydrocarbons into lighter, valuable products
  • 6.4 CATALYTIC REFORMING CATALYSTS
    DEMAND FOR HIGH OCTANE RATED PETROLEUM TO DRIVE MARKET
  • 6.5 OTHER TYPES
    ISOMERIZATION CATALYSTS
    ALKYLATION CATALYSTS
    HYDROGENATION CATALYSTS
    DESULFURIZATION CATALYSTS
REFINERY CATALYSTS MARKET, BY INGREDIENT
80
  • 7.1 INTRODUCTION
  • 7.2 ZEOLITES
    MOST COMMON INGREDIENT IN REFINING CATALYSTS
    - Natural zeolites
    - Synthetic zeolites
  • 7.3 METALS
    PLAY CRUCIAL ROLE IN PETROLEUM REFINING INDUSTRY
    PRECIOUS METALS
    - Platinum
    - Palladium
    - Gold
    RARE EARTH METALS
    TRANSITION & BASE METALS
    - Molybdenum
    - Tungsten
    - Cobalt
    - Nickel
    - Iron
    - Zirconium
    - Manganese
    - Chromium
  • 7.4 CHEMICAL COMPOUNDS
    WIDELY USED IN ALKYLATION PROCESS
    SULFURIC ACID & HYDROFLUORIC ACID
    CALCIUM CARBONATE
REFINERY CATALYSTS MARKET, BY REGION
88
  • 8.1 INTRODUCTION
  • 8.2 NORTH AMERICA
    US
    - Increasing oil production capacity to drive growth
    CANADA
    - Government regulations to support market growth
    MEXICO
    - Rise in automotive industry to drive market
  • 8.3 ASIA PACIFIC
    CHINA
    - Rising population and industrialization to drive market
    JAPAN
    - Limited natural resources and adoption of renewable fuels to drive market
    INDIA
    - Stringent environmental regulations to propel market
    SOUTH KOREA
    - Increased investments by major oil refining companies to drive market
    REST OF ASIA PACIFIC
  • 8.4 EUROPE
    RUSSIA
    - High production capacity & new government policies to drive market
    GERMANY
    - Implementation of new government regulations to drive market
    FRANCE
    - Strict environmental regulations to meet net-zero carbon emissions to support market growth
    UK
    - Rising demand for electric vehicles to drive market
    ITALY
    - Heavy reliance on imported crude oil to support market growth
    SPAIN
    - Growth of oil refining industries to boost market growth
    REST OF EUROPE
  • 8.5 MIDDLE EAST & AFRICA
    GCC COUNTRIES
    - SAUDI ARABIA
    - REST OF GCC COUNTRIES
    SOUTH AFRICA
    - Growth of petrochemical industry to drive market
    REST OF MIDDLE EAST & AFRICA
  • 8.6 SOUTH AMERICA
    BRAZIL
    - Adoption of advanced catalysts to enhance refinery efficiency to propel market
    ARGENTINA
    - Rising imports of refined products from US to support market growth
    REST OF SOUTH AMERICA
COMPETITIVE LANDSCAPE
153
  • 9.1 OVERVIEW
  • 9.2 KEY PLAYER STRATEGIES/RIGHT TO WIN, JANUARY 2019–JULY 2024
  • 9.3 REVENUE ANALYSIS, 2021–2023
  • 9.4 MARKET SHARE ANALYSIS, 2023
    BASF SE
    ALBEMARLE CORPORATION
    W. R. GRACE & CO.
    TOPSOE
    HONEYWELL UOP
  • 9.5 COMPANY VALUATION AND FINANCIAL METRICS, 2023
    COMPANY VALUATION
    FINANCIAL METRICS
  • 9.6 BRAND/PRODUCT COMPARISON
  • 9.7 COMPANY EVALUATION MATRIX: KEY PLAYERS, 2023
    STARS
    EMERGING LEADERS
    PERVASIVE PLAYERS
    PARTICIPANTS
    COMPANY FOOTPRINT: KEY PLAYERS, 2023
    - Company footprint
    - Type footprint
    - Ingredient footprint
    - Region footprint
  • 9.8 COMPANY EVALUATION MATRIX: STARTUPS/SMES, 2023
    PROGRESSIVE COMPANIES
    RESPONSIVE COMPANIES
    DYNAMIC COMPANIES
    STARTING BLOCKS
    COMPETITIVE BENCHMARKING, STARTUPS/SMES, 2023
    - Detailed list of key startups/SMEs
    - Competitive benchmarking of key startups/SMEs
  • 9.9 COMPETITIVE SCENARIO
    PRODUCT LAUNCHES
    EXPANSIONS
    OTHER DEVELOPMENTS
COMPANY PROFILES
172
  • 10.1 KEY PLAYERS
    ALBEMARLE CORPORATION
    - Business overview
    - Products/Solutions/Services offered
    - Recent developments
    - MnM view
    W.R. GRACE & CO.
    - Business overview
    - Products/Solutions/Services offered
    - Recent developments
    - MnM view
    BASF SE
    - Business overview
    - Products/Solutions/Services offered
    - MnM view
    TOPSOE
    - Business overview
    - Products/Solutions/Services offered
    - Recent developments
    - MnM view
    HONEYWELL UOP
    - Business overview
    - Products/Solutions/Services offered
    - MnM view
    AXENS
    - Business overview
    - Products/Solutions/Services offered
    - Recent developments
    - MnM view
    CLARIANT
    - Business overview
    - Products/Solutions/Services offered
    - Recent developments
    - MnM view
    JOHNSON MATTHEY
    - Business overview
    - Products/Solutions/Services offered
    - MnM view
    SHELL CATALYSTS & TECHNOLOGIES
    - Business overview
    - Products/Solutions/Services offered
    - MnM view
    CHINA PETROLEUM & CHEMICAL CORPORATION (SINOPEC)
    - Business overview
    - Products/Solutions/Services offered
    - MnM view
    ARKEMA
    - Business overview
    - Products/Solutions/Services offered
    - MnM view
  • 10.2 OTHER PLAYERS
    JGC CATALYSTS AND CHEMICALS LTD.
    CHEVRON CORPORATION
    ANTENCHEM
    DORF KETAL CHEMICALS (I) PVT. LTD.
    EXXON MOBIL CORPORATION
    REZEL CATALYSTS CORPORATION
    KUWAIT CATALYST COMPANY
    KNT GROUP
    UNICAT CATALYST TECHNOLOGIES, LLC
    N. E. CHEMCAT CORPORATION
    GAZPROM
    ZEOLYST INTERNATIONAL
    NIPPON KETJEN CO., LTD.
    QINGDAO HUICHENG ENVIRONMENTAL TECHNOLOGY CO., LTD
    CHEMPACK
APPENDIX
216
  • 11.1 DISCUSSION GUIDE
  • 11.2 KNOWLEDGESTORE: MARKETSANDMARKETS’ SUBSCRIPTION PORTAL
  • 11.3 RELATED REPORTS
  • 11.4 AUTHOR DETAILS
LIST OF TABLES
 
  • TABLE 1 ENVIRONMENTAL REGULATIONS FOR STANDARDS ON FUEL QUALITY AND EMISSIONS
  • TABLE 2 WORLD PROVEN CRUDE OIL RESERVES, BY COUNTRY (MILLION BARREL)
  • TABLE 3 PERCENTAGE OF ELECTRIC VEHICLE SALES, BY COUNTRY, 2019–2023
  • TABLE 4 REFINERY CATALYSTS MARKET: PORTER’S FIVE FORCES ANALYSIS
  • TABLE 5 INFLUENCE OF STAKEHOLDERS ON BUYING PROCESS
  • TABLE 6 KEY BUYING CRITERIA FOR TOP 3 TYPES OF REFINERY CATALYSTS
  • TABLE 7 REFINERY CATALYSTS MARKET: ROLE IN ECOSYSTEM
  • TABLE 8 REFINERY CATALYSTS MARKET: KEY CONFERENCES AND EVENTS, 2024–2025
  • TABLE 9 LIST OF REGULATORY BODIES, GOVERNMENT AGENCIES, AND OTHER ORGANIZATIONS
  • TABLE 10 PROJECTED REAL GDP GROWTH (ANNUAL PERCENT CHANGE) OF KEY COUNTRIES, 2019–2023
  • TABLE 11 PROJECTED REAL GDP GROWTH (ANNUAL PERCENT CHANGE) OF KEY COUNTRIES, 2024–2029
  • TABLE 12 CRUDE OIL PRODUCTION, BY COUNTRY, 2019–2023 (1,000 B/D)
  • TABLE 13 WORLD REFINERY CAPACITY, BY COUNTRY, 2019–2023 (1,000 B/D)
  • TABLE 14 LIST OF PATENTS BY SAUDI ARABIAN OIL COMPANY
  • TABLE 15 LIST OF PATENTS BY UNITED LABORATORIES INTERNATIONAL
  • TABLE 16 LIST OF PATENTS BY CHINA PETROLEUM & CHEM CORP.
  • TABLE 17 LIST OF PATENTS BY SABIC GLOBAL TECHNOLOGIES
  • TABLE 18 LIST OF PATENTS BY CHEVRON PHILIPS CHEMICAL COMPANY LP
  • TABLE 19 TOP 10 PATENT OWNERS IN LAST 10 YEARS
  • TABLE 20 REFINERY CATALYSTS MARKET, BY TYPE, 2020–2023 (USD MILLION)
  • TABLE 21 REFINERY CATALYSTS MARKET, BY TYPE, 2024–2029 (USD MILLION)
  • TABLE 22 REFINERY CATALYSTS MARKET, BY TYPE, 2020–2023 (KILOTON)
  • TABLE 23 REFINERY CATALYSTS MARKET, BY TYPE, 2024–2029 (KILOTON)
  • TABLE 24 REFINERY CATALYSTS MARKET, BY INGREDIENT, 2020–2023 (USD MILLION)
  • TABLE 25 REFINERY CATALYSTS MARKET, BY INGREDIENT, 2024–2029 (USD MILLION)
  • TABLE 26 REFINERY CATALYSTS MARKET, BY INGREDIENT, 2020–2023 (KILOTON)
  • TABLE 27 REFINERY CATALYSTS MARKET, BY INGREDIENT, 2024–2029 (KILOTON)
  • TABLE 28 REFINERY CATALYSTS MARKET, BY REGION, 2020–2023 (USD MILLION)
  • TABLE 29 REFINERY CATALYSTS MARKET, BY REGION, 2024–2029 (USD MILLION)
  • TABLE 30 REFINERY CATALYSTS MARKET, BY REGION, 2020–2023 (KILOTON)
  • TABLE 31 REFINERY CATALYSTS MARKET, BY REGION, 2024–2029 (KILOTON)
  • TABLE 32 NORTH AMERICA: REFINERY CATALYSTS MARKET, BY COUNTRY, 2020–2023 (USD MILLION)
  • TABLE 33 NORTH AMERICA: REFINERY CATALYSTS MARKET, BY COUNTRY, 2024–2029 (USD MILLION)
  • TABLE 34 NORTH AMERICA: REFINERY CATALYSTS MARKET, BY COUNTRY, 2020–2023 (KILOTON)
  • TABLE 35 NORTH AMERICA: REFINERY CATALYSTS MARKET, BY COUNTRY, 2024–2029 (KILOTON)
  • TABLE 36 NORTH AMERICA: REFINERY CATALYSTS MARKET, BY INGREDIENT, 2020–2023 (USD MILLION)
  • TABLE 37 NORTH AMERICA: REFINERY CATALYSTS MARKET, BY INGREDIENT, 2024–2029 (USD MILLION)
  • TABLE 38 NORTH AMERICA: REFINERY CATALYSTS MARKET, BY INGREDIENT, 2020–2023 (KILOTON)
  • TABLE 39 NORTH AMERICA: REFINERY CATALYSTS MARKET, BY INGREDIENT, 2024–2029 (KILOTON)
  • TABLE 40 NORTH AMERICA: REFINERY CATALYSTS MARKET, BY TYPE, 2020–2023 (USD MILLION)
  • TABLE 41 NORTH AMERICA: REFINERY CATALYSTS MARKET, BY TYPE, 2024–2029 (USD MILLION)
  • TABLE 42 NORTH AMERICA: REFINERY CATALYSTS MARKET, BY TYPE, 2020–2023 (KILOTON)
  • TABLE 43 NORTH AMERICA: REFINERY CATALYSTS MARKET, BY TYPE, 2024–2029 (KILOTON)
  • TABLE 44 US: REFINERY CATALYSTS MARKET, BY TYPE, 2020–2023 (USD MILLION)
  • TABLE 45 US: REFINERY CATALYSTS MARKET, BY TYPE, 2024–2029 (USD MILLION)
  • TABLE 46 US: REFINERY CATALYSTS MARKET, BY TYPE, 2020–2023 (KILOTON)
  • TABLE 47 US: REFINERY CATALYSTS MARKET, BY TYPE, 2024–2029 (KILOTON)
  • TABLE 48 CANADA: REFINERY CATALYSTS MARKET, BY TYPE, 2020–2023 (USD MILLION)
  • TABLE 49 CANADA: REFINERY CATALYSTS MARKET, BY TYPE, 2024–2029 (USD MILLION)
  • TABLE 50 CANADA: REFINERY CATALYSTS MARKET, BY TYPE, 2020–2023 (KILOTON)
  • TABLE 51 CANADA: REFINERY CATALYSTS MARKET, BY TYPE, 2024–2029 (KILOTON)
  • TABLE 52 MEXICO: REFINERY CATALYSTS MARKET, BY TYPE, 2020–2023 (USD MILLION)
  • TABLE 53 MEXICO: REFINERY CATALYSTS MARKET, BY TYPE, 2024–2029 (USD MILLION)
  • TABLE 54 MEXICO: REFINERY CATALYSTS MARKET, BY TYPE, 2020–2023 (KILOTON)
  • TABLE 55 MEXICO: REFINERY CATALYSTS MARKET, BY TYPE, 2024–2029 (KILOTON)
  • TABLE 56 ASIA PACIFIC: REFINERY CATALYSTS MARKET, BY COUNTRY, 2020–2023 (USD MILLION)
  • TABLE 57 ASIA PACIFIC: REFINERY CATALYSTS MARKET, BY COUNTRY, 2024–2029 (USD MILLION)
  • TABLE 58 ASIA PACIFIC: REFINERY CATALYSTS MARKET, BY COUNTRY, 2020–2023 (KILOTON)
  • TABLE 59 ASIA PACIFIC: REFINERY CATALYSTS MARKET, BY COUNTRY, 2024–2029 (KILOTON)
  • TABLE 60 ASIA PACIFIC: REFINERY CATALYSTS MARKET, BY INGREDIENT, 2020–2023 (USD MILLION)
  • TABLE 61 ASIA PACIFIC: REFINERY CATALYSTS MARKET, BY INGREDIENT, 2024–2029 (USD MILLION)
  • TABLE 62 ASIA PACIFIC: REFINERY CATALYSTS MARKET, BY INGREDIENT, 2020–2023 (KILOTON)
  • TABLE 63 ASIA PACIFIC: REFINERY CATALYSTS MARKET, BY INGREDIENT, 2024–2029 (KILOTON)
  • TABLE 64 ASIA PACIFIC: REFINERY CATALYSTS MARKET, BY TYPE, 2020–2023 (USD MILLION)
  • TABLE 65 ASIA PACIFIC: REFINERY CATALYSTS MARKET, BY TYPE, 2024–2029 (USD MILLION)
  • TABLE 66 ASIA PACIFIC: REFINERY CATALYSTS MARKET, BY TYPE, 2020–2023 (KILOTON)
  • TABLE 67 ASIA PACIFIC: REFINERY CATALYSTS MARKET, BY TYPE, 2024–2029 (KILOTON)
  • TABLE 68 CHINA: REFINERY CATALYSTS MARKET, BY TYPE, 2020–2023 (USD MILLION)
  • TABLE 69 CHINA: REFINERY CATALYSTS MARKET, BY TYPE, 2024–2029 (USD MILLION)
  • TABLE 70 CHINA: REFINERY CATALYSTS MARKET, BY TYPE, 2020–2023 (KILOTON)
  • TABLE 71 CHINA: REFINERY CATALYSTS MARKET, BY TYPE, 2024–2029 (KILOTON)
  • TABLE 72 JAPAN: REFINERY CATALYSTS MARKET, BY TYPE, 2020–2023 (USD MILLION)
  • TABLE 73 JAPAN: REFINERY CATALYSTS MARKET, BY TYPE, 2024–2029 (USD MILLION)
  • TABLE 74 JAPAN: REFINERY CATALYSTS MARKET, BY TYPE, 2020–2023 (KILOTON)
  • TABLE 75 JAPAN: REFINERY CATALYSTS MARKET, BY TYPE, 2024–2029 (KILOTON)
  • TABLE 76 INDIA: REFINERY CATALYSTS MARKET, BY TYPE, 2020–2023 (USD MILLION)
  • TABLE 77 INDIA: REFINERY CATALYSTS MARKET, BY TYPE, 2024–2029 (USD MILLION)
  • TABLE 78 INDIA: REFINERY CATALYSTS MARKET, BY TYPE, 2020–2023 (KILOTON)
  • TABLE 79 INDIA: REFINERY CATALYSTS MARKET, BY TYPE, 2024–2029 (KILOTON)
  • TABLE 80 SOUTH KOREA: REFINERY CATALYSTS MARKET, BY TYPE, 2020–2023 (USD MILLION)
  • TABLE 81 SOUTH KOREA: REFINERY CATALYSTS MARKET, BY TYPE, 2024–2029 (USD MILLION)
  • TABLE 82 SOUTH KOREA: REFINERY CATALYSTS MARKET, BY TYPE, 2020–2023 (KILOTON)
  • TABLE 83 SOUTH KOREA: REFINERY CATALYSTS MARKET, BY TYPE, 2024–2029 (KILOTON)
  • TABLE 84 REST OF ASIA PACIFIC: REFINERY CATALYSTS MARKET, BY TYPE, 2020–2023 (USD MILLION)
  • TABLE 85 REST OF ASIA PACIFIC: REFINERY CATALYSTS MARKET, BY TYPE, 2024–2029 (USD MILLION)
  • TABLE 86 REST OF ASIA PACIFIC: REFINERY CATALYSTS MARKET, BY TYPE, 2020–2023 (KILOTON)
  • TABLE 87 REST OF ASIA PACIFIC: REFINERY CATALYSTS MARKET, BY TYPE, 2024–2029 (KILOTON)
  • TABLE 88 EUROPE: REFINERY CATALYSTS MARKET, BY COUNTRY, 2020–2023 (USD MILLION)
  • TABLE 89 EUROPE: REFINERY CATALYSTS MARKET, BY COUNTRY, 2024–2029 (USD MILLION)
  • TABLE 90 EUROPE: REFINERY CATALYSTS MARKET, BY COUNTRY, 2020–2023 (KILOTON)
  • TABLE 91 EUROPE: REFINERY CATALYSTS MARKET, BY COUNTRY, 2024–2029 (KILOTON)
  • TABLE 92 EUROPE: REFINERY CATALYSTS MARKET, BY INGREDIENT, 2020–2023 (USD MILLION)
  • TABLE 93 EUROPE: REFINERY CATALYSTS MARKET, BY INGREDIENT, 2024–2029 (USD MILLION)
  • TABLE 94 EUROPE: REFINERY CATALYSTS MARKET, BY INGREDIENT, 2020–2023 (KILOTON)
  • TABLE 95 EUROPE: REFINERY CATALYSTS MARKET, BY INGREDIENT, 2024–2029 (KILOTON)
  • TABLE 96 EUROPE: REFINERY CATALYSTS MARKET, BY TYPE, 2020–2023 (USD MILLION)
  • TABLE 97 EUROPE: REFINERY CATALYSTS MARKET, BY TYPE, 2024–2029 (USD MILLION)
  • TABLE 98 EUROPE: REFINERY CATALYSTS MARKET, BY TYPE, 2020–2023 (KILOTON)
  • TABLE 99 EUROPE: REFINERY CATALYSTS MARKET, BY TYPE, 2024–2029 (KILOTON)
  • TABLE 100 RUSSIA: REFINERY CATALYSTS MARKET, BY TYPE, 2020–2023 (USD MILLION)
  • TABLE 101 RUSSIA: REFINERY CATALYSTS MARKET, BY TYPE, 2024–2029 (USD MILLION)
  • TABLE 102 RUSSIA: REFINERY CATALYSTS MARKET, BY TYPE, 2020–2023 (KILOTON)
  • TABLE 103 RUSSIA: REFINERY CATALYSTS MARKET, BY TYPE, 2024–2029 (KILOTON)
  • TABLE 104 GERMANY: REFINERY CATALYSTS MARKET, BY TYPE, 2020–2023 (USD MILLION)
  • TABLE 105 GERMANY: REFINERY CATALYSTS MARKET, BY TYPE, 2024–2029 (USD MILLION)
  • TABLE 106 GERMANY: REFINERY CATALYSTS MARKET, BY TYPE, 2020–2023 (KILOTON)
  • TABLE 107 GERMANY: REFINERY CATALYSTS MARKET, BY TYPE, 2024–2029 (KILOTON)
  • TABLE 108 FRANCE: REFINERY CATALYSTS MARKET, BY TYPE, 2020–2023 (USD MILLION)
  • TABLE 109 FRANCE: REFINERY CATALYSTS MARKET, BY TYPE, 2024–2029 (USD MILLION)
  • TABLE 110 FRANCE: REFINERY CATALYSTS MARKET, BY TYPE, 2020–2023 (KILOTON)
  • TABLE 111 FRANCE: REFINERY CATALYSTS MARKET, BY TYPE, 2024–2029 (KILOTON)
  • TABLE 112 UK: REFINERY CATALYSTS MARKET, BY TYPE, 2020–2023 (USD MILLION)
  • TABLE 113 UK: REFINERY CATALYSTS MARKET, BY TYPE, 2024–2029 (USD MILLION)
  • TABLE 114 UK: REFINERY CATALYSTS MARKET, BY TYPE, 2020–2023 (KILOTON)
  • TABLE 115 UK: REFINERY CATALYSTS MARKET, BY TYPE, 2024–2029 (KILOTON)
  • TABLE 116 ITALY: REFINERY CATALYSTS MARKET, BY TYPE, 2020–2023 (USD MILLION)
  • TABLE 117 ITALY: REFINERY CATALYSTS MARKET, BY TYPE, 2024–2029 (USD MILLION)
  • TABLE 118 ITALY: REFINERY CATALYSTS MARKET, BY TYPE, 2020–2023 (KILOTON)
  • TABLE 119 ITALY: REFINERY CATALYSTS MARKET, BY TYPE, 2024–2029 (KILOTON)
  • TABLE 120 SPAIN: REFINERY CATALYSTS MARKET, BY TYPE, 2020–2023 (USD MILLION)
  • TABLE 121 SPAIN: REFINERY CATALYSTS MARKET, BY TYPE, 2024–2029 (USD MILLION)
  • TABLE 122 SPAIN: REFINERY CATALYSTS MARKET, BY TYPE, 2020–2023 (KILOTON)
  • TABLE 123 SPAIN: REFINERY CATALYSTS MARKET, BY TYPE, 2024–2029 (KILOTON)
  • TABLE 124 REST OF EUROPE: REFINERY CATALYSTS MARKET, BY TYPE, 2020–2023 (USD MILLION)
  • TABLE 125 REST OF EUROPE: REFINERY CATALYSTS MARKET, BY TYPE, 2024–2029 (USD MILLION)
  • TABLE 126 REST OF EUROPE: REFINERY CATALYSTS MARKET, BY TYPE, 2020–2023 (KILOTON)
  • TABLE 127 REST OF EUROPE: REFINERY CATALYSTS MARKET, BY TYPE, 2024–2029 (KILOTON)
  • TABLE 128 MIDDLE EAST & AFRICA: REFINERY CATALYSTS MARKET, BY COUNTRY, 2020–2023 (USD MILLION)
  • TABLE 129 MIDDLE EAST & AFRICA: REFINERY CATALYSTS MARKET, BY COUNTRY, 2024–2029 (USD MILLION)
  • TABLE 130 MIDDLE EAST & AFRICA: REFINERY CATALYSTS MARKET, BY COUNTRY, 2020–2023 (KILOTON)
  • TABLE 131 MIDDLE EAST & AFRICA: REFINERY CATALYSTS MARKET, BY COUNTRY, 2024–2029 (KILOTON)
  • TABLE 132 MIDDLE EAST & AFRICA: REFINERY CATALYSTS MARKET, BY INGREDIENT, 2020–2023 (USD MILLION)
  • TABLE 133 MIDDLE EAST & AFRICA: REFINERY CATALYSTS MARKET, BY INGREDIENT, 2024–2029 (USD MILLION)
  • TABLE 134 MIDDLE EAST & AFRICA: REFINERY CATALYSTS MARKET, BY INGREDIENT, 2020–2023 (KILOTON)
  • TABLE 135 MIDDLE EAST & AFRICA: REFINERY CATALYSTS MARKET, BY INGREDIENT, 2024–2029 (KILOTON)
  • TABLE 136 MIDDLE EAST & AFRICA: REFINERY CATALYSTS MARKET, BY TYPE, 2020–2023 (USD MILLION)
  • TABLE 137 MIDDLE EAST & AFRICA: REFINERY CATALYSTS MARKET, BY TYPE, 2024–2029 (USD MILLION)
  • TABLE 138 MIDDLE EAST & AFRICA: REFINERY CATALYSTS MARKET, BY TYPE, 2020–2023 (KILOTON)
  • TABLE 139 MIDDLE EAST & AFRICA: REFINERY CATALYSTS MARKET, BY TYPE, 2024–2029 (KILOTON)
  • TABLE 140 SAUDI ARABIA: REFINERY CATALYSTS MARKET, BY TYPE, 2020–2023 (USD MILLION)
  • TABLE 141 SAUDI ARABIA: REFINERY CATALYSTS MARKET, BY TYPE, 2024–2029 (USD MILLION)
  • TABLE 142 SAUDI ARABIA: REFINERY CATALYSTS MARKET, BY TYPE, 2020–2023 (KILOTON)
  • TABLE 143 SAUDI ARABIA: REFINERY CATALYSTS MARKET, BY TYPE, 2024–2029 (KILOTON)
  • TABLE 144 REST OF GCC COUNTRIES: REFINERY CATALYSTS MARKET, BY TYPE, 2020–2023 (USD MILLION)
  • TABLE 145 REST OF GCC COUNTRIES: REFINERY CATALYSTS MARKET, BY TYPE, 2024–2029 (USD MILLION)
  • TABLE 146 REST OF GCC COUNTRIES: REFINERY CATALYSTS MARKET, BY TYPE, 2020–2023 (KILOTON)
  • TABLE 147 REST OF GCC COUNTRIES: REFINERY CATALYSTS MARKET, BY TYPE, 2024–2029 (KILOTON)
  • TABLE 148 SOUTH AFRICA: REFINERY CATALYSTS MARKET, BY TYPE, 2020–2023 (USD MILLION)
  • TABLE 149 SOUTH AFRICA: REFINERY CATALYSTS MARKET, BY TYPE, 2024–2029 (USD MILLION)
  • TABLE 150 SOUTH AFRICA: REFINERY CATALYSTS MARKET, BY TYPE, 2020–2023 (KILOTON)
  • TABLE 151 SOUTH AFRICA: REFINERY CATALYSTS MARKET, BY TYPE, 2024–2029 (KILOTON)
  • TABLE 152 REST OF MIDDLE EAST & AFRICA: REFINERY CATALYSTS MARKET, BY TYPE, 2020–2023 (USD MILLION)
  • TABLE 153 REST OF MIDDLE EAST & AFRICA: REFINERY CATALYSTS MARKET, BY TYPE, 2024–2029 (USD MILLION)
  • TABLE 154 REST OF MIDDLE EAST & AFRICA: REFINERY CATALYSTS MARKET, BY TYPE, 2020–2023 (KILOTON)
  • TABLE 155 REST OF MIDDLE EAST & AFRICA: REFINERY CATALYSTS MARKET, BY TYPE, 2024–2029 (KILOTON)
  • TABLE 156 SOUTH AMERICA: REFINERY CATALYSTS MARKET, BY COUNTRY, 2020–2023 (USD MILLION)
  • TABLE 157 SOUTH AMERICA: REFINERY CATALYSTS MARKET, BY COUNTRY, 2024–2029 (USD MILLION)
  • TABLE 158 SOUTH AMERICA: REFINERY CATALYSTS MARKET, BY COUNTRY, 2020–2023 (KILOTON)
  • TABLE 159 SOUTH AMERICA: REFINERY CATALYSTS MARKET, BY COUNTRY, 2024–2029 (KILOTON)
  • TABLE 160 SOUTH AMERICA: REFINERY CATALYSTS MARKET, BY INGREDIENT, 2020–2023 (USD MILLION)
  • TABLE 161 SOUTH AMERICA: REFINERY CATALYSTS MARKET, BY INGREDIENT, 2024–2029 (USD MILLION)
  • TABLE 162 SOUTH AMERICA: REFINERY CATALYSTS MARKET, BY INGREDIENT, 2020–2023 (KILOTON)
  • TABLE 163 SOUTH AMERICA: REFINERY CATALYSTS MARKET, BY INGREDIENT, 2024–2029 (KILOTON)
  • TABLE 164 SOUTH AMERICA: REFINERY CATALYSTS MARKET, BY TYPE, 2020–2023 (USD MILLION)
  • TABLE 165 SOUTH AMERICA: REFINERY CATALYSTS MARKET, BY TYPE, 2024–2029 (USD MILLION)
  • TABLE 166 SOUTH AMERICA: REFINERY CATALYSTS MARKET, BY TYPE, 2020–2023 (KILOTON)
  • TABLE 167 SOUTH AMERICA: REFINERY CATALYSTS MARKET, BY TYPE, 2024–2029 (KILOTON)
  • TABLE 168 BRAZIL: REFINERY CATALYSTS MARKET, BY TYPE, 2020–2023 (USD MILLION)
  • TABLE 169 BRAZIL: REFINERY CATALYSTS MARKET, BY TYPE, 2024–2029 (USD MILLION)
  • TABLE 170 BRAZIL: REFINERY CATALYSTS MARKET, BY TYPE, 2020–2023 (KILOTON)
  • TABLE 171 BRAZIL: REFINERY CATALYSTS MARKET, BY TYPE, 2024–2029 (KILOTON)
  • TABLE 172 ARGENTINA: REFINERY CATALYSTS MARKET, BY TYPE, 2020–2023 (USD MILLION)
  • TABLE 173 ARGENTINA: REFINERY CATALYSTS MARKET, BY TYPE, 2024–2029 (USD MILLION)
  • TABLE 174 ARGENTINA: REFINERY CATALYSTS MARKET, BY TYPE, 2020–2023 (KILOTON)
  • TABLE 175 ARGENTINA: REFINERY CATALYSTS MARKET, BY TYPE, 2024–2029 (KILOTON)
  • TABLE 176 REST OF SOUTH AMERICA: REFINERY CATALYSTS MARKET, BY TYPE, 2020–2023 (USD MILLION)
  • TABLE 177 REST OF SOUTH AMERICA: REFINERY CATALYSTS MARKET, BY TYPE, 2024–2029 (USD MILLION)
  • TABLE 178 REST OF SOUTH AMERICA: REFINERY CATALYSTS MARKET, BY TYPE, 2020–2023 (KILOTON)
  • TABLE 179 REST OF SOUTH AMERICA: REFINERY CATALYSTS MARKET, BY TYPE, 2024–2029 (KILOTON)
  • TABLE 180 MARKET SHARE ANALYSIS OF KEY COMPANIES, 2023
  • TABLE 181 REFINERY CATALYSTS MARKET: COMPANY FOOTPRINT
  • TABLE 182 REFINERY CATALYSTS MARKET: TYPE FOOTPRINT
  • TABLE 183 REFINERY CATALYSTS MARKET: INGREDIENT FOOTPRINT
  • TABLE 184 REFINERY CATALYSTS MARKET: REGION FOOTPRINT
  • TABLE 185 REFINERY CATALYSTS MARKET: LIST OF KEY STARTUPS/SMES
  • TABLE 186 REFINERY CATALYSTS MARKET: COMPETITIVE BENCHMARKING OF STARTUPS/SMES
  • TABLE 187 REFINERY CATALYSTS MARKET: PRODUCT LAUNCHES, JANUARY 2019–JULY 2024
  • TABLE 188 REFINERY CATALYSTS MARKET: EXPANSIONS, JANUARY 2019–JULY 2024
  • TABLE 189 REFINERY CATALYSTS MARKET: OTHER DEVELOPMENTS, JANUARY 2019–JULY 2024
  • TABLE 190 ALBEMARLE CORPORATION: COMPANY OVERVIEW
  • TABLE 191 ALBEMARLE CORPORATION: PRODUCTS/SOLUTIONS/SERVICES OFFERED
  • TABLE 192 ALBEMARLE CORPORATION: EXPANSIONS, JANUARY 2019–JULY 2024
  • TABLE 193 W.R. GRACE & CO.: COMPANY OVERVIEW
  • TABLE 194 W. R. GRACE & CO.: PRODUCTS/SOLUTIONS/SERVICES OFFERED
  • TABLE 195 W.R. GRACE & CO.: PRODUCT LAUNCHES, JANUARY 2019-JUNE 2024
  • TABLE 196 BASF SE: COMPANY OVERVIEW
  • TABLE 197 BASF SE: PRODUCTS/SOLUTIONS/SERVICES OFFERED
  • TABLE 198 TOPSOE: COMPANY OVERVIEW
  • TABLE 199 TOPSOE: PRODUCTS/SOLUTIONS/SERVICES OFFERED
  • TABLE 200 TOPSOE: EXPANSIONS, JANUARY 2019–JULY 2024
  • TABLE 201 HONEYWELL UOP: COMPANY OVERVIEW
  • TABLE 202 HONEYWELL UOP: PRODUCTS/SOLUTIONS/SERVICES OFFERED
  • TABLE 203 AXENS: COMPANY OVERVIEW
  • TABLE 204 AXENS: PRODUCTS/SOLUTIONS/SERVICES OFFERED
  • TABLE 205 AXENS: PRODUCT LAUNCHES, JANUARY 2019–JULY 2024
  • TABLE 206 CLARIANT: COMPANY OVERVIEW
  • TABLE 207 CLARIANT: PRODUCTS/SOLUTIONS/SERVICES OFFERED
  • TABLE 208 CLARIANT: OTHER DEVELOPMENTS, JANUARY 2019–JULY 2024
  • TABLE 209 JOHNSON MATTHEY: COMPANY OVERVIEW
  • TABLE 210 JOHNSON MATTHEY: PRODUCTS/SOLUTIONS/SERVICES OFFERED
  • TABLE 211 SHELL CATALYSTS & TECHNOLOGIES: COMPANY OVERVIEW
  • TABLE 212 SHELL CATALYSTS & TECHNOLOGIES: PRODUCTS/SOLUTIONS/SERVICES OFFERED
  • TABLE 213 CHINA PETROLEUM & CHEMICAL CORPORATION (SINOPEC): COMPANY OVERVIEW
  • TABLE 214 CHINA PETROLEUM & CHEMICAL CORPORATION (SINOPEC): PRODUCTS/SOLUTIONS/SERVICES OFFERED
  • TABLE 215 ARKEMA: COMPANY OVERVIEW
  • TABLE 216 ARKEMA: PRODUCTS/SOLUTIONS/SERVICES OFFERED
  • TABLE 217 JGC CATALYSTS AND CHEMICALS LTD.: COMPANY OVERVIEW
  • TABLE 218 CHEVRON CORPORATION: COMPANY OVERVIEW
  • TABLE 219 ANTENCHEM: COMPANY OVERVIEW
  • TABLE 220 DORF KETAL CHEMICALS (I) PVT. LTD.: COMPANY OVERVIEW
  • TABLE 221 EXXON MOBIL CORPORATION: COMPANY OVERVIEW
  • TABLE 222 REZEL CATALYSTS CORPORATION: COMPANY OVERVIEW
  • TABLE 223 KUWAIT CATALYST COMPANY: COMPANY OVERVIEW
  • TABLE 224 KNT GROUP: COMPANY OVERVIEW
  • TABLE 225 UNICAT CATALYST TECHNOLOGIES, LLC: COMPANY OVERVIEW
  • TABLE 226 N. E. CHEMCAT CORPORATION: COMPANY OVERVIEW
  • TABLE 227 GAZPROM: COMPANY OVERVIEW
  • TABLE 228 ZEOLYST INTERNATIONAL: COMPANY OVERVIEW
  • TABLE 229 NIPPON KETJEN CO., LTD.: COMPANY OVERVIEW
  • TABLE 230 QINGDAO HUICHENG ENVIRONMENTAL TECHNOLOGY CO., LTD: COMPANY OVERVIEW
  • TABLE 231 CHEMPACK: COMPANY OVERVIEW
LIST OF FIGURES
 
  • FIGURE 1 REFINERY CATALYSTS MARKET: RESEARCH DESIGN
  • FIGURE 2 REFINERY CATALYSTS MARKET: TOP-DOWN APPROACH
  • FIGURE 3 MARKET SIZE ESTIMATION: REFINERY CATALYSTS MARKET – FCC CATALYSTS APPROACH
  • FIGURE 4 DEMAND-SIDE FORECAST PROJECTIONS
  • FIGURE 5 REFINERY CATALYSTS MARKET: DATA TRIANGULATION
  • FIGURE 6 METALS TO DOMINATE MARKET DURING FORECAST PERIOD
  • FIGURE 7 FCC CATALYSTS ACCOUNTED FOR LARGEST MARKET SHARE IN 2023
  • FIGURE 8 ASIA PACIFIC TO REGISTER HIGHEST GROWTH DURING FORECAST PERIOD
  • FIGURE 9 GROWING DEMAND FROM AUTOMOTIVE SECTOR IN EMERGING ECONOMIES TO DRIVE MARKET
  • FIGURE 10 ZEOLITES TO DOMINATE MARKET DURING FORECAST PERIOD
  • FIGURE 11 HYDROCRACKING CATALYSTS TO REGISTER HIGHEST GROWTH DURING FORECAST PERIOD
  • FIGURE 12 INDIA TO REGISTER HIGHEST CAGR IN REFINERY CATALYSTS MARKET FROM 2024 TO 2029
  • FIGURE 13 REFINERY CATALYSTS MARKET: DRIVERS, RESTRAINTS, OPPORTUNITIES, AND CHALLENGES
  • FIGURE 14 REFINERY CATALYSTS MARKET: PORTER’S FIVE FORCES ANALYSIS
  • FIGURE 15 INFLUENCE OF STAKEHOLDERS ON BUYING PROCESS FOR TOP 3 TYPES OF REFINERY CATALYSTS
  • FIGURE 16 SUPPLIER SELECTION CRITERIA
  • FIGURE 17 REFINERY CATALYSTS MARKET: VALUE CHAIN ANALYSIS
  • FIGURE 18 REFINERY CATALYSTS MARKET: ECOSYSTEM
  • FIGURE 19 IMPORT DATA FOR HS CODE 381511, BY COUNTRY, 2019–2023 (USD THOUSAND)
  • FIGURE 20 EXPORT DATA FOR HS CODE 381511, BY COUNTRY, 2019–2023 (USD THOUSAND)
  • FIGURE 21 IMPORT DATA FOR HS CODE 381512, BY COUNTRY, 2019–2023 (USD THOUSAND)
  • FIGURE 22 EXPORT DATA FOR HS CODE 381512, BY COUNTRY, 2019–2023 (USD THOUSAND)
  • FIGURE 23 IMPORT DATA FOR HS CODE 381519, BY COUNTRY, 2019–2023 (USD THOUSAND)
  • FIGURE 24 EXPORT DATA FOR HS CODE 381519, BY COUNTRY, 2019–2023 (USD THOUSAND)
  • FIGURE 25 INVESTMENT AND FUNDING SCENARIO, 2021–2023 (USD MILLION)
  • FIGURE 26 TRENDS/DISRUPTIONS IMPACTING CUSTOMER BUSINESS
  • FIGURE 27 PATENTS REGISTERED (2013–2023)
  • FIGURE 28 NO. OF PATENTS IN LAST 10 YEARS
  • FIGURE 29 LEGAL STATUS OF PATENTS, 2023
  • FIGURE 30 TOP JURISDICTIONS
  • FIGURE 31 ANALYSIS OF TOP APPLICANTS
  • FIGURE 32 AVERAGE SELLING PRICE, BY REGION (USD/KG)
  • FIGURE 33 AVERAGE SELLING PRICE, BY INGREDIENT (USD/KG)
  • FIGURE 34 AVERAGE SELLING PRICE, BY TYPE (USD/KG)
  • FIGURE 35 HYDROCRACKING CATALYSTS SEGMENT TO REGISTER HIGHEST GROWTH DURING FORECAST PERIOD
  • FIGURE 36 METALS TO DOMINATE MARKET DURING FORECAST PERIOD
  • FIGURE 37 ASIA PACIFIC COUNTRIES TO REGISTER HIGHER GROWTH DURING FORECAST PERIOD
  • FIGURE 38 NORTH AMERICA: REFINERY CATALYSTS MARKET SNAPSHOT
  • FIGURE 39 ASIA PACIFIC: REFINERY CATALYSTS MARKET SNAPSHOT
  • FIGURE 40 EUROPE: REFINERY CATALYSTS MARKET SNAPSHOT
  • FIGURE 41 OVERVIEW OF STRATEGIES ADOPTED BY KEY PLAYERS IN REFINERY CATALYSTS MARKET BETWEEN JANUARY 2019 AND JULY 2024
  • FIGURE 42 REFINERY CATALYSTS MARKET: REVENUE ANALYSIS OF KEY PLAYERS, 2021–2023 (USD MILLION)
  • FIGURE 43 REFINERY CATALYSTS MARKET SHARE ANALYSIS, 2023
  • FIGURE 44 COMPANY VALUATION OF LEADING COMPANIES IN REFINERY CATALYSTS MARKET, 2023 (USD BILLION)
  • FIGURE 45 FINANCIAL METRICS OF LEADING COMPANIES IN REFINERY CATALYSTS MARKET, 2023
  • FIGURE 46 REFINERY CATALYSTS MARKET: BRAND/PRODUCT COMPARISON
  • FIGURE 47 REFINERY CATALYSTS MARKET: COMPANY EVALUATION MATRIX (KEY PLAYERS), 2023
  • FIGURE 48 REFINERY CATALYSTS MARKET: COMPANY EVALUATION MATRIX (STARTUPS/SMES), 2023
  • FIGURE 49 ALBEMARLE CORPORATION: COMPANY SNAPSHOT
  • FIGURE 50 BASF SE: COMPANY SNAPSHOT
  • FIGURE 51 TOPSOE: COMPANY SNAPSHOT
  • FIGURE 52 HONEYWELL UOP: COMPANY SNAPSHOT
  • FIGURE 53 CLARIANT: COMPANY SNAPSHOT
  • FIGURE 54 JOHNSON MATTHEY: COMPANY SNAPSHOT
  • FIGURE 55 SHELL CATALYSTS & TECHNOLOGIES: COMPANY SNAPSHOT
  • FIGURE 56 CHINA PETROLEUM & CHEMICAL CORPORATION (SINOPEC): COMPANY SNAPSHOT
  • FIGURE 57 ARKEMA: COMPANY SNAPSHOT

The study involved four major activities in estimating the market size of the refinery catalyst market. Exhaustive secondary research was done to collect information on the market, the peer market, and the grandparent market. The next step was to validate these findings, assumptions, and sizing with industry experts across the value chain through primary research. Both top-down and bottom-up approaches were employed to estimate the complete market size. Thereafter, the market breakdown and data triangulation procedures were used to estimate the market size of the segments and subsegments.

Secondary Research

In the secondary research process, various secondary sources have been referred to for identifying and collecting information for this study. These secondary sources include annual reports, press releases, investor presentations of companies, white papers, certified publications, trade directories, articles from recognized authors, gold standard and silver standard websites, and databases. Secondary research has been used to obtain key information about the value chain of the industry, monetary chain of the market, the total pool of key players, market classification and segmentation according to industry trends to the bottom-most level, and regional markets. It was also used to obtain information about the key developments from a market-oriented perspective.

Primary Research

The refinery catalyst market comprises several stakeholders in the value chain, which include manufacturers, and end users. Various primary sources from the supply and demand sides of the refinery catalyst market have been interviewed to obtain qualitative and quantitative information. The primary interviewees from the demand side include key opinion leaders in industrial sectors. The primary sources from the supply side include manufacturers, associations, and institutions involved in the refinery catalyst industry. Primary interviews were conducted to gather insights such as market statistics, data of revenue collected from the products and services, market breakdowns, market size estimations, market forecasting, and data triangulation. Primary research also helped in understanding the various trends related to type, ingredient, and region. Stakeholders from the demand side, such as CIOs, CTOs, and CSOs were interviewed to understand the buyer’s perspective on the suppliers, products, component providers, and their current usage of refinery catalyst and outlook of their business, which will affect the overall market.

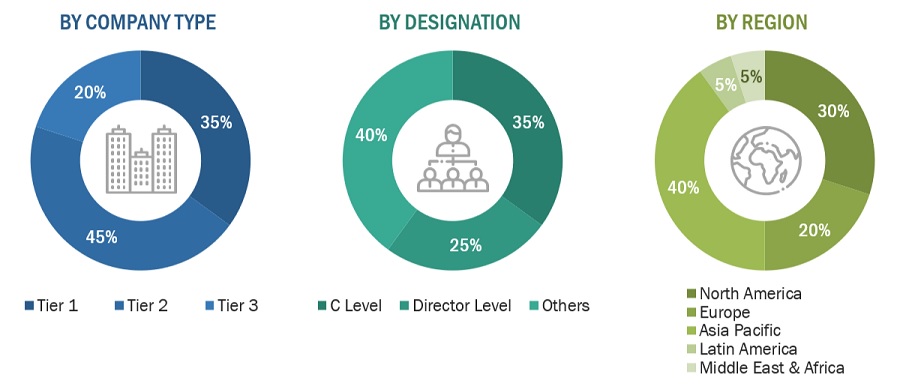
The breakdown of profiles of the primary interviewees is illustrated in the figure below:
Refinery Catalyst Market Size, and Share

Note: Tier 1, Tier 2, and Tier 3 companies are classified based on their market revenue in 2022 available in the public domain, product portfolios, and geographical presence.

Other designations include consultants and sales, marketing, and procurement managers.

To know about the assumptions considered for the study, download the pdf brochure

Market Size Estimation

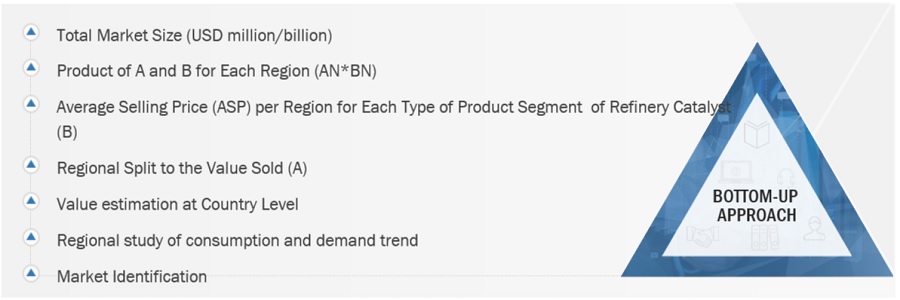
The top-down and bottom-up approaches have been used to estimate and validate the size of the refinery catalyst market.

  • The key players in the industry have been identified through extensive secondary research.
  • The supply chain of the industry has been determined through primary and secondary research.
  • All percentage shares, splits, and breakdowns have been determined using secondary sources and verified through primary sources.
  • All possible parameters that affect the markets covered in this research study have been accounted for, viewed in extensive detail, verified through primary research, and analyzed to obtain the final quantitative and qualitative data.
  • The research includes the study of reports, reviews, and newsletters of the key market players, along with extensive interviews for opinions with leaders such as directors and marketing executives.

TOP - DOWN Approach-
Refinery Catalyst Market Size, and Share

To know about the assumptions considered for the study, Request for Free Sample Report

BOTTOM - UP Approach-

Refinery Catalyst Market Size, and Share

Data Triangulation

After arriving at the total market size from the estimation process, the overall market has been split into several segments and sub-segments. To complete the overall market engineering process and arrive at the exact statistics for all the segments and sub-segments, the data triangulation and market breakdown procedures have been employed, wherever applicable. The data has been triangulated by studying various factors and trends from both the demand and supply sides. Along with this, the market size has been validated by using both the top-down and bottom-up approaches and primary interviews. Hence, for every data segment, there have been three sources—top-down approach, bottom-up approach, and expert interviews. The data was assumed correct when the values arrived from the three sources matched.

Market Definition

Refinery catalysts are substances used in various refining processes for increasing the efficiency, quality and environmental performance of petroleum products. These catalysts speed up the chemical reactions to increase the efficiency and quickness of oil refining. Thus, ensuring higher productivity and lower energy consumption. Different refining processes like cracking, reforming and hydrotreating are performed with the use of these catalysts for getting desired results, along with reducing emissions & pollutants. Increasing number of environment regulations also ensures the use of refinery catalysts in refining processes. Advanced materials and methodologies are being developed to increase the durability, activity, and selectivity of refinery catalysts.

Key Stakeholders

  • Senior Management
  • End User
  • Finance/Procurement Department
  • R&D Department
  • Manufacturers
  • Raw Material Suppliers

Report Objectives

  • To define, describe, and forecast the size of the refinery catalyst market, in terms of value and volume.
  • To provide detailed information regarding the major factors (drivers, opportunities, restraints, and challenges) influencing the growth of the market
  • To estimate and forecast the market size based on type, ingredient, and region.
  • To forecast the size of the market with respect to major regions, namely, Europe, North America, Asia Pacific, Middle East & Africa, and South America, along with their key countries
  • To strategically analyze micro-markets with respect to individual growth trends, prospects, and their contribution to the overall market
  • To analyze opportunities in the market for stakeholders and provide a competitive landscape of market leaders.
  • To track and analyze recent developments such as expansions, new product launches, partnerships & agreements, and acquisitions in the market.
  • To strategically profile key market players and comprehensively analyze their core competencies.

Available Customizations

Along with the given market data, MarketsandMarkets offers customizations according to the company’s specific needs. The following customization options are available for the report:

Regional Analysis

  • Further breakdown of a region with respect to a particular country or additional application

Company Information

  • Detailed analysis and profiles of additional market players

Tariff & Regulations

  • Regulations and Impact on Refinery catalyst Market
Custom Market Research Services

We will customize the research for you, in case the report listed above does not meet with your exact requirements. Our custom research will comprehensively cover the business information you require to help you arrive at strategic and profitable business decisions.

Request Customization
Report Code
CH 2913
Published ON
Aug, 2024
Choose License Type
BUY NOW
  • SHARE
X
Request Customization
Speak to Analyst
Speak to Analyst
OR FACE-TO-FACE MEETING
PERSONALIZE THIS RESEARCH
  • Triangulate with your Own Data
  • Get Data as per your Format and Definition
  • Gain a Deeper Dive on a Specific Application, Geography, Customer or Competitor
  • Any level of Personalization
REQUEST A FREE CUSTOMIZATION
LET US HELP YOU!
  • What are the Known and Unknown Adjacencies Impacting the Refinery Catalysts Market
  • What will your New Revenue Sources be?
  • Who will be your Top Customer; what will make them switch?
  • Defend your Market Share or Win Competitors
  • Get a Scorecard for Target Partners
CUSTOMIZED WORKSHOP REQUEST
knowledgestore logo

Want to explore hidden markets that can drive new revenue in Refinery Catalysts Market?

Find Hidden Markets
  • Call Us
  • +1-888-600-6441 (Corporate office hours)
  • +1-888-600-6441 (US/Can toll free)
  • +44-800-368-9399 (UK office hours)
CONNECT WITH US
ABOUT TRUST ONLINE
©2024 MarketsandMarkets Research Private Ltd. All rights reserved
DMCA.com Protection Status
Website Feedback