Synthetic Zeolites Market by Type of Zeolite (Zeolite A, Type X, Type Y, USY, ZSM-5), Application (Detergent Builder, Drying, Separation, & Adsorption, Catalytic Cracking, & Specialties), Function (Ion-Exchange, Molecular Sieve, & Catalyst) & Region � Global Forecast to 2023


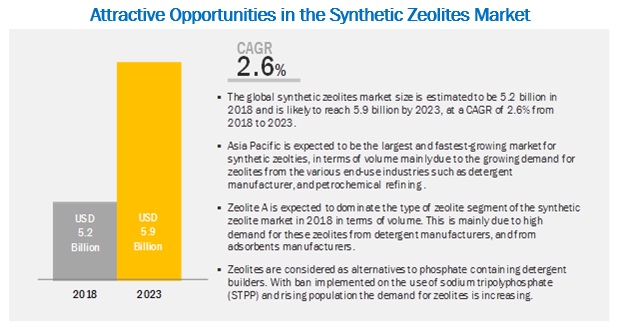
[175 Pages Report] The synthetic zeolites market is projected to grow from USD 5.2 billion in 2018 to USD 5.9 billion by 2023 at a Compound Annual Growth Rate (CAGR) of 2.6% during the forecast period. The growth of the synthetic zeolites market can be attributed to the increased consumption of detergents due to the growing population and demand for zeolites for use in specialty applications.
Based on type of zeolite, Type X is expected to grow at the highest CAGR during the forecast period
Type X zeolites belong to the Faujasite family of zeolites and are used as sorbents and catalysts. The silica-to-alumina ratio of type X zeolites is between 1�1.5. 13X is a commercially used type X zeolite which has the largest pore size of 10A. It has a Faujasite framework and is used in gas drying applications. However, 13X with sodium as a cation has a pore size of 8A. It is an alumina zeolite and has a wide range of industrial applications such as gas adsorption and separation, besides being used as a catalyst.
The rising population and stringent environmental norms have increased the demand for zeolite A globally
Several commercial detergents contain synthetic zeolites, which help in increasing their washing efficiency. Detergents containing synthetic zeolites have high adsorption capacity for liquid components, especially surfactants. Synthetic zeolites are used to manufacture compact and super compact detergents. After the ban by the European Union (EU) on the use of Sodium Tripolyphosphate (STPP) in detergents to control the increasing level of soluble phosphorus in municipal wastewater, Zeolite A was considered an ideal substitute to STPP and witnessed a substantial increase in demand.
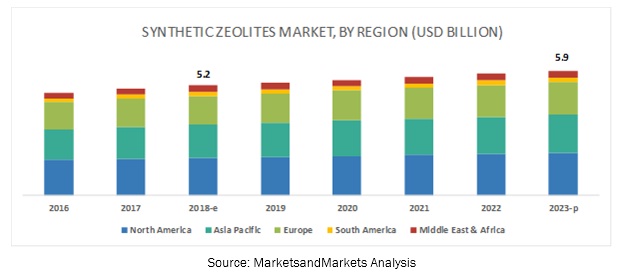
Asia Pacific is expected to grow at the highest CAGR in the synthetic zeolites market during the forecast period
Asia Pacific is expected to record the highest growth rate during the forecast period, due to the presence of leading economies, such as China, and India, in the region. The Chinese oil market is controlled by four national oil companies�China National Petroleum Corporation (CNPC), China Petroleum and Chemical Corporation (Sinopec), China National Offshore Oil Corporation (CNOOC), and China National Chemicals Import and Export Corporation (Sinochem). Over the past few years, China�s oil consumption has increased rapidly. India has emerged as one of the key markets for synthetic zeolites in the Asia Pacific region. The market in India is driven by the growing population, economic growth, increasing industrialization, and infrastructure development. With the country witnessing remarkable growth in the agriculture, architectural materials, automotive, aerospace, aviation, chemicals, and water filtration sectors, the demand for adsorbents is also growing in the country.
Key Market Players
Major companies in the synthetic zeolites market include Albemarle Corporation (US), BASF SE (Germany), Honeywell International, Inc (US), Clariant AG (Switzerland), W.R. Grace & Co. (US), TOSOH Corporation (Japan), Union Showa KK, (Japan), Zeochem AG (Switzerland), KNT Group (Russia), Arkema SA (France), Zeolyst International (US), Huiying Chemical Industry (China), Chemiewerk Bad Kostritz GMBH (Germany), National Aluminium Company Limited (India) and PQ Corporation (US) are some of the leading players operating in the synthetic zeolites market. These players have adopted expansions, investments, acquisitions, partnerships, agreements, and joint ventures as the major strategies to consolidate their position in the market. The synthetic zeolites market is a matured market and is hence witnessing slow growth. Expansions, agreements, and new product launches have been the most dominant strategies adopted by major players between 2013 and 2018.
Key Questions addressed by the report
- How is the ban on the use of STPP impacting the growth of the synthetic zeolites market?
- How is the increased demand for catalysts from the refining industry impacting the synthetic zeolites market?
- How are expansions helping the growth of the synthetic zeolites market?
- Who are the leading players in the synthetic zeolites market?
- How can specialty zeolites unlock new opportunities for growth in the synthetic zeolites market?
To speak to our analyst for a discussion on the above findings, click Speak to Analyst
 Exclusive indicates content/data unique to MarketsandMarkets and not available with any competitors.
Table of Contents
1 Introduction (Page No. - 18)
1.1 Objectives of the Study
1.2 Market Definition
1.3 Market Scope
1.3.1 Years Considered for the Study
1.4 Currency
1.5 Stakeholders
1.6 Limitations
2 Research Methodology (Page No. - 21)
2.1 Research Data
2.1.1 Secondary Data
2.1.1.1 Key Data From Secondary Sources
2.1.2 Primary Data
2.1.2.1 Key Data From Primary Sources
2.1.2.2 Key Industry Insights
2.1.2.3 Breakdown of Primary Interviews
2.2 Market Size Estimation
2.3 Data Triangulation
2.4 Assumptions
3 Executive Summary (Page No. - 29)
4 Premium Insights (Page No. - 33)
4.1 Attractive Opportunities in the Synthetic Zeolites Market
4.2 Synthetic Zeolites Market, By Type of Zeolite
4.3 Synthetic Zeolites Market, By Application
4.4 Synthetic Zeolites Market, By Region
5 Market Overview (Page No. - 36)
5.1 Introduction
5.2 Market Dynamics
5.2.1 Drivers
5.2.1.1 Rising Demand for Synthetic Zeolites From the Detergent Industry
5.2.1.2 Increasing Number of End-Use Industries for Synthetic Zeolites
5.2.1.3 Significant Usage of Synthetic Zeolites for Catalytic Cracking in the Petroleum Industry
5.2.2 Restraints
5.2.2.1 High Selectivity Leads to Lower Exploitation of Synthetic Zeolites for Various Applications
5.2.3 Opportunities
5.2.3.1 Rising Demand for Adsorbents
5.2.3.2 Recovering Oil Prices
5.2.4 Challenges
5.2.4.1 Toxic Nature of Synthetic Zeolites
5.3 Porter�s Five Forces Analysis
5.3.1 Threat of New Entrants
5.3.2 Threat of Substitutes
5.3.3 Bargaining Power of Suppliers
5.3.4 Bargaining Power of Buyers
5.3.5 Intensity of Competitive Rivalry
5.4 Economic Indicators
5.4.1 Industry Outlook
5.4.1.1 Oil & Gas
5.4.2 Industry Outlook - Petrochemicals
6 Synthetic Zeolites Market, By Framework (Page No. - 44)
6.1 Introduction
6.2 Linde Type A
6.3 Faujasite
6.4 MFI
7 Synthetic Zeolites Market, By Pore Size (Page No. - 46)
7.1 Introduction
7.2 3A-7A
7.3 7A-10A
8 Synthetic Zeolites Market, By Function (Page No. - 47)
8.1 Introduction
8.2 Ion-Exchange
8.3 Molecular Sieve
8.4 Catalyst
9 Synthetic Zeolites Market, By Application (Page No. - 50)
9.1 Introduction
9.2 Detergent Builder
9.3 Drying, Separation, and Adsorption
9.4 Catalytic Cracking
9.5 Specialties
10 Synthetic Zeolites Market, By Type of Zeolite (Page No. - 60)
10.1 Introduction
10.2 Zeolite A
10.3 Type X
10.4 Type Y
10.5 Ultra-Stable Y (USY)
10.6 Zsm-5
11 Synthetic Zeolites Market, By Region (Page No. - 73)
11.1 Introduction
11.2 Asia Pacific
11.2.1 China
11.2.2 India
11.2.3 Japan
11.2.4 South Korea
11.2.5 Rest of Asia Pacific
11.3 North America
11.3.1 US
11.3.2 Canada
11.3.3 Mexico
11.4 Europe
11.4.1 Germany
11.4.2 UK
11.4.3 Italy
11.4.4 France
11.4.5 Spain
11.4.6 Rest of Europe
11.5 Middle East & Africa
11.5.1 Saudi Arabia
11.5.2 Iran
11.5.3 UAE
11.5.4 Rest of Middle East & Africa
11.6 South America
11.6.1 Brazil
11.6.2 Argentina
11.6.3 Rest of South America
12 Competitive Landscape (Page No. - 128)
12.1 Overview
12.2 Market Ranking of Key Players
12.3 Competitive Scenario
12.3.1 Expansions
12.3.2 Acquisitions
12.3.3 Joint Ventures
12.3.4 Agreements
12.3.5 Partnerships
12.3.6 New Technology Launch
12.3.7 New Product Launches
12.3.8 Divestitures
12.3.9 Research & Development
12.3.10 Collaborations
13 Company Profiles (Page No. - 137)
(Business Overview, Products Offered, Recent Developments, SWOT Analysis, MnM View)*
13.1 Albemarle Corporation
13.2 BASF SE
13.3 Honeywell International Inc
13.4 Clariant AG
13.5 W. R. Grace & Co.
13.6 Tosoh Corporation
13.7 Union Showa K.K.
13.8 Zeochem AG
13.9 Knt Group
13.10 Arkema S.A
13.11 Zeolyst International
13.12 Huiying Chemical Industry (Quanzhou) Co., Ltd.
13.13 Chemiewerk Bad K�stritz Gmbh
13.14 National Aluminum Company Limited (NALCO)
13.15 PQ Corporation
*Details on Business Overview, Products Offered, Recent Developments, SWOT Analysis, MnM View Might Not Be Captured in Case of Unlisted Companies.
13.16 Other Key Players
13.16.1 Ningbo Jiahe New Materials Technology Co., Ltd
13.16.2 Sorbead India
13.16.3 Dalian Haixin Chemical Industrial Co., Ltd
13.16.4 Gujarat Credo Mineral Industries Ltd
13.16.5 Gujarat Multi Gas Base Chemicals Pvt. Ltd
13.16.6 Iqe Group
13.16.7 Rive Technology
13.16.8 Eurecat Services Inc
13.16.9 Fujian Anten Chemical Co., Ltd
13.16.10 Manek Minerals
14 Appendix (Page No. - 169)
14.1 Discussion Guide
14.2 Knowledge Store: Marketsandmarkets� Subscription Portal
14.3 Available Customizations
14.4 Related Reports
14.5 Author Details
List of Tables (152 Tables)
Table 1 Synthetic Zeolites Market Snapshot
Table 2 Crude Oil Trade Flow, By Region (Million Barrels Per Day)
Table 3 Synthetic Zeolites Market, By Function, 2016�2023 (USD Million)
Table 4 Synthetic Zeolites Market, By Function, 2016�2023 (Kilotons)
Table 5 Synthetic Zeolites Market, By Application, 2016�2023 (USD Million)
Table 6 Synthetic Zeolites Market, By Application, 2016�2023 (Kilotons)
Table 7 Synthetic Zeolites Market in Detergent Builder, By Region, 2016�2023 (USD Million)
Table 8 Synthetic Zeolites Market in Detergent Builder, By Region, 2016�2023 (Kilotons)
Table 9 Synthetic Zeolites Market in Drying, Separation, Adsorption, By Region, 2016�2023 (USD Million)
Table 10 Synthetic Zeolites Market in Drying, Separation, Adsorption, By Region, 2016�2023 (Kilotons)
Table 11 Synthetic Zeolites Market in Catalytic Cracking, By Region, 2016�2023 (USD Million)
Table 12 Synthetic Zeolites Market in Catalytic Cracking Application, By Region, 2016�2023 (Kilotons)
Table 13 Synthetic Zeolites Market in Specialties, By Region, 2016�2023 (USD Million)
Table 14 Synthetic Zeolites Market in Specialties, By Region, 2016�2023 (Kilotons)
Table 15 Synthetic Zeolites Market, By Type of Zeolite, 2016�2023 (USD Million)
Table 16 Synthetic Zeolites Market, By Type of Zeolite, 2016�2023 (Kilotons)
Table 17 Zeolite A Market, By Region, 2016�2023 (USD Million)
Table 18 Zeolite A Market, By Region, 2016�2023 (Kilotons)
Table 19 Type X Zeolites Market, By Region, 2016�2023 (USD Million)
Table 20 Type X Zeolites Market, By Region, 2016�2023 (Kilotons)
Table 21 Type Y Zeolites Market, By Region, 2016�2023 (USD Million)
Table 22 Type Y Zeolites Market, By Region, 2016�2023 (Kilotons)
Table 23 Ultra-Stable Y (USY) Zeolites Market, By Region, 2016�2023 (USD Million)
Table 24 Ultra-Stable Y (USY) Zeolites Market, By Region, 2016�2023 (Kilotons)
Table 25 Zsm-5 Zeolites Market, By Region, 2016�2023 (USD Million)
Table 26 Zsm-5 Zeolites Market, By Region, 2016�2023 (Kilotons)
Table 27 Synthetic Zeolites Market, By Region, 2016�2023 (USD Million)
Table 28 Synthetic Zeolites Market, By Region, 2016�2023 (Kilotons)
Table 29 Asia Pacific By Market, By Country, 2016�2023 (USD Million)
Table 30 Asia Pacific By Market, By Country, 2016�2023 (Kilotons)
Table 31 Asia Pacific By Market, By Type of Zeolite, 2016�2023 (USD Million)
Table 32 Asia Pacific By Market, By Type of Zeolite, 2016�2023 (Kilotons)
Table 33 Asia Pacific By Market, By Application, 2016�2023 (USD Million)
Table 34 Asia Pacific By Market, By Application, 2016�2023 (Kilotons)
Table 35 China By Market, By Type of Zeolite, 2016�2023 (USD Million)
Table 36 China By Market, By Type of Zeolite, 2016�2023 (USD Kilotons)
Table 37 China By Market, By Application, 2016�2023 (USD Million)
Table 38 China By Market, By Application, 2016�2023 (Kilotons)
Table 39 India By Market, By Type of Zeolite, 2016�2023 (USD Million)
Table 40 India By Market, By Type of Zeolite, 2016�2023 (Kilotons)
Table 41 India By Market, By Application, 2016�2023 (USD Million)
Table 42 India By Market, By Application, 2016�2023 (Kilotons)
Table 43 Japan By Market, By Type of Zeolite, 2016�2023 (USD Million)
Table 44 Japan By Market, By Type of Zeolite, 2016�2023 (Kilotons)
Table 45 Japan By Market, By Application, 2016�2023 (USD Million)
Table 46 Japan By Market, By Application, 2016�2023 (Kilotons)
Table 47 South Korea By Market, By Type of Zeolite, 2016�2023 (USD Million)
Table 48 South Korea By Market, By Type of Zeolite, 2016�2023 (Kilotons)
Table 49 South Korea By Market, By Application, 2016�2023 (USD Million)
Table 50 South Korea By Market, By Application, 2016�2023 (Kilotons)
Table 51 Rest of Asia Pacific By Market, By Type of Zeolite, 2016�2023 (USD Million)
Table 52 Rest of Asia Pacific By Market, By Type of Zeolite, 2016�2023 (Kilotons)
Table 53 Rest of Asia Pacific By Market, By Application, 2016�2023 (USD Million)
Table 54 Rest of Asia Pacific By Market, By Application, 2016�2023 (Kilotons)
Table 55 North America By Market, By Country, 2016�2023 (USD Million)
Table 56 North America By Market, By Country, 2016�2023 (Kilotons)
Table 57 North America By Market, By Application, 2016�2023 (USD Million)
Table 58 North America By Market, By Application, 2016�2023 (Kilotons)
Table 59 North America By Market, By Type of Zeolite, 2016�2023 (USD Million)
Table 60 North America By Market, By Type of Zeolite, 2016�2023 (Kiloton)
Table 61 US By Market, By Application, 2016�2023 (USD Million)
Table 62 US By Market, By Application, 2016�2023 (Kilotons)
Table 63 US By Market, By Type of Zeolite, 2016�2023 (USD Million)
Table 64 US By Market, By Type of Zeolite, 2016�2023 (Kiloton)
Table 65 Canada By Market, By Application, 2016�2023 (USD Million)
Table 66 Canada By Market, By Application, 2016�2023 (Kilotons)
Table 67 Canada By Market, By Type of Zeolite, 2016�2023 (USD Million)
Table 68 Canada By Market, By Type of Zeolite, 2016�2023 (Kilotons)
Table 69 Mexico By Market, By Application, 2016�2023 (USD Million)
Table 70 Mexico By Market, By Application, 2016�2023 (Kilotons)
Table 71 Mexico By Market, By Type of Zeolite, 2016�2023 (USD Million)
Table 72 Mexico By Market, By Type of Zeolite, 2016�2023 (Kilotons)
Table 73 Europe By Market, By Country, 2016�2023 (USD Million)
Table 74 Europe By Market, By Country, 2016�2023 (Kilotons)
Table 75 Europe By Market, By Application, 2016�2023 (USD Million)
Table 76 Europe By Market, By Application, 2016�2023 (Kilotons)
Table 77 Europe By Market, By Type of Zeolite, 2016�2023 (USD Million)
Table 78 Europe By Market, By Type of Zeolite, 2016�2023 (Kiloton)
Table 79 Germany By Market, By Application, 2016�2023 (USD Million)
Table 80 Germany By Market, By Application, 2016�2023 (Kilotons)
Table 81 Germany By Market, By Type of Zeolite, 2016�2023 (USD Million)
Table 82 Germany By Market, By Type of Zeolite, 2016�2023 (Kiloton)
Table 83 UK By Market, By Application, 2016�2023 (USD Million)
Table 84 UK By Market, By Application, 2016�2023 (Kilotons)
Table 85 UK By Market, By Type of Zeolite, 2016�2023 (USD Million)
Table 86 UK By Market, By Type of Zeolite, 2016�2023 (Kiloton)
Table 87 Italy By Market, By Application, 2016�2023 (USD Million)
Table 88 Italy By Market, By Application, 2016�2023 (Kilotons)
Table 89 Italy By Market, By Type of Zeolite, 2016�2023 (USD Million)
Table 90 Italy By Market, By Type of Zeolite, 2016�2023 (Kiloton)
Table 91 France By Market, By Application, 2016�2023 (USD Million)
Table 92 France By Market, By Application, 2016�2023 (Kilotons)
Table 93 France By Market, By Type of Zeolite, 2016�2023 (USD Million)
Table 94 France By Market, By Type of Zeolite, 2016�2023 (Kiloton)
Table 95 Spain By Market, By Application, 2016�2023 (USD Million)
Table 96 Spain By Market, By Application, 2016�2023 (Kilotons)
Table 97 Spain By Market, By Type of Zeolite, 2016�2023 (USD Million)
Table 98 Spain By Market, By Type of Zeolite, 2016�2023 (Kiloton)
Table 99 Rest of Europe By Market, By Application, 2016�2023 (USD Million)
Table 100 Rest of Europe By Market, By Application, 2016�2023 (Kilotons)
Table 101 Rest of Europe By Market, By Type of Zeolite, 2016�2023 (USD Million)
Table 102 Rest of Europe By Market, By Type of Zeolite, 2016�2023 (Kiloton)
Table 103 Middle East & Africa By Market, Country, 2016�2023 (USD Million)
Table 104 Middle East & Africa By Market, By Country, 2016�2023 (Kilotons)
Table 105 Middle East & Africa By Market, By Application, 2016�2023 (USD Million)
Table 106 Middle East & Africa By Market, By Application, 2016�2023 (Kilotons)
Table 107 Middle East & Africa By Market, By Type of Zeolite, 2016�2023 (USD Million)
Table 108 Middle East & Africa By Market, By Type of Zeolite, 2016�2023 (Kilotons)
Table 109 Saudi Arabia By Market, By Application, 2016�2023 (USD Million)
Table 110 Saudi Arabia By Market, By Application, 2016�2023 (Kilotons)
Table 111 Saudi Arabia By Market, By Type of Zeolite, 2016�2023 (USD Million)
Table 112 Saudi Arabia By Market, By Type of Zeolite, 2016�2023 (Kilotons)
Table 113 Iran By Market, By Application, 2016�2023 (USD Million)
Table 114 Iran By Market, By Application, 2016�2023 (Kilotons)
Table 115 Iran By Market, By Type of Zeolite, 2016�2023 (USD Million)
Table 116 Iran By Market, By Type of Zeolite, 2016�2023 (Kilotons)
Table 117 UAE By Market, By Application, 2016�2023 (USD Million)
Table 118 UAE By Market, By Application, 2016�2023 (Kilotons)
Table 119 UAE By Market, By Type of Zeolite, 2016�2023 (USD Million)
Table 120 UAE By Market, By Type of Zeolite, 2016�2023 (Kilotons)
Table 121 Rest of Middle East & Africa By Market, By Application, 2016�2023 (USD Million)
Table 122 Rest of Middle East & Africa By Market, By Application, 2016�2023 (Kilotons)
Table 123 Rest of Middle East & Africa By Market, By Type of Zeolite, 2016�2023 (USD Million)
Table 124 Rest of Middle East & Africa By Market, By Type of Zeolite, 2016�2023 (Kilotons)
Table 125 South America By Market, By Country, 2016�2023 (USD Million)
Table 126 South America By Market, By Country, 2016�2023 (Kilotons)
Table 127 South America By Market, By Application, 2016�2023 (USD Million)
Table 128 South America By Market, By Application, 2016�2023 (Kilotons)
Table 129 South America By Market, By Type of Zeolite, 2016�2023 (USD Million)
Table 130 South America By Market, By Type of Zeolite, 2016�2023 (Kilotons)
Table 131 Brazil By Market, By Application, 2016�2023 (USD Million)
Table 132 Brazil By Market, By Application, 2016�2023 (Kilotons)
Table 133 Brazil By Market, By Type of Zeolite, 2016�2023 (USD Million)
Table 134 Brazil By Market, By Type of Zeolite, 2016�2023 (Kiloton)
Table 135 Argentina By Market, By Application, 2016�2023 (USD Million)
Table 136 Argentina By Market, By Application, 2016�2023 (Kilotons)
Table 137 Argentina By Market, By Type of Zeolite, 2016�2023 (USD Million)
Table 138 Argentina By Market, By Type of Zeolite, 2016�2023 (Kiloton)
Table 139 Rest of South America By Market, By Application, 2016�2023 (USD Million)
Table 140 Rest of South America By Market, By Application, 2016�2023 (Kilotons)
Table 141 Rest of South America By Market, By Type of Zeolite, 2016�2023 (USD Million)
Table 142 Rest of South America By Market, By Type of Zeolite, 2016�2023 (Kiloton)
Table 143 Expansions, 2014�2018
Table 144 Acquisitions, 2014�2018
Table 145 Joint Ventures, 2014�2018
Table 146 Agreements, 2014�2018
Table 147 Partnerships, 2014�2018
Table 148 New Technology Launch, 2014�2018
Table 149 New Product Launches, 2014�2018
Table 150 Divestures, 2014�2018
Table 151 Research & Development, 2014�2018
Table 152 Collaborations, 2014�2018
List of Figures (51 Fidures)
Figure 1 Synthetic Zeolites Market: Research Design
Figure 2 Bottom-Up Approach
Figure 3 Top-Down Approach
Figure 4 Synthetic Zeolites Market: Data Triangulation
Figure 5 Based on Type, the Ultra-Stable Y Segment is Expected to Be the Largest Segment of the Synthetic Zeolites Market Between 2018 and 2023
Figure 6 Based on Application, the Catalytic Cracking Segment is Expected to Lead the Synthetic Zeolites Market Between 2018 & 2023
Figure 7 Based on Function, the Catalyst Segment is Expected to Lead the Synthetic Zeolites Market Between 2018 & 2023
Figure 8 North America is Estimated to Be the Largest Market for Synthetic Zeolites in 2018
Figure 9 Rising Demand for Synthetic Zeolites From the Detergent Industry is Expected to Drive the Synthetic Zeolites Market
Figure 10 Zeolite A Segment is Expected to Lead Zeolite Market During the Forecast Period
Figure 11 Detergent Builder Segment is Expected to Lead the Synthetic Zeolites Market During the Forecast Period
Figure 12 Synthetic Zeolites Market in Asia Pacific is Expected to Grow at the Highest Cagr During the Forecast Period
Figure 13 Drivers, Restraints, Opportunities, and Challenges for the Synthetic Zeolites Market
Figure 14 Porter�s Five Forces Analysis
Figure 15 Catalyst Segment to Lead Synthetic Zeolites Market From 2018 to 2023
Figure 16 Catalytic Cracking Expected to Be the Largest Application SegmentIn the Synthetic Zeolites Market
Figure 17 Asia Pacific Expected to Lead the Detergent Builder Application
Figure 18 Asia Pacific is Expected to Be the Largest Market for Detergent Builder Application
Figure 19 North America Expected to Lead the Drying, Separation, and Adsorption Segment in the Synthetic Zeolites Market
Figure 20 Asia Pacific Expected to Lead the Drying, Separation, and Adsorption Segment in the Synthetic Zeolites Market
Figure 21 North America Expected to Be the Largest Consumer of Synthetic Zeolites in for the Catalytic Cracking Segment
Figure 22 North America Expected to Be the Largest Market for Catalytic Cracking Segment
Figure 23 North America Expected to Lead the Specialties Segment
Figure 24 Asia Pacific Expected to Be the Largest Consumer of Synthetic Zeolites for the Specialties Segment
Figure 25 Ultra-Stable Y (USY) Expected to Be the Largest Type Segment in Terms of Market Value During the Forecast Period
Figure 26 Zeolite A Expected to Be the Most Consumed Type of Synthetic Zeolite During the Forecast Period
Figure 27 Asia Pacific Expected to Hold the Largest Share of the ZeoliteA Market in 2018
Figure 28 Asia Pacific Expected to Be the Largest Zeolite A Consumer Throughout the Forecast Period
Figure 29 Asia Pacific Expected to Lead the Type X Segment of the Synthetic Zeolites Market in Terms of Value Throughout the Forecast Period
Figure 30 Asia Pacific Expected to Lead the Type X Segment of the Synthetic Zeolites Market in Terms of Volume
Figure 31 North America Expected to Lead the Type Y Segment of the Synthetic Zeolites Market in Terms of Value
Figure 32 North America is Expected to Be the Largest Market for Type Y Zeolites Market in Terms of Volume in 2018
Figure 33 North America Expected to Lead the Ultra-Stable Y (USY) Type Segment of the Synthetic Zeolites Market in Terms of Value
Figure 34 North America is Expected to Be the Largest Market for Ultra-Stable Y (USY) Type Segment in Terms of Volume in 2018
Figure 35 North America Expected to Lead the Zsm-5 Type Segment of the Synthetic Zeolites Market in Terms of Value
Figure 36 North America is Expected to Be the Leading Market for Zsm-5 Type Segment in Terms of Volume
Figure 37 China and India are Expected to Be Among the Fastest-Growing Markets for Synthetic Zeolites in Terms of Value During the Forecast Period74
Figure 38 Asia Pacific Synthetic Zeolites Market Snapshot
Figure 39 North America Synthetic Zeolites Market Snapshot
Figure 40 Europe Synthetic Zeolites Market Snapshot
Figure 41 Middle East & Africa Synthetic Zeolites Market Snapshot
Figure 42 South America Synthetic Zeolites Market Snapshot
Figure 43 Companies Adopted Both Organic and Inorganic Growth Strategies Between January 2014 and October 2018
Figure 44 Albemarle Corporation: Company Snapshot
Figure 45 BASF SE : Company Snapshot
Figure 46 Honeywell International Inc: Company Snapshot
Figure 47 Clariant AG: Company Snapshot
Figure 48 W. R. Grace & Co: Company Snapshot
Figure 49 Tosoh Corporation: Company Snapshot
Figure 50 Arkema S.A: Company Snapshot
Figure 51 National Aluminum Company Limited (NALCO): Company Snapshot
This research study involved four major activities in estimating the current market size for synthetic zeolites. Exhaustive secondary research was done to collect information on the market, the peer market, and the parent market. The next step was to validate these findings, assumptions, and sizing with industry experts across the value chain through primary research. Both, top-down and bottom-up approaches were employed to estimate the complete market size. Thereafter, market breakdown and data triangulation procedures were used to estimate the market size of segments and subsegments.
Secondary Research
In the secondary research process, various secondary sources such as Hoovers, Bloomberg BusinessWeek, and Dun & Bradstreet were referred to, so as to identify and collect information for this study. These secondary sources included the annual reports, press releases & investor presentations of companies, white papers, certified publications, articles by recognized authors, gold standard & silver standard websites, food safety organizations, regulatory bodies, trade directories, and databases.
Primary Research
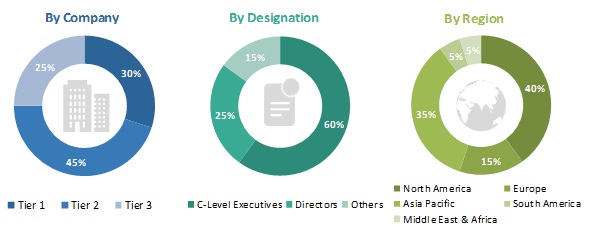
The synthetic zeolites market comprises several stakeholders, such as raw material suppliers, processors, end-product manufacturers, and regulatory organizations, in the supply chain. The demand side of this market is characterized by the growth of the detergent manufacturers, petrochemical refineries, and the growth in population. The supply side is characterized by advancements in technology and diverse application industries. Various primary sources from both, the supply and demand sides of the market were interviewed to obtain qualitative and quantitative information. Following is the breakdown of primary respondents interviewed:
To know about the assumptions considered for the study, download the pdf brochure
Market Estimation
Both, top-down and bottom-up approaches were used to estimate and validate the total size of the synthetic zeolites market. These methods were also used extensively to estimate the size of the various subsegments in the market. The research methodology used to estimate the market size includes the following:
- Key players in the industry were identified through extensive secondary research.
- The industry�s supply chain and market size, in terms of value, were determined through primary and secondary research.
- All percentage shares, splits, and breakdowns were determined using secondary sources and verified through primary sources
Data Triangulation
After arriving at the overall market size-using the market size estimation processes explained above-the market was split into several segments and subsegments. To complete the overall market engineering process and arrive at the exact statistics of each market segment and subsegment, data triangulation and market breakdown procedures were employed, wherever applicable. The data was triangulated by studying various factors and trends from both, the demand and supply sides, in the detergent, petrochemical refining, wastewater treatment, and automotive industries.
Report Objectives
- To define, describe, and forecast the synthetic zeolites market based on type of zeolite, function, application, and region
- To provide detailed information about key factors such as drivers, restraints, opportunities, and challenges influencing the growth of the market
- To strategically analyze micromarkets1 with respect to individual growth trends, prospects, and contribution to the total market
- To analyze the opportunities in the market for stakeholders and draw a competitive landscape of the market
- To forecast the market size in terms of value and volume with respect to 5 main regions, namely, Asia Pacific, North America, Europe, the Middle East & Africa, and South America, along with their key countries
- To analyze competitive developments such as expansions, investments, acquisitions, product launches, and research & development (R&D) activities in the synthetic zeolites market
- To strategically profile the key players operating in the synthetic zeolites market and comprehensively analyze their core competencies2
Micromarkets are defined as further segments and subsegments of the synthetic zeolites market included in the report.
Core competencies of companies are captured in terms of their key developments and key strategies adopted by them to sustain their position in the synthetic zeolites market.
Scope of the report:
Report Metric |
Details |
|
Market size available for years |
2016-2023 |
|
Base year considered |
2017 |
|
Forecast period |
2018-2023 |
|
Forecast units |
Value (USD), Volume (KT) |
|
Segments covered |
Type of Zeolite, Application, Function, and Region |
|
Geographies covered |
APAC, North America, Europe, Middle East & Africa, and South America |
|
Companies covered |
Albemarle Corporation (US), BASF SE (Germany), Honeywell International Inc (US), Clariant AG (Switzerland), W.R. Grace & Co. (US), TOSOH Corporation (Japan), Union Showa KK, (Japan), Zeochem AG (Switzerland), KNT Group (Russia), Arkema SA (France), Zeolyst International (US). Total 25 major players covered. |
This research report categorizes the synthetic zeolites market based on the type of zeolite, application, function, and region.
Synthetic Zeolites Market, By Type of Zeolite
- Zeolite A
- Type X
- Type Y
- Ultra-stable Y (USY)
- ZSM-5
Synthetic Zeolites Market, By Application
- Detergent Builder
- Drying, Separation, and Adsorption
- Catalytic Cracking
- Specialties
Synthetic Zeolites Market, By Function
- Ion-Exchange
- Molecular Sieve
- Catalyst
Synthetic Zeolites Market, By Region
- Asia Pacific
- North America
- Europe
- Middle East & Africa
- South America
The following customization options are available for the report
With the given market data, MarketsandMarkets offers customizations as per the specific needs of companies. The following customization options are available for the report:
- Further breakdown of the Rest of Asia Pacific, the Rest of Europe, and the Rest of Middle East & Africa in terms of Value
- Detailed analysis and profiling of additional market players (up to five)


Growth opportunities and latent adjacency in Synthetic Zeolites Market
PLS CONFIRM IF SYNTHETIC ZEOLITES ARE SUITABLE FOR HEAVY METAL REMOVAL. PARTICULARLY ARSENIC, CADMIUM, COPPER, LEAD, MERCURY
Synthetic zeolites market report and major focus on emission control
What is the market size in 2020?
Need market overview of Synthetic Zeolites for a project on Zeolite X and Mordenite.
Market information on Synthetic Zeolites market for the sorbent technology for pollution remediation.
General information on synthetic zeolites Market