Penetration Testing Market

Penetration Testing Market by Offering (Solution, Services), Type (Web Applications, Mobile Applications, Network Infrastructure, Social Engineering, Cloud), Organization Size, Deployment Mode, Vertical and Region - Global Forecast to 2029

Report Code: TC 4532 Apr, 2024, by marketsandmarkets.com

[329 Pages Report] The global penetration testing market is estimated to be worth USD 1.7 billion in 2024 and is projected to reach USD 3.9 billion by 2029 at a CAGR of 17.1% during the forecast period.

As cybercrime becomes more advanced, businesses will need cutting-edge penetration testing tools to stay ahead of evolving web,  network, and digitally inclusive threats. Stringent data privacy regulations will drive the demand for robust penetration testing solutions to meet compliance requirements. They will further fuel the need for penetration testing tools and solutions as businesses seek to protect themselves from emerging cyber risks. Cloud-based solutions offer scalability and reduced infrastructure investment, while automation streamlines workflows—specialized testing catering to industry-specific challenges, addressing evolving attack vectors and advanced security measures. The penetration testing market is expected to continue its upward trajectory, fueled by the rising complexity of cybercrime, growing regulatory pressure, and the increasing adoption of penetration testing tools and solutions in emerging regions like the Asia-Pacific. It ensures the growing importance of penetration testing, as it remains a vital component in safeguarding businesses against evolving cyber threats in the future.

Penetration Testing Market

To know about the assumptions considered for the study, Request for Free Sample Report

Penetration Testing Market Opportunities

To know about the assumptions considered for the study, download the pdf brochure

Penetration Testing Market Trends

Driver:  Identify and Secure Vulnerabilities

IT systems are bustling with interconnected devices and applications. While this connectivity fuels innovation, it also breeds complexity, making it fertile ground for vulnerabilities. Every device and application can be an entry point for attackers, expanding the attack surface. Custom integrations and legacy code further complicate matters, creating pathways for exploitation through misconfigurations. This complexity often leads to blind spots where malicious activity can go unnoticed. Penetration testing emerges as a beacon in this complexity, simulating real-world attacks to uncover vulnerabilities missed by traditional security measures. By proactively addressing these weaknesses, penetration testing bolsters overall security, mitigating risks in today's intricate IT landscapes.

Restraint: Integration complexities

Integrating penetration testing tools and procedures into security workflows poses significant challenges for organizations. This struggle can lead to inefficiencies, making sharing results and tracking remediation efforts difficult. Seamless integration with the current security infrastructure is crucial for collaboration and streamlined operations. Investing in tools and processes designed for this integration is essential. These investments ensure penetration testing fits seamlessly with established security workflows, maximizing efficiency and effectiveness. Overcoming these integration hurdles enables organizations to detect and address vulnerabilities promptly, strengthening their overall security. This proactive approach minimizes cyber threats and fosters a culture of continuous improvement in cybersecurity practices. By navigating these challenges, organizations can optimize penetration testing efforts to combat evolving risks while maintaining operational efficiency.

Opportunity: Rising trends of PTaas (Penetration Testing as a Service)

Penetration Testing as a Service (PaaS) revolutionizes cybersecurity, especially for small businesses. Historically, the high cost, limited scope, and resource constraints of one-time engagements made penetration testing inaccessible. PTaaS introduces a subscription-based model, overcoming hurdles like data security protocols and complex workflows and making advanced security testing more reachable. By spreading costs over a subscription period, PTaaS becomes affordable for smaller budgets and offers scalability to adjust testing needs. It removes the need for in-house expertise, as service providers handle recruitment and management. Continuous monitoring and streamlined reporting provide ongoing security insights, enhancing its value for smaller businesses. Overall, PTaaS democratizes penetration testing, empowering organizations of all sizes to manage cybersecurity risks proactively and strengthen defenses against evolving threats.

Challenge: Shortfall of Skilled Professionals

One of the significant challenges facing organizations is the shortage of security analysts capable of conducting penetration tests, hindering their ability to address evolving cybersecurity threats. Despite hiring individuals to identify and analyze cyber threats, many must gain the skills to prevent attacks effectively. Penetration testing, a crucial defense measure, is often costly, and improper execution can lead to financial losses for service providers and client companies. Although the demand for professionals in this field has decreased, the shortage remains significant, exposing organizations to risks. To mitigate this gap, there's a pressing need for enhanced training programs to equip security professionals with the expertise needed to identify and analyze cyber threats effectively.

Penetration Testing Market Ecosystem

As digitalization accelerates and the importance of securing IoT devices grows, the penetration testing landscape is evolving. Niche practices like physical security, IoT, and embedded device testing are gaining traction. This shift is fueled by the need to address emerging threats effectively. Consequently, demand for penetration testing solutions and services is on the rise. Key players like Rapid7(US), Synopsys(US), BreachLock(US), and Raxis(US) offer comprehensive solutions covering various application areas, including networks, web and mobile apps, social engineering, and cloud platforms. These offerings reflect the industry's commitment to enhancing cybersecurity across diverse technological domains to safeguard against evolving cyber risks.

The services segment will experience the highest growth rate during the forecast period by offering.

The services segment is poised for accelerated growth, outpacing other market components. This surge is fueled by a combination of factors, including the rising complexity of cyber threats, stringent regulatory requirements, and the growing recognition among businesses of the critical importance of cybersecurity. As organizations strive to bolster their defense mechanisms and mitigate the risks posed by cyberattacks, they are increasingly turning to specialized penetration testing services to comprehensively assess the vulnerabilities in their systems and networks. Consequently, service providers are experiencing heightened demand for their expertise in identifying, prioritizing, and remedying security weaknesses, driving significant expansion in the penetration testing services segment.

Based on organization size, the large enterprises segment accounts for the largest market size in the penetration testing market.

The penetration testing market is expected to grow across all sectors, with large enterprises expected to maintain a significant share. Factors such as stringent compliance requirements like HIPAA and PCI DSS, heightened security needs, and more excellent budgetary resources drive large organizations to invest in external penetration testing services. Although SMEs show promising growth, their limited resources and lower security awareness contribute to the continued dominance of large enterprises. However, SMEs increasingly recognize cyber threats and seek cost-effective solutions, hinting at potential growth in this segment.

The Asia Pacific region is projected to exhibit the highest growth rate in the penetration testing market.

During the forecast period, this accelerated growth is attributed to various factors, including swift digitization across industries, escalating cyber threats, and an increased focus on cybersecurity measures. The Asia Pacific region is set to lead the growth in penetration testing due to rapid digitalization, rising cyber threats, and evolving data privacy regulations—SMEs' increasing awareness of data protection and government initiatives promoting cybersecurity further fuel this growth. Despite challenges like cybersecurity awareness and skilled workforce shortages, Asia Pacific's maturing technology landscape and focus on cloud-based solutions drive exceptional market growth.

Asia Pacific Penetration Testing Market Size, and Share

Key Market Players:

The major players in the penetration testing  market are Rapid7(US), Secureworks(US), Synopsys(US), Crowdstrike(US), IBM(US), Coalfire Labs(US), Indium Software(US), Cigniti Technologies(US), Trustwave(US), Cisco Systems(US), Fortinet(US), Bugcrowd(US), Invicti(US), Hackerone(US), Raxis(US), Rsi Security(US), Rhino Security Labs(US), Sciencesoft(US), Portswigger(US), Netraguard(US), Software Secured(Canada), Vumentric Cybersecurity(Canada), Netitude(UK), Zimperium(US), Nowsecure(US), Security Metrics(US), NetSpi(US), Covertswarm(UK), Holm Security(Sweden), Intruder Systems(UK), Breachlock(US), Isecurion(India), Redbot Security(US).

Want to explore hidden markets that can drive new revenue in Penetration Testing Market?

Scope of the Report

Report Metrics

Details

Market size available for years

2019-2029

Base year considered

2023

Forecast period

2024-2029

Forecast units

Value (USD) Million/Billion

Segments Covered

By offering, type, deployment mode, organization size, type, vertical and region

Region covered

North America, Europe, Asia Pacific, Middle East and Africa, and Latin America

Companies covered

Rapid7(US), Secureworks(US), Synopsys(US), Crowdstrike(US), IBM(US), Coalfire Labs(US), Indium Software(US), Cigniti Technologies(US), Trustwave(US), Cisco Systems(US), Fortinet(US), Bugcrowd(US), Invicti(US), Hackerone(US),Raxis(US), Rsi Security(US), Rhino Security Labs(US), Sciencesoft(US), Portswigger(US), Netraguard(US), Software Secured(Canada), Vumentric Cybersecurity(Canada), Netitude(UK), Zimperium(US), Nowsecure(US), Security Metrics(US), NetSpi(US), Covertswarm(UK), Holm Security(Sweden), Intruder Systems(UK), Breachlock(US), Isecurion(India), Redbot Security(US).

This research report categorizes the penetration testing market to forecast revenues and analyze trends in each of the following submarkets:

Based on the offering:
  • Solutions
  • Services
Based on Deployment mode:
  • Cloud
  • On-premises
Based on Organization size:
  • Large enterprises
  • SMES
Based on type:
  • Web applications
  • Mobile Applications
  • Network Infrastructure
  • Cloud
  • Social Engineering
Based on the vertical:
  • BFSI
  • Healthcare
  • IT & ITeS
  • Telecommunication
  • Retail and eCommerce
  • Manufacturing
  • Education
  • Other verticals
Based on the region:
  • North America
    • US
    • Canada
  • Europe
    • UK
    • Germany
    • France
    • Rest of Europe
  • Asia Pacific
    • China
    • Japan
    • India
    • Rest of Asia Pacific
  • Middle East and Africa
    • Middle East
    • Africa
  • Latin America
    • Brazil
    • Mexico
    • Rest of Latin America

Recent Developments

  • Oct 2023 - Rapid7's recent acquisition of Penumbra Security bolsters its security offerings by integrating Penumbra's Breach and Attack Simulation (BAS) platform. This strategic move enhances Rapid7's penetration testing capabilities by amalgamating traditional vulnerability assessments with real-world attack simulations. By leveraging Penumbra's BAS platform, Rapid7 aims to provide customers with a more holistic and proactive approach to cybersecurity, enabling them to identify and address potential vulnerabilities more effectively while simulating realistic attack scenarios to fortify their defenses.
  • Sep 2023 – Tenable has unveiled a pioneering cloud-native penetration testing solution tailored for cloud environments, marking a significant advancement in cybersecurity. This innovative platform responds to the escalating need to fortify cloud infrastructure against evolving cyber threats. Tenable's solution offers organizations comprehensive protection and peace of mind by focusing on cloud-specific security challenges. With the increasing migration to cloud computing, this initiative underscores Tenable's commitment to providing cutting-edge cybersecurity solutions that effectively safeguard digital assets in today's dynamic threat landscape.
  • Aug 2023 - The International Organization for Standardization (ISO) has released the latest iteration of its Penetration Testing Standard (ISO/IEC 29119:2023), offering a structured framework for conducting penetration testing exercises. This comprehensive standard sets guidelines and best practices, promoting consistency and efficiency across the industry. Organizations can ensure thorough assessments of their security posture by providing a clear roadmap for penetration testing engagements. ISO's initiative underscores the importance of standardized approaches in enhancing cybersecurity and mitigating risks in an increasingly interconnected digital landscape.
  • Jul 2023 - The US Department of Homeland Security (DHS) has unveiled its latest Cybersecurity Strategy, highlighting the critical role of proactive measures such as penetration testing in strengthening the nation's cybersecurity posture. Emphasizing prevention over reaction, the strategy underscores the significance of identifying and addressing vulnerabilities before malicious actors can exploit them. The DHS aims to enhance resilience against cyber threats by prioritizing proactive approaches like penetration testing and safeguarding vital national infrastructure and assets from potential attacks.
  • Jun 2023 - The European Union Agency for Cybersecurity (ENISA) has issued a report focusing on penetration testing in cloud environments, shedding light on the increasing demand for methodologies explicitly tailored to cloud infrastructure. Stressing the significance of embedding security measures throughout the software development lifecycle, the report underscores the necessity for proactive approaches to address evolving cyber threats effectively. ENISA aims to promote a comprehensive security framework that safeguards cloud-based systems against potential vulnerabilities by highlighting the importance of cloud-specific penetration testing methodologies.

Frequently Asked Questions (FAQ):

To speak to our analyst for a discussion on the above findings, click Speak to Analyst

Exclusive indicates content/data unique to MarketsandMarkets and not available with any competitors.

INTRODUCTION
30
RESEARCH METHODOLOGY
36
EXECUTIVE SUMMARY
46
PREMIUM INSIGHTS
49
MARKET OVERVIEW AND INDUSTRY TRENDS
53
  • 5.1 INTRODUCTION
  • 5.2 MARKET DYNAMICS
    DRIVERS
    - Increasing need to protect digital infrastructure from cybercrimes
    - Regulations and compliances mandating stricter security measures
    - Widespread adoption of cloud computing
    - Growing complexities of IT systems
    RESTRAINTS
    - High costs of penetration testing
    - Prevalence of insider threats
    - Difficulties in integrating with existing security workflows
    OPPORTUNITIES
    - Rising adoption of cost-effective PTaaS
    - Integration of AI, ML, and other technologies in penetration testing
    - Alignment of penetration testing with DevSecOps practices
    CHALLENGES
    - Lack of skilled security professionals
    - Potential for disruption of regular operations
  • 5.3 CASE STUDIES
    RAPID7’S METASPLOIT HELPS CHANGE SECURITY MINDSET AT AUTOMATIONDIRECT
    INFOPULSE PROVIDES EFFECTIVE SECURITY TESTING SOLUTION FOR ING BANK UKRAINE
    REDTEAM SECURITY ASSISTS MALL OF AMERICA TO IDENTIFY NETWORK VULNERABILITIES
    PORTSWIGGER HELPS PAYCHEX TO AUTOMATE CUSTOMIZED ATTACKS
    ‘SSYNOPSYS PROVIDES AUTOMATED VULNERABILITY MANAGEMENT SOLUTION FOR TREND MICRO
  • 5.4 VALUE CHAIN
  • 5.5 ECOSYSTEM
  • 5.6 TECHNOLOGY ANALYSIS
    KEY TECHNOLOGIES
    - Vulnerability assessment tools
    COMPLEMENTARY TECHNOLOGIES
    - Intrusion detection systems
    - Security information and event management
    ADJACENT TECHNOLOGIES
    - Forensic tools
    - Encryption technologies
  • 5.7 PATENT ANALYSIS
  • 5.8 PRICING ANALYSIS
    PRICING MODEL FOR PENETRATION TESTING
    INDICATIVE PRICING MODELS OF VENDORS
  • 5.9 PORTER’S FIVE FORCES ANALYSIS
    THREAT OF NEW ENTRANTS
    THREAT OF SUBSTITUTES
    BARGAINING POWER OF SUPPLIERS
    BARGAINING POWER OF BUYERS
    DEGREE OF COMPETITION
  • 5.10 TRENDS AND DISRUPTIONS IMPACTING CUSTOMER BUSINESS
  • 5.11 KEY STAKEHOLDERS AND BUYING CRITERIA
    KEY STAKEHOLDERS IN BUYING PROCESS
    BUYING CRITERIA
  • 5.12 REGULATORY LANDSCAPE
    INTRODUCTION
    OPEN WEB APPLICATION SECURITY PROJECT
    ISO 27001
    GENERAL DATA PROTECTION REGULATION
    GRAMM-LEACH-BLILEY ACT
    SARBANES-OXLEY ACT
    SOC 2
    SWIFT CSP
    REGULATORY BODIES, GOVERNMENT AGENCIES, AND OTHER ORGANIZATIONS
  • 5.13 KEY CONFERENCES AND EVENTS
  • 5.14 BUSINESS MODEL ANALYSIS
    PROJECT-BASED PENETRATION TESTING
    SUBSCRIPTION-BASED PENETRATION TESTING
    CROWDSCOURCED PENETRATION TESTING
    PENETRATION TESTING AS A SERVICE (PTAAS)
    HYBRID PENETRATION TESTING MODEL
  • 5.15 INVESTMENT AND FUNDING SCENARIO
PENETRATION TESTING MARKET, BY TESTING TYPE
86
  • 6.1 INTRODUCTION
  • 6.2 RED TEAM
  • 6.3 BLUE TEAM
MARKET, BY TESTING METHOD
88
  • 7.1 INTRODUCTION
  • 7.2 BLIND TESTING
  • 7.3 TARGETED TESTING
  • 7.4 EXTERNAL TESTING
  • 7.5 INTERNAL TESTING
  • 7.6 DOUBLE-BLIND TESTING
PENETRATION TESTING MARKET, BY OFFERING
90
  • 8.1 INTRODUCTION
    DRIVERS: MARKET, BY OFFERING
  • 8.2 SOLUTIONS
    RISING NEED TO CHECK FOR NETWORK VULNERABILITIES TO DRIVE MARKET
    SOLUTIONS: MARKET DRIVERS
  • 8.3 SERVICES
    GROWING DEMAND FOR TAILORED PEN TEST SERVICES TO BOOST MARKET
    SERVICES: MARKET DRIVERS
    PROFESSIONAL SERVICES
    MANAGED SECURITY SERVICES
PENETRATION TESTING MARKET, BY DEPLOYMENT MODE
97
  • 9.1 INTRODUCTION
  • 9.2 CLOUD
    REQUIREMENT FOR SCALABLE AND FLEXIBLE SOLUTIONS TO ACCELERATE DEMAND
    CLOUD: MARKET DRIVERS
  • 9.3 ON-PREMISES
    RISING NEED TO RETAIN FULL CONTROL OVER SENSITIVE DATA TO DRIVE MARKET
    ON-PREMISES: MARKET DRIVERS
PENETRATION TESTING MARKET, BY ORGANIZATION SIZE
102
  • 10.1 INTRODUCTION
  • 10.2 SMALL AND MEDIUM-SIZED ENTERPRISES
    DEMAND FOR COST-EFFECTIVE AND ROBUST CYBERSECURITY SOLUTIONS TO BOOST MARKET
    SMALL AND MEDIUM-SIZED ENTERPRISES: MARKET DRIVERS
  • 10.3 LARGE ENTERPRISES
    NEED TO SAFEGUARD VAST AND COMPLEX DIGITAL INFRASTRUCTURES TO DRIVE DEMAND
    LARGE ENTERPRISES: MARKET DRIVERS
PENETRATION TESTING MARKET, BY TYPE
107
  • 11.1 INTRODUCTION
  • 11.2 WEB APPLICATIONS
    RISING DEMAND TO PROTECT USER-RELATED DATA TO DRIVE MARKET
    WEB APPLICATIONS: MARKET DRIVERS
  • 11.3 MOBILE APPLICATIONS
    CONCERNS REGARDING SENSITIVE DATA EXPOSURE TO FUEL DEMAND
    MOBILE APPLICATIONS:  MARKET DRIVERS
  • 11.4 NETWORK INFRASTRUCTURE
    RISING ADOPTION OF WIRELESS SOLUTIONS TO DRIVE MARKET
    NETWORK INFRASTRUCTURE: MARKET DRIVERS
  • 11.5 SOCIAL ENGINEERING
    GROWING EXPLOITATION OF PEOPLE’S VULNERABILITIES TO PUSH DEMAND
    SOCIAL ENGINEERING: MARKET DRIVERS
  • 11.6 CLOUD
    INCREASING MIGRATION TO CLOUD-BASED SERVICES TO DRIVE MARKET
    CLOUD: MARKET DRIVERS
PENETRATION TESTING MARKET, BY VERTICAL
116
  • 12.1 INTRODUCTION
  • 12.2 BFSI
    NEED TO SAFEGUARD FINANCIAL DATA AND TRANSACTIONS TO DRIVE DEMAND
    BFSI: MARKET DRIVERS
  • 12.3 HEALTHCARE
    INCREASING REQUIREMENT FOR PROTECTION OF SENSITIVE PATIENT DATA TO FUEL MARKET
    HEALTHCARE: MARKET DRIVERS
  • 12.4 IT & ITES
    WIDE ADOPTION OF PEN TESTS TO SECURE DIGITAL INFRASTRUCTURES TO ACCELERATE MARKET GROWTH
    IT & ITES: MARKET DRIVERS
  • 12.5 TELECOMMUNICATION
    RISING DEMAND TO SECURE NETWORKS AND INFRASTRUCTURE TO PROPEL MARKET
    TELECOMMUNICATION: MARKET
  • 12.6 RETAIL & ECOMMERCE
    SURGING ADOPTION OF PEN TESTS TO SECURE CUSTOMER DATA TO BOOST MARKET
    RETAIL & ECOMMERCE: MARKET DRIVERS
  • 12.7 MANUFACTURING
    GROWING ADOPTION OF INTERCONNECTED SYSTEMS AND IOT DEVICES TO DRIVE DEMAND
    MANUFACTURING: MARKET DRIVERS
  • 12.8 EDUCATION
    INCREASING RELIANCE ON DIGITAL PLATFORMS TO PROPEL MARKET
    EDUCATION: MARKET DRIVERS
  • 12.9 OTHER VERTICALS
    STRICT REGULATORY COMPLIANCE REQUIREMENTS TO DRIVE MARKET
PENETRATION TESTING MARKET, BY REGION
129
  • 13.1 INTRODUCTION
  • 13.2 NORTH AMERICA
    NORTH AMERICA: MARKET DRIVERS
    NORTH AMERICA: RECESSION IMPACT
    US
    - Growing awareness of cyber threats and regulatory compliances to drive market
    CANADA
    - Wide adoption of cloud-based solutions to drive demand
  • 13.3 EUROPE
    EUROPE: MARKET DRIVERS
    EUROPE: RECESSION IMPACT
    UK
    - Strict cybersecurity regulations to drive market
    GERMANY
    - Growing industrial automation to drive market
    FRANCE
    - Rising regulatory scrutiny to boost market
    REST OF EUROPE
  • 13.4 ASIA PACIFIC
    ASIA PACIFIC: PENETRATION TESTING MARKET DRIVERS
    ASIA PACIFIC: RECESSION IMPACT
    CHINA
    - Stringent cybersecurity laws to boost demand
    JAPAN
    - Increasing digitalization to drive market
    INDIA
    - Rapidly increasing internet penetration to fuel market
    REST OF ASIA PACIFIC
  • 13.5 MIDDLE EAST & AFRICA
    MIDDLE EAST & AFRICA: MARKET DRIVERS
    MIDDLE EAST & AFRICA: RECESSION IMPACT
    MIDDLE EAST
    - KSA
    - UAE
    AFRICA
  • 13.6 LATIN AMERICA
    LATIN AMERICA: PENETRATION TESTING MARKET DRIVERS
    LATIN AMERICA: RECESSION IMPACT
    BRAZIL
    - Strict data protection laws to boost demand
    MEXICO
    - Trade agreements with US and Canada to fuel market
    REST OF LATIN AMERICA
COMPETITIVE LANDSCAPE
209
  • 14.1 OVERVIEW
  • 14.2 STRATEGIES ADOPTED BY KEY PLAYERS/RIGHT TO WIN
  • 14.3 REVENUE ANALYSIS
  • 14.4 VALUATION AND FINANCIAL METRICS OF KEY VENDORS
  • 14.5 MARKET SHARE ANALYSIS
  • 14.6 BRAND COMPARISON
  • 14.7 COMPANY EVALUATION MATRIX: KEY PLAYERS
    STARS
    EMERGING LEADERS
    PERVASIVE PLAYERS
    PARTICIPANTS
    COMPANY FOOTPRINT
  • 14.8 COMPANY EVALUATION MATRIX: STARTUPS/SMES
    PROGRESSIVE COMPANIES
    RESPONSIVE COMPANIES
    DYNAMIC COMPANIES
    STARTING BLOCKS
    COMPETITIVE BENCHMARKING FOR STARTUPS/SMES
    - KEY STARTUPS/SMES
    - COMPETITIVE BENCHMARKING OF KEY STARTUPS/SMES
  • 14.9 COMPETITIVE SCENARIO
    PRODUCT LAUNCHES
    DEALS
COMPANY PROFILES
232
  • 15.1 KEY PLAYERS
    RAPID7
    - Business overview
    - Products/Solutions/Services offered
    - Recent developments
    - MNM view
    SECUREWORKS
    - Business overview
    - Products/Solutions/Services offered
    - Recent developments
    - MnM view
    SYNOPSYS
    - Business overview
    - Products/Solutions/Services offered
    - Recent developments
    - MnM view
    CISCO SYSTEMS
    - Business overview
    - Products/Solutions/Services offered
    - Recent developments
    - MnM view
    IBM
    - Business overview
    - Products/Solutions/Services offered
    - Recent developments
    - MnM view
    CROWDSTRIKE
    - Business overview
    - Products/Solutions/Services offered
    - Recent developments
    COALFIRE
    - Business overview
    - Products/Solutions/Services offered
    - Recent developments
    INDIUM SOFTWARE
    - Business overview
    - Products/Solutions/Services offered
    - Recent developments
    CIGNITI TECHNOLOGIES
    - Business overview
    - Products/Solutions/Services offered
    - Recent developments
    TRUSTWAVE
    - Business overview
    - Products/Solutions/Services offered
    - Recent developments
    FORTINET
    - Business overview
    - Products/Solutions/Services offered
    - Recent developments
    BUGCROWD
    - Business overview
    - Products/Solutions/Services offered
    - Recent developments
    INVICTI
    - Business overview
    - Products/Solutions/Services offered
    - Recent developments
    HACKERONE
    RAXIS
    RSI SECURITY
    RHINO SECURITY LABS
    SCIENCESOFT
    PORTSWIGGER
    NETRAGARD
    SOFTWARE SECURED
    VUMETRIC CYBERSECURITY
    NETTITUDE
    ZIMPERIUM
    NOWSECURE
    SECURITYMETRICS
    NETSPI
  • 15.2 STARTUPS/SMES
    COVERTSWARM
    HOLM SECURITY
    INTRUDER SYSTEMS
    BREACHLOCK
    ISECURION
    REDBOT SECURITY
ADJACENT MARKETS
308
  • 16.1 INTRODUCTION TO ADJACENT MARKETS
  • 16.2 LIMITATIONS
  • 16.3 APPLICATION SECURITY MARKET
  • 16.4 AUTOMATED BREACH AND ATTACK SIMULATION MARKET
  • 16.5 SECURITY TESTING MARKET
APPENDIX
322
  • 17.1 DISCUSSION GUIDE
  • 17.2 KNOWLEDGESTORE: MARKETSANDMARKETS’ SUBSCRIPTION PORTAL
  • 17.3 CUSTOMIZATION OPTIONS
  • 17.4 RELATED REPORTS
  • 17.5 AUTHOR DETAILS
LIST OF TABLES
 
  • TABLE 1 USD EXCHANGE RATES, 2017–2022
  • TABLE 2 FACTOR ANALYSIS
  • TABLE 3 PENETRATION TESTING MARKET ECOSYSTEM
  • TABLE 4 TOP PATENTS IN PENETRATION TESTING MARKET, 2023
  • TABLE 5 AVERAGE PENETRATION TESTING COSTS, BY TYPE (USD)
  • TABLE 6 PENETRATION TESTING MARKET: PORTER’S FIVE FORCES ANALYSIS
  • TABLE 7 INFLUENCE OF STAKEHOLDERS ON BUYING PROCESS FOR TOP THREE VERTICALS
  • TABLE 8 KEY BUYING CRITERIA FOR TOP VERTICALS
  • TABLE 9 NORTH AMERICA: REGULATORY BODIES, GOVERNMENT AGENCIES, AND OTHER ORGANIZATIONS
  • TABLE 10 EUROPE: REGULATORY BODIES, GOVERNMENT AGENCIES, AND OTHER ORGANIZATIONS
  • TABLE 11 ASIA PACIFIC: REGULATORY BODIES, GOVERNMENT AGENCIES, AND OTHER ORGANIZATIONS
  • TABLE 12 MIDDLE EAST & AFRICA: REGULATORY BODIES, GOVERNMENT AGENCIES, AND OTHER ORGANIZATIONS
  • TABLE 13 LATIN AMERICA: REGULATORY BODIES, GOVERNMENT AGENCIES, AND OTHER ORGANIZATIONS
  • TABLE 14 PENETRATION TESTING MARKET: CONFERENCES AND EVENTS, 2024
  • TABLE 15 MARKET, BY OFFERING, 2019–2023 (USD MILLION)
  • TABLE 16 MARKET, BY OFFERING, 2024–2029 (USD MILLION)
  • TABLE 17 SOLUTIONS: MARKET, BY REGION, 2019–2023 (USD MILLION)
  • TABLE 18 SOLUTIONS: MARKET, BY REGION, 2024–2029 (USD MILLION)
  • TABLE 19 SERVICES: MARKET, BY REGION, 2019–2023 (USD MILLION)
  • TABLE 20 SERVICES: MARKET, BY REGION, 2024–2029 (USD MILLION)
  • TABLE 21 MARKET, BY SERVICE, 2019–2023 (USD MILLION)
  • TABLE 22 MARKET, BY SERVICE, 2024–2029 (USD MILLION)
  • TABLE 23 MARKET, BY DEPLOYMENT MODE, 2019–2023 (USD MILLION)
  • TABLE 24 MARKET, BY DEPLOYMENT MODE, 2024–2029 (USD MILLION)
  • TABLE 25 CLOUD: MARKET, BY REGION, 2019–2023 (USD MILLION)
  • TABLE 26 CLOUD: MARKET, BY REGION, 2024–2029 (USD MILLION)
  • TABLE 27 ON-PREMISES: PENETRATION TESTING MARKET, BY REGION, 2019–2023 (USD MILLION)
  • TABLE 28 ON-PREMISES: MARKET, BY REGION, 2024–2029 (USD MILLION)
  • TABLE 29 MARKET, BY ORGANIZATION SIZE, 2019–2023 (USD MILLION)
  • TABLE 30 MARKET, BY ORGANIZATION SIZE, 2024–2029 (USD MILLION)
  • TABLE 31 SMALL AND MEDIUM-SIZED ENTERPRISES: MARKET SIZE, BY REGION, 2019–2023 (USD MILLION)
  • TABLE 32 SMALL AND MEDIUM-SIZED ENTERPRISES: MARKET SIZE, BY REGION, 2024–2029 (USD MILLION)
  • TABLE 33 LARGE ENTERPRISES: MARKET, BY REGION, 2019–2023 (USD MILLION)
  • TABLE 34 LARGE ENTERPRISES: MARKET, BY REGION, 2024–2029 (USD MILLION)
  • TABLE 35 MARKET, BY TYPE, 2019–2023 (USD MILLION)
  • TABLE 36 MARKET, BY TYPE, 2024–2029 (USD MILLION)
  • TABLE 37 WEB APPLICATIONS: MARKET, BY REGION, 2019–2023 (USD MILLION)
  • TABLE 38 WEB APPLICATIONS: MARKET, BY REGION, 2024–2029 (USD MILLION)
  • TABLE 39 MOBILE APPLICATIONS: MARKET, BY REGION, 2019–2023 (USD MILLION)
  • TABLE 40 MOBILE APPLICATIONS: MARKET, BY REGION, 2024–2029 (USD MILLION)
  • TABLE 41 NETWORK INFRASTRUCTURE: MARKET, BY REGION, 2019–2023 (USD MILLION)
  • TABLE 42 NETWORK INFRASTRUCTURE: MARKET, BY REGION, 2024–2029 (USD MILLION)
  • TABLE 43 SOCIAL ENGINEERING: MARKET, BY REGION, 2019–2023 (USD MILLION)
  • TABLE 44 SOCIAL ENGINEERING: MARKET, BY REGION, 2024–2029 (USD MILLION)
  • TABLE 45 CLOUD: MARKET, BY REGION, 2019–2023 (USD MILLION)
  • TABLE 46 CLOUD: MARKET, BY REGION, 2024–2029 (USD MILLION)
  • TABLE 47 PENETRATION TESTING MARKET, BY VERTICAL, 2019–2023 (USD MILLION)
  • TABLE 48 MARKET, BY VERTICAL, 2024–2029 (USD MILLION)
  • TABLE 49 BFSI: MARKET, BY REGION, 2019–2023 (USD MILLION)
  • TABLE 50 BFSI: MARKET, BY REGION, 2024–2029 (USD MILLION)
  • TABLE 51 HEALTHCARE: MARKET, BY REGION, 2019–2023 (USD MILLION)
  • TABLE 52 HEALTHCARE: MARKET, BY REGION, 2024–2029 (USD MILLION)
  • TABLE 53 IT & ITES: MARKET, BY REGION, 2019–2023 (USD MILLION)
  • TABLE 54 IT & ITES: MARKET, BY REGION, 2024–2029 (USD MILLION)
  • TABLE 55 TELECOMMUNICATION: MARKET, BY REGION, 2019–2023 (USD MILLION)
  • TABLE 56 TELECOMMUNICATION: MARKET, BY REGION, 2024–2029 (USD MILLION)
  • TABLE 57 RETAIL & ECOMMERCE: MARKET, BY REGION, 2019–2023 (USD MILLION)
  • TABLE 58 RETAIL & ECOMMERCE: MARKET, BY REGION, 2024–2029 (USD MILLION)
  • TABLE 59 MANUFACTURING: MARKET, BY REGION, 2019–2023 (USD MILLION)
  • TABLE 60 MANUFACTURING: MARKET, BY REGION, 2024–2029 (USD MILLION)
  • TABLE 61 EDUCATION: MARKET, BY REGION, 2019–2023 (USD MILLION)
  • TABLE 62 EDUCATION: MARKET, BY REGION, 2024–2029 (USD MILLION)
  • TABLE 63 MARKET, BY REGION, 2019–2023 (USD MILLION)
  • TABLE 64 MARKET, BY REGION, 2024–2029 (USD MILLION)
  • TABLE 65 NORTH AMERICA: PENETRATION TESTING MARKET, BY OFFERING, 2019–2023 (USD MILLION)
  • TABLE 66 NORTH AMERICA: MARKET, BY OFFERING, 2024–2029 (USD MILLION)
  • TABLE 67 NORTH AMERICA: MARKET, BY SERVICE, 2019–2023 (USD MILLION)
  • TABLE 68 NORTH AMERICA: MARKET, BY SERVICE, 2024–2029 (USD MILLION)
  • TABLE 69 NORTH AMERICA: MARKET, BY DEPLOYMENT MODE, 2019–2023 (USD MILLION)
  • TABLE 70 NORTH AMERICA: MARKET, BY DEPLOYMENT MODE, 2024–2029 (USD MILLION)
  • TABLE 71 NORTH AMERICA: MARKET, BY ORGANIZATION SIZE, 2019–2023 (USD MILLION)
  • TABLE 72 NORTH AMERICA: MARKET, BY ORGANIZATION SIZE, 2024–2029 (USD MILLION)
  • TABLE 73 NORTH AMERICA: MARKET, BY TYPE, 2019–2023 (USD MILLION)
  • TABLE 74 NORTH AMERICA: MARKET, BY TYPE, 2024–2029 (USD MILLION)
  • TABLE 75 NORTH AMERICA: MARKET, BY VERTICAL, 2019–2023 (USD MILLION)
  • TABLE 76 NORTH AMERICA: MARKET, BY VERTICAL, 2024–2029 (USD MILLION)
  • TABLE 77 NORTH AMERICA: MARKET, BY COUNTRY, 2019–2023 (USD MILLION)
  • TABLE 78 NORTH AMERICA: MARKET, BY COUNTRY, 2024–2029 (USD MILLION)
  • TABLE 79 US: PENETRATION TESTING MARKET, BY OFFERING, 2019–2023 (USD MILLION)
  • TABLE 80 US: MARKET, BY OFFERING, 2024–2029 (USD MILLION)
  • TABLE 81 US: MARKET, BY SERVICE, 2019–2023 (USD MILLION)
  • TABLE 82 US: MARKET, BY SERVICE, 2024–2029 (USD MILLION)
  • TABLE 83 US: MARKET, BY DEPLOYMENT MODE, 2019–2023 (USD MILLION)
  • TABLE 84 US: MARKET, BY DEPLOYMENT MODE, 2024–2029 (USD MILLION)
  • TABLE 85 US: MARKET, BY ORGANIZATION SIZE, 2019–2023 (USD MILLION)
  • TABLE 86 US: MARKET, BY ORGANIZATION SIZE, 2024–2029 (USD MILLION)
  • TABLE 87 US: MARKET, BY TYPE, 2019–2023 (USD MILLION)
  • TABLE 88 US: MARKET, BY TYPE, 2024–2029 (USD MILLION)
  • TABLE 89 US: MARKET, BY VERTICAL, 2019–2023 (USD MILLION)
  • TABLE 90 US: MARKET, BY VERTICAL, 2024–2029 (USD MILLION)
  • TABLE 91 CANADA: PENETRATION TESTING MARKET, BY OFFERING, 2019–2023 (USD MILLION)
  • TABLE 92 CANADA: MARKET, BY OFFERING, 2024–2029 (USD MILLION)
  • TABLE 93 CANADA: MARKET, BY SERVICE, 2019–2023 (USD MILLION)
  • TABLE 94 CANADA: MARKET, BY SERVICE, 2024–2029 (USD MILLION)
  • TABLE 95 CANADA: MARKET, BY DEPLOYMENT MODE, 2019–2023 (USD MILLION)
  • TABLE 96 CANADA: MARKET, BY DEPLOYMENT MODE, 2024–2029 (USD MILLION)
  • TABLE 97 CANADA: MARKET, BY ORGANIZATION SIZE, 2019–2023 (USD MILLION)
  • TABLE 98 CANADA: MARKET, BY ORGANIZATION SIZE, 2024–2029 (USD MILLION)
  • TABLE 99 CANADA: MARKET, BY TYPE, 2019–2023 (USD MILLION)
  • TABLE 100 CANADA: MARKET, BY TYPE, 2024–2029 (USD MILLION)
  • TABLE 101 CANADA: MARKET, BY VERTICAL, 2019–2023 (USD MILLION)
  • TABLE 102 CANADA: MARKET, BY VERTICAL, 2024–2029 (USD MILLION)
  • TABLE 103 EUROPE: PENETRATION TESTING MARKET, BY OFFERING, 2019–2023 (USD MILLION)
  • TABLE 104 EUROPE: MARKET, BY OFFERING, 2024–2029 (USD MILLION)
  • TABLE 105 EUROPE: MARKET, BY SERVICE, 2019–2023 (USD MILLION)
  • TABLE 106 EUROPE: MARKET, BY SERVICE, 2024–2029 (USD MILLION)
  • TABLE 107 EUROPE: MARKET, BY DEPLOYMENT MODE, 2019–2023 (USD MILLION)
  • TABLE 108 EUROPE: MARKET, BY DEPLOYMENT MODE, 2024–2029 (USD MILLION)
  • TABLE 109 EUROPE: MARKET, BY ORGANIZATION SIZE, 2019–2023 (USD MILLION)
  • TABLE 110 EUROPE: MARKET, BY ORGANIZATION SIZE, 2024–2029 (USD MILLION)
  • TABLE 111 EUROPE: MARKET, BY TYPE, 2019–2023 (USD MILLION)
  • TABLE 112 EUROPE: MARKET, BY TYPE, 2024–2029 (USD MILLION)
  • TABLE 113 EUROPE: MARKET, BY VERTICAL, 2019–2023 (USD MILLION)
  • TABLE 114 EUROPE: MARKET, BY VERTICAL, 2024–2029 (USD MILLION)
  • TABLE 115 EUROPE: MARKET, BY COUNTRY, 2019–2023 (USD MILLION)
  • TABLE 116 EUROPE: MARKET, BY COUNTRY, 2024–2029 (USD MILLION)
  • TABLE 117 UK: PENETRATION TESTING MARKET, BY OFFERING, 2019–2023 (USD MILLION)
  • TABLE 118 UK: MARKET, BY OFFERING, 2024–2029 (USD MILLION)
  • TABLE 119 UK: MARKET, BY SERVICE, 2019–2023 (USD MILLION)
  • TABLE 120 UK: MARKET, BY SERVICE, 2024–2029 (USD MILLION)
  • TABLE 121 UK: MARKET, BY DEPLOYMENT MODE, 2019–2023 (USD MILLION)
  • TABLE 122 UK: MARKET, BY DEPLOYMENT MODE, 2024–2029 (USD MILLION)
  • TABLE 123 UK: MARKET, BY ORGANIZATION SIZE, 2019–2023 (USD MILLION)
  • TABLE 124 UK: MARKET, BY ORGANIZATION SIZE, 2024–2029 (USD MILLION)
  • TABLE 125 UK: MARKET, BY TYPE, 2019–2023 (USD MILLION)
  • TABLE 126 UK: MARKET, BY TYPE, 2024–2029 (USD MILLION)
  • TABLE 127 UK: MARKET, BY VERTICAL, 2019–2023 (USD MILLION)
  • TABLE 128 UK: MARKET, BY VERTICAL, 2024–2029 (USD MILLION)
  • TABLE 129 GERMANY: PENETRATION TESTING MARKET, BY OFFERING, 2019–2023 (USD MILLION)
  • TABLE 130 GERMANY: MARKET, BY OFFERING, 2024–2029 (USD MILLION)
  • TABLE 131 GERMANY: MARKET, BY SERVICE, 2019–2023 (USD MILLION)
  • TABLE 132 GERMANY: MARKET, BY SERVICE, 2024–2029 (USD MILLION)
  • TABLE 133 GERMANY: MARKET, BY DEPLOYMENT MODE, 2019–2023 (USD MILLION)
  • TABLE 134 GERMANY: MARKET, BY DEPLOYMENT MODE, 2024–2029 (USD MILLION)
  • TABLE 135 GERMANY: MARKET, BY ORGANIZATION SIZE, 2019–2023 (USD MILLION)
  • TABLE 136 GERMANY: MARKET, BY ORGANIZATION SIZE, 2024–2029 (USD MILLION)
  • TABLE 137 GERMANY: MARKET, BY TYPE, 2019–2023 (USD MILLION)
  • TABLE 138 GERMANY: MARKET, BY TYPE, 2024–2029 (USD MILLION)
  • TABLE 139 GERMANY: MARKET, BY VERTICAL, 2019–2023 (USD MILLION)
  • TABLE 140 GERMANY: MARKET, BY VERTICAL, 2024–2029 (USD MILLION)
  • TABLE 141 FRANCE: PENETRATION TESTING MARKET, BY OFFERING, 2019–2023 (USD MILLION)
  • TABLE 142 FRANCE: MARKET, BY OFFERING, 2024–2029 (USD MILLION)
  • TABLE 143 FRANCE: MARKET, BY SERVICE, 2019–2023 (USD MILLION)
  • TABLE 144 FRANCE: MARKET, BY SERVICE, 2024–2029 (USD MILLION)
  • TABLE 145 FRANCE: MARKET, BY DEPLOYMENT MODE, 2019–2023 (USD MILLION)
  • TABLE 146 FRANCE: MARKET, BY DEPLOYMENT MODE, 2024–2029 (USD MILLION)
  • TABLE 147 FRANCE: MARKET, BY ORGANIZATION SIZE, 2019–2023 (USD MILLION)
  • TABLE 148 FRANCE: MARKET, BY ORGANIZATION SIZE, 2024–2029 (USD MILLION)
  • TABLE 149 FRANCE: MARKET, BY TYPE, 2019–2023 (USD MILLION)
  • TABLE 150 FRANCE: MARKET, BY TYPE, 2024–2029 (USD MILLION)
  • TABLE 151 FRANCE: MARKET, BY VERTICAL, 2019–2023 (USD MILLION)
  • TABLE 152 FRANCE: MARKET, BY VERTICAL, 2024–2029 (USD MILLION)
  • TABLE 153 ASIA PACIFIC: PENETRATION TESTING MARKET, BY OFFERING, 2019–2023 (USD MILLION)
  • TABLE 154 ASIA PACIFIC: MARKET, BY OFFERING, 2024–2029 (USD MILLION)
  • TABLE 155 ASIA PACIFIC: MARKET, BY SERVICE, 2019–2023 (USD MILLION)
  • TABLE 156 ASIA PACIFIC: MARKET, BY SERVICE, 2024–2029 (USD MILLION)
  • TABLE 157 ASIA PACIFIC: MARKET, BY DEPLOYMENT MODE, 2019–2023 (USD MILLION)
  • TABLE 158 ASIA PACIFIC: MARKET, BY DEPLOYMENT MODE, 2024–2029 (USD MILLION)
  • TABLE 159 ASIA PACIFIC: MARKET, BY ORGANIZATION SIZE, 2019–2023 (USD MILLION)
  • TABLE 160 ASIA PACIFIC: MARKET, BY ORGANIZATION SIZE, 2024–2029 (USD MILLION)
  • TABLE 161 ASIA PACIFIC: MARKET, BY TYPE, 2019–2023 (USD MILLION)
  • TABLE 162 ASIA PACIFIC: MARKET, BY TYPE, 2024–2029 (USD MILLION)
  • TABLE 163 ASIA PACIFIC: MARKET, BY VERTICAL, 2019–2023 (USD MILLION)
  • TABLE 164 ASIA PACIFIC: MARKET, BY VERTICAL, 2024–2029 (USD MILLION)
  • TABLE 165 ASIA PACIFIC: MARKET, BY COUNTRY, 2019–2023 (USD MILLION)
  • TABLE 166 ASIA PACIFIC: MARKET, BY COUNTRY, 2024–2029 (USD MILLION)
  • TABLE 167 CHINA: PENETRATION TESTING MARKET, BY OFFERING, 2019–2023 (USD MILLION)
  • TABLE 168 CHINA: MARKET, BY OFFERING, 2024–2029 (USD MILLION)
  • TABLE 169 CHINA: MARKET, BY SERVICE, 2019–2023 (USD MILLION)
  • TABLE 170 CHINA: MARKET, BY SERVICE, 2024–2029 (USD MILLION)
  • TABLE 171 CHINA: MARKET, BY DEPLOYMENT MODE, 2019–2023 (USD MILLION)
  • TABLE 172 CHINA: MARKET, BY DEPLOYMENT MODE, 2024–2029 (USD MILLION)
  • TABLE 173 CHINA: MARKET, BY ORGANIZATION SIZE, 2019–2023 (USD MILLION)
  • TABLE 174 CHINA: MARKET, BY ORGANIZATION SIZE, 2024–2029 (USD MILLION)
  • TABLE 175 CHINA: MARKET, BY TYPE, 2019–2023 (USD MILLION)
  • TABLE 176 CHINA: MARKET, BY TYPE, 2024–2029 (USD MILLION)
  • TABLE 177 CHINA: MARKET, BY VERTICAL, 2019–2023 (USD MILLION)
  • TABLE 178 CHINA: MARKET, BY VERTICAL, 2024–2029 (USD MILLION)
  • TABLE 179 JAPAN: PENETRATION TESTING MARKET, BY OFFERING, 2019–2023 (USD MILLION)
  • TABLE 180 JAPAN: MARKET, BY OFFERING, 2024–2029 (USD MILLION)
  • TABLE 181 JAPAN: MARKET, BY SERVICE, 2019–2023 (USD MILLION)
  • TABLE 182 JAPAN: MARKET, BY SERVICE, 2024–2029 (USD MILLION)
  • TABLE 183 JAPAN: MARKET, BY DEPLOYMENT MODE, 2019–2023 (USD MILLION)
  • TABLE 184 JAPAN: MARKET, BY DEPLOYMENT MODE, 2024–2029 (USD MILLION)
  • TABLE 185 JAPAN: MARKET, BY ORGANIZATION SIZE, 2019–2023 (USD MILLION)
  • TABLE 186 JAPAN: MARKET, BY ORGANIZATION SIZE, 2024–2029 (USD MILLION)
  • TABLE 187 JAPAN: MARKET, BY TYPE, 2019–2023 (USD MILLION)
  • TABLE 188 JAPAN: MARKET, BY TYPE, 2024–2029 (USD MILLION)
  • TABLE 189 JAPAN: MARKET, BY VERTICAL, 2019–2023 (USD MILLION)
  • TABLE 190 JAPAN: MARKET, BY VERTICAL, 2024–2029 (USD MILLION)
  • TABLE 191 INDIA: PENETRATION TESTING MARKET, BY OFFERING, 2019–2023 (USD MILLION)
  • TABLE 192 INDIA: MARKET, BY OFFERING, 2024–2029 (USD MILLION)
  • TABLE 193 INDIA: MARKET, BY SERVICE, 2019–2023 (USD MILLION)
  • TABLE 194 INDIA: MARKET, BY SERVICE, 2024–2029 (USD MILLION)
  • TABLE 195 INDIA: MARKET, BY DEPLOYMENT MODE, 2019–2023 (USD MILLION)
  • TABLE 196 INDIA: MARKET, BY DEPLOYMENT MODE, 2024–2029 (USD MILLION)
  • TABLE 197 INDIA: MARKET, BY ORGANIZATION SIZE, 2019–2023 (USD MILLION)
  • TABLE 198 INDIA: MARKET, BY ORGANIZATION SIZE, 2024–2029 (USD MILLION)
  • TABLE 199 INDIA: MARKET, BY TYPE, 2019–2023 (USD MILLION)
  • TABLE 200 INDIA: MARKET, BY TYPE, 2024–2029 (USD MILLION)
  • TABLE 201 INDIA: MARKET, BY VERTICAL, 2019–2023 (USD MILLION)
  • TABLE 202 INDIA: MARKET, BY VERTICAL, 2024–2029 (USD MILLION)
  • TABLE 203 MIDDLE EAST & AFRICA: PENETRATION TESTING MARKET, BY OFFERING, 2019–2023 (USD MILLION)
  • TABLE 204 MIDDLE EAST & AFRICA: MARKET, BY OFFERING, 2024–2029 (USD MILLION)
  • TABLE 205 MIDDLE EAST & AFRICA: MARKET, BY SERVICE, 2019–2023 (USD MILLION)
  • TABLE 206 MIDDLE EAST & AFRICA: MARKET, BY SERVICE, 2024–2029 (USD MILLION)
  • TABLE 207 MIDDLE EAST & AFRICA: MARKET, BY DEPLOYMENT MODE, 2019–2023 (USD MILLION)
  • TABLE 208 MIDDLE EAST & AFRICA: MARKET, BY DEPLOYMENT MODE, 2024–2029 (USD MILLION)
  • TABLE 209 MIDDLE EAST & AFRICA: MARKET, BY ORGANIZATION SIZE, 2019–2023 (USD MILLION)
  • TABLE 210 MIDDLE EAST & AFRICA: MARKET, BY ORGANIZATION SIZE, 2024–2029 (USD MILLION)
  • TABLE 211 MIDDLE EAST & AFRICA: MARKET, BY TYPE, 2019–2023 (USD MILLION)
  • TABLE 212 MIDDLE EAST & AFRICA: MARKET, BY TYPE, 2024–2029 (USD MILLION)
  • TABLE 213 MIDDLE EAST & AFRICA: MARKET, BY VERTICAL, 2019–2023 (USD MILLION)
  • TABLE 214 MIDDLE EAST & AFRICA: MARKET, BY VERTICAL, 2024–2029 (USD MILLION)
  • TABLE 215 MIDDLE EAST & AFRICA: MARKET, BY REGION, 2019–2023 (USD MILLION)
  • TABLE 216 MIDDLE EAST & AFRICA: MARKET, BY REGION, 2024–2029 (USD MILLION)
  • TABLE 217 MIDDLE EAST: PENETRATION TESTING MARKET, BY OFFERING, 2019–2023 (USD MILLION)
  • TABLE 218 MIDDLE EAST: MARKET, BY OFFERING, 2024–2029 (USD MILLION)
  • TABLE 219 MIDDLE EAST: MARKET, BY SERVICE, 2019–2023 (USD MILLION)
  • TABLE 220 MIDDLE EAST: MARKET, BY SERVICE, 2024–2029 (USD MILLION)
  • TABLE 221 MIDDLE EAST: MARKET, BY DEPLOYMENT MODE, 2019–2023 (USD MILLION)
  • TABLE 222 MIDDLE EAST: MARKET, BY DEPLOYMENT MODE, 2024–2029 (USD MILLION)
  • TABLE 223 MIDDLE EAST: MARKET, BY ORGANIZATION SIZE, 2019–2023 (USD MILLION)
  • TABLE 224 MIDDLE EAST: MARKET, BY ORGANIZATION SIZE, 2024–2029 (USD MILLION)
  • TABLE 225 MIDDLE EAST: MARKET, BY TYPE, 2019–2023 (USD MILLION)
  • TABLE 226 MIDDLE EAST: MARKET, BY TYPE, 2024–2029 (USD MILLION)
  • TABLE 227 MIDDLE EAST: MARKET, BY VERTICAL, 2019–2023 (USD MILLION)
  • TABLE 228 MIDDLE EAST: MARKET, BY VERTICAL, 2024–2029 (USD MILLION)
  • TABLE 229 AFRICA: PENETRATION TESTING MARKET, BY OFFERING, 2019–2023 (USD MILLION)
  • TABLE 230 AFRICA: MARKET, BY OFFERING, 2024–2029 (USD MILLION)
  • TABLE 231 AFRICA: MARKET, BY SERVICE, 2019–2023 (USD MILLION)
  • TABLE 232 AFRICA: MARKET, BY SERVICE, 2024–2029 (USD MILLION)
  • TABLE 233 AFRICA: MARKET, BY DEPLOYMENT MODE, 2019–2023 (USD MILLION)
  • TABLE 234 AFRICA: MARKET, BY DEPLOYMENT MODE, 2024–2029 (USD MILLION)
  • TABLE 235 AFRICA: MARKET, BY ORGANIZATION SIZE, 2019–2023 (USD MILLION)
  • TABLE 236 AFRICA: MARKET, BY ORGANIZATION SIZE, 2024–2029 (USD MILLION)
  • TABLE 237 AFRICA: MARKET, BY TYPE, 2019–2023 (USD MILLION)
  • TABLE 238 AFRICA: MARKET, BY TYPE, 2024–2029 (USD MILLION)
  • TABLE 239 AFRICA: MARKET, BY VERTICAL, 2019–2023 (USD MILLION)
  • TABLE 240 AFRICA: MARKET, BY VERTICAL, 2024–2029 (USD MILLION)
  • TABLE 241 LATIN AMERICA: PENETRATION TESTING MARKET, BY OFFERING, 2019–2023 (USD MILLION)
  • TABLE 242 LATIN AMERICA: MARKET, BY OFFERING, 2024–2029 (USD MILLION)
  • TABLE 243 LATIN AMERICA: MARKET, BY SERVICE, 2019–2023 (USD MILLION)
  • TABLE 244 LATIN AMERICA: MARKET, BY SERVICE, 2024–2029 (USD MILLION)
  • TABLE 245 LATIN AMERICA: MARKET, BY DEPLOYMENT MODE, 2019–2023 (USD MILLION)
  • TABLE 246 LATIN AMERICA: MARKET, BY DEPLOYMENT MODE, 2024–2029 (USD MILLION)
  • TABLE 247 LATIN AMERICA: MARKET, BY ORGANIZATION SIZE, 2019–2023 (USD MILLION)
  • TABLE 248 LATIN AMERICA: MARKET, BY ORGANIZATION SIZE, 2024–2029 (USD MILLION)
  • TABLE 249 LATIN AMERICA: MARKET, BY TYPE, 2019–2023 (USD MILLION)
  • TABLE 250 LATIN AMERICA: MARKET, BY TYPE, 2024–2029 (USD MILLION)
  • TABLE 251 LATIN AMERICA: MARKET, BY VERTICAL, 2019–2023 (USD MILLION)
  • TABLE 252 LATIN AMERICA: MARKET, BY VERTICAL, 2024–2029 (USD MILLION)
  • TABLE 253 LATIN AMERICA: MARKET, BY COUNTRY, 2019–2023 (USD MILLION)
  • TABLE 254 LATIN AMERICA: MARKET, BY COUNTRY, 2024–2029 (USD MILLION)
  • TABLE 255 BRAZIL: PENETRATION TESTING MARKET, BY OFFERING, 2019–2023 (USD MILLION)
  • TABLE 256 BRAZIL: MARKET, BY OFFERING, 2024–2029 (USD MILLION)
  • TABLE 257 BRAZIL: MARKET, BY SERVICE, 2019–2023 (USD MILLION)
  • TABLE 258 BRAZIL: MARKET, BY SERVICE, 2024–2029 (USD MILLION)
  • TABLE 259 BRAZIL: MARKET, BY DEPLOYMENT MODE, 2019–2023 (USD MILLION)
  • TABLE 260 BRAZIL: MARKET, BY DEPLOYMENT MODE, 2024–2029 (USD MILLION)
  • TABLE 261 BRAZIL: MARKET, BY ORGANIZATION SIZE, 2019–2023 (USD MILLION)
  • TABLE 262 BRAZIL: MARKET, BY ORGANIZATION SIZE, 2024–2029 (USD MILLION)
  • TABLE 263 BRAZIL: MARKET, BY TYPE, 2019–2023 (USD MILLION)
  • TABLE 264 BRAZIL: MARKET, BY TYPE, 2024–2029 (USD MILLION)
  • TABLE 265 BRAZIL: MARKET, BY VERTICAL, 2019–2023 (USD MILLION)
  • TABLE 266 BRAZIL: MARKET, BY VERTICAL, 2024–2029 (USD MILLION)
  • TABLE 267 MEXICO: PENETRATION TESTING MARKET, BY OFFERING, 2019–2023 (USD MILLION)
  • TABLE 268 MEXICO: MARKET, BY OFFERING, 2024–2029 (USD MILLION)
  • TABLE 269 MEXICO: MARKET, BY SERVICE, 2019–2023 (USD MILLION)
  • TABLE 270 MEXICO: MARKET, BY SERVICE, 2024–2029 (USD MILLION)
  • TABLE 271 MEXICO: MARKET, BY DEPLOYMENT MODE, 2019–2023 (USD MILLION)
  • TABLE 272 MEXICO: MARKET, BY DEPLOYMENT MODE, 2024–2029 (USD MILLION)
  • TABLE 273 MEXICO: MARKET, BY ORGANIZATION SIZE, 2019–2023 (USD MILLION)
  • TABLE 274 MEXICO: MARKET, BY ORGANIZATION SIZE, 2024–2029 (USD MILLION)
  • TABLE 275 MEXICO: MARKET, BY TYPE, 2019–2023 (USD MILLION)
  • TABLE 276 MEXICO: MARKET, BY TYPE, 2024–2029 (USD MILLION)
  • TABLE 277 MEXICO: MARKET, BY VERTICAL, 2019–2023 (USD MILLION)
  • TABLE 278 MEXICO: MARKET, BY VERTICAL, 2024–2029 (USD MILLION)
  • TABLE 279 OVERVIEW OF STRATEGIES ADOPTED BY KEY PENETRATION TESTING VENDORS
  • TABLE 280 DEGREE OF COMPETITION
  • TABLE 281 PENETRATION TESTING MARKET: OFFERING FOOTPRINT
  • TABLE 282 MARKET: DEPLOYMENT MODE FOOTPRINT
  • TABLE 283 MARKET: VERTICAL FOOTPRINT
  • TABLE 284 MARKET: REGION FOOTPRINT
  • TABLE 285 MARKET: KEY STARTUPS/SMES
  • TABLE 286 MARKET: COMPETITIVE BENCHMARKING OF KEY STARTUPS/SMES
  • TABLE 287 MARKET: PRODUCT LAUNCHES, OCTOBER 2021–NOVEMBER 2023
  • TABLE 288 PENETRATION TESTING MARKET: DEALS, FEBRUARY 2021–DECEMBER 2023
  • TABLE 289 RAPID7: COMPANY OVERVIEW
  • TABLE 290 RAPID7: PRODUCTS/SOLUTIONS/SERVICES OFFERED
  • TABLE 291 RAPID7: PRODUCT LAUNCHES
  • TABLE 292 RAPID7: DEALS
  • TABLE 293 SECUREWORKS: COMPANY OVERVIEW
  • TABLE 294 SECUREWORKS: PRODUCTS/SOLUTIONS/SERVICES OFFERED
  • TABLE 295 SECUREWORKS: PRODUCT LAUNCHES
  • TABLE 296 SECUREWORKS: DEALS
  • TABLE 297 SYNOPSYS: COMPANY OVERVIEW
  • TABLE 298 SYNOPSYS: PRODUCTS/SOLUTIONS/SERVICES OFFERED
  • TABLE 299 SYNOPSYS: PRODUCT LAUNCHES
  • TABLE 300 SYNOPSYS: DEALS
  • TABLE 301 CISCO SYSTEMS: COMPANY OVERVIEW
  • TABLE 302 CISCO SYSTEMS: PRODUCTS/SOLUTIONS/SERVICES OFFERED
  • TABLE 303 CISCO SYSTEMS: PRODUCT LAUNCHES
  • TABLE 304 CISCO SYSTEMS: DEALS
  • TABLE 305 IBM: COMPANY OVERVIEW
  • TABLE 306 IBM: PRODUCTS/SOLUTIONS/SERVICES OFFERED
  • TABLE 307 IBM: PRODUCT LAUNCHES
  • TABLE 308 IBM: DEALS
  • TABLE 309 CROWDSTRIKE: COMPANY OVERVIEW
  • TABLE 310 CROWDSTRIKE: PRODUCTS/SOLUTIONS/SERVICES OFFERED
  • TABLE 311 CROWDSTRIKE: PRODUCT LAUNCHES
  • TABLE 312 CROWDSTRIKE: DEALS
  • TABLE 313 COALFIRE: COMPANY OVERVIEW
  • TABLE 314 COALFIRE: PRODUCTS/SOLUTIONS/SERVICES OFFERED
  • TABLE 315 COALFIRE: PRODUCT LAUNCHES
  • TABLE 316 COALFIRE: DEALS
  • TABLE 317 INDIUM SOFTWARE: COMPANY OVERVIEW
  • TABLE 318 INDIUM SOFTWARE: PRODUCTS/SOLUTIONS/SERVICES OFFERED
  • TABLE 319 INDIUM SOFTWARE: DEALS
  • TABLE 320 CIGNITI TECHNOLOGIES: COMPANY OVERVIEW
  • TABLE 321 CIGNITI TECHNOLOGIES: PRODUCTS/SOLUTIONS/SERVICES OFFERED
  • TABLE 322 CIGNITI TECHNOLOGIES: PRODUCT LAUNCHES
  • TABLE 323 CIGNITI TECHNOLOGIES: DEALS
  • TABLE 324 TRUSTWAVE: COMPANY OVERVIEW
  • TABLE 325 TRUSTWAVE: PRODUCTS/SOLUTIONS/SERVICES OFFERED
  • TABLE 326 TRUSTWAVE: PRODUCT LAUNCHES
  • TABLE 327 TRUSTWAVE: DEALS
  • TABLE 328 FORTINET: COMPANY OVERVIEW
  • TABLE 329 FORTINET: PRODUCTS/SOLUTIONS/SERVICES OFFERED
  • TABLE 330 FORTINET: PRODUCT LAUNCHES
  • TABLE 331 FORTINET SOFTWARE: DEALS
  • TABLE 332 BUGCROWD: COMPANY OVERVIEW
  • TABLE 333 BUGCROWD: PRODUCTS/SOLUTIONS/SERVICES OFFERED
  • TABLE 334 BUGCROWD: PRODUCT LAUNCHES
  • TABLE 335 BUGCROWD: DEALS
  • TABLE 336 INVICTI: COMPANY OVERVIEW
  • TABLE 337 INVICTI: PRODUCTS/SOLUTIONS/SERVICES OFFERED
  • TABLE 338 INVICTI: PRODUCT LAUNCHES
  • TABLE 339 INVICTI: DEALS
  • TABLE 340 ADJACENT MARKETS AND FORECASTS
  • TABLE 341 APPLICATION SECURITY MARKET, BY TYPE, 2014–2019 (USD MILLION)
  • TABLE 342 APPLICATION SECURITY MARKET, BY TYPE, 2020–2025 (USD MILLION)
  • TABLE 343 APPLICATION SECURITY MARKET, BY COMPONENT, 2014–2019 (USD MILLION)
  • TABLE 344 APPLICATION SECURITY MARKET, BY COMPONENT, 2020–2025 (USD MILLION)
  • TABLE 345 APPLICATION SECURITY MARKET, BY DEPLOYMENT MODE, 2014–2019 (USD MILLION)
  • TABLE 346 APPLICATION SECURITY MARKET, BY DEPLOYMENT MODE, 2020–2025 (USD MILLION)
  • TABLE 347 APPLICATION SECURITY MARKET, BY ORGANIZATION SIZE, 2014–2019 (USD MILLION)
  • TABLE 348 APPLICATION SECURITY MARKET, BY ORGANIZATION SIZE, 2020–2025 (USD MILLION)
  • TABLE 349 APPLICATION SECURITY MARKET, BY VERTICAL, 2014–2019 (USD MILLION)
  • TABLE 350 APPLICATION SECURITY MARKET, BY VERTICAL, 2020–2025 (USD MILLION)
  • TABLE 351 APPLICATION SECURITY MARKET, BY REGION, 2014–2019 (USD MILLION)
  • TABLE 352 APPLICATION SECURITY MARKET, BY REGION, 2020–2025 (USD MILLION)
  • TABLE 353 AUTOMATED BREACH AND ATTACK SIMULATION MARKET, BY OFFERING, 2017–2019 (USD THOUSAND)
  • TABLE 354 AUTOMATED BREACH AND ATTACK SIMULATION MARKET, BY OFFERING, 2020–2025 (USD THOUSAND)
  • TABLE 355 AUTOMATED BREACH AND ATTACK SIMULATION MARKET, BY SERVICE, 2017–2019 (USD THOUSAND)
  • TABLE 356 AUTOMATED BREACH AND ATTACK SIMULATION MARKET, BY SERVICE, 2020–2025 (USD THOUSAND)
  • TABLE 357 AUTOMATED BREACH AND ATTACK SIMULATION MARKET, BY DEPLOYMENT MODE, 2017–2019 (USD THOUSAND)
  • TABLE 358 AUTOMATED BREACH AND ATTACK SIMULATION MARKET, BY DEPLOYMENT MODE, 2020–2025 (USD THOUSAND)
  • TABLE 359 AUTOMATED BREACH AND ATTACK SIMULATION MARKET, BY APPLICATION, 2017–2019 (USD THOUSAND)
  • TABLE 360 AUTOMATED BREACH AND ATTACK SIMULATION MARKET, BY APPLICATION, 2020–2025 (USD THOUSAND)
  • TABLE 361 AUTOMATED BREACH AND ATTACK SIMULATION MARKET, BY END USER, 2017–2019 (USD THOUSAND)
  • TABLE 362 AUTOMATED BREACH AND ATTACK SIMULATION MARKET, BY END USER, 2020–2025 (USD THOUSAND)
  • TABLE 363 AUTOMATED BREACH AND ATTACK SIMULATION MARKET, BY REGION, 2017–2019 (USD THOUSAND)
  • TABLE 364 AUTOMATED BREACH AND ATTACK SIMULATION MARKET, BY REGION, 2020–2025 (USD THOUSAND)
  • TABLE 365 SECURITY TESTING MARKET, BY TESTING TYPE, 2014–2019 (USD MILLION)
  • TABLE 366 SECURITY TESTING MARKET, BY TESTING TYPE, 2020–2025 (USD MILLION)
  • TABLE 367 SECURITY TESTING MARKET, BY DEPLOYMENT MODE, 2014–2019 (USD MILLION)
  • TABLE 368 SECURITY TESTING MARKET, BY DEPLOYMENT MODE, 2020–2025 (USD MILLION)
  • TABLE 369 SECURITY TESTING MARKET, BY ORGANIZATION SIZE, 2014–2019 (USD MILLION)
  • TABLE 370 SECURITY TESTING MARKET, BY ORGANIZATION SIZE, 2020–2025 (USD MILLION)
  • TABLE 371 SECURITY TESTING MARKET, BY VERTICAL, 2014–2019 (USD MILLION)
  • TABLE 372 SECURITY TESTING MARKET, BY VERTICAL, 2020–2025 (USD MILLION)
  • TABLE 373 SECURITY TESTING MARKET, BY REGION, 2014–2019 (USD MILLION)
  • TABLE 374 SECURITY TESTING MARKET, BY REGION, 2020–2025 (USD MILLION)
LIST OF FIGURES
 
  • FIGURE 1 PENETRATION TESTING MARKET: RESEARCH DESIGN
  • FIGURE 2 APPROACH 1 TOP-DOWN (SUPPLY SIDE): REVENUE FROM SOFTWARE/SERVICES OF PENETRATION TESTING VENDORS
  • FIGURE 3 APPROACH 1 TOP-DOWN (SUPPLY SIDE) ANALYSIS
  • FIGURE 4 MARKET SIZE ESTIMATION METHODOLOGY: APPROACH 2, BOTTOM-UP (DEMAND SIDE): PRODUCTS/SOLUTIONS/SERVICES
  • FIGURE 5 MARKET: DATA TRIANGULATION
  • FIGURE 6 LIMITATIONS OF MARKET REPORT
  • FIGURE 7 MARKET TO WITNESS SIGNIFICANT GROWTH DURING FORECAST PERIOD
  • FIGURE 8 MARKET: REGIONAL SNAPSHOT
  • FIGURE 9 RISING NEED FOR SECURE WEB AND MOBILE APPLICATIONS TO DRIVE MARKET GROWTH
  • FIGURE 10 SERVICES SEGMENT TO ACCOUNT FOR LARGER MARKET SIZE DURING FORECAST PERIOD
  • FIGURE 11 BFSI VERTICAL TO LEAD MARKET DURING FORECAST PERIOD
  • FIGURE 12 ON-PREMISES DEPLOYMENT MODE TO DOMINATE DURING FORECAST PERIOD
  • FIGURE 13 LARGE ENTERPRISES SEGMENT TO EXHIBIT LARGER MARKET SIZE DURING FORECAST PERIOD
  • FIGURE 14 WEB APPLICATIONS SEGMENT TO LEAD DURING FORECAST PERIOD
  • FIGURE 15 ASIA PACIFIC TO EMERGE AS BEST MARKET FOR INVESTMENTS IN NEXT FIVE YEARS
  • FIGURE 16 MARKET: DRIVERS, RESTRAINTS, OPPORTUNITIES, AND CHALLENGES
  • FIGURE 17 MARKET: VALUE CHAIN
  • FIGURE 18 PENETRATION TESTING MARKET: ECOSYSTEM
  • FIGURE 19 NUMBER OF PATENTS GRANTED FOR MARKET, 2013–2023
  • FIGURE 20 REGIONAL ANALYSIS OF PATENTS GRANTED FOR MARKET
  • FIGURE 21 PORTER’S FIVE FORCES ANALYSIS: MARKET
  • FIGURE 22 MARKET: TRENDS AND DISRUPTIONS IMPACTING CUSTOMER BUSINESS
  • FIGURE 23 INFLUENCE OF STAKEHOLDERS ON BUYING PROCESS
  • FIGURE 24 KEY BUYING CRITERIA FOR TOP THREE VERTICALS
  • FIGURE 25 INVESTMENT AND FUNDING SCENARIO
  • FIGURE 26 SERVICES SEGMENT TO ACCOUNT FOR LARGER MARKET SIZE DURING FORECAST PERIOD
  • FIGURE 27 CLOUD-BASED DEPLOYMENT MODE TO RECORD HIGHER CAGR DURING FORECAST PERIOD
  • FIGURE 28 SMALL AND MEDIUM-SIZED ENTERPRISES SEGMENT TO RECORD HIGHER CAGR DURING FORECAST PERIOD
  • FIGURE 29 WEB APPLICATIONS SEGMENT TO LEAD MARKET DURING FORECAST PERIOD
  • FIGURE 30 HEALTHCARE VERTICAL TO RECORD HIGHEST GROWTH RATE DURING FORECAST PERIOD
  • FIGURE 31 ASIA PACIFIC TO RECORD HIGHEST CAGR DURING FORECAST PERIOD
  • FIGURE 32 NORTH AMERICA: MARKET SNAPSHOT
  • FIGURE 33 ASIA PACIFIC: MARKET SNAPSHOT
  • FIGURE 34 REVENUE ANALYSIS OF KEY PENETRATION TESTING VENDORS, 2019–2023 (USD MILLION)
  • FIGURE 35 VALUATION AND FINANCIAL METRICS OF KEY PENETRATION TESTING VENDORS, 2023
  • FIGURE 36 MARKET SHARE, 2023
  • FIGURE 37 BRAND COMPARISON/VENDOR PRODUCT LANDSCAPE
  • FIGURE 38 MARKET, COMPANY EVALUATION MATRIX FOR KEY PLAYERS, 2024
  • FIGURE 39 MARKET: OVERALL COMPANY FOOTPRINT
  • FIGURE 40 PENETRATION TESTING MARKET, COMPANY EVALUATION MATRIX FOR STARTUPS/SMES, 2024
  • FIGURE 41 RAPID7: COMPANY SNAPSHOT
  • FIGURE 42 SECUREWORKS: COMPANY SNAPSHOT
  • FIGURE 43 SYNOPSYS: COMPANY SNAPSHOT
  • FIGURE 44 CISCO SYSTEMS: COMPANY SNAPSHOT
  • FIGURE 45 IBM: COMPANY SNAPSHOT
  • FIGURE 46 CROWDSTRIKE: COMPANY SNAPSHOT
  • FIGURE 47 CIGNITI TECHNOLOGIES: COMPANY SNAPSHOT
  • FIGURE 48 FORTINET: COMPANY SNAPSHOT


The research study involved significant activities in estimating the penetration testing market size. Exhaustive secondary research utilized various secondary sources about the market and peer markets. To gather information for analyzing the penetration testing market. The next step has been to validate these findings and assumptions and size them with the help of primary research with industry experts across the value chain. Primary sources included interviews with industry experts, suppliers, manufacturers, and other stakeholders across the market's value chain. These interviews with key industry figures and subject matter experts aimed to gather qualitative and quantitative data, ensuring accuracy and reliability in assessing market trends and prospects. Both top-down and bottom-up approaches have been used to estimate the market size. Post which the market breakdown and data triangulation have been adopted to estimate the market sizes of segments and sub-segments.

Secondary Research

In the secondary research process, various secondary sources were referred to identify and collect information for the study. These included journals, annual reports, press releases, investor presentations of companies and white papers, certified publications, and articles from recognized associations and government publishing sources. Secondary research was mainly used to obtain critical information about industry insights, the market's monetary chain, the overall pool of key players, market classification, and segmentation according to industry trends to the bottom-most level, regional markets, and key developments from both market and technology-oriented perspectives.

Primary Research

In the primary research process, various primary sources from both the supply and demand sides were interviewed to obtain qualitative and quantitative information for the report. The primary sources from the supply side included industry experts, such as Chief Executive Officers (CEOs), Chief Technology Officers (CTOs), Chief Operating Officers (COOs), Vice Presidents (VPs), marketing directors, technology and innovation directors, and related key executives from various companies and organizations operating in the penetration testing market. The primary sources from the demand side included consultants/specialists, Chief Information Officers (CIOs), and subject-matter experts.
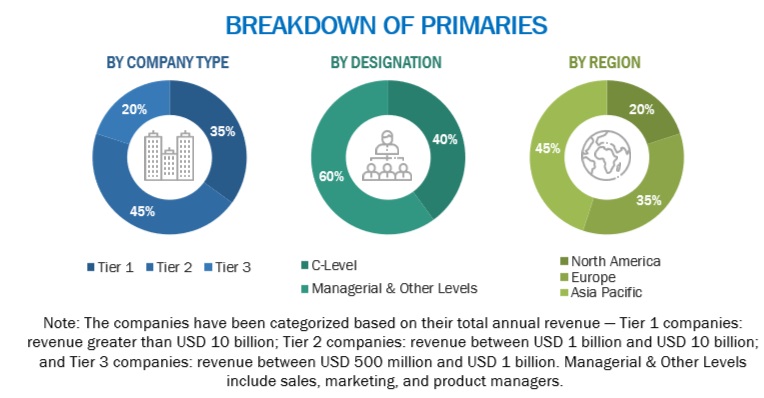
Penetration Testing  Market Size, and Share

To know about the assumptions considered for the study, download the pdf brochure

Market Size Estimation

Multiple approaches were adopted to estimate and forecast the penetration testing market. The first approach involved estimating the market size by summating companies' revenue generated through penetration testing solutions.

Both top-down and bottom-up approaches were used to estimate and validate the total size of the penetration testing market. The research methodology used to estimate the market size includes the following:

  • Key players in the penetration testing were identified through secondary research, and their revenue contributions in the respective regions were determined through primary and secondary research
  • Regarding value, primary and secondary research have determined the industry's supply chain and market size.
  • All percentage shares, splits, and breakups have been determined using secondary sources and verified through primary sources.

All the possible parameters that impact the market covered in this research study have been accounted for, viewed in extensive detail, verified through primary research, and analyzed to get the final quantitative and qualitative data. This data is consolidated and added with detailed inputs and analysis from MarketsandMarkets.

Market Size Estimation Methodology-Bottom-up approach
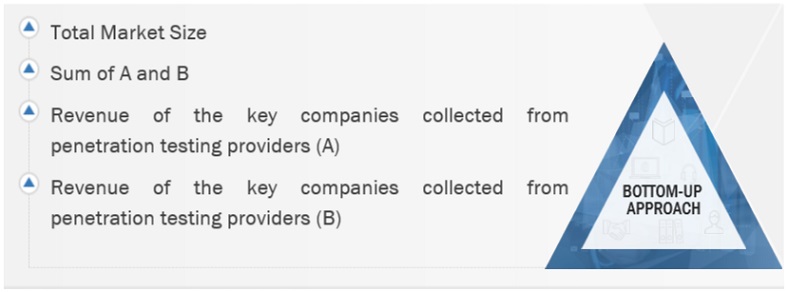
Penetration Testing  Market Bottom Up Approach

To know about the assumptions considered for the study, Request for Free Sample Report

Market Size Estimation Methodology-top-down approach

Penetration Testing  Market Top Down Approach

Data Triangulation

The data triangulation procedures were used to complete the overall market engineering process and arrive at the exact statistics for all segments and subsegments. The data was triangulated by studying various factors and trends from the demand and supply sides. Along with data triangulation and market breakdown, the market size was validated by the top-down and bottom-up approaches.

Market Definition

The penetration testing market is experiencing exponential growth, catering to businesses seeking robust defenses against cyber threats. This sector offers multifaceted solutions encompassing vulnerability detection and social media surveillance to preemptively detect references to a company or its brand, thereby averting potential reputational damage and security breaches. Additionally, these services extend to identifying and eliminating instances of unauthorized replication of a company's intellectual property, safeguarding its innovations and assets. Moreover, in the event of security incidents, these platforms facilitate swift and effective response strategies, mitigating the impact of breaches and enhancing overall cybersecurity posture. The penetration testing market presents a comprehensive suite of tools and services essential for modern enterprises to proactively combat the evolving landscape of cyber threats.

Key Stakeholders

  • Government bodies and public safety agencies
  • Project managers
  • Developers
  • Business analysts
  • Quality Assurance (QA)/test engineers
  • Providers of penetration testing solutions and services
  • Consulting firms
  • Third-party vendors
  • Investors and venture capitalists
  • Technology providers

The main objectives of this study are as follows:

  • To describe and forecast the global penetration testing market by offering, type, deployment mode, organization size, vertical, and region
  • To forecast the market size of five central regions: North America, Europe, Asia Pacific (APAC), Middle East and Africa (MEA), and Latin America
  • To analyze the subsegments of the market concerning individual growth trends, prospects, and contributions to the overall market
  • To provide detailed information related to significant factors (drivers, restraints, opportunities, and challenges) influencing the growth of the market
  • To analyze the opportunities in the market for stakeholders and provide the competitive landscape details of major players
  • To profile the key players of the market and comprehensively analyze their market shares and core competencies
  • To track and analyze competitive developments, such as Mergers and Acquisitions (M&A), new product developments, and partnerships and collaborations in the market
  • To track and analyze the impact of COVID-19 on the penetration testing market

Available Customizations

With the given market data, MarketsandMarkets offers customizations per the company's specific needs. The following customization options are available for the report:

Company Information

  • Detailed analysis and profiling of additional market players (up to 5)
Custom Market Research Services

We will customize the research for you, in case the report listed above does not meet with your exact requirements. Our custom research will comprehensively cover the business information you require to help you arrive at strategic and profitable business decisions.

Request Customization

Instant Answers with GPT - Ask Now!

Ask real questions. Get complete answers !
Report Code
TC 4532
Published ON
Apr, 2024
Choose License Type
BUY NOW
  • SHARE
X
Request Customization
Speak to Analyst
Speak to Analyst
OR FACE-TO-FACE MEETING
PERSONALIZE THIS RESEARCH
  • Triangulate with your Own Data
  • Get Data as per your Format and Definition
  • Gain a Deeper Dive on a Specific Application, Geography, Customer or Competitor
  • Any level of Personalization
REQUEST A FREE CUSTOMIZATION
LET US HELP YOU!
  • What are the Known and Unknown Adjacencies Impacting the Penetration Testing Market
  • What will your New Revenue Sources be?
  • Who will be your Top Customer; what will make them switch?
  • Defend your Market Share or Win Competitors
  • Get a Scorecard for Target Partners
CUSTOMIZED WORKSHOP REQUEST
knowledgestore logo

Want to explore hidden markets that can drive new revenue in Penetration Testing Market?

Find Hidden Markets
  • Call Us
  • +1-888-600-6441 (Corporate office hours)
  • +1-888-600-6441 (US/Can toll free)
  • +44-800-368-9399 (UK office hours)
CONNECT WITH US
ABOUT TRUST ONLINE
©2024 MarketsandMarkets Research Private Ltd. All rights reserved
DMCA.com Protection Status
Website Feedback