Medical Device Testing Market

Medical Device Testing Market by Service (Testing, Inspection, Certification), Sourcing (In-house, Outsourced), Technology (Active Implant, Active, Non-active, IVD, Ophthalmic, Orthopedic & Dental, Vascular), Class (I, II, III) – Global Forecast to 2028

Report Code: SE 5802 Oct, 2023, by marketsandmarkets.com

[215 Pages Report] The global medical device testing market size is expected to be valued at USD 10.6 billion in 2023 and is projected to reach USD 13.5 billion by 2028; it is expected to grow at a CAGR of 4.9% from 2023 to 2028. The expansion of the global healthcare sector presents a substantial opportunity for stakeholders in the market. With healthcare accessibility improving, especially in emerging markets, the demand for advanced medical devices is on the rise due to factors such as a growing population, increased disposable incomes, and heightened awareness of healthcare and well-being.

Medical Device Testing Market

Medical Device Testing Market

Medical Device Testing Market Forecast to 2028

To know about the assumptions considered for the study, Request for Free Sample Report

Medical device testing market dynamics

Driver: The global expansion of the healthcare industry

The global expansion of the healthcare industry represents a significant opportunity for various stakeholders within the medical device testing market. As healthcare access improves across the world, particularly in emerging markets, there is a growing demand for advanced medical devices. This demand is fueled by an increasing population, rising disposable incomes, and a growing awareness of healthcare and wellness. Consequently, there is a need for robust testing services to ensure the safety, efficacy, and compliance of these devices with stringent regulatory standards. Testing facilities and services play a vital role in supporting the global expansion of the healthcare industry by providing the necessary assurance to manufacturers, healthcare providers, and patients, thus contributing to the overall growth and credibility of the medical device sector on a global scale.

Restraint: Quality concerns and product recalls for medical devices

Quality concerns and the associated risk of product recalls represent a critical restraint for the medical device testing market. Ensuring the quality and safety of medical devices is paramount, particularly for high-risk devices like pacemakers, coronary stents, and artificial heart valves. A lapse in quality control can have severe consequences, including injuries to end-users or even fatalities. Any compromised quality can lead to product recalls, causing financial losses and reputational damage for manufacturers. Moreover, the potential consequences of poor quality in medical devices, such as product recalls and harm to patients, intensify the need for meticulous testing. Inadequate testing or failure to meet regulatory standards can result in legal, financial, and reputational damage for manufacturers. The need to avoid these significant risks necessitates thorough and meticulous testing processes, adding complexity and costs to the development and testing phases of medical devices. Achieving optimal quality and reducing the risk of recalls are persistent challenges for companies in the market.

Opportunity: Connectivity of mobile devices with medical equipment

The merging of mobile technology with medical devices is revolutionizing healthcare. Through dedicated applications and connectivity, mobile devices seamlessly connect with medical equipment, empowering individuals to monitor and manage their health on-the-go. This integration improves accessibility and facilitates timely interventions, resulting in enhanced health outcomes. Rapid advancements in wireless technologies and sensor-based devices have given rise to a new wave of mobile medical devices, significantly enhancing patient quality-of-life while reducing healthcare costs for both providers and patients. The compact size and networking capabilities of these mobile medical devices offer considerable advantages, allowing patients to make fewer hospital visits and giving healthcare providers the benefit of reduced administrative overheads and care expenses.

Challenge: Intricate nature of supply chains in medical device testing

The medical device testing supply chains face rigorous regulatory demands, presenting a notable challenge. As components are often procured worldwide, ensuring a smooth supply chain while upholding stringent quality control and compliance standards proves difficult. The complexity arises from the need to manage multiple suppliers, coordinate logistics, and ensure consistent safety and quality standards throughout the testing process in today's interconnected global economy. In contemporary manufacturing, optimizing costs and profits involves sourcing components globally. However, this approach introduces heightened risks in managing intricate supply chains, further complicated by evolving international trade regulations. The ongoing reviews and frequent changes in trade agreements among nations add to the complexity, influenced by economic and geopolitical factors.

Medical Device Testing Market Ecosystem

The medical device testing market is dominated by established and financially sound manufacturers with extensive experience in the industry. These companies have diversified product portfolios, cutting-edge technologies, and strong global sales and marketing networks. Leading players in the market include Knowles Eurofins Scientific from Luxembourg, Intertek Group plc from the UK, SGS Société Générale de Surveillance SA. from Switzerland, Bureau Veritas from France, and TÜV SÜD from Germany.

Medical Device Testing Market by Ecosystem

Testing services segment is expected to hold the highest market share during the forecast period

Testing services hold a significant market share in the medical device testing industry due to their crucial role in ensuring regulatory compliance, safety, and quality of medical devices. The healthcare sector is highly regulated, necessitating comprehensive testing to meet stringent standards set by regulatory bodies like the Food & Drug Administration of US (FDA) and European Commission (EC). Through thorough evaluations, testing services confirm that devices function effectively, pose no risks to patients, and meet specified performance benchmarks. This instills confidence in healthcare professionals and end-users, facilitating market access and fostering trust. Outsourcing to specialized testing facilities grants access to expertise and advanced technology, further driving the prominence of testing services in the medical device testing market.

Based on device class, the class III to hold the highest market share during the forecast period

Class III medical devices, the highest risk category, require the most rigorous testing and scrutiny in the medical device testing market. These devices, such as pacemakers and implantable defibrillators, undergo extensive testing to ensure their safety, efficacy, and compliance with strict regulatory standards imposed by bodies like the FDA. The complexity and criticality of Class III devices necessitate comprehensive evaluation across multiple parameters, including biocompatibility, performance, sterility, and more. The growth of Class III devices in the market is propelled by their increasing complexity and critical nature, necessitating comprehensive and stringent testing procedures. Regulatory requirements for Class III devices are particularly demanding, driving the demand for rigorous testing to ensure compliance and safety. Additionally, the rising development and adoption of advanced medical technologies, such as implantable devices, contribute to the expanding market for Class III device testing. Manufacturers' emphasis on thorough testing to meet regulatory standards and deliver high-quality, innovative healthcare solutions further fuels the growth of Class III devices in the medical device testing sector.

IVD medical devices for medical device testing market to hold the highest market share

In Vitro Diagnostic (IVD) medical devices, ranging from diagnostic kits to molecular assays, hold a significant market share in medical device testing. These devices play a pivotal role in healthcare, aiding in disease diagnosis, monitoring, and treatment decisions. The demand for IVD medical device testing stems from the critical importance of accurate and reliable diagnostic results in healthcare decision-making. Stringent regulatory requirements necessitate rigorous testing to ensure precision, sensitivity, and specificity of these devices. Furthermore, the increasing prevalence of infectious diseases and chronic conditions fuels the demand for innovative IVD devices, driving the growth of testing services to validate their effectiveness and compliance with regulatory standards.

Medical device testing market in Asia Pacific to hold the highest CAGR during the forecast period

Rapid economic development and industrialization in countries like China and India are driving substantial investments in healthcare and technology, fueling the demand for medical device testing services. Moreover, evolving regulatory frameworks in the region are placing increased emphasis on quality and safety standards for medical devices, necessitating comprehensive testing. Additionally, the burgeoning middle-class population with higher disposable income is demanding superior healthcare services, boosting the need for advanced medical devices and, consequently, the testing thereof. Lastly, the surge in medical tourism and the aspiration to meet international market standards are further propelling the growth of the market in the Asia-Pacific region.

Medical Device Testing Market by Region

Medical Device Testing Market by Region

To know about the assumptions considered for the study, download the pdf brochure

Key Market Players

 The medical device testing companies is dominated by players such as Eurofins Scientific (Luxembourg), Intertek Group plc (UK), SGS Société Générale de Surveillance SA. (Switzerland), Bureau Veritas (France), TÜV SÜD (Germany) and others.

Get online access to the report on the World's First Market Intelligence Cloud

  • Easy to Download Historical Data & Forecast Numbers
  • Company Analysis Dashboard for high growth potential opportunities
  • Research Analyst Access for customization & queries
  • Competitor Analysis with Interactive dashboard
  • Latest News, Updates & Trend analysis
Request Sample

Scope of the Report

Report Metric

Details

Estimated Value

USD 10.6 billion

Expected Value 

USD 13.5 billion

Growth Rate

CAGR of 4.9%

Market size available for years

2019-2028

Base year considered

2022

Forecast period

2023-2028

Forecast units

Value (USD Million/Billion)

Segments Covered

By Service Type, By Sourcing Type, By Device Class, By Technology

Geographies covered

North America, Europe, Asia Pacific, and RoW

Companies covered

The major market players include Eurofins Scientific (Luxembourg), Intertek Group plc (UK), SGS Société Générale de Surveillance SA. (Switzerland), Bureau Veritas (France), TÜV SÜD (Germany), (Total of 25 players are profiled)

Medical Device Testing Market Highlights

The study categorizes the medical device testing market based on the following segments:

Segment

Subsegment

By Service Type

  • Testing Services
  • Inspection Services
  • Certification Services
  • Others

By Sourcing Type

  • In-house
  • Outsourced

By Device Class

  • Class I
  • Class II
  • Class III

By Technology

  • Active Implant Medical Devices
  • Active Medical Devices
  • Non-active Medical Devices
  • IVD Medical Devices
  • Ophthalmic Medical Devices
  • Orthopedic Medical Devices
  • Vascular Medical Devices
  • Others

By Region

  • North America
  • Europe
  • Asia Pacific
  • RoW

Recent Developments

  • In June 2023, TÜV SÜD has opened a laboratory in New Brighton, Minnesota, accredited to ISO 17025 for biological and chemical testing of medical devices. Staffed by experienced scientists and technicians, the lab will cater to both domestic and international medical device companies, aiding in research and development through microbiology, reusable device testing, chemistry, biocompatibility, and packaging testing services.
  • In September 2022, Bureau Veritas has acquired Galbraith Laboratories Inc., known for advanced analytical solutions in healthcare. This acquisition amplifies Bureau Veritas' presence in Consumer Healthcare and Industrial Chemicals supply chains, bolstering support for research, development, and product testing. Galbraith Laboratories' expertise will enhance Bureau Veritas' service portfolio, particularly in medical device testing, expanding its reach and influence in the US.
  • In July 2022, Eurofins Scientific acquired WESSLING (Hungary) to enhance its environmental, food, and BioPharma product testing offerings in the European region.
  • In October 2021, SGS acquired Groupe IDEA TESTS (IDEA), a leading provider of clinical, microbiological, and in-vitro testing and regulatory services to cosmetic & personal care product manufacturers in France. The acquisition is likely to help SGS to offer enhanced services to customers from the strategic markets of cosmetics & hygiene.

Frequently Asked Questions:

To speak to our analyst for a discussion on the above findings, click Speak to Analyst

TABLE OF CONTENTS
 
1 INTRODUCTION (Page No. - 28)
    1.1 STUDY OBJECTIVES 
    1.2 MARKET DEFINITION 
           1.2.1 INCLUSIONS AND EXCLUSIONS
    1.3 STUDY SCOPE 
           FIGURE 1 MEDICAL DEVICE TESTING MARKET: MARKET SEGMENTATION 
           1.3.1 REGIONAL SCOPE
           1.3.2 YEARS CONSIDERED
    1.4 CURRENCY CONSIDERED 
    1.5 LIMITATIONS 
    1.6 STAKEHOLDERS 
    1.7 SUMMARY OF CHANGES 
    1.8 IMPACT OF RECESSION 
 
2 RESEARCH METHODOLOGY (Page No. - 33)
    2.1 RESEARCH DATA 
           FIGURE 2 MEDICAL DEVICE TESTING MARKET: RESEARCH DESIGN 
           2.1.1 SECONDARY AND PRIMARY RESEARCH
           2.1.2 SECONDARY DATA
                    2.1.2.1 Major secondary sources
                    2.1.2.2 Secondary sources
           2.1.3 PRIMARY DATA
           2.1.4 BREAKDOWN OF PRIMARIES
                    2.1.4.1 Key data from primary sources
    2.2 MARKET SIZE ESTIMATION 
           FIGURE 3 PROCESS FLOW OF MARKET SIZE ESTIMATION 
           2.2.1 BOTTOM-UP APPROACH
                    2.2.1.1 Approach to estimate market share by bottom-up analysis (demand side)
                               FIGURE 4 MARKET SIZE ESTIMATION: BOTTOM-UP APPROACH 
           2.2.2 TOP-DOWN APPROACH
                    2.2.2.1 Approach to estimate market share by top-down analysis (supply side)
                               FIGURE 5 MARKET SIZE ESTIMATION: TOP-DOWN APPROACH 
                               FIGURE 6 MARKET SIZE ESTIMATION: TOP-DOWN APPROACH (SUPPLY SIDE)—REVENUE GENERATED FROM MEDICAL DEVICE TESTING SERVICES 
                    2.2.2.2 Key industry insights
    2.3 DATA TRIANGULATION 
           FIGURE 7 DATA TRIANGULATION 
    2.4 RESEARCH ASSUMPTIONS 
           FIGURE 8 ASSUMPTIONS FOR RESEARCH STUDY 
    2.5 RISK ASSESSMENT 
    2.6 PARAMETERS CONSIDERED TO ANALYZE IMPACT OF RECESSION ON MARKET 
    2.7 RESEARCH LIMITATIONS 
           FIGURE 9 LIMITATIONS FOR RESEARCH STUDY 
 
3 EXECUTIVE SUMMARY (Page No. - 45)
    FIGURE 10 IVD MEDICAL DEVICES SEGMENT TO CAPTURE LARGEST SHARE OF MARKET IN 2028 
    FIGURE 11 TESTING SERVICES TO COMMAND LARGEST SHARE OF MARKET IN 2028 
    FIGURE 12 IN-HOUSE SEGMENT TO ACCOUNT FOR LARGER SHARE OF MARKET FROM 2023 TO 2028 
    FIGURE 13 NORTH AMERICA ACCOUNTED FOR LARGEST SHARE OF MARKET IN 2022 
 
4 PREMIUM INSIGHTS (Page No. - 49)
    4.1 ATTRACTIVE OPPORTUNITIES FOR PLAYERS IN MEDICAL DEVICE TESTING MARKET 
           FIGURE 14 STRINGENT REGULATORY STANDARDS PERTAINING TO MEDICAL DEVICES TO BOOST MARKET GROWTH 
    4.2 MARKET, BY SERVICE TYPE 
           FIGURE 15 TESTING SERVICES SEGMENT TO COMMAND LARGEST SHARE OF MEDICAL DEVICE TESTING MARKET IN 2028 
    4.3 MARKET, BY TECHNOLOGY 
           FIGURE 16 ACTIVE IMPLANT MEDICAL DEVICES SEGMENT TO REGISTER HIGHEST CAGR FROM 2023 TO 2028 
    4.4 MARKET, BY SOURCING TYPE 
           FIGURE 17 IN-HOUSE SEGMENT TO ACCOUNT FOR LARGER SHARE OF MEDICAL DEVICE TESTING MARKET FROM 2023 TO 2028 
    4.5 MARKET, BY DEVICE CLASS 
           FIGURE 18 CLASS III SEGMENT TO REGISTER HIGHEST CAGR IN MEDICAL DEVICE TESTING MARKET FROM 2023 TO 2028 
    4.6 NORTH AMERICA: MEDICAL DEVICE TESTING MARKET, BY TECHNOLOGY AND COUNTRY 
           FIGURE 19 IVD MEDICAL DEVICES AND US HELD LARGEST SHARE OF MARKET IN NORTH AMERICA IN 2022 
    4.7 REGIONAL SNAPSHOT OF MARKET 
           FIGURE 20 MARKET IN INDIA TO GROW AT FASTEST RATE DURING FORECAST PERIOD 
 
5 MARKET OVERVIEW (Page No. - 53)
    5.1 INTRODUCTION 
    5.2 MARKET DYNAMICS 
    FIGURE 21 DRIVERS, RESTRAINTS, OPPORTUNITIES, AND CHALLENGES: MEDICAL DEVICE TESTING MARKET 
           5.2.1 DRIVERS
                    FIGURE 22 ANALYSIS OF IMPACT OF DRIVERS ON MARKET 
                    5.2.1.1 Expansion of global healthcare industry
                    5.2.1.2 Need to meet stringent industry regulations with advancements in medical devices
                    5.2.1.3 Increasing emphasis on validation and verification of medical devices
                    5.2.1.4 Enforcement of stringent regulations by governments worldwide
                               TABLE 1 COMMON FRAMEWORK FOR MEDICAL DEVICE REGULARIZATION 
                    5.2.1.5 Shift toward outsourcing of medical device testing services
                    5.2.1.6 Increased focus on testing of medical devices post emergence of COVID-19 pandemic
                    5.2.1.7 Integration of advanced technologies with medical equipment
                               TABLE 2 LIST OF STANDARDS RELATED TO WIRELESS MEDICAL DEVICES 
           5.2.2 RESTRAINT
                    FIGURE 23 ANALYSIS OF IMPACT OF RESTRAINT ON MEDICAL DEVICE TESTING MARKET 
                    5.2.2.1 Lengthy and expensive licensing procedures hindering development of medical devices
           5.2.3 OPPORTUNITIES
                    FIGURE 24 ANALYSIS OF IMPACT OF OPPORTUNITIES ON MARKET 
                    5.2.3.1 Harmonization of standards in medical device industry
                    5.2.3.2 Technological advancements in medical device testing
           5.2.4 CHALLENGES
                    FIGURE 25 ANALYSIS OF IMPACT OF CHALLENGES ON MARKET 
                    5.2.4.1 Complexities of managing global supply chains in medical device testing
                    5.2.4.2 Long lead times required for overseas qualification tests for medical devices
    5.3 VALUE CHAIN ANALYSIS 
           FIGURE 26 MEDICAL DEVICE TESTING MARKET: VALUE CHAIN ANALYSIS 
    5.4 MEDICAL DEVICE TESTING MARKET: ECOSYSTEM MAPPING 
           5.4.1 TIC STANDARDS AND REGULATORY BODIES
           5.4.2 TIC SERVICE PROVIDERS
                    FIGURE 27 MEDICAL DEVICE TESTING MARKET: KEY PLAYERS IN ECOSYSTEM 
    5.5 TRENDS/DISRUPTIONS IMPACTING CUSTOMER BUSINESS 
           FIGURE 28 TRENDS/DISRUPTIONS IMPACTING CUSTOMER BUSINESS 
    5.6 TECHNOLOGY TRENDS 
           5.6.1 3D PRINTING AND PROTOTYPING
           5.6.2 INTERNET OF THINGS (IOT) AND CONNECTIVITY
           5.6.3 AUGMENTED REALITY (AR) AND VIRTUAL REALITY (VR)
           5.6.4 ARTIFICIAL INTELLIGENCE (AI)
           5.6.5 MACHINE LEARNING (ML)
 
6 MEDICAL DEVICE TESTING MARKET, BY TESTING TYPE (Page No. - 68)
    6.1 INTRODUCTION 
    6.2 ELECTROMAGNETIC COMPATIBILITY 
           6.2.1 PROLIFERATION OF WIRELESS TECHNOLOGIES TO NECESSITATE ELECTROMAGNETIC COMPATIBILITY TESTING OF MEDICAL DEVICES
                    TABLE 3 COMMON STANDARDS FOR MEDICAL DEVICE REGULARIZATION IN EUROPEAN NATIONS 
    6.3 ELECTRICAL SAFETY 
           6.3.1 STRINGENT SAFETY MEASURES TO DRIVE DEMAND FOR ELECTRICAL SAFETY TESTS
    6.4 WIRELESS CONNECTIVITY 
           6.4.1 INTEGRATION OF CONNECTED HEALTH TECHNOLOGIES IN MEDICAL DEVICES TO FUEL DEMAND FOR WIRELESS CONNECTIVITY TESTING
    6.5 ENVIRONMENTAL TESTING 
           6.5.1 INCREASING COMPLEXITY OF MEDICAL DEVICES TO NECESSITATE ENVIRONMENTAL TESTING
    6.6 MECHANICAL TESTING 
           6.6.1 GROWING SOPHISTICATION OF MEDICAL DEVICES TO CONTRIBUTE TO DEMAND FOR MECHANICAL TESTING SERVICES
    6.7 CHEMICAL, PHYSICAL, AND BIOCOMPATIBILITY TESTING 
           6.7.1 STRINGENT REGULATIONS ON MEDICAL DEVICES FOR PATIENT SAFETY TO FOSTER MARKET GROWTH
    6.8 CYBERSECURITY TESTING 
           6.8.1 RISING CYBER ATTACKS ON MEDICAL DEVICES TO NECESSITATE CYBERSECURITY TESTING
                    TABLE 4 MEMORANDA OF UNDERSTANDING ON CYBERSECURITY IN MEDICAL DEVICES 
 
7 MEDICAL DEVICE TESTING MARKET, BY SERVICE TYPE (Page No. - 74)
    7.1 INTRODUCTION 
           FIGURE 29 CERTIFICATION SERVICES SEGMENT TO EXHIBIT HIGHEST CAGR IN MARKET DURING FORECAST PERIOD 
           TABLE 5 MARKET, BY SERVICE TYPE, 2019–2022 (USD MILLION) 
           TABLE 6 MARKET, BY SERVICE TYPE, 2023–2028 (USD MILLION) 
    7.2 TESTING SERVICES 
           7.2.1 RISING FOCUS ON ENSURING COMPLIANCE WITH REGULATORY STANDARDS TO DRIVE DEMAND FOR TESTING SERVICES
    7.3 INSPECTION SERVICES 
           7.3.1 INCREASING EMPHASIS ON IMPROVING QUALITY OF MEDICAL DEVICES TO BOOST DEMAND FOR INSPECTION SERVICES
    7.4 CERTIFICATION SERVICES 
           7.4.1 GROWING STRINGENCY OF NORMS AND REGULATIONS PERTAINING TO MEDICAL DEVICES TO BOOST DEMAND FOR CERTIFICATION SERVICES
    7.5 OTHERS 
 
8 MEDICAL DEVICE TESTING MARKET, BY SOURCING TYPE (Page No. - 79)
    8.1 INTRODUCTION 
           FIGURE 30 OUTSOURCED SEGMENT TO REGISTER HIGHEST CAGR IN MARKET DURING FORECAST PERIOD 
           TABLE 7 MARKET, BY SOURCING TYPE, 2019–2022 (USD MILLION) 
           TABLE 8 MARKET, BY SOURCING TYPE, 2023–2028 (USD MILLION) 
    8.2 IN-HOUSE 
           8.2.1 CAPABILITY TO MEET CUSTOMIZED TESTING REQUIREMENTS FOR SPECIFIC DEVICES TO BOOST DEMAND FOR IN-HOUSE TESTING
    8.3 OUTSOURCED 
           8.3.1 INCREASING FOCUS ON EXPEDITING PRODUCT DEVELOPMENT TO LEAD TO OUTSOURCING OF MEDICAL DEVICE TESTING
 
9 MEDICAL DEVICE TESTING MARKET, BY DEVICE CLASS (Page No. - 83)
    9.1 INTRODUCTION 
    9.2 REGIONAL CLASS DIFFERENTIATION 
           9.2.1 US
                    9.2.1.1 Class I: General controls
                    9.2.1.2 Class II: General controls with special controls
                    9.2.1.3 Class III: General controls, special controls, and pre-market approval
           9.2.2 EUROPEAN UNION AND EUROPEAN FREE TRADE ASSOCIATION
           9.2.3 CANADA
           9.2.4 AUSTRALIA
                    FIGURE 31 CLASS III SEGMENT TO DOMINATE MEDICAL TESTING MARKET DURING FORECAST PERIOD 
                    TABLE 9 MARKET, BY DEVICE CLASS, 2019–2022 (USD MILLION) 
                    TABLE 10 MARKET, BY DEVICE CLASS, 2023–2028 (USD MILLION) 
    9.3 CLASS I 
           9.3.1 RAPID INCREASE IN DEMAND FOR ESSENTIAL HEALTHCARE PRODUCTS TO DRIVE MARKET
    9.4 CLASS II 
           9.4.1 GROWING DEMAND FOR MONITORING AND DIAGNOSTIC DEVICES IN HEALTHCARE TO DRIVE CLASS II MEDICAL DEVICE TESTING
    9.5 CLASS III 
           9.5.1 ADVANCEMENTS IN IMPLANTABLE TECHNOLOGIES TO INDUCE DEMAND FOR TESTING OF CLASS III DEVICES
 
10 MEDICAL DEVICE TESTING MARKET, BY TECHNOLOGY (Page No. - 88)
     10.1 INTRODUCTION 
              FIGURE 32 IVD MEDICAL DEVICES SEGMENT TO DOMINATE MEDICAL DEVICE TESTING MARKET DURING FORECAST PERIOD 
              TABLE 11 MARKET, BY TECHNOLOGY, 2019–2022 (USD MILLION) 
              TABLE 12 MARKET, BY TECHNOLOGY, 2023–2028 (USD MILLION) 
     10.2 ACTIVE IMPLANT MEDICAL DEVICES 
             10.2.1 INCREASING PREVALENCE OF CHRONIC DISEASES TO NECESSITATE USE OF MEDICAL IMPLANTS
                        TABLE 13 ACTIVE IMPLANT MEDICAL DEVICES: MARKET, BY REGION, 2019–2022 (USD MILLION) 
                        TABLE 14 ACTIVE IMPLANT MEDICAL DEVICES: MARKET, BY REGION, 2023–2028 (USD MILLION) 
                        TABLE 15 ACTIVE IMPLANT MEDICAL DEVICES: MARKET, BY SERVICE TYPE, 2019–2022 (USD MILLION) 
                        TABLE 16 ACTIVE IMPLANT MEDICAL DEVICES: MARKET, BY SERVICE TYPE, 2023–2028 (USD MILLION) 
     10.3 ACTIVE MEDICAL DEVICES 
             10.3.1 NEED FOR CONTINUOUS MONITORING OF PATIENTS WITH CHRONIC DISEASES TO DRIVE SEGMENT
                        TABLE 17 ACTIVE MEDICAL DEVICES: MARKET, BY REGION, 2019–2022 (USD MILLION) 
                        TABLE 18 ACTIVE MEDICAL DEVICES: MARKET, BY REGION, 2023–2028 (USD MILLION) 
                        TABLE 19 ACTIVE MEDICAL DEVICES: MARKET, BY SERVICE TYPE, 2019–2022 (USD MILLION) 
                        TABLE 20 ACTIVE MEDICAL DEVICES: MEDICAL DEVICE TESTING MARKET, BY SERVICE TYPE, 2023–2028 (USD MILLION) 
     10.4 NON-ACTIVE MEDICAL DEVICES 
             10.4.1 INCREASING NUMBER OF SURGICAL PROCEDURES TO FUEL DEMAND FOR TESTING OF NON-ACTIVE MEDICAL DEVICES
                        TABLE 21 NON-ACTIVE MEDICAL DEVICES: MARKET, BY REGION, 2019–2022 (USD MILLION) 
                        TABLE 22 NON-ACTIVE MEDICAL DEVICES: MARKET, BY REGION, 2023–2028 (USD MILLION) 
                        TABLE 23 NON-ACTIVE MEDICAL DEVICES: MARKET, BY SERVICE TYPE, 2019–2022 (USD MILLION) 
                        TABLE 24 NON-ACTIVE MEDICAL DEVICES: MARKET, BY SERVICE TYPE, 2023–2028 (USD MILLION) 
     10.5 IN VITRO DIAGNOSTIC (IVD) MEDICAL DEVICES 
             10.5.1 NEED TO ENSURE ACCURACY OF DIAGNOSTIC INFORMATION TO CREATE DEMAND FOR TESTING OF IVD MEDICAL DEVICES
                        TABLE 25 IVD MEDICAL DEVICES: MARKET, BY REGION, 2019–2022 (USD MILLION) 
                        TABLE 26 IVD MEDICAL DEVICES: MARKET, BY REGION, 2023–2028 (USD MILLION) 
                        TABLE 27 IVD MEDICAL DEVICES: MARKET, BY SERVICE TYPE, 2019–2022 (USD MILLION) 
                        TABLE 28 IVD MEDICAL DEVICES: MEDICAL DEVICE TESTING MARKET, BY SERVICE TYPE, 2023–2028 (USD MILLION) 
     10.6 OPHTHALMIC MEDICAL DEVICES 
             10.6.1 INCREASING PREVALENCE OF EYE DISEASES TO INDUCE DEMAND FOR TESTING OF OPHTHALMIC MEDICAL DEVICES
                        TABLE 29 OPHTHALMIC MEDICAL DEVICES: MARKET, BY REGION, 2019–2022 (USD MILLION) 
                        TABLE 30 OPHTHALMIC MEDICAL DEVICES: MARKET, BY REGION, 2023–2028 (USD MILLION) 
                        TABLE 31 OPHTHALMIC MEDICAL DEVICES: MARKET, BY SERVICE TYPE, 2019–2022 (USD MILLION) 
                        TABLE 32 OPHTHALMIC MEDICAL DEVICES: MARKET, BY SERVICE TYPE, 2023–2028 (USD MILLION) 
     10.7 ORTHOPEDIC & DENTAL DEVICES 
             10.7.1 NEED TO VALIDATE DURABILITY AND PROPER FUNCTIONING OF ORTHOPEDIC DEVICES TO FUEL DEMAND FOR TESTING SERVICES
                        TABLE 33 ORTHOPEDIC & DENTAL DEVICES: MARKET, BY REGION, 2019–2022 (USD MILLION) 
                        TABLE 34 ORTHOPEDIC & DENTAL DEVICES: MARKET, BY REGION, 2023–2028 (USD MILLION) 
                        TABLE 35 ORTHOPEDIC & DENTAL DEVICES: MARKET, BY SERVICE TYPE, 2019–2022 (USD MILLION) 
                        TABLE 36 ORTHOPEDIC & DENTAL DEVICES: MARKET, BY SERVICE TYPE, 2023–2028 (USD MILLION) 
     10.8 VASCULAR MEDICAL DEVICES 
             10.8.1 RISING INCIDENCE OF CARDIOVASCULAR DISEASES TO PROPEL NEED FOR TESTING OF VASCULAR MEDICAL DEVICES
                        TABLE 37 VASCULAR MEDICAL DEVICES: MARKET, BY REGION, 2019–2022 (USD MILLION) 
                        TABLE 38 VASCULAR MEDICAL DEVICES: MARKET, BY REGION, 2023–2028 (USD MILLION) 
                        TABLE 39 VASCULAR MEDICAL DEVICES: MARKET, BY SERVICE TYPE, 2019–2022 (USD MILLION) 
                        TABLE 40 VASCULAR MEDICAL DEVICES: MEDICAL DEVICE TESTING MARKET, BY SERVICE TYPE, 2023–2028 (USD MILLION) 
     10.9 OTHERS 
             TABLE 41 OTHERS: MARKET, BY REGION, 2019–2022 (USD MILLION) 
             TABLE 42 OTHERS: MARKET, BY REGION, 2023–2028 (USD MILLION) 
             TABLE 43 OTHERS: MARKET, BY SERVICE TYPE, 2019–2022 (USD MILLION) 
             TABLE 44 OTHERS: MARKET, BY SERVICE TYPE, 2023–2028 (USD MILLION) 
 
11 MEDICAL DEVICE TESTING MARKET, BY REGION (Page No. - 108)
     11.1 INTRODUCTION 
             FIGURE 33 ASIA PACIFIC TO EXHIBIT HIGHEST CAGR IN MARKET DURING FORECAST PERIOD 
             TABLE 45 MEDICAL DEVICE TESTING MARKET, BY REGION, 2019–2022 (USD MILLION) 
             TABLE 46 MARKET, BY REGION, 2023–2028 (USD MILLION) 
     11.2 NORTH AMERICA 
             FIGURE 34 NORTH AMERICA: MEDICAL DEVICE TESTING MARKET SNAPSHOT 
             TABLE 47 NORTH AMERICA: MARKET, BY COUNTRY, 2019–2022 (USD MILLION) 
             TABLE 48 NORTH AMERICA: MARKET, BY COUNTRY, 2023–2028 (USD MILLION) 
             TABLE 49 NORTH AMERICA: MARKET, BY SOURCING TYPE, 2019–2022 (USD MILLION) 
             TABLE 50 NORTH AMERICA: MARKET, BY SOURCING TYPE, 2023–2028 (USD MILLION) 
             TABLE 51 NORTH AMERICA: MARKET, BY TECHNOLOGY, 2019–2022 (USD MILLION) 
             TABLE 52 NORTH AMERICA: MEDICAL DEVICE TESTING MARKET, BY TECHNOLOGY, 2023–2028 (USD MILLION) 
             11.2.1 US
                        11.2.1.1 Robust research & development activities to drive market
                                     TABLE 53 US: MARKET, BY SOURCING TYPE, 2019–2022 (USD MILLION) 
                                     TABLE 54 US: MARKET, BY SOURCING TYPE, 2023–2028 (USD MILLION) 
             11.2.2 CANADA
                        11.2.2.1 Increasing adoption of advanced technologies to propel market growth
                                     TABLE 55 CANADA: MARKET, BY SOURCING TYPE, 2019–2022 (USD MILLION) 
                                     TABLE 56 CANADA: MARKET, BY SOURCING TYPE, 2023–2028 (USD MILLION) 
             11.2.3 MEXICO
                        11.2.3.1 Rising demand for healthcare services to augment market growth
                                     TABLE 57 MEXICO: MARKET, BY SOURCING TYPE, 2019–2022 (USD MILLION) 
                                     TABLE 58 MEXICO: MARKET, BY SOURCING TYPE, 2023–2028 (USD MILLION) 
             11.2.4 RECESSION IMPACT ON MARKET IN NORTH AMERICA
     11.3 EUROPE 
             FIGURE 35 EUROPE: MEDICAL DEVICE TESTING MARKET SNAPSHOT 
             TABLE 59 EUROPE: MARKET, BY COUNTRY, 2019–2022 (USD MILLION) 
             TABLE 60 EUROPE: MARKET, BY COUNTRY, 2023–2028 (USD MILLION) 
             TABLE 61 EUROPE: MARKET, BY SOURCING TYPE, 2019–2022 (USD MILLION) 
             TABLE 62 EUROPE: MARKET, BY SOURCING TYPE, 2023–2028 (USD MILLION) 
             TABLE 63 EUROPE: MARKET, BY TECHNOLOGY, 2019–2022 (USD MILLION) 
             TABLE 64 EUROPE: MARKET, BY TECHNOLOGY, 2023–2028 (USD MILLION) 
             11.3.1 GERMANY
                        11.3.1.1 Strong focus on quality of medical devices to foster market growth
                                     TABLE 65 GERMANY: MEDICAL DEVICE TESTING MARKET, BY SOURCING TYPE, 2019–2022 (USD MILLION) 
                                     TABLE 66 GERMANY: MARKET, BY SOURCING TYPE, 2023–2028 (USD MILLION) 
             11.3.2 UK
                        11.3.2.1 Stringent regulatory standards pertaining to medical devices to contribute to market growth
                                     TABLE 67 UK: MARKET, BY SOURCING TYPE, 2019–2022 (USD MILLION) 
                                     TABLE 68 UK: MARKET, BY SOURCING TYPE, 2023–2028 (USD MILLION) 
             11.3.3 FRANCE
                        11.3.3.1 Consolidating trend of outsourcing testing services to fuel market growth
                                     TABLE 69 FRANCE: MARKET, BY SOURCING TYPE, 2019–2022 (USD MILLION) 
                                     TABLE 70 FRANCE: MARKET, BY SOURCING TYPE, 2023–2028 (USD MILLION) 
             11.3.4 ITALY
                        11.3.4.1 Rise in demand for testing of home healthcare devices to complement market growth
                                     TABLE 71 ITALY: MARKET, BY SOURCING TYPE, 2019–2022 (USD MILLION) 
                                     TABLE 72 ITALY: MARKET, BY SOURCING TYPE, 2023–2028 (USD MILLION) 
             11.3.5 SPAIN
                        11.3.5.1 Increasing burden of chronic diseases to provide growth opportunities to market players
                                     TABLE 73 SPAIN: MARKET, BY SOURCING TYPE, 2019–2022 (USD MILLION) 
                                     TABLE 74 SPAIN: MARKET, BY SOURCING TYPE, 2023–2028 (USD MILLION) 
             11.3.6 REST OF EUROPE
                        TABLE 75 REST OF EUROPE: MARKET, BY SOURCING TYPE, 2019–2022 (USD MILLION) 
                        TABLE 76 REST OF EUROPE: MARKET, BY SOURCING TYPE, 2023–2028 (USD MILLION) 
             11.3.7 RECESSION IMPACT ON MARKET IN EUROPE
     11.4 ASIA PACIFIC 
             FIGURE 36 ASIA PACIFIC: MEDICAL DEVICE TESTING MARKET SNAPSHOT 
             TABLE 77 ASIA PACIFIC: MARKET, BY COUNTRY, 2019–2022 (USD MILLION) 
             TABLE 78 ASIA PACIFIC: MARKET, BY COUNTRY, 2023–2028 (USD MILLION) 
             TABLE 79 ASIA PACIFIC: MARKET, BY SOURCING TYPE, 2019–2022 (USD MILLION) 
             TABLE 80 ASIA PACIFIC: MARKET, BY SOURCING TYPE, 2023–2028 (USD MILLION) 
             TABLE 81 ASIA PACIFIC: MARKET, BY TECHNOLOGY, 2019–2022 (USD MILLION) 
             TABLE 82 ASIA PACIFIC: MARKET, BY TECHNOLOGY, 2023–2028 (USD MILLION) 
             11.4.1 CHINA
                        11.4.1.1 Focus on increasing production of high-end medical devices to boost demand for testing services
                                     TABLE 83 CHINA: MARKET, BY SOURCING TYPE, 2019–2022 (USD MILLION) 
                                     TABLE 84 CHINA: MARKET, BY SOURCING TYPE, 2023–2028 (USD MILLION) 
             11.4.2 JAPAN
                        11.4.2.1 Growing concerns regarding product safety and regulatory compliance to support market growth
                                     TABLE 85 JAPAN: MARKET, BY SOURCING TYPE, 2019–2022 (USD MILLION) 
                                     TABLE 86 JAPAN: MARKET, BY SOURCING TYPE, 2023–2028 (USD MILLION) 
             11.4.3 INDIA
                        11.4.3.1 Increasing demand for medical devices to boost testing
                                     TABLE 87 INDIA: MARKET, BY SOURCING TYPE, 2019–2022 (USD MILLION) 
                                     TABLE 88 INDIA: MARKET, BY SOURCING TYPE, 2023–2028 (USD MILLION) 
             11.4.4 SOUTH KOREA
                        11.4.4.1 Increasing emphasis on basic medical care to favor market growth
                                     TABLE 89 SOUTH KOREA: MARKET, BY SOURCING TYPE, 2019–2022 (USD MILLION) 
                                     TABLE 90 SOUTH KOREA: MARKET, BY SOURCING TYPE, 2023–2028 (USD MILLION) 
             11.4.5 AUSTRALIA
                        11.4.5.1 Increasing need for robust testing procedures to foster market growth
                                     TABLE 91 AUSTRALIA: MARKET, BY SOURCING TYPE, 2019–2022 (USD MILLION) 
                                     TABLE 92 AUSTRALIA: MARKET, BY SOURCING TYPE, 2023–2028 (USD MILLION) 
             11.4.6 REST OF ASIA PACIFIC
                        TABLE 93 REST OF ASIA PACIFIC: MARKET, BY SOURCING TYPE, 2019–2022 (USD MILLION) 
                        TABLE 94 REST OF ASIA PACIFIC: MARKET, BY SOURCING TYPE, 2023–2028 (USD MILLION) 
             11.4.7 RECESSION IMPACT ON MARKET IN ASIA PACIFIC
     11.5 ROW 
             TABLE 95 ROW: MEDICAL DEVICE TESTING MARKET, BY REGION, 2019–2022 (USD MILLION) 
             TABLE 96 ROW: MARKET, BY REGION, 2023–2028 (USD MILLION) 
             TABLE 97 ROW: MARKET, BY SOURCING TYPE, 2019–2022 (USD MILLION) 
             TABLE 98 ROW: MARKET, BY SOURCING TYPE, 2023–2028 (USD MILLION) 
             TABLE 99 ROW: MARKET, BY TECHNOLOGY, 2019–2022 (USD MILLION) 
             TABLE 100 ROW: MARKET, BY TECHNOLOGY, 2023–2028 (USD MILLION) 
             11.5.1 SOUTH AMERICA
                        11.5.1.1 Development of advanced medical technologies to necessitate rigorous testing procedures
                                     TABLE 101 SOUTH AMERICA: MARKET, BY SOURCING TYPE, 2019–2022 (USD MILLION) 
                                     TABLE 102 SOUTH AMERICA: MARKET, BY SOURCING TYPE, 2023–2028 (USD MILLION) 
             11.5.2 MIDDLE EAST AND AFRICA
                        11.5.2.1 Growing concerns regarding product safety to accelerate demand for testing services
                                     TABLE 103 MIDDLE EAST & AFRICA: MARKET, BY SOURCING TYPE, 2019–2022 (USD MILLION) 
                                     TABLE 104 MIDDLE EAST & AFRICA: MARKET, BY SOURCING TYPE, 2023–2028 (USD MILLION) 
             11.5.3 RECESSION IMPACT ON MARKET IN ROW
 
12 COMPETITIVE LANDSCAPE (Page No. - 144)
     12.1 INTRODUCTION 
     12.2 STRATEGIES ADOPTED BY KEY PLAYERS 
             TABLE 105 OVERVIEW OF STRATEGIES ADOPTED BY KEY PLAYERS IN MEDICAL DEVICE TESTING MARKET 
             12.2.1 PRODUCT/SERVICE PORTFOLIO
             12.2.2 REGIONAL FOCUS
             12.2.3 ORGANIC/INORGANIC GROWTH STRATEGIES
     12.3 MARKET SHARE ANALYSIS, 2022 
             TABLE 106 MEDICAL DEVICE TESTING MARKET: MARKET SHARE ANALYSIS, 2022 
     12.4 REVENUE ANALYSIS OF TOP PLAYERS IN MEDICAL DEVICE TESTING MARKET 
             FIGURE 37 FIVE-YEAR REVENUE ANALYSIS OF TOP PLAYERS IN MEDICAL DEVICE TESTING MARKET 
     12.5 COMPANY EVALUATION MATRIX, 2022 
             12.5.1 STARS
             12.5.2 PERVASIVE PLAYERS
             12.5.3 EMERGING LEADERS
             12.5.4 PARTICIPANTS
             FIGURE 38 MEDICAL DEVICE TESTING MARKET (GLOBAL): COMPANY EVALUATION MATRIX, 2022 
     12.6 COMPANY FOOTPRINT 
             12.6.1 COMPANY FOOTPRINT, BY SERVICE TYPE
             12.6.2 COMPANY FOOTPRINT, BY REGION
             12.6.3 OVERALL COMPANY FOOTPRINT
     12.7 COMPETITIVE SCENARIOS AND TRENDS 
             12.7.1 SERVICE LAUNCHES & DEVELOPMENTS
                       TABLE 107 MEDICAL DEVICE TESTING MARKET: SERVICE LAUNCHES/DEVELOPMENTS, 2020–2023 
             12.7.2 DEALS
                       TABLE 108 MEDICAL DEVICE TESTING MARKET: DEALS, 2020–2023 
 
13 COMPANY PROFILES (Page No. - 159)
(Business Overview, Products/Services/Solutions Offered, Recent Developments, and MnM View (Key strengths/Right to Win, Strategic Choices Made, and Weaknesses and Competitive Threats))*  
     13.1 KEY PLAYERS 
             13.1.1 SGS SOCIÉTÉ GÉNÉRALE DE SURVEILLANCE SA
                        TABLE 109 SGS SOCIÉTÉ GÉNÉRALE DE SURVEILLANCE SA: COMPANY OVERVIEW 
                        FIGURE 39 SGS SOCIÉTÉ GÉNÉRALE DE SURVEILLANCE SA: COMPANY SNAPSHOT 
                        TABLE 110 SGS SOCIÉTÉ GÉNÉRALE DE SURVEILLANCE SA: PRODUCTS/SERVICES/SOLUTIONS OFFERED 
                        TABLE 111 SGS SOCIÉTÉ GÉNÉRALE DE SURVEILLANCE SA: DEALS 
                        TABLE 112 SGS SOCIÉTÉ GÉNÉRALE DE SURVEILLANCE SA: OTHERS 
             13.1.2 EUROFINS SCIENTIFIC
                        TABLE 113 EUROFINS SCIENTIFIC: COMPANY OVERVIEW 
                        FIGURE 40 EUROFINS SCIENTIFIC: COMPANY SNAPSHOT 
                        TABLE 114 EUROFINS SCIENTIFIC: PRODUCTS/SERVICES/SOLUTIONS OFFERED 
                        TABLE 115 EUROFINS SCIENTIFIC: DEALS 
             13.1.3 BUREAU VERITAS
                        TABLE 116 BUREAU VERITAS: COMPANY OVERVIEW 
                        FIGURE 41 BUREAU VERITAS: COMPANY SNAPSHOT 
                        TABLE 117 BUREAU VERITAS: PRODUCTS/SERVICES/SOLUTIONS OFFERED 
                        TABLE 118 BUREAU VERITAS: DEALS 
             13.1.4 TÜV RHEINLAND
                        TABLE 119 TÜV RHEINLAND: COMPANY OVERVIEW 
                        FIGURE 42 TÜV RHEINLAND: COMPANY SNAPSHOT 
                        TABLE 120 TÜV RHEINLAND: PRODUCTS/SERVICES/SOLUTIONS OFFERED 
                        TABLE 121 TÜV RHEINLAND: DEALS 
                        TABLE 122 TÜV RHEINLAND: OTHERS 
             13.1.5 TÜV SÜD
                        TABLE 123 TÜV SÜD: COMPANY OVERVIEW 
                        FIGURE 43 TÜV SÜD: COMPANY SNAPSHOT 
                        TABLE 124 TÜV SÜD: PRODUCTS/SERVICES/SOLUTIONS OFFERED 
                        TABLE 125 TÜV SÜD: OTHERS 
             13.1.6 DEKRA
                        TABLE 126 DEKRA: COMPANY OVERVIEW 
                        FIGURE 44 DEKRA: COMPANY SNAPSHOT 
                        TABLE 127 DEKRA: PRODUCTS/SERVICES/SOLUTIONS OFFERED 
                        TABLE 128 DEKRA: OTHERS 
             13.1.7 UL LLC
                        TABLE 129 UL LLC: COMPANY OVERVIEW 
                        TABLE 130 UL LLC: PRODUCTS/SERVICES/SOLUTIONS OFFERED 
                        TABLE 131 UL LLC: DEALS 
             13.1.8 ASTM
                        TABLE 132 ASTM: COMPANY OVERVIEW 
                        TABLE 133 ASTM: PRODUCTS/SERVICES/SOLUTIONS OFFERED 
                        TABLE 134 ASTM: PRODUCT/SERVICE LAUNCHES 
             13.1.9 INTERTEK GROUP PLC
                        TABLE 135 INTERTEK GROUP PLC: COMPANY OVERVIEW 
                        FIGURE 45 INTERTEK GROUP PLC: COMPANY SNAPSHOT 
                        TABLE 136 INTERTEK GROUP PLC: PRODUCTS/SERVICES/SOLUTIONS OFFERED 
                        TABLE 137 INTERTEK GROUP PLC: PRODUCT/SERVICE LAUNCHES 
             13.1.10 SOTERA HEALTH
                        TABLE 138 SOTERA HEALTH: COMPANY OVERVIEW 
                        FIGURE 46 SOTERA HEALTH: COMPANY SNAPSHOT 
                        TABLE 139 SOTERA HEALTH: PRODUCTS/SERVICES/SOLUTIONS OFFERED 
                        TABLE 140 SOTERA HEALTH: PRODUCT/SERVICE LAUNCHES 
                        TABLE 141 SOTERA HEALTH: DEALS 
                        TABLE 142 SOTERA HEALTH: OTHERS 
     13.2 OTHER PLAYERS 
             13.2.1 ELEMENT MATERIALS TECHNOLOGY
             13.2.2 INOTIV
             13.2.3 GATEWAY ANALYTICAL
             13.2.4 MEDISTRI SA
             13.2.5 NORTH AMERICAN SCIENCE ASSOCIATES, LLC (NAMSA)
             13.2.6 PACE
             13.2.7 WUXI APPTEC
             13.2.8 LABORATORY CORPORATION OF AMERICA
             13.2.9 CHARLES RIVER LABORATORIES
             13.2.10 SOURCE BIOSCIENCE
             13.2.11 NSF
             13.2.12 BIOMEDICAL DEVICE LABS
             13.2.13 SURPASS, INC.
             13.2.14 THE BRITISH STANDARDS INSTITUTION
             13.2.15 MEASUR OY
*Details on Business Overview, Products/Services/Solutions Offered, Recent Developments, and MnM View (Key strengths/Right to Win, Strategic Choices Made, and Weaknesses and Competitive Threats) might not be captured in case of unlisted companies.  
 
14 APPENDIX (Page No. - 209)
     14.1 DISCUSSION GUIDE 
     14.2 KNOWLEDGESTORE: MARKETSANDMARKETS’ SUBSCRIPTION PORTAL 
     14.3 CUSTOMIZATION OPTIONS 
     14.4 RELATED REPORTS 
     14.5 AUTHOR DETAILS 


The study involved four major activities in estimating the current size of the medical device testing market. Exhaustive secondary research was done to collect information on the market, peer, and parent markets. The next step was to validate these findings, assumptions, and sizing with industry experts across the value chain through primary research. Both top-down and bottom-up approaches were employed to estimate the complete market size. After that, market breakdown and data triangulation were used to estimate the market size of segments and subsegments.

Secondary Research

Various secondary sources have been referred to in the secondary research process for identifying and collecting information important for this study. The secondary sources include annual reports, press releases, and investor presentations of companies; white papers; journals and certified publications; and articles from recognized authors, websites, directories, and databases. Secondary research has been conducted to obtain key information about the industry’s supply chain, the market’s value chain, the total pool of key players, market segmentation according to the industry trends (to the bottom-most level), regional markets, and key developments from market- and technology-oriented perspectives. The secondary data has been collected and analyzed to determine the overall market size, further validated by primary research.

List of major secondary sources

Sources

Web Link

International Organization for Standardization (ISO)

https://www.iso.org/home.html

Canadian Standards Association (CSA)

https://www.csagroup.org/

International Safe Transit Association (ISTA)

https://ista.org/

American Society for Testing Materials (ASTM)

https://www.astm.org/

American National Standards Institute (ANSI)

https://www.ansi.org/

Hong Kong Certification Body Accreditation Scheme (HKCAS)

https://www.itc.gov.hk/

Hong Kong Inspection Body Accreditation Scheme (HKIAS)

https://www.itc.gov.hk/

World Bank Group

https://www.worldbank.org/

Primary Research

Extensive primary research was conducted after gaining knowledge about the current scenario of the medical device testing market through secondary research. Several primary interviews were conducted with experts from both the demand and supply sides across four major regions—North America, Europe, Asia Pacific, and RoW. This primary data was collected through questionnaires, emails, and telephonic interviews.

Medical Device Testing Market Size, and Share

To know about the assumptions considered for the study, download the pdf brochure

Market Size Estimation

In the complete market engineering process, both top-down and bottom-up approaches have been used, along with several data triangulation methods, to perform market estimation and forecasting for the overall market segments and subsegments listed in this report. Key players in the market have been identified through secondary research, and their market shares in the respective regions have been determined through primary and secondary research. This entire procedure includes the study of annual and financial reports of the top market players and extensive interviews for key insights (quantitative and qualitative) with industry experts (CEOs, VPs, directors, and marketing executives).

All percentage shares, splits, and breakdowns have been determined using secondary sources and verified through primary sources. All the parameters affecting the markets covered in this research study have been accounted for, viewed in detail, verified through primary research, and analyzed to obtain the final quantitative and qualitative data. This data has been consolidated and supplemented with detailed inputs and analysis from MarketsandMarkets and presented in this report. The following figure represents this study’s overall market size estimation process.

Bottom-Up Approach

The bottom-up approach was used to arrive at the overall size of the medical device testing market from the revenues of the key players and their shares in the market. The overall market size was calculated based on the revenues of the key players identified in the market.

  • Identifying the entities in the medical device testing market influencing the entire market, along with the related component players
  • Analyzing major providers of medical device testing services, studying their portfolios, and understanding different types of products based on features and functions
  • Analyzing trends pertaining to the usage of medical device testing offerings, such as hardware, software, and services
  • Tracking the ongoing and upcoming developments in the market, such as investments made, R&D activities, product launches, collaborations, and partnerships, and forecasting the market size based on these developments and other critical parameters
  • Carrying out multiple discussions with key opinion leaders to understand the different types of medical device testing; and offerings, vertical, and recent trends in the market, analyzing the breakup of the scope of work carried out by major manufacturing companies
  • Arriving at the market estimates by analyzing segment revenues of these companies generated by medical device testing offerings and then combining the same to get the market estimate by different segments
  • Verifying and cross-checking the estimate at every level by discussing with key opinion leaders, such as Chief Experience Officers (CXOs), directors, and operations managers, and finally with the domain experts at MarketsandMarkets
  • Studying various paid and unpaid sources of information, such as annual reports, press releases, white papers, Factiva, and databases

Medical Device Testing Market Size, and Bottom-Up Approach

Top-Down Approach

In the top-down approach, the overall market size has been used to estimate the size of individual markets (mentioned in the market segmentation) through percentage splits from secondary and primary research.

The most appropriate immediate parent market size has been used to implement the top-down approach to calculate the market size of specific segments. The top-down approach has been implemented for the data extracted from the secondary research to validate the market size obtained.

Each company’s market share has been estimated to verify the revenue shares used earlier in the top-down approach. This study has determined and confirmed the overall parent market and individual market sizes by the data triangulation method and data validation through primaries. The data triangulation method in this study is explained in the next section.

  • Focusing on top-line investments and expenditures being made in the ecosystems of various verticals, listing key developments, analyzing updated technology in the marketplace, and evaluating the market by further splitting it into different technology
  • Building and developing the information related to the market revenue generated by key medical device testing tools manufacturers
  • Conducting multiple on-field discussions with the key opinion leaders involved in the development of medical device testing products in various verticals
  • Estimating geographic splits using secondary sources based on various factors, such as the number of players in a specific country and region, the offerings of medical device testing, and the level of solutions offered in different verticals
  • The impact of the recession on the steps mentioned above.

Medical Device Testing Market Size, and Top-Down Approach

Data Triangulation

After arriving at the overall market size from the estimation process explained above, the overall market has been split into several segments and subsegments. The data triangulation procedure has been employed wherever applicable to complete the overall market engineering process and arrive at the exact statistics for all segments and subsegments. The data has been triangulated by studying various factors and trends from both the demand and supply sides. Additionally, the market size has been validated using top-down and bottom-up approaches.

Market Definition

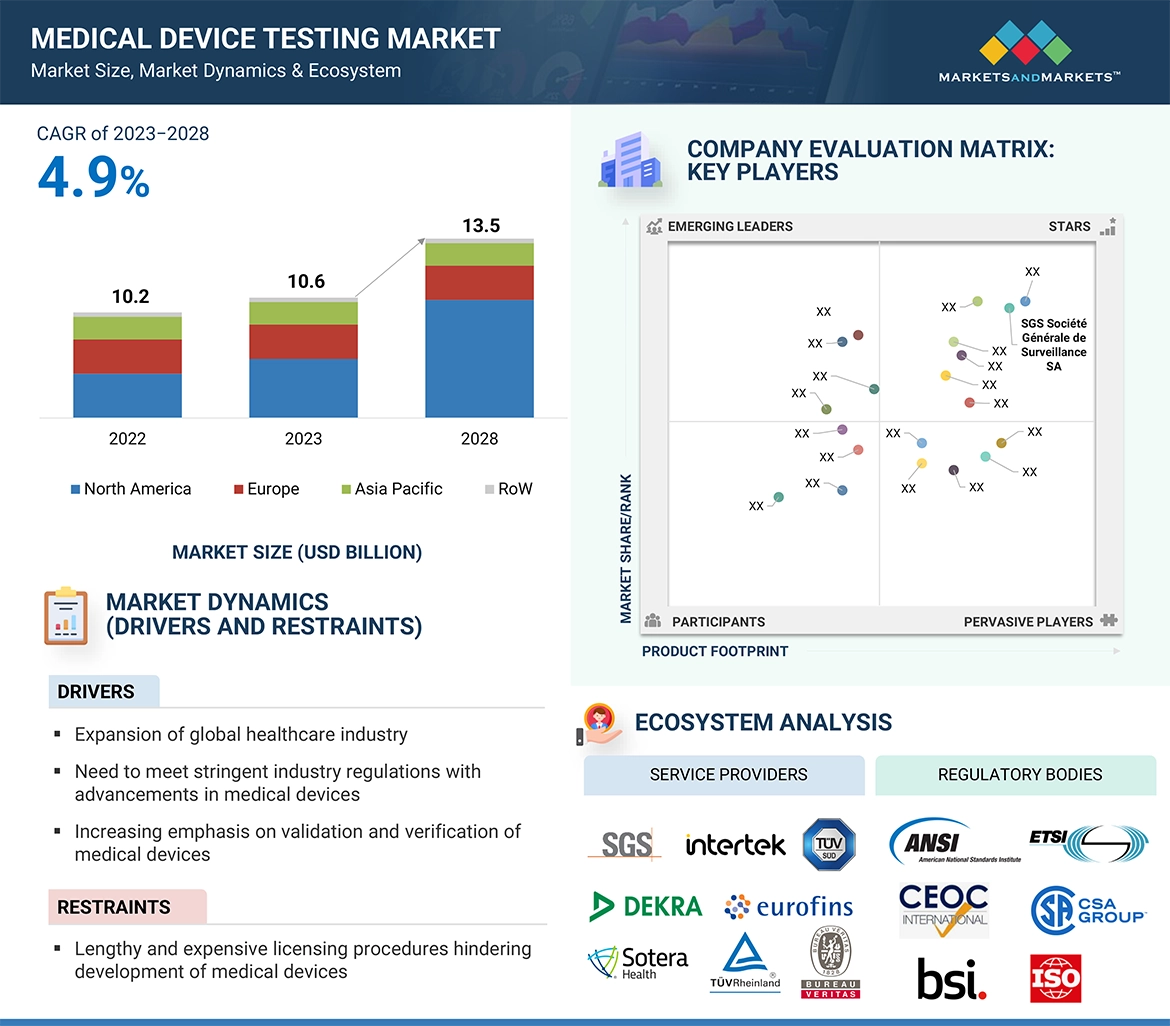
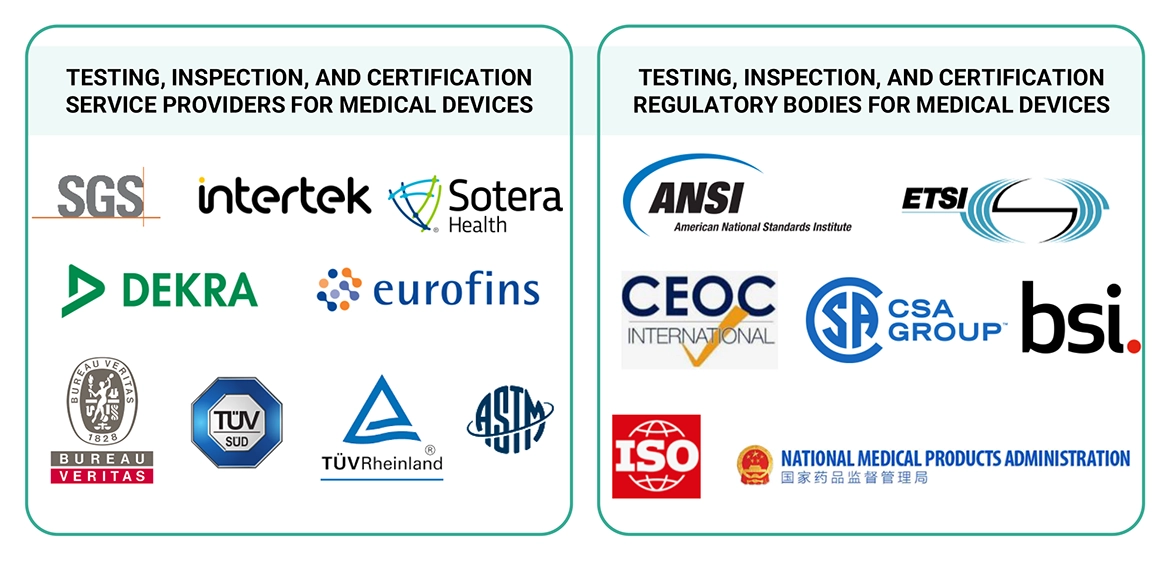
Medical device testing services are provided to help manufacturers improve their productivity, meet the global standards, and enhance the quality of medical devices. Services such as audit, inspection, verification, certification, and testing can be applied to any medical device, service, or company, involved in medical devices. These services aim to assure the end users and consumers that the manufacturer has followed national and international regulations and industry standards to ensure quality, public health, and safety.

Key Stakeholders

  • Raw material and testing equipment suppliers
  • Research organizations
  • Original equipment manufacturers (OEMs)
  • Technology standards organizations, forums, alliances, and associations
  • Technology investors
  • Analysts and strategic business planners
  • Government bodies, venture capitalists, and private equity firms
  • Market Research and Consulting Firms
  • Technology Investors
  • Governments, Regulatory Bodies, and Financial Institutions
  • Venture Capitalists, Private Equity Firms, and Startups

Report Objectives

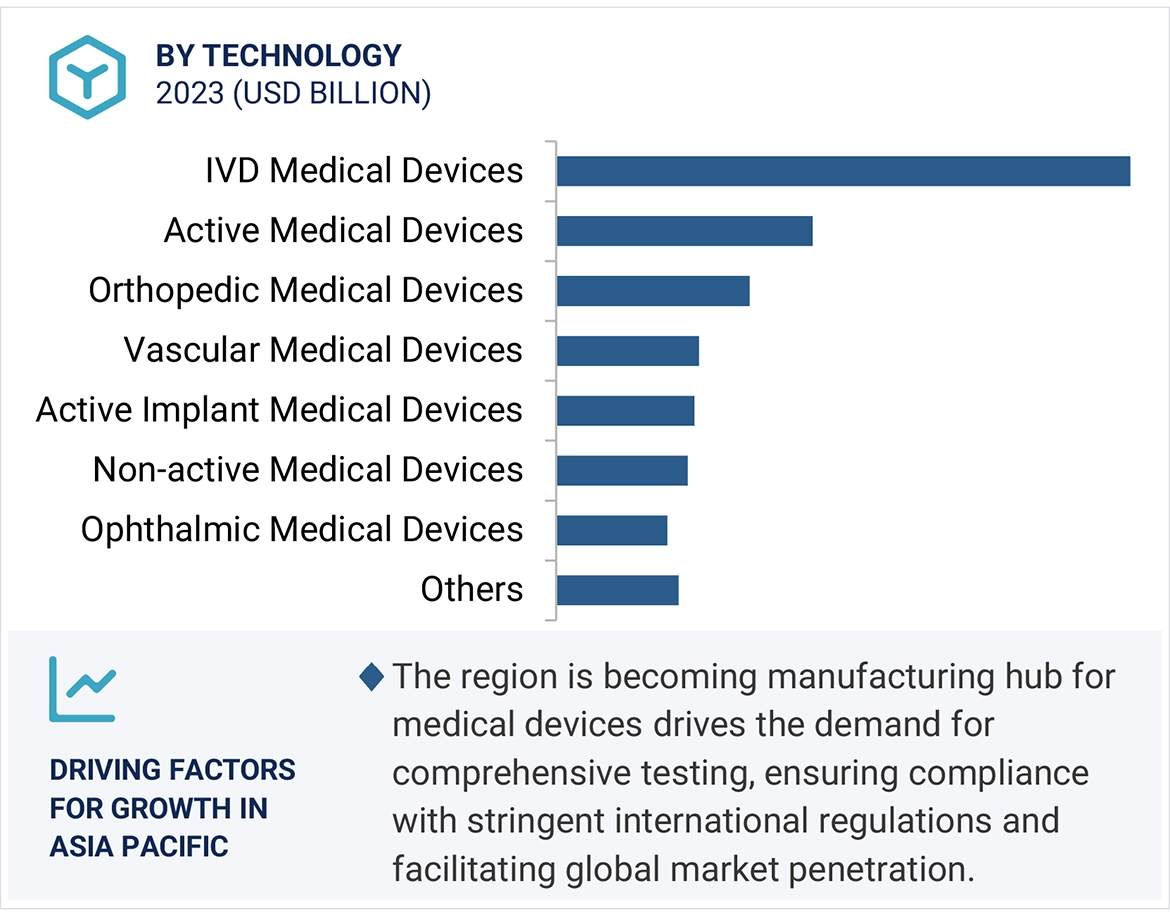
  • To describe and forecast the medical device testing market, in terms of value, based on service type, sourcing type, device class and, technology.
  • To forecast the market size, in terms of value, for various segments with regard to 4 main regions, namely, North America, Europe, Asia Pacific (APAC), and the Rest of the World (RoW)
  • To provide detailed information regarding the major factors influencing the growth of the medical device testing market (drivers, restraints, opportunities, and industry-specific challenges)
  • To analyze the micromarkets1 with respect to individual growth trends, prospects, and contributions to the total market
  • To study the complete value chain and allied industry segments, and perform a value chain analysis of the medical device testing landscape
  • To analyze the opportunities in the market for various stakeholders by identifying the high-growth segments of the medical device testing market
  • To profile the key players and comprehensively analyze their market position in terms of ranking and core competencies2, along with detailing the competitive landscape for the market leaders
  • To analyze competitive developments, such as partnerships and joint ventures, mergers and acquisitions, new product developments, expansions, and research and development, in the medical device testing market
  • To track and analyze competitive developments, such as partnerships, collaborations, agreements, joint ventures, mergers and acquisitions, expansions, product/service launches, and other developments in the market

Available Customizations

With the given market data, MarketsandMarkets offers customizations according to the specific requirements of companies. The following customization options are available for the report:

  • Detailed analysis and profiling of additional market players (up to 5)
  • Additional country-level analysis of the medical device testing market

Product Analysis

  • Product matrix, which provides a detailed comparison of the product portfolio of each company in the medical device testing market.
Custom Market Research Services

We will customize the research for you, in case the report listed above does not meet with your exact requirements. Our custom research will comprehensively cover the business information you require to help you arrive at strategic and profitable business decisions.

Request Customization
Report Code
SE 5802
Published ON
Oct, 2023
Choose License Type
BUY NOW
  • SHARE
X
Request Customization
Speak to Analyst
Speak to Analyst
OR FACE-TO-FACE MEETING
PERSONALIZE THIS RESEARCH
  • Triangulate with your Own Data
  • Get Data as per your Format and Definition
  • Gain a Deeper Dive on a Specific Application, Geography, Customer or Competitor
  • Any level of Personalization
REQUEST A FREE CUSTOMIZATION
LET US HELP YOU!
  • What are the Known and Unknown Adjacencies Impacting the Medical Device Testing Market
  • What will your New Revenue Sources be?
  • Who will be your Top Customer; what will make them switch?
  • Defend your Market Share or Win Competitors
  • Get a Scorecard for Target Partners
CUSTOMIZED WORKSHOP REQUEST
+1-888-600-6441
  • Call Us
  • +1-888-600-6441 (Corporate office hours)
  • +1-888-600-6441 (US/Can toll free)
  • +44-800-368-9399 (UK office hours)
CONNECT WITH US
ABOUT TRUST ONLINE
©2024 MarketsandMarkets Research Private Ltd. All rights reserved
DMCA.com Protection Status Website Feedback