Label Free Detection Market

Label Free Detection Market Size, Share & Trends by Offering (Instrument, Consumables (Biosensor Chips, Microplates), Software, Services), Technology (Surface Plasmon Resonance, Differential Scanning Calorimetry), Application (Lead Generation) - Global Forecast to 2029

Report Code: BT 2455 Aug, 2024, by marketsandmarkets.com

Label Free Detection Market Size, Share & Trends

The label free detection market is expected to generate a revenue of USD 747 million by 2029, with a revenue of USD 515 million in 2024 to register a CAGR of 7.7%. Growth in the label-free detection market can be attributed to factors such as technological development in label-free detection, expanding academic-industrial alliances for drug discovery programs, high sensitivity of label-free technologies and rising R&D expenditures in biotechnology and pharmaceuticals companies help to explain growth in the label-free detection market. Nevertheless, obstacles include sample complexity and interference as well as strict regulatory approval procedures can impede the expansion of the sector. furthermore, a fast expanding segment of the applied chemistry and biological sciences industry is label-free detection. This market focuses on technologies that allow the samples to be kept in their natural condition by analyzing biological and chemical interactions without the need for fluorescent or radioactive labels. Moreover, increasing technological advancement and need for high-throughput screening instruments as well as economic and effective analytical solutions.  For instance, key players like Agilent Technologies, Inc. has developed innovative and real-time analysis solution for label-free detection.

Label Free Detection Market Trends

Label-Free Detection Market

To know about the assumptions considered for the study, Request for Free Sample Report

Attractive Opportunities in the label free detection Market

Label-Free Detection Market

Label Free Detection Market Dynamics

DRIVER: High sensitivity of label-free instruments

Transfected cell lines, which are not a perfect representation of disease-relevant cell types, were used in the validation and hit identification processes of the past. The insensitivity of label-based assays was the main motivator for the use of transfected cell lines. Compounds were screened in a label-based selective assay, which is typically the least expensive and has the maximum throughput, due to financial constraints and other constraints. But in terms of the hits found, this technology led to selection bias. In this field of study in particular, label-free methods offer an enhanced, sensitive platform for drug screening in native cells without the need for labels, where complete cell responses are recorded objectively. These methods are now more effective and user-friendly thanks to advancements in automation capabilities, throughput, instrument sensitivity, and data processing algorithms.

RESTRAINT: Technical complexity

One main market constraint of label-free detection methods is their natural technological complexity. Usually, operating label-free detection techniques require certain training and technical understanding. This can limit admittance to labs and institutions with highly competent personnel. Analyzing and interpreting the data generated by label-free detection systems—such as surface plasmon resonance (SPR) or isothermal titration calorimetry (ITC)—requires a great awareness of the basic theories and advanced data processing technologies. Like SPR and ITC, label-free detection systems apply cutting-edge technology requiring precise calibration and maintenance. Ensuring accurate results requires consistent instrument servicing and rigorous adherence to techniques. The intricacy of label-free detection systems usually translates into higher equipment costs. Smaller labs or those on tighter budgets could find this difficult. Advanced label-free detecting equipment must also be routinely maintained and calibrated if they are to run as intended. This can be expensive and time-consuming, hence regular technical help and maintenance investment is required. Technical issues or maintenance requirements could lead to instrument downtime, therefore disturbing research activities and reducing yield.

OPPORTUNITY: Increased focus on biomarker discovery

Development of biomarkers depends critically on label-free detection technologies, which permit the identification and analysis of biomarkers free from the use of fluorescent, radioactive, or enzymatic labels. Among many benefits these methods provide are real-time monitoring, great sensitivity, and native state analysis capability for interactions. Label-free detection techniques provide real-time biomolecular interaction observation that generates kinetic data needed for knowledge of the binding properties and affinities of suspected biomarkers. Early-stage biomarker development and validation would be best suitable for labe-free detection methods since they may find low-abundance biomarkers with great sensitivity and specificity. Analyzing biomolecules in their native state free from labels helps to preserve their natural structure and function, so providing more physiologically relevant data. Furthermore, certain label-free detection systems allow many biomarkers to be simultaneously studied, hence improving the efficiency and throughput of biomarker development studies. Label-free detection technologies so reduce likely sources of mistake and uncertainty in research by eliminating the requirement for sophisticated labeling techniques. The several label-free detection methods are applied strategically in the identification of biomarkers.

CHALLENGE: Stringent regulatory approval process

The considerable challenges the rigorous testing standards, high prices, extended timescales, complex paperwork and reporting duties define for the demanding regulatory approval process for label-free detection devices. These challenges can cause development costs to rise, slow down the sales of creative label-free items, and inhibit innovation. Often spanning long-standing clinical trials, validation studies, and documentation, the regulatory approval process for label-free detection devices can be demanding. This can lead to lag in new product time-to market. usually spanning multiple phases preclinical testing, clinical trials, and post-market surveillance each with its own set of criteria and standards is the regulatory approval. As regulatory criteria change, companies ought to remain educated with the most recent laws and norms. This can cause ambiguity and need ongoing adjustments to compliance strategies.

Global Label-free detection Ecosystem Analysis

The label-free detection market ecosystem comprises raw material suppliers, label-free detection product manufacturers, and end users such as pharmaceutical & biotechnology companies, academic and research institutes, contract research organization, and others

Label-Free Detection Market Ecosystem

The binding kinetics segment under application segment dominated label free detection industry in 2023.

Based on application, the label free detection industry is segmented into binding kinetics, binding thermodynamics, hit confirmation, lead generation, endogenous receptor detection and other application. In 2023, binding kinetics segment accounted the largest share in the global market. Measurement of binding kinetics makes extensive use of optical methods including BLI and SPR. Many biological mechanism re driven and regulated by the dynamic interactions of molecules. Important for drug clinic come prediction, binding kinetic studies track drug residence time. Understanding the speed of ompound's binding kinetics helps one to grasp both its dissociation speed from ts target and binding trength. It counts two: the off-rate and the on-rate. Calculating the on- and off-rate used used to take ime. Because it was time-consuming and expensive, most pharmaceutical companies thus were reening for on/off rates until the early 2000s. Modern biophysical methods, such as SPR, howe Ilow for the direct measurement of on- and off-rates free from labels. usually employed i oteins like proteases, kinases, and enzymes.

The contract research organization segment under end user is expected to register a highest a growth rate over the forecast period in the label free detection industry in 2023.

Based on end user, the label free detection market is segmented into pharmaceutical & biotechnology companies, academic & research institutes, contract research organization, and other end users. In 2023, the contract research organization segment grow at a highest CAGR in the label-free detection market. The main drivers driving this market segment include the growing trend of pharmaceutical corporations outsourcing research to private research organizations (CROS) in order to maintain flexibility and competitiveness in an ever-evolving world of rapidly expanding knowledge, highly advanced technologies, and unstable economic conditions.

North America was the largest regional market for the label free detection industry in 2023.

The global label free detection market is segmented into six major regions—North America, Europe, the Asia Pacific, Latin America, Middle East and Africa. North America was the largest segment in 2023 in the label-free detection market, followed by Europe and the Asia Pacific. Factors such as the presence of key market players such as Danaher Corporation (US), Waters Corporation (US), REVVITY, INC. (US), Ametek, Inc. (US) in the region, rising demand for label-free detection product for life sciences and clinical research, increasing research and development activities for drug discovery in the North America region, the availability of government funding for life science research, advances in label-free detection techniques, growth in the pharmaceutical and biopharmaceutical industries, and the rising incidence of cancer driving the growth of the label-free detection market in North America. North America has several national institutes that support biopharmaceutical and life science research activities. The National Institutes of Health (NIH) reported a budget of approximately USD 51.1 billion in 2024 for biomedical research. These funds are directed towards high-end research activities in the field of drug discovery and for the conversion of basic research to clinical research. These research studies make significant use of label free detection products.

Label-Free Detection Market by Region

To know about the assumptions considered for the study, download the pdf brochure

Key players in the label-free detection market include Danaher Corporation (US), Sartorius AG (Germany), Waters Corporation (US), Agilent Technologies, Inc. (US), Corning Incorporated (US), REVVITY, INC. (US), Ametek, Inc. (US), Horiba, Ltd. (Japan), Spectris (UK), Shimadzu Corporation (Japan), Hitachi High-Tech Corporation (Japan), Attana AB (Sweden), Bruker Corporation (US), Bio-Rad Laboratories (US), ENDRESS+HAUSER  Group Services AG (Switzerland), Becton, Dickinson and Company (US), Nanotemper Technologies GmBH (Germany), Affinité Instruments (Canada), Biosensing Instrument (US), Unchained Labs. (US), BioNavis Ltd. (Finland), Gator Bio (US), Carterra, Inc. (US), Nicoya (Canada), BiOptix Analytical LLC (US), Plexera Bioscience (US), XanTec bioanalytics GmbH (Germany), BMG Labtech (Germany), RedShift BioAnalytics, Inc. (US), and lino Biotech AG (Switzerland).

Scope of the Label Free Detection Industry:

Report Metric

Details

Market Revenue in 2024

$515 million

Projected Revenue by 2029

$747 million

Revenue Rate

Poised to Grow at a CAGR of 7.7%

Market Driver

High sensitivity of label-free instruments

Market Opportunity

Increased focus on biomarker discovery

This report categorizes the label free detection market to forecast revenue and analyze trends in each of the following submarkets:

By Offering
  • Instruments
  • Consumables
    • Biosensor Chips
    • Microplates
    • Reagents & Kits
  • Software & Services
By Technology
  • Surface Plasmon Resonance
  • Differential Scanning Calorimetry
  • Bio-layer Interferometry
  • Isothermal Titration Calorimetry
  • Other Technologies
By Application
  • Binding Kinetics
  • Binding Thermodynamics
  • HIT Confirmation
  • Lead Generation
  • Endogenous Receptor Detection
  • Other Applications
By End User
  • Pharmaceutical & Biotechnology Companies
  • Academic & Research Institutes
  • Contract Research Organization
  • Other End Users
By Region
  • North America
    • US
    • Canada
  • Europe
    • Germany
    • UK
    • France
    • Italy
    • Spain
    • Rest of Europe (RoE)
  • Asia Pacific (APAC)
    • China
    • Japan
    • India
    • Australia
    • South Korea
    • Rest of Asia Pacific (RoAPAC)
  • Latin America
    • Brazil
    • Mexico
    • Rest of Latin America (RoLATAM)
  • Middle East
    • GCC
      • Saudi Arabia
      • UAE
      • Rest of GCC
    • Rest of Middle East
  • Africa

Recent Developments of Label Free Detection Industry:

  • In February 2024, Agilent Technologies, Inc., announced the integration of xCELLigence RTCA HT platform with the BioTek BioSpa 8 Automated Incubator. This integration offers a label-free, non-invasive, kinetic readout of cell proliferation and cytotoxicity that allows researchers to analyze up to eight 384-well E-Plates, increasing throughput and decreasing sample sizes.
  • In August 2023, Corning Incorporated launch Corning Videodrop, an optical technology that applies the principles of interferometric microscopy to quantify the size and concentration of nanoparticles. It is easy to use, fast, and reliable. Sample prep is also easy, being label free, and its operation is seamless.

Frequently Asked Questions (FAQ):

To speak to our analyst for a discussion on the above findings, click Speak to Analyst

Exclusive indicates content/data unique to MarketsandMarkets and not available with any competitors.

INTRODUCTION
32
RESEARCH METHODOLOGY
37
EXECUTIVE SUMMARY
49
PREMIUM INSIGHTS
53
MARKET OVERVIEW
57
  • 5.1 INTRODUCTION
  • 5.2 MARKET DYNAMICS
    DRIVERS
    - Technological advancements
    - Growing academic-industrial partnerships for drug discovery programs
    - High sensitivity of label-free technologies
    - Increasing R&D investments in biotechnology and pharmaceuticals
    RESTRAINTS
    - High cost of instruments
    - Technical complexity
    OPPORTUNITIES
    - Growing life science research in emerging economies
    - Rising demand for label-free detection technologies in point-of-care and portable devices for rapid and on-site analysis in various industries
    - Increased focus on biomarker discovery
    CHALLENGES
    - Sample complexity and interference
    - Stringent regulatory approval process
  • 5.3 TRENDS/DISRUPTIONS IMPACTING CUSTOMERS’ BUSINESSES
  • 5.4 TECHNOLOGY ANALYSIS
    KEY TECHNOLOGIES
    - Surface plasmon resonance (SPR)
    - Bio-layer interferometry (BLI)
    - Isothermal titration calorimetry (ITC)
    COMPLEMENTARY TECHNOLOGIES
    - Microfluidics
    - Artificial intelligence (AI)
    - Optical coherence tomography (OCT)
    ADJACENT TECHNOLOGIES
    - Mass spectrometry
    - Flow cytometry
    - Confocal microscopy
  • 5.5 SUPPLY CHAIN ANALYSIS
  • 5.6 VALUE CHAIN ANALYSIS
  • 5.7 PRICING ANALYSIS
  • 5.8 ECOSYSTEM ANALYSIS
    LABEL-FREE DETECTION MARKET: ROLE OF RAW MATERIAL SUPPLIERS
    LABEL-FREE DETECTION MARKET: ROLE OF MANUFACTURERS
    LABEL-FREE DETECTION MARKET: ROLE OF END USERS
    LABEL-FREE DETECTION MARKET: ROLE OF REGULATORY BODIES
  • 5.9 PATENT ANALYSIS
    PATENT METHODOLOGY
    PATENTS FILED, BY DOCUMENT TYPE, 2014–2023
    INNOVATION & PATENT APPLICATIONS
    TOP APPLICANTS
  • 5.10 KEY CONFERENCES & EVENTS IN 2024–2025
  • 5.11 REGULATORY LANDSCAPE
    REGULATORY BODIES, GOVERNMENT AGENCIES, AND OTHER ORGANIZATIONS
    REGULATORY SCENARIO
  • 5.12 PORTER’S FIVE FORCES ANALYSIS
    THREAT OF NEW ENTRANTS
    THREAT OF SUBSTITUTES
    BARGAINING POWER OF BUYERS
    BARGAINING POWER OF SUPPLIERS
    INTENSITY OF COMPETITIVE RIVALRY
  • 5.13 KEY STAKEHOLDERS & BUYING CRITERIA
    KEY STAKEHOLDERS IN BUYING PROCESS
    KEY BUYING CRITERIA FOR LABEL-FREE DETECTION PRODUCTS
  • 5.14 INVESTMENT & FUNDING SCENARIO
  • 5.15 IMPACT OF AI ON LABEL-FREE DETECTION MARKET
  • 5.16 TRADE ANALYSIS
LABEL-FREE DETECTION MARKET, BY OFFERING
117
  • 6.1 INTRODUCTION
  • 6.2 INSTRUMENTS
    TECHNOLOGICAL ADVANCEMENTS IN LABEL-FREE DETECTION SYSTEMS TO DRIVE INSTRUMENTS MARKET
  • 6.3 CONSUMABLES
    BIOSENSOR CHIPS
    - High specificity and need for real-time monitoring of molecular interactions to drive adoption
    MICROPLATES
    - Low cost to propel adoption among research laboratories and academic institutes
    REAGENTS & KITS
    - Availability of ready-to-use kits for assay development to drive market
  • 6.4 SOFTWARE & SERVICES
    AUTOMATION BENEFITS IN LABEL-FREE DETECTION TO SUPPORT DEMAND GROWTH
LABEL-FREE DETECTION MARKET, BY TECHNOLOGY
142
  • 7.1 INTRODUCTION
  • 7.2 SURFACE PLASMON RESONANCE
    GROWING USE OF SPR TECHNOLOGY IN AFFINITY AND KINETIC STUDIES TO FUEL MARKET GROWTH
  • 7.3 DIFFERENTIAL SCANNING CALORIMETRY
    WIDE USAGE IN DRUG DISCOVERY AND DEVELOPMENT FOR PROTEIN CHARACTERIZATION TO DRIVE MARKET
  • 7.4 BIO-LAYER INTERFEROMETRY
    MICROFLUIDICS-FREE NATURE OF BLI TO DRIVE MARKET
  • 7.5 ISOTHERMAL TITRATION CALORIMETRY
    RISING USE IN LABEL-FREE MEASUREMENT OF BINDING AFFINITY AND THERMODYNAMICS TO PROPEL MARKET GROWTH
  • 7.6 OTHER TECHNOLOGIES
LABEL-FREE DETECTION MARKET, BY APPLICATION
161
  • 8.1 INTRODUCTION
  • 8.2 BINDING KINETICS
    BINDING KINETICS TO HOLD LARGEST MARKET SHARE
  • 8.3 BINDING THERMODYNAMICS
    WIDE USAGE IN BASIC RESEARCH FOR DRUG MECHANISM ANALYSIS TO SUPPORT MARKET GROWTH
  • 8.4 HIT CONFIRMATION
    BENEFITS OVER OTHER APPROACHES FOR HTS TO DRIVE ADOPTION OF LABEL-FREE TECHNOLOGY
  • 8.5 LEAD GENERATION
    DATA GENERATION CAPABILITIES IN DRUG CANDIDATE SELECTION PROCESS TO SUPPORT DEMAND
  • 8.6 ENDOGENOUS RECEPTOR DETECTION
    HIGH SENSITIVITY OF LABEL-FREE ASSAYS TO PROPEL USAGE
  • 8.7 OTHER APPLICATIONS
LABEL-FREE DETECTION MARKET, BY END USER
183
  • 9.1 INTRODUCTION
  • 9.2 PHARMACEUTICAL & BIOTECHNOLOGY COMPANIES
    GROWING ADOPTION OF LFD TECHNOLOGIES TO FUEL MARKET GROWTH
  • 9.3 ACADEMIC & RESEARCH INSTITUTES
    RISING INDUSTRY-ACADEMIA COLLABORATIONS FOR RESEARCH TO DRIVE MARKET
  • 9.4 CONTRACT RESEARCH ORGANIZATIONS
    INCREASING PHARMACEUTICAL OUTSOURCING TO DRIVE MARKET GROWTH
  • 9.5 OTHER END USERS
LABEL-FREE DETECTION MARKET, BY REGION
198
  • 10.1 INTRODUCTION
  • 10.2 NORTH AMERICA
    NORTH AMERICA: MACROECONOMIC ANALYSIS
    US
    - US to dominate North American label-free detection market during study period
    CANADA
    - Increasing government support and funding for life science research to promote market growth
  • 10.3 EUROPE
    EUROPE: MACROECONOMIC ANALYSIS
    GERMANY
    - Increasing public and private funding for advanced cell-based research to drive market
    UK
    - Increasing R&D spending by government and pharmaceutical companies to fuel market growth
    FRANCE
    - Rising government healthcare investments and increasing focus on genomic medicine research to aid market growth
    ITALY
    - Increased focus on healthcare research and rising funding for new drug development to propel market growth
    SPAIN
    - Rising focus on personalized and translational medicine development to drive market
    REST OF EUROPE
  • 10.4 ASIA PACIFIC
    ASIA PACIFIC: MACROECONOMIC ANALYSIS
    CHINA
    - Improved medical service quality and growth in biopharmaceutical sector to drive market
    JAPAN
    - High R&D expenditure and improved healthcare access to stimulate market growth
    INDIA
    - Increasing R&D spending by pharmaceutical companies and growing government initiatives to drive market
    AUSTRALIA
    - Strategic geographical location and favorable regulatory environment to augment market growth
    SOUTH KOREA
    - Technological advancements and high healthcare spending to boost market growth
    REST OF ASIA PACIFIC
  • 10.5 LATIN AMERICA
    LATIN AMERICA: MACROECONOMIC ANALYSIS
    BRAZIL
    - Increased incidence of chronic diseases and improved public access to modern healthcare facilities to drive market
    MEXICO
    - Favorable trade agreements and government initiatives to spur market growth
    REST OF LATIN AMERICA
  • 10.6 MIDDLE EAST
    MIDDLE EAST: MACROECONOMIC ANALYSIS
    GCC COUNTRIES
    - Saudi Arabia
    - UAE
    - Rest of GCC Countries
    REST OF MIDDLE EAST
  • 10.7 AFRICA
    GROWING PHARMACEUTICAL AND BIOTECHNOLOGY INDUSTRIES TO DRIVE MARKET
    AFRICA: MACROECONOMIC ANALYSIS
COMPETITIVE LANDSCAPE
274
  • 11.1 INTRODUCTION
  • 11.2 KEY PLAYER STRATEGIES/RIGHT TO WIN
    OVERVIEW OF STRATEGIES ADOPTED BY KEY PLAYERS IN THE LABEL-FREE DETECTION MARKET
  • 11.3 REVENUE SHARE ANALYSIS
  • 11.4 MARKET SHARE ANALYSIS
  • 11.5 COMPANY EVALUATION MATRIX: KEY PLAYERS, 2023
    STARS
    EMERGING LEADERS
    PERVASIVE PLAYERS
    PARTICIPANTS
    COMPANY FOOTPRINT: KEY PLAYERS, 2023
    - Company footprint
    - Offering footprint
    - Technology footprint
    - Application footprint
    - Region footprint
  • 11.6 COMPANY EVALUATION MATRIX: STARTUPS/SMES, 2023
    PROGRESSIVE COMPANIES
    RESPONSIVE COMPANIES
    DYNAMIC COMPANIES
    STARTING BLOCKS
    COMPETITIVE BENCHMARKING: STARTUPS/SMES, 2023
  • 11.7 COMPANY VALUATION AND FINANCIAL METRICS
  • 11.8 BRAND/PRODUCT COMPARATIVE ANALYSIS
  • 11.9 COMPETITIVE SCENARIO
    PRODUCT LAUNCHES/ENHANCEMENTS/UPGRADES
    DEALS
    EXPANSIONS
    OTHER DEVELOPMENTS
COMPANY PROFILES
298
  • 12.1 KEY PLAYERS
    DANAHER CORPORATION
    - Business overview
    - Products offered
    - Recent developments
    - MnM view
    SARTORIUS AG
    - Business overview
    - Products offered
    - Recent developments
    - MnM view
    AGILENT TECHNOLOGIES, INC.
    - Business overview
    - Products offered
    - Recent developments
    - MnM view
    WATERS CORPORATION
    - Business overview
    - Products offered
    - Recent developments
    - MnM view
    CORNING INCORPORATED
    - Business overview
    - Products offered
    - Recent developments
    - MnM view
    REVVITY, INC.
    - Business overview
    - Products offered
    - Recent developments
    AMETEK, INC.
    - Business overview
    - Products offered
    HORIBA, LTD.
    - Business overview
    - Products offered
    SPECTRIS
    - Business overview
    - Products offered
    - Recent developments
    SHIMADZU CORPORATION
    - Business overview
    - Products offered
    HITACHI HIGH-TECH CORPORATION
    - Business overview
    - Products offered
    ATTANA AB
    - Business overview
    - Products offered
    BRUKER
    - Business overview
    - Products offered
    - Recent developments
    BIO-RAD LABORATORIES, INC.
    - Business overview
    - Products offered
    ENDRESS+HAUSER GROUP SERVICES AG
    - Business overview
    - Products offered
    - Recent developments
    BECTON, DICKINSON AND COMPANY
    - Business overview
    - Products offered
    - Recent developments
  • 12.2 OTHER PLAYERS
    NANOTEMPER TECHNOLOGIES GMBH
    AFFINITÉ INSTRUMENTS
    BIOSENSING INSTRUMENT
    UNCHAINED LABS
    BIONAVIS LTD.
    GATOR BIO
    CARTERRA, INC.
    NICOYA
    BIOPTIX ANALYTICAL LLC
    PLEXERA BIOSCIENCE
    XANTEC BIOANALYTICS GMBH
    BMG LABTECH
    REDSHIFT BIOANALYTICS, INC.
    LINO BIOTECH AG
APPENDIX
365
  • 13.1 DISCUSSION GUIDE
  • 13.2 KNOWLEDGESTORE: MARKETSANDMARKETS’ SUBSCRIPTION PORTAL
  • 13.3 CUSTOMIZATIONS OPTIONS
  • 13.4 RELATED REPORTS
  • 13.5 AUTHOR DETAILS
LIST OF TABLES
 
  • TABLE 1 IMPACT ANALYSIS OF SUPPLY-SIDE AND DEMAND-SIDE FACTORS
  • TABLE 2 LABEL-FREE DETECTION MARKET: RISK ASSESSMENT ANALYSIS
  • TABLE 3 LABEL-FREE DETECTION MARKET: IMPACT ANALYSIS
  • TABLE 4 AVERAGE SELLING PRICE FOR LABEL-FREE DETECTION PRODUCTS (2023)
  • TABLE 5 AVERAGE SELLING PRICE TREND FOR LABEL-FREE DETECTION PRODUCTS, 2021–2023
  • TABLE 6 AVERAGE SELLING PRICE FOR LABEL-FREE DETECTION PRODUCTS, BY REGION (2023)
  • TABLE 7 LABEL-FREE DETECTION MARKET: RAW MATERIAL SUPPLIERS
  • TABLE 8 LABEL-FREE DETECTION MARKET: ROLE OF MANUFACTURERS
  • TABLE 9 LABEL-FREE DETECTION MARKET: ROLE OF END USERS
  • TABLE 10 LABEL-FREE DETECTION MARKET: ROLE OF REGULATORY BODIES
  • TABLE 11 PATENTS FILED, 2014–2023
  • TABLE 12 TOP 20 PATENT OWNERS IN LABEL-FREE DETECTION MARKET, 2014–2023
  • TABLE 13 LABEL-FREE DETECTION MARKET: LIST OF CONFERENCES & EVENTS, 2024–2025
  • TABLE 14 NORTH AMERICA: REGULATORY BODIES, GOVERNMENT AGENCIES, AND OTHER ORGANIZATIONS
  • TABLE 15 EUROPE: REGULATORY BODIES, GOVERNMENT AGENCIES, AND OTHER ORGANIZATIONS
  • TABLE 16 ASIA PACIFIC: REGULATORY BODIES, GOVERNMENT AGENCIES, AND OTHER ORGANIZATIONS
  • TABLE 17 LATIN AMERICA: REGULATORY BODIES, GOVERNMENT AGENCIES, AND OTHER ORGANIZATIONS
  • TABLE 18 MIDDLE EAST: REGULATORY BODIES, GOVERNMENT AGENCIES, AND OTHER ORGANIZATIONS
  • TABLE 19 LABEL-FREE DETECTION MARKET: PORTER’S FIVE FORCES ANALYSIS
  • TABLE 20 BUYING CRITERIA FOR LABEL-FREE DETECTION PRODUCTS, BY END USER
  • TABLE 21 IMPORT VALUE (HS CODE 9027), BY COUNTRY, 2019–2023 (USD THOUSAND)
  • TABLE 22 EXPORT VALUE (HS CODE 9027), BY COUNTRY, 2019–2023 (USD THOUSAND)
  • TABLE 23 IMPORT VOLUME (HS CODE 9027), BY COUNTRY, 2019–2023 (TONS)
  • TABLE 24 EXPORT VOLUME (HS CODE 9027), BY COUNTRY, 2019–2023 (TONS)
  • TABLE 25 LABEL-FREE DETECTION MARKET, BY OFFERING, 2022–2029 (USD MILLION)
  • TABLE 26 INSTRUMENTS: PRODUCTS OFFERED, BY COMPANY
  • TABLE 27 LABEL-FREE DETECTION INSTRUMENTS MARKET, BY REGION, 2022–2029 (USD MILLION)
  • TABLE 28 NORTH AMERICA: LABEL-FREE DETECTION INSTRUMENTS MARKET, BY COUNTRY, 2022–2029 (USD MILLION)
  • TABLE 29 EUROPE: LABEL-FREE DETECTION INSTRUMENTS MARKET, BY COUNTRY, 2022–2029 (USD MILLION)
  • TABLE 30 ASIA PACIFIC: LABEL-FREE DETECTION INSTRUMENTS MARKET, BY COUNTRY, 2022–2029 (USD MILLION)
  • TABLE 31 LATIN AMERICA: LABEL-FREE DETECTION INSTRUMENTS MARKET, BY COUNTRY, 2022–2029 (USD MILLION)
  • TABLE 32 MIDDLE EAST: LABEL-FREE DETECTION INSTRUMENTS MARKET, BY REGION, 2022–2029 (USD MILLION)
  • TABLE 33 GCC COUNTRIES: LABEL-FREE DETECTION INSTRUMENTS MARKET, BY COUNTRY, 2022–2029 (USD MILLION)
  • TABLE 34 LABEL-FREE DETECTION INSTRUMENTS MARKET, BY TYPE, 2022–2029 (MILLION UNITS)
  • TABLE 35 LABEL-FREE DETECTION CONSUMABLES MARKET, BY TYPE, 2022–2029 (USD MILLION)
  • TABLE 36 LABEL-FREE DETECTION CONSUMABLES MARKET, BY REGION, 2022–2029 (USD MILLION)
  • TABLE 37 NORTH AMERICA: LABEL-FREE DETECTION CONSUMABLES MARKET, BY COUNTRY, 2022–2029 (USD MILLION)
  • TABLE 38 EUROPE: LABEL-FREE DETECTION CONSUMABLES MARKET, BY COUNTRY, 2022–2029 (USD MILLION)
  • TABLE 39 ASIA PACIFIC: LABEL-FREE DETECTION CONSUMABLES MARKET, BY COUNTRY, 2022–2029 (USD MILLION)
  • TABLE 40 LATIN AMERICA: LABEL-FREE DETECTION CONSUMABLES MARKET, BY COUNTRY, 2022–2029 (USD MILLION)
  • TABLE 41 MIDDLE EAST: LABEL-FREE DETECTION CONSUMABLES MARKET, BY REGION, 2022–2029 (USD MILLION)
  • TABLE 42 GCC COUNTRIES: LABEL-FREE DETECTION CONSUMABLES MARKET, BY COUNTRY, 2022–2029 (USD MILLION)
  • TABLE 43 BIOSENSOR CHIPS: PRODUCTS OFFERED, BY COMPANY
  • TABLE 44 BIOSENSOR CHIPS MARKET, BY REGION, 2022–2029 (USD MILLION)
  • TABLE 45 NORTH AMERICA: BIOSENSOR CHIPS MARKET, BY COUNTRY, 2022–2029 (USD MILLION)
  • TABLE 46 EUROPE: BIOSENSOR CHIPS MARKET, BY COUNTRY, 2022–2029 (USD MILLION)
  • TABLE 47 ASIA PACIFIC: BIOSENSOR CHIPS MARKET, BY COUNTRY, 2022–2029 (USD MILLION)
  • TABLE 48 LATIN AMERICA: BIOSENSOR CHIPS MARKET, BY COUNTRY, 2022–2029 (USD MILLION)
  • TABLE 49 MIDDLE EAST: BIOSENSOR CHIPS MARKET, BY REGION, 2022–2029 (USD MILLION)
  • TABLE 50 GCC COUNTRIES: BIOSENSOR CHIPS MARKET, BY COUNTRY, 2022–2029 (USD MILLION)
  • TABLE 51 MICROPLATES: PRODUCTS OFFERED, BY COMPANY
  • TABLE 52 MICROPLATES MARKET, BY REGION, 2022–2029 (USD MILLION)
  • TABLE 53 NORTH AMERICA: MICROPLATES MARKET, BY COUNTRY, 2022–2029 (USD MILLION)
  • TABLE 54 EUROPE: MICROPLATES MARKET, BY COUNTRY, 2022–2029 (USD MILLION)
  • TABLE 55 ASIA PACIFIC: MICROPLATES MARKET, BY COUNTRY, 2022–2029 (USD MILLION)
  • TABLE 56 LATIN AMERICA: MICROPLATES MARKET, BY COUNTRY, 2022–2029 (USD MILLION)
  • TABLE 57 MIDDLE EAST: MICROPLATES MARKET, BY REGION, 2022–2029 (USD MILLION)
  • TABLE 58 GCC COUNTRIES: MICROPLATES MARKET, BY COUNTRY, 2022–2029 (USD MILLION)
  • TABLE 59 REAGENTS & KITS: PRODUCTS OFFERED, BY COMPANY
  • TABLE 60 REAGENTS & KITS MARKET, BY REGION, 2022–2029 (USD MILLION)
  • TABLE 61 NORTH AMERICA: REAGENTS & KITS MARKET, BY COUNTRY, 2022–2029 (USD MILLION)
  • TABLE 62 EUROPE: REAGENTS & KITS MARKET, BY COUNTRY, 2022–2029 (USD MILLION)
  • TABLE 63 ASIA PACIFIC: REAGENTS & KITS MARKET, BY COUNTRY, 2022–2029 (USD MILLION)
  • TABLE 64 LATIN AMERICA: REAGENTS & KITS MARKET, BY COUNTRY, 2022–2029 (USD MILLION)
  • TABLE 65 MIDDLE EAST: REAGENTS & KITS MARKET, BY REGION, 2022–2029 (USD MILLION)
  • TABLE 66 GCC COUNTRIES: REAGENTS & KITS MARKET, BY COUNTRY, 2022–2029 (USD MILLION)
  • TABLE 67 SOFTWARE & SERVICES: OFFERINGS, BY COMPANY
  • TABLE 68 LABEL-FREE DETECTION SOFTWARE & SERVICES MARKET, BY REGION, 2022–2029 (USD MILLION)
  • TABLE 69 NORTH AMERICA: LABEL-FREE DETECTION SOFTWARE & SERVICES MARKET, BY COUNTRY, 2022–2029 (USD MILLION)
  • TABLE 70 EUROPE: LABEL-FREE DETECTION SOFTWARE & SERVICES MARKET, BY COUNTRY, 2022–2029 (USD MILLION)
  • TABLE 71 ASIA PACIFIC: LABEL-FREE DETECTION SOFTWARE & SERVICES MARKET, BY COUNTRY, 2022–2029 (USD MILLION)
  • TABLE 72 LATIN AMERICA: LABEL-FREE DETECTION SOFTWARE & SERVICES MARKET, BY COUNTRY, 2022–2029 (USD MILLION)
  • TABLE 73 MIDDLE EAST: LABEL-FREE DETECTION SOFTWARE & SERVICES MARKET, BY REGION, 2022–2029 (USD MILLION)
  • TABLE 74 GCC COUNTRIES: LABEL-FREE DETECTION SOFTWARE & SERVICES MARKET, BY COUNTRY, 2022–2029 (USD MILLION)
  • TABLE 75 LABEL-FREE DETECTION MARKET, BY TECHNOLOGY, 2022–2029 (USD MILLION)
  • TABLE 76 LABEL-FREE DETECTION MARKET FOR SURFACE PLASMON RESONANCE, BY REGION, 2022–2029 (USD MILLION)
  • TABLE 77 NORTH AMERICA: LABEL-FREE DETECTION MARKET FOR SURFACE PLASMON RESONANCE, BY COUNTRY, 2022–2029 (USD MILLION)
  • TABLE 78 EUROPE: LABEL-FREE DETECTION MARKET FOR SURFACE PLASMON RESONANCE, BY COUNTRY, 2022–2029 (USD MILLION)
  • TABLE 79 ASIA PACIFIC: LABEL-FREE DETECTION MARKET FOR SURFACE PLASMON RESONANCE, BY COUNTRY, 2022–2029 (USD MILLION)
  • TABLE 80 LATIN AMERICA: LABEL-FREE DETECTION MARKET FOR SURFACE PLASMON RESONANCE, BY COUNTRY, 2022–2029 (USD MILLION)
  • TABLE 81 MIDDLE EAST: LABEL-FREE DETECTION MARKET FOR SURFACE PLASMON RESONANCE, BY REGION, 2022–2029 (USD MILLION)
  • TABLE 82 GCC COUNTRIES: LABEL-FREE DETECTION MARKET FOR SURFACE PLASMON RESONANCE, BY COUNTRY, 2022–2029 (USD MILLION)
  • TABLE 83 LABEL-FREE DETECTION MARKET FOR DIFFERENTIAL SCANNING CALORIMETRY, BY REGION, 2022–2029 (USD MILLION)
  • TABLE 84 NORTH AMERICA: LABEL-FREE DETECTION MARKET FOR DIFFERENTIAL SCANNING CALORIMETRY, BY COUNTRY, 2022–2029 (USD MILLION)
  • TABLE 85 EUROPE: LABEL-FREE DETECTION MARKET FOR DIFFERENTIAL SCANNING CALORIMETRY, BY COUNTRY, 2022–2029 (USD MILLION)
  • TABLE 86 ASIA PACIFIC: LABEL-FREE DETECTION MARKET FOR DIFFERENTIAL SCANNING CALORIMETRY, BY COUNTRY, 2022–2029 (USD MILLION)
  • TABLE 87 LATIN AMERICA: LABEL-FREE DETECTION MARKET FOR DIFFERENTIAL SCANNING CALORIMETRY, BY COUNTRY, 2022–2029 (USD MILLION)
  • TABLE 88 MIDDLE EAST: LABEL-FREE DETECTION MARKET FOR DIFFERENTIAL SCANNING CALORIMETRY, BY REGION, 2022–2029 (USD MILLION)
  • TABLE 89 GCC COUNTRIES: LABEL-FREE DETECTION MARKET FOR DIFFERENTIAL SCANNING CALORIMETRY, BY COUNTRY, 2022–2029 (USD MILLION)
  • TABLE 90 LABEL-FREE DETECTION MARKET FOR BIO-LAYER INTERFEROMETRY, BY REGION, 2022–2029 (USD MILLION)
  • TABLE 91 NORTH AMERICA: LABEL-FREE DETECTION MARKET FOR BIO-LAYER INTERFEROMETRY, BY COUNTRY, 2022–2029 (USD MILLION)
  • TABLE 92 EUROPE: LABEL-FREE DETECTION MARKET FOR BIO-LAYER INTERFEROMETRY, BY COUNTRY, 2022–2029 (USD MILLION)
  • TABLE 93 ASIA PACIFIC: LABEL-FREE DETECTION MARKET FOR BIO-LAYER INTERFEROMETRY, BY COUNTRY, 2022–2029 (USD MILLION)
  • TABLE 94 LATIN AMERICA: LABEL-FREE DETECTION MARKET FOR BIO-LAYER INTERFEROMETRY, BY COUNTRY, 2022–2029 (USD MILLION)
  • TABLE 95 MIDDLE EAST: LABEL-FREE DETECTION MARKET FOR BIO-LAYER INTERFEROMETRY, BY REGION, 2022–2029 (USD MILLION)
  • TABLE 96 GCC COUNTRIES: LABEL-FREE DETECTION MARKET FOR BIO-LAYER INTERFEROMETRY, BY COUNTRY, 2022–2029 (USD MILLION)
  • TABLE 97 LABEL-FREE DETECTION MARKET FOR ISOTHERMAL TITRATION CALORIMETRY, BY REGION, 2022–2029 (USD MILLION)
  • TABLE 98 NORTH AMERICA: LABEL-FREE DETECTION MARKET FOR ISOTHERMAL TITRATION CALORIMETRY, BY COUNTRY, 2022–2029 (USD MILLION)
  • TABLE 99 EUROPE: LABEL-FREE DETECTION MARKET FOR ISOTHERMAL TITRATION CALORIMETRY, BY COUNTRY, 2022–2029 (USD MILLION)
  • TABLE 100 ASIA PACIFIC: LABEL-FREE DETECTION MARKET FOR ISOTHERMAL TITRATION CALORIMETRY, BY COUNTRY, 2022–2029 (USD MILLION)
  • TABLE 101 LATIN AMERICA: LABEL-FREE DETECTION MARKET FOR ISOTHERMAL TITRATION CALORIMETRY, BY COUNTRY, 2022–2029 (USD MILLION)
  • TABLE 102 MIDDLE EAST: LABEL-FREE DETECTION MARKET FOR ISOTHERMAL TITRATION CALORIMETRY, BY COUNTRY, 2022–2029 (USD MILLION)
  • TABLE 103 GCC COUNTRIES: LABEL-FREE DETECTION MARKET FOR ISOTHERMAL TITRATION CALORIMETRY, BY COUNTRY, 2022–2029 (USD MILLION)
  • TABLE 104 OTHER LABEL-FREE DETECTION TECHNOLOGIES MARKET, BY REGION, 2022–2029 (USD MILLION)
  • TABLE 105 NORTH AMERICA: OTHER LABEL-FREE DETECTION TECHNOLOGIES MARKET, BY COUNTRY, 2022–2029 (USD MILLION)
  • TABLE 106 EUROPE: OTHER LABEL-FREE DETECTION TECHNOLOGIES MARKET, BY COUNTRY, 2022–2029 (USD MILLION)
  • TABLE 107 ASIA PACIFIC: OTHER LABEL-FREE DETECTION TECHNOLOGIES MARKET, BY COUNTRY, 2022–2029 (USD MILLION)
  • TABLE 108 LATIN AMERICA: OTHER LABEL-FREE DETECTION TECHNOLOGIES MARKET, BY COUNTRY, 2022–2029 (USD MILLION)
  • TABLE 109 MIDDLE EAST: OTHER LABEL-FREE DETECTION TECHNOLOGIES MARKET, BY REGION, 2022–2029 (USD MILLION)
  • TABLE 110 GCC COUNTRIES: OTHER LABEL-FREE DETECTION TECHNOLOGIES MARKET, BY COUNTRY, 2022–2029 (USD MILLION)
  • TABLE 111 LABEL-FREE DETECTION MARKET, BY APPLICATION, 2022–2029 (USD MILLION)
  • TABLE 112 LABEL-FREE DETECTION MARKET FOR BINDING KINETICS, BY REGION, 2022–2029 (USD MILLION)
  • TABLE 113 NORTH AMERICA: LABEL-FREE DETECTION MARKET FOR BINDING KINETICS, BY COUNTRY, 2022–2029 (USD MILLION)
  • TABLE 114 EUROPE: LABEL-FREE DETECTION MARKET FOR BINDING KINETICS, BY COUNTRY, 2022–2029 (USD MILLION)
  • TABLE 115 ASIA PACIFIC: LABEL-FREE DETECTION MARKET FOR BINDING KINETICS, BY COUNTRY, 2022–2029 (USD MILLION)
  • TABLE 116 LATIN AMERICA: LABEL-FREE DETECTION MARKET FOR BINDING KINETICS, BY COUNTRY, 2022–2029 (USD MILLION)
  • TABLE 117 MIDDLE EAST: LABEL-FREE DETECTION MARKET FOR BINDING KINETICS, BY REGION, 2022–2029 (USD MILLION)
  • TABLE 118 GCC COUNTRIES: LABEL-FREE DETECTION MARKET FOR BINDING KINETICS, BY COUNTRY, 2022–2029 (USD MILLION)
  • TABLE 119 LABEL-FREE DETECTION MARKET FOR BINDING THERMODYNAMICS, BY REGION, 2022–2029 (USD MILLION)
  • TABLE 120 NORTH AMERICA: LABEL-FREE DETECTION MARKET FOR BINDING THERMODYNAMICS, BY COUNTRY, 2022–2029 (USD MILLION)
  • TABLE 121 EUROPE: LABEL-FREE DETECTION MARKET FOR BINDING THERMODYNAMICS, BY COUNTRY, 2022–2029 (USD MILLION)
  • TABLE 122 ASIA PACIFIC: LABEL-FREE DETECTION MARKET FOR BINDING THERMODYNAMICS, BY COUNTRY, 2022–2029 (USD MILLION)
  • TABLE 123 LATIN AMERICA: LABEL-FREE DETECTION MARKET FOR BINDING THERMODYNAMICS, BY COUNTRY, 2022–2029 (USD MILLION)
  • TABLE 124 MIDDLE EAST: LABEL-FREE DETECTION MARKET FOR BINDING THERMODYNAMICS, BY REGION, 2022–2029 (USD MILLION)
  • TABLE 125 GCC COUNTRIES: LABEL-FREE DETECTION MARKET FOR BINDING THERMODYNAMICS, BY COUNTRY, 2022–2029 (USD MILLION)
  • TABLE 126 LABEL-FREE DETECTION MARKET FOR HIT CONFIRMATION, BY REGION, 2022–2029 (USD MILLION)
  • TABLE 127 NORTH AMERICA: LABEL-FREE DETECTION MARKET FOR HIT CONFIRMATION, BY COUNTRY, 2022–2029 (USD MILLION)
  • TABLE 128 EUROPE: LABEL-FREE DETECTION MARKET FOR HIT CONFIRMATION, BY COUNTRY, 2022–2029 (USD MILLION)
  • TABLE 129 ASIA PACIFIC: LABEL-FREE DETECTION MARKET FOR HIT CONFIRMATION, BY COUNTRY, 2022–2029 (USD MILLION)
  • TABLE 130 LATIN AMERICA: LABEL-FREE DETECTION MARKET FOR HIT CONFIRMATION, BY COUNTRY, 2022–2029 (USD MILLION)
  • TABLE 131 MIDDLE EAST: LABEL-FREE DETECTION MARKET FOR HIT CONFIRMATION, BY REGION, 2022–2029 (USD MILLION)
  • TABLE 132 GCC COUNTRIES: LABEL-FREE DETECTION MARKET FOR HIT CONFIRMATION, BY COUNTRY, 2022–2029 (USD MILLION)
  • TABLE 133 LABEL-FREE DETECTION MARKET FOR LEAD GENERATION, BY REGION, 2022–2029 (USD MILLION)
  • TABLE 134 NORTH AMERICA: LABEL-FREE DETECTION MARKET FOR LEAD GENERATION, BY COUNTRY, 2022–2029 (USD MILLION)
  • TABLE 135 EUROPE: LABEL-FREE DETECTION MARKET FOR LEAD GENERATION, BY COUNTRY, 2022–2029 (USD MILLION)
  • TABLE 136 ASIA PACIFIC: LABEL-FREE DETECTION MARKET FOR LEAD GENERATION, BY COUNTRY, 2022–2029 (USD MILLION)
  • TABLE 137 LATIN AMERICA: LABEL-FREE DETECTION MARKET FOR LEAD GENERATION, BY COUNTRY, 2022–2029 (USD MILLION)
  • TABLE 138 MIDDLE EAST: LABEL-FREE DETECTION MARKET FOR LEAD GENERATION, BY REGION, 2022–2029 (USD MILLION)
  • TABLE 139 GCC COUNTRIES: LABEL-FREE DETECTION MARKET FOR LEAD GENERATION, BY COUNTRY, 2022–2029 (USD MILLION)
  • TABLE 140 LABEL-FREE DETECTION MARKET FOR ENDOGENOUS RECEPTOR DETECTION, BY REGION, 2022–2029 (USD MILLION)
  • TABLE 141 NORTH AMERICA: LABEL-FREE DETECTION MARKET FOR ENDOGENOUS RECEPTOR DETECTION, BY COUNTRY, 2022–2029 (USD MILLION)
  • TABLE 142 EUROPE: LABEL-FREE DETECTION MARKET FOR ENDOGENOUS RECEPTOR DETECTION, BY COUNTRY, 2022–2029 (USD MILLION)
  • TABLE 143 ASIA PACIFIC: LABEL-FREE DETECTION MARKET FOR ENDOGENOUS RECEPTOR DETECTION, BY COUNTRY, 2022–2029 (USD MILLION)
  • TABLE 144 LATIN AMERICA: LABEL-FREE DETECTION MARKET FOR ENDOGENOUS RECEPTOR DETECTION, BY COUNTRY, 2022–2029 (USD MILLION)
  • TABLE 145 MIDDLE EAST: LABEL-FREE DETECTION MARKET FOR ENDOGENOUS RECEPTOR DETECTION, BY REGION, 2022–2029 (USD MILLION)
  • TABLE 146 GCC COUNTRIES: LABEL-FREE DETECTION MARKET FOR ENDOGENOUS RECEPTOR DETECTION, BY COUNTRY, 2022–2029 (USD MILLION)
  • TABLE 147 LABEL-FREE DETECTION MARKET FOR OTHER APPLICATIONS, BY REGION, 2022–2029 (USD MILLION)
  • TABLE 148 NORTH AMERICA: LABEL-FREE DETECTION MARKET FOR OTHER APPLICATIONS, BY COUNTRY, 2022–2029 (USD MILLION)
  • TABLE 149 EUROPE: LABEL-FREE DETECTION MARKET FOR OTHER APPLICATIONS, BY COUNTRY, 2022–2029 (USD MILLION)
  • TABLE 150 ASIA PACIFIC: LABEL-FREE DETECTION MARKET FOR OTHER APPLICATIONS, BY COUNTRY, 2022–2029 (USD MILLION)
  • TABLE 151 LATIN AMERICA: LABEL-FREE DETECTION MARKET FOR OTHER APPLICATIONS, BY COUNTRY, 2022–2029 (USD MILLION)
  • TABLE 152 MIDDLE EAST: LABEL-FREE DETECTION MARKET FOR OTHER APPLICATIONS, BY REGION, 2022–2029 (USD MILLION)
  • TABLE 153 GCC COUNTRIES: LABEL-FREE DETECTION MARKET FOR OTHER APPLICATIONS, BY COUNTRY, 2022–2029 (USD MILLION)
  • TABLE 154 LABEL-FREE DETECTION MARKET, BY END USER, 2022–2029 (USD MILLION)
  • TABLE 155 LABEL-FREE DETECTION MARKET FOR PHARMACEUTICAL & BIOTECHNOLOGY COMPANIES, BY REGION, 2022–2029 (USD MILLION)
  • TABLE 156 NORTH AMERICA: LABEL-FREE DETECTION MARKET FOR PHARMACEUTICAL & BIOTECHNOLOGY COMPANIES, BY COUNTRY, 2022–2029 (USD MILLION)
  • TABLE 157 EUROPE: LABEL-FREE DETECTION MARKET FOR PHARMACEUTICAL & BIOTECHNOLOGY COMPANIES, BY COUNTRY, 2022–2029 (USD MILLION)
  • TABLE 158 ASIA PACIFIC: LABEL-FREE DETECTION MARKET FOR PHARMACEUTICAL & BIOTECHNOLOGY COMPANIES, BY COUNTRY, 2022–2029 (USD MILLION)
  • TABLE 159 LATIN AMERICA: LABEL-FREE DETECTION MARKET FOR PHARMACEUTICAL & BIOTECHNOLOGY COMPANIES, BY COUNTRY, 2022–2029 (USD MILLION)
  • TABLE 160 MIDDLE EAST: LABEL-FREE DETECTION MARKET FOR PHARMACEUTICAL & BIOTECHNOLOGY COMPANIES, BY REGION, 2022–2029 (USD MILLION)
  • TABLE 161 GCC COUNTRIES: LABEL-FREE DETECTION MARKET FOR PHARMACEUTICAL & BIOTECHNOLOGY COMPANIES, BY COUNTRY, 2022–2029 (USD MILLION)
  • TABLE 162 LABEL-FREE DETECTION MARKET FOR ACADEMIC & RESEARCH INSTITUTES, BY REGION, 2022–2029 (USD MILLION)
  • TABLE 163 NORTH AMERICA: LABEL-FREE DETECTION MARKET FOR ACADEMIC & RESEARCH INSTITUTES, BY COUNTRY, 2022–2029 (USD MILLION)
  • TABLE 164 EUROPE: LABEL-FREE DETECTION MARKET FOR ACADEMIC & RESEARCH INSTITUTES, BY COUNTRY, 2022–2029 (USD MILLION)
  • TABLE 165 ASIA PACIFIC: LABEL-FREE DETECTION MARKET FOR ACADEMIC & RESEARCH INSTITUTES, BY COUNTRY, 2022–2029 (USD MILLION)
  • TABLE 166 LATIN AMERICA: LABEL-FREE DETECTION MARKET FOR ACADEMIC & RESEARCH INSTITUTES, BY COUNTRY, 2022–2029 (USD MILLION)
  • TABLE 167 MIDDLE EAST: LABEL-FREE DETECTION MARKET FOR ACADEMIC & RESEARCH INSTITUTES, BY REGION, 2022–2029 (USD MILLION)
  • TABLE 168 GCC COUNTRIES: LABEL-FREE DETECTION MARKET FOR ACADEMIC & RESEARCH INSTITUTES, BY COUNTRY, 2022–2029 (USD MILLION)
  • TABLE 169 LABEL-FREE DETECTION MARKET FOR CONTRACT RESEARCH ORGANIZATIONS, BY REGION, 2022–2029 (USD MILLION)
  • TABLE 170 NORTH AMERICA: LABEL-FREE DETECTION MARKET FOR CONTRACT RESEARCH ORGANIZATIONS, BY COUNTRY, 2022–2029 (USD MILLION)
  • TABLE 171 EUROPE: LABEL-FREE DETECTION MARKET FOR CONTRACT RESEARCH ORGANIZATIONS, BY COUNTRY, 2022–2029 (USD MILLION)
  • TABLE 172 ASIA PACIFIC: LABEL-FREE DETECTION MARKET FOR CONTRACT RESEARCH ORGANIZATIONS, BY COUNTRY, 2022–2029 (USD MILLION)
  • TABLE 173 LATIN AMERICA: LABEL-FREE DETECTION MARKET FOR CONTRACT RESEARCH ORGANIZATIONS, BY COUNTRY, 2022–2029 (USD MILLION)
  • TABLE 174 MIDDLE EAST: LABEL-FREE DETECTION MARKET FOR CONTRACT RESEARCH ORGANIZATIONS, BY REGION, 2022–2029 (USD MILLION)
  • TABLE 175 GCC COUNTRIES: LABEL-FREE DETECTION MARKET FOR CONTRACT RESEARCH ORGANIZATIONS, BY COUNTRY, 2022–2029 (USD MILLION)
  • TABLE 176 LABEL-FREE DETECTION MARKET FOR OTHER END USERS, BY REGION, 2022–2029 (USD MILLION)
  • TABLE 177 NORTH AMERICA: LABEL-FREE DETECTION MARKET FOR OTHER END USERS, BY COUNTRY, 2022–2029 (USD MILLION)
  • TABLE 178 EUROPE: LABEL-FREE DETECTION MARKET FOR OTHER END USERS, BY COUNTRY, 2022–2029 (USD MILLION)
  • TABLE 179 ASIA PACIFIC: LABEL-FREE DETECTION MARKET FOR OTHER END USERS, BY COUNTRY, 2022–2029 (USD MILLION)
  • TABLE 180 LATIN AMERICA: LABEL-FREE DETECTION MARKET FOR OTHER END USERS, BY COUNTRY, 2022–2029 (USD MILLION)
  • TABLE 181 MIDDLE EAST: LABEL-FREE DETECTION MARKET FOR OTHER END USERS, BY REGION, 2022–2029 (USD MILLION)
  • TABLE 182 GCC COUNTRIES: LABEL-FREE DETECTION MARKET FOR OTHER END USERS, BY COUNTRY, 2022–2029 (USD MILLION)
  • TABLE 183 LABEL-FREE DETECTION MARKET, BY REGION, 2022–2029 (USD MILLION)
  • TABLE 184 NORTH AMERICA: LABEL-FREE DETECTION MARKET, BY COUNTRY, 2022–2029 (USD MILLION)
  • TABLE 185 NORTH AMERICA: LABEL-FREE DETECTION MARKET, BY OFFERING, 2022–2029 (USD MILLION)
  • TABLE 186 NORTH AMERICA: LABEL-FREE DETECTION CONSUMABLES MARKET, BY TYPE, 2022–2029 (USD MILLION)
  • TABLE 187 NORTH AMERICA: LABEL-FREE DETECTION MARKET, BY TECHNOLOGY, 2022–2029 (USD MILLION)
  • TABLE 188 NORTH AMERICA: LABEL-FREE DETECTION MARKET, BY APPLICATION, 2022–2029 (USD MILLION)
  • TABLE 189 NORTH AMERICA: LABEL-FREE DETECTION MARKET, BY END USER, 2022–2029 (USD MILLION)
  • TABLE 190 US: LABEL-FREE DETECTION MARKET, BY OFFERING, 2022–2029 (USD MILLION)
  • TABLE 191 US: LABEL-FREE DETECTION CONSUMABLES MARKET, BY TYPE, 2022–2029 (USD MILLION)
  • TABLE 192 US: LABEL-FREE DETECTION MARKET, BY TECHNOLOGY, 2022–2029 (USD MILLION)
  • TABLE 193 US: LABEL-FREE DETECTION MARKET, BY APPLICATION, 2022–2029 (USD MILLION)
  • TABLE 194 US: LABEL-FREE DETECTION MARKET, BY END USER, 2022–2029 (USD MILLION)
  • TABLE 195 CANADA: LABEL-FREE DETECTION MARKET, BY OFFERING, 2022–2029 (USD MILLION)
  • TABLE 196 CANADA: LABEL-FREE DETECTION CONSUMABLES MARKET, BY TYPE, 2022–2029 (USD MILLION)
  • TABLE 197 CANADA: LABEL-FREE DETECTION MARKET, BY TECHNOLOGY, 2022–2029 (USD MILLION)
  • TABLE 198 CANADA: LABEL-FREE DETECTION MARKET, BY APPLICATION, 2022–2029 (USD MILLION)
  • TABLE 199 CANADA: LABEL-FREE DETECTION MARKET, BY END USER, 2022–2029 (USD MILLION)
  • TABLE 200 EUROPE: LABEL-FREE DETECTION MARKET, BY COUNTRY, 2022–2029 (USD MILLION)
  • TABLE 201 EUROPE: LABEL-FREE DETECTION MARKET, BY OFFERING, 2022–2029 (USD MILLION)
  • TABLE 202 EUROPE: LABEL-FREE DETECTION CONSUMABLES MARKET, BY TYPE, 2022–2029 (USD MILLION)
  • TABLE 203 EUROPE: LABEL-FREE DETECTION MARKET, BY TECHNOLOGY, 2022–2029 (USD MILLION)
  • TABLE 204 EUROPE: LABEL-FREE DETECTION MARKET, BY APPLICATION, 2022–2029 (USD MILLION)
  • TABLE 205 EUROPE: LABEL-FREE DETECTION MARKET, BY END USER, 2022–2029 (USD MILLION)
  • TABLE 206 GERMANY: LABEL-FREE DETECTION MARKET, BY OFFERING, 2022–2029 (USD MILLION)
  • TABLE 207 GERMANY: LABEL-FREE DETECTION CONSUMABLES MARKET, BY TYPE, 2022–2029 (USD MILLION)
  • TABLE 208 GERMANY: LABEL-FREE DETECTION MARKET, BY TECHNOLOGY, 2022–2029 (USD MILLION)
  • TABLE 209 GERMANY: LABEL-FREE DETECTION MARKET, BY APPLICATION, 2022–2029 (USD MILLION)
  • TABLE 210 GERMANY: LABEL-FREE DETECTION MARKET, BY END USER, 2022–2029 (USD MILLION)
  • TABLE 211 UK: LABEL-FREE DETECTION MARKET, BY OFFERING, 2022–2029 (USD MILLION)
  • TABLE 212 UK: LABEL-FREE DETECTION CONSUMABLES MARKET, BY TYPE, 2022–2029 (USD MILLION)
  • TABLE 213 UK: LABEL-FREE DETECTION MARKET, BY TECHNOLOGY, 2022–2029 (USD MILLION)
  • TABLE 214 UK: LABEL-FREE DETECTION MARKET, BY APPLICATION, 2022–2029 (USD MILLION)
  • TABLE 215 UK: LABEL-FREE DETECTION MARKET, BY END USER, 2022–2029 (USD MILLION)
  • TABLE 216 FRANCE: LABEL-FREE DETECTION MARKET, BY OFFERING, 2022–2029 (USD MILLION)
  • TABLE 217 FRANCE: LABEL-FREE DETECTION CONSUMABLES MARKET, BY TYPE, 2022–2029 (USD MILLION)
  • TABLE 218 FRANCE: LABEL-FREE DETECTION MARKET, BY TECHNOLOGY, 2022–2029 (USD MILLION)
  • TABLE 219 FRANCE: LABEL-FREE DETECTION MARKET, BY APPLICATION, 2022–2029 (USD MILLION)
  • TABLE 220 FRANCE: LABEL-FREE DETECTION MARKET, BY END USER, 2022–2029 (USD MILLION)
  • TABLE 221 ITALY: LABEL-FREE DETECTION MARKET, BY OFFERING, 2022–2029 (USD MILLION)
  • TABLE 222 ITALY: LABEL-FREE DETECTION CONSUMABLES MARKET, BY TYPE, 2022–2029 (USD MILLION)
  • TABLE 223 ITALY: LABEL-FREE DETECTION MARKET, BY TECHNOLOGY, 2022–2029 (USD MILLION)
  • TABLE 224 ITALY: LABEL-FREE DETECTION MARKET, BY APPLICATION, 2022–2029 (USD MILLION)
  • TABLE 225 ITALY: LABEL-FREE DETECTION MARKET, BY END USER, 2022–2029 (USD MILLION)
  • TABLE 226 SPAIN: LABEL-FREE DETECTION MARKET, BY OFFERING, 2022–2029 (USD MILLION)
  • TABLE 227 SPAIN: LABEL-FREE DETECTION CONSUMABLES MARKET, BY TYPE, 2022–2029 (USD MILLION)
  • TABLE 228 SPAIN: LABEL-FREE DETECTION MARKET, BY TECHNOLOGY, 2022–2029 (USD MILLION)
  • TABLE 229 SPAIN: LABEL-FREE DETECTION MARKET, BY APPLICATION, 2022–2029 (USD MILLION)
  • TABLE 230 SPAIN: LABEL-FREE DETECTION MARKET, BY END USER, 2022–2029 (USD MILLION)
  • TABLE 231 REST OF EUROPE: LABEL-FREE DETECTION MARKET, BY OFFERING, 2022–2029 (USD MILLION)
  • TABLE 232 REST OF EUROPE: LABEL-FREE DETECTION CONSUMABLES MARKET, BY TYPE, 2022–2029 (USD MILLION)
  • TABLE 233 REST OF EUROPE: LABEL-FREE DETECTION MARKET, BY TECHNOLOGY, 2022–2029 (USD MILLION)
  • TABLE 234 REST OF EUROPE: LABEL-FREE DETECTION MARKET, BY APPLICATION, 2022–2029 (USD MILLION)
  • TABLE 235 REST OF EUROPE: LABEL-FREE DETECTION MARKET, BY END USER, 2022–2029 (USD MILLION)
  • TABLE 236 ASIA PACIFIC: LABEL-FREE DETECTION MARKET, BY COUNTRY, 2022–2029 (USD MILLION)
  • TABLE 237 ASIA PACIFIC: LABEL-FREE DETECTION MARKET, BY OFFERING, 2022–2029 (USD MILLION)
  • TABLE 238 ASIA PACIFIC: LABEL-FREE DETECTION CONSUMABLES MARKET, BY TYPE, 2022–2029 (USD MILLION)
  • TABLE 239 ASIA PACIFIC: LABEL-FREE DETECTION MARKET, BY TECHNOLOGY, 2022–2029 (USD MILLION)
  • TABLE 240 ASIA PACIFIC: LABEL-FREE DETECTION MARKET, BY APPLICATION, 2022–2029 (USD MILLION)
  • TABLE 241 ASIA PACIFIC: LABEL-FREE DETECTION MARKET, BY END USER, 2022–2029 (USD MILLION)
  • TABLE 242 CHINA: LABEL-FREE DETECTION MARKET, BY OFFERING, 2022–2029 (USD MILLION)
  • TABLE 243 CHINA: LABEL-FREE DETECTION CONSUMABLES MARKET, BY TYPE, 2022–2029 (USD MILLION)
  • TABLE 244 CHINA: LABEL-FREE DETECTION MARKET, BY TECHNOLOGY, 2022–2029 (USD MILLION)
  • TABLE 245 CHINA: LABEL-FREE DETECTION MARKET, BY APPLICATION, 2022–2029 (USD MILLION)
  • TABLE 246 CHINA: LABEL-FREE DETECTION MARKET, BY END USER, 2022–2029 (USD MILLION)
  • TABLE 247 JAPAN: LABEL-FREE DETECTION MARKET, BY OFFERING, 2022–2029 (USD MILLION)
  • TABLE 248 JAPAN: LABEL-FREE DETECTION CONSUMABLES MARKET, BY TYPE, 2022–2029 (USD MILLION)
  • TABLE 249 JAPAN: LABEL-FREE DETECTION MARKET, BY TECHNOLOGY, 2022–2029 (USD MILLION)
  • TABLE 250 JAPAN: LABEL-FREE DETECTION MARKET, BY APPLICATION, 2022–2029 (USD MILLION)
  • TABLE 251 JAPAN: LABEL-FREE DETECTION MARKET, BY END USER, 2022–2029 (USD MILLION)
  • TABLE 252 INDIA: LABEL-FREE DETECTION MARKET, BY OFFERING, 2022–2029 (USD MILLION)
  • TABLE 253 INDIA: LABEL-FREE DETECTION CONSUMABLES MARKET, BY TYPE, 2022–2029 (USD MILLION)
  • TABLE 254 INDIA: LABEL-FREE DETECTION MARKET, BY TECHNOLOGY, 2022–2029 (USD MILLION)
  • TABLE 255 INDIA: LABEL-FREE DETECTION MARKET, BY APPLICATION, 2022–2029 (USD MILLION)
  • TABLE 256 INDIA: LABEL-FREE DETECTION MARKET, BY END USER, 2022–2029 (USD MILLION)
  • TABLE 257 AUSTRALIA: LABEL-FREE DETECTION MARKET, BY OFFERING, 2022–2029 (USD MILLION)
  • TABLE 258 AUSTRALIA: LABEL-FREE DETECTION CONSUMABLES MARKET, BY TYPE, 2022–2029 (USD MILLION)
  • TABLE 259 AUSTRALIA: LABEL-FREE DETECTION MARKET, BY TECHNOLOGY, 2022–2029 (USD MILLION)
  • TABLE 260 AUSTRALIA: LABEL-FREE DETECTION MARKET, BY APPLICATION, 2022–2029 (USD MILLION)
  • TABLE 261 AUSTRALIA: LABEL-FREE DETECTION MARKET, BY END USER, 2022–2029 (USD MILLION)
  • TABLE 262 SOUTH KOREA: LABEL-FREE DETECTION MARKET, BY OFFERING, 2022–2029 (USD MILLION)
  • TABLE 263 SOUTH KOREA: LABEL-FREE DETECTION CONSUMABLES MARKET, BY TYPE, 2022–2029 (USD MILLION)
  • TABLE 264 SOUTH KOREA: LABEL-FREE DETECTION MARKET, BY TECHNOLOGY, 2022–2029 (USD MILLION)
  • TABLE 265 SOUTH KOREA: LABEL-FREE DETECTION MARKET, BY APPLICATION, 2022–2029 (USD MILLION)
  • TABLE 266 SOUTH KOREA: LABEL-FREE DETECTION MARKET, BY END USER, 2022–2029 (USD MILLION)
  • TABLE 267 REST OF ASIA PACIFIC: LABEL-FREE DETECTION MARKET, BY OFFERING, 2022–2029 (USD MILLION)
  • TABLE 268 REST OF ASIA PACIFIC: LABEL-FREE DETECTION CONSUMABLES MARKET, BY TYPE, 2022–2029 (USD MILLION)
  • TABLE 269 REST OF ASIA PACIFIC: LABEL-FREE DETECTION MARKET, BY TECHNOLOGY, 2022–2029 (USD MILLION)
  • TABLE 270 REST OF ASIA PACIFIC: LABEL-FREE DETECTION MARKET, BY APPLICATION, 2022–2029 (USD MILLION)
  • TABLE 271 REST OF ASIA PACIFIC: LABEL-FREE DETECTION MARKET, BY END USER, 2022–2029 (USD MILLION)
  • TABLE 272 LATIN AMERICA: LABEL-FREE DETECTION MARKET, BY COUNTRY, 2022–2029 (USD MILLION)
  • TABLE 273 LATIN AMERICA: LABEL-FREE DETECTION MARKET, BY OFFERING, 2022–2029 (USD MILLION)
  • TABLE 274 LATIN AMERICA: LABEL-FREE DETECTION CONSUMABLES MARKET, BY TYPE, 2022–2029 (USD MILLION)
  • TABLE 275 LATIN AMERICA: LABEL-FREE DETECTION MARKET, BY TECHNOLOGY, 2022–2029 (USD MILLION)
  • TABLE 276 LATIN AMERICA: LABEL-FREE DETECTION MARKET, BY APPLICATION, 2022–2029 (USD MILLION)
  • TABLE 277 LATIN AMERICA: LABEL-FREE DETECTION MARKET, BY END USER, 2022–2029 (USD MILLION)
  • TABLE 278 BRAZIL: LABEL-FREE DETECTION MARKET, BY OFFERING, 2022–2029 (USD MILLION)
  • TABLE 279 BRAZIL: LABEL-FREE DETECTION CONSUMABLES MARKET, BY TYPE, 2022–2029 (USD MILLION)
  • TABLE 280 BRAZIL: LABEL-FREE DETECTION MARKET, BY TECHNOLOGY, 2022–2029 (USD MILLION)
  • TABLE 281 BRAZIL: LABEL-FREE DETECTION MARKET, BY APPLICATION, 2022–2029 (USD MILLION)
  • TABLE 282 BRAZIL: LABEL-FREE DETECTION MARKET, BY END USER, 2022–2029 (USD MILLION)
  • TABLE 283 MEXICO: LABEL-FREE DETECTION MARKET, BY OFFERING, 2022–2029 (USD MILLION)
  • TABLE 284 MEXICO: LABEL-FREE DETECTION CONSUMABLES MARKET, BY TYPE, 2022–2029 (USD MILLION)
  • TABLE 285 MEXICO: LABEL-FREE DETECTION MARKET, BY TECHNOLOGY, 2022–2029 (USD MILLION)
  • TABLE 286 MEXICO: LABEL-FREE DETECTION MARKET, BY APPLICATION, 2022–2029 (USD MILLION)
  • TABLE 287 MEXICO: LABEL-FREE DETECTION MARKET, BY END USER, 2022–2029 (USD MILLION)
  • TABLE 288 REST OF LATIN AMERICA: LABEL-FREE DETECTION MARKET, BY OFFERING, 2022–2029 (USD MILLION)
  • TABLE 289 REST OF LATIN AMERICA: LABEL-FREE DETECTION CONSUMABLES MARKET, BY TYPE, 2022–2029 (USD MILLION)
  • TABLE 290 REST OF LATIN AMERICA: LABEL-FREE DETECTION MARKET, BY TECHNOLOGY, 2022–2029 (USD MILLION)
  • TABLE 291 REST OF LATIN AMERICA: LABEL-FREE DETECTION MARKET, BY APPLICATION, 2022–2029 (USD MILLION)
  • TABLE 292 REST OF LATIN AMERICA: LABEL-FREE DETECTION MARKET, BY END USER, 2022–2029 (USD MILLION)
  • TABLE 293 MIDDLE EAST: LABEL-FREE DETECTION MARKET, BY REGION, 2022–2029 (USD MILLION)
  • TABLE 294 MIDDLE EAST: LABEL-FREE DETECTION MARKET, BY OFFERING, 2022–2029 (USD MILLION)
  • TABLE 295 MIDDLE EAST: LABEL-FREE DETECTION CONSUMABLES MARKET, BY TYPE, 2022–2029 (USD MILLION)
  • TABLE 296 MIDDLE EAST: LABEL-FREE DETECTION MARKET, BY TECHNOLOGY, 2022–2029 (USD MILLION)
  • TABLE 297 MIDDLE EAST: LABEL-FREE DETECTION MARKET, BY APPLICATION, 2022–2029 (USD MILLION)
  • TABLE 298 MIDDLE EAST: LABEL-FREE DETECTION MARKET, BY END USER, 2022–2029 (USD MILLION)
  • TABLE 299 GCC COUNTRIES: LABEL-FREE DETECTION MARKET, BY COUNTRY, 2022–2029 (USD MILLION)
  • TABLE 300 GCC COUNTRIES: LABEL-FREE DETECTION MARKET, BY OFFERING, 2022–2029 (USD MILLION)
  • TABLE 301 GCC COUNTRIES: LABEL-FREE DETECTION CONSUMABLES MARKET, BY TYPE, 2022–2029 (USD MILLION)
  • TABLE 302 GCC COUNTRIES: LABEL-FREE DETECTION MARKET, BY TECHNOLOGY, 2022–2029 (USD MILLION)
  • TABLE 303 GCC COUNTRIES: LABEL-FREE DETECTION MARKET, BY APPLICATION, 2022–2029 (USD MILLION)
  • TABLE 304 GCC COUNTRIES: LABEL-FREE DETECTION MARKET, BY END USER, 2022–2029 (USD MILLION)
  • TABLE 305 SAUDI ARABIA: LABEL-FREE DETECTION MARKET, BY OFFERING, 2022–2029 (USD MILLION)
  • TABLE 306 SAUDI ARABIA: LABEL-FREE DETECTION CONSUMABLES MARKET, BY TYPE, 2022–2029 (USD MILLION)
  • TABLE 307 SAUDI ARABIA: LABEL-FREE DETECTION MARKET, BY TECHNOLOGY, 2022–2029 (USD MILLION)
  • TABLE 308 SAUDI ARABIA: LABEL-FREE DETECTION MARKET, BY APPLICATION, 2022–2029 (USD MILLION)
  • TABLE 309 SAUDI ARABIA: LABEL-FREE DETECTION MARKET, BY END USER, 2022–2029 (USD MILLION)
  • TABLE 310 UAE: LABEL-FREE DETECTION MARKET, BY OFFERING, 2022–2029 (USD MILLION)
  • TABLE 311 UAE: LABEL-FREE DETECTION CONSUMABLES MARKET, BY TYPE, 2022–2029 (USD MILLION)
  • TABLE 312 UAE: LABEL-FREE DETECTION MARKET, BY TECHNOLOGY, 2022–2029 (USD MILLION)
  • TABLE 313 UAE: LABEL-FREE DETECTION MARKET, BY APPLICATION, 2022–2029 (USD MILLION)
  • TABLE 314 UAE: LABEL-FREE DETECTION MARKET, BY END USER, 2022–2029 (USD MILLION)
  • TABLE 315 REST OF GCC COUNTRIES: LABEL-FREE DETECTION MARKET, BY OFFERING, 2022–2029 (USD MILLION)
  • TABLE 316 REST OF GCC COUNTRIES: LABEL-FREE DETECTION CONSUMABLES MARKET, BY TYPE, 2022–2029 (USD MILLION)
  • TABLE 317 REST OF GCC COUNTRIES: LABEL-FREE DETECTION MARKET, BY TECHNOLOGY, 2022–2029 (USD MILLION)
  • TABLE 318 REST OF GCC COUNTRIES: LABEL-FREE DETECTION MARKET, BY APPLICATION, 2022–2029 (USD MILLION)
  • TABLE 319 REST OF GCC COUNTRIES: LABEL-FREE DETECTION MARKET, BY END USER, 2022–2029 (USD MILLION)
  • TABLE 320 REST OF MIDDLE EAST: LABEL-FREE DETECTION MARKET, BY OFFERING, 2022–2029 (USD MILLION)
  • TABLE 321 REST OF MIDDLE EAST: LABEL-FREE DETECTION CONSUMABLES MARKET, BY TYPE, 2022–2029 (USD MILLION)
  • TABLE 322 REST OF MIDDLE EAST: LABEL-FREE DETECTION MARKET, BY TECHNOLOGY, 2022–2029 (USD MILLION)
  • TABLE 323 REST OF MIDDLE EAST: LABEL-FREE DETECTION MARKET, BY APPLICATION, 2022–2029 (USD MILLION)
  • TABLE 324 REST OF MIDDLE EAST: LABEL-FREE DETECTION MARKET, BY END USER, 2022–2029 (USD MILLION)
  • TABLE 325 AFRICA: LABEL-FREE DETECTION MARKET, BY OFFERING, 2022–2029 (USD MILLION)
  • TABLE 326 AFRICA: LABEL-FREE DETECTION CONSUMABLES MARKET, BY TYPE, 2022–2029 (USD MILLION)
  • TABLE 327 AFRICA: LABEL-FREE DETECTION MARKET, BY TECHNOLOGY, 2022–2029 (USD MILLION)
  • TABLE 328 AFRICA: LABEL-FREE DETECTION MARKET, BY APPLICATION, 2022–2029 (USD MILLION)
  • TABLE 329 AFRICA: LABEL-FREE DETECTION MARKET, BY END USER, 2022–2029 (USD MILLION)
  • TABLE 330 OVERVIEW OF STRATEGIES ADOPTED BY KEY PLAYERS IN LABEL-FREE DETECTION MARKET
  • TABLE 331 LABEL-FREE DETECTION MARKET: DEGREE OF COMPETITION
  • TABLE 332 LABEL-FREE DETECTION MARKET: OFFERING FOOTPRINT, 2023
  • TABLE 333 LABEL-FREE DETECTION MARKET: TECHNOLOGY FOOTPRINT, 2023
  • TABLE 334 LABEL-FREE DETECTION MARKET: APPLICATION FOOTPRINT, 2023
  • TABLE 335 LABEL-FREE DETECTION MARKET: REGION FOOTPRINT, 2023
  • TABLE 336 LABEL-FREE DETECTION MARKET: LIST OF KEY STARTUPS/SMES
  • TABLE 337 LABEL-FREE DETECTION MARKET: COMPETITIVE BENCHMARKING OF KEY STARTUPS/SMES
  • TABLE 338 LABEL-FREE DETECTION MARKET: PRODUCT LAUNCHES/ENHANCEMENTS/UPGRADES, JANUARY 2021–JUNE 2024
  • TABLE 339 LABEL-FREE DETECTION MARKET: DEALS, JANUARY 2021–JUNE 2024
  • TABLE 340 LABEL-FREE DETECTION MARKET: EXPANSIONS, JANUARY 2021–JUNE 2024
  • TABLE 341 LABEL-FREE DETECTION MARKET: OTHER DEVELOPMENTS, JANUARY 2022–JUNE 2024
  • TABLE 342 DANAHER CORPORATION: COMPANY OVERVIEW
  • TABLE 343 DANAHER CORPORATION: PRODUCTS OFFERED
  • TABLE 344 DANAHER CORPORATION: EXPANSIONS, JANUARY 2021– JUNE 2024
  • TABLE 345 DANAHER CORPORATION: OTHER DEVELOPMENTS, JANUARY 2021– JUNE 2024
  • TABLE 346 SARTORIUS AG: COMPANY OVERVIEW
  • TABLE 347 SARTORIUS AG: PRODUCTS OFFERED
  • TABLE 348 SARTORIUS AG: PRODUCT LAUNCHES/ENHANCEMENTS/UPGRADES, JANUARY 2021– JUNE 2024
  • TABLE 349 SARTORIUS AG: EXPANSIONS, JANUARY 2021– JUNE 2024
  • TABLE 350 AGILENT TECHNOLOGIES, INC.: COMPANY OVERVIEW
  • TABLE 351 AGILENT TECHNOLOGIES, INC.: PRODUCTS OFFERED
  • TABLE 352 AGILENT TECHNOLOGIES, INC.: PRODUCT LAUNCHES/ENHANCEMENTS/UPGRADES, JANUARY 2021–JUNE 2024
  • TABLE 353 WATERS CORPORATION: COMPANY OVERVIEW
  • TABLE 354 WATERS CORPORATION: PRODUCTS OFFERED
  • TABLE 355 WATERS CORPORATION: PRODUCT LAUNCHES/ENHANCEMENTS/UPGRADES, JANUARY 2021– JUNE 2024
  • TABLE 356 CORNING INCORPORATED: COMPANY OVERVIEW
  • TABLE 357 CORNING INCORPORATED: PRODUCTS OFFERED
  • TABLE 358 CORNING INCORPORATED: PRODUCT LAUNCHES/ENHANCEMENTS/UPGRADES, JANUARY 2021–JUNE 2024
  • TABLE 359 REVVITY, INC.: COMPANY OVERVIEW
  • TABLE 360 REVVITY, INC.: PRODUCTS OFFERED
  • TABLE 361 REVVITY, INC.: OTHER DEVELOPMENTS, JANUARY 2021–JUNE 2024
  • TABLE 362 AMETEK, INC.: COMPANY OVERVIEW
  • TABLE 363 AMETEK, INC.: PRODUCTS OFFERED
  • TABLE 364 HORIBA, LTD.: COMPANY OVERVIEW
  • TABLE 365 HORIBA, LTD.: PRODUCTS OFFERED
  • TABLE 366 SPECTRIS: COMPANY OVERVIEW
  • TABLE 367 SPECTRIS: PRODUCTS OFFERED
  • TABLE 368 SPECTRIS: PRODUCT LAUNCHES/ENHANCEMENTS/UPGRADES, JANUARY 2021–JUNE 2024
  • TABLE 369 SPECTRIS: DEALS, JANUARY 2021–JUNE 2024
  • TABLE 370 SHIMADZU CORPORATION: COMPANY OVERVIEW
  • TABLE 371 SHIMADZU CORPORATION: PRODUCTS OFFERED
  • TABLE 372 HITACHI HIGH-TECH CORPORATION: COMPANY OVERVIEW
  • TABLE 373 HITACHI HIGH-TECH CORPORATION: PRODUCTS OFFERED
  • TABLE 374 ATTANA AB: COMPANY OVERVIEW
  • TABLE 375 ATTANA AB: PRODUCTS OFFERED
  • TABLE 376 BRUKER: COMPANY OVERVIEW
  • TABLE 377 BRUKER: PRODUCTS OFFERED
  • TABLE 378 BRUKER: PRODUCT LAUNCHES/ENHANCEMENTS/UPGRADES, JANUARY 2021–JUNE 2024
  • TABLE 379 BIO-RAD LABORATORIES, INC.: COMPANY OVERVIEW
  • TABLE 380 BIO-RAD LABORATORIES, INC.: PRODUCTS OFFERED
  • TABLE 381 ENDRESS+HAUSER GROUP SERVICES AG: COMPANY OVERVIEW
  • TABLE 382 ENDRESS+HAUSER GROUP SERVICES AG: PRODUCTS OFFERED
  • TABLE 383 ENDRESS+HAUSER GROUP SERVICES AG: EXPANSIONS, JANUARY 2021– JUNE 2024
  • TABLE 384 BECTON, DICKINSON AND COMPANY: COMPANY OVERVIEW
  • TABLE 385 BECTON, DICKINSON AND COMPANY: PRODUCTS OFFERED
  • TABLE 386 BECTON, DICKINSON AND COMPANY: PRODUCT LAUNCHES/ENHANCEMENTS/UPGRADES, JANUARY 2021–JUNE 2024
  • TABLE 387 NANOTEMPER TECHNOLOGIES GMBH: COMPANY OVERVIEW
  • TABLE 388 AFFINITÉ INSTRUMENTS: COMPANY OVERVIEW
  • TABLE 389 BIOSENSING INSTRUMENT: COMPANY OVERVIEW
  • TABLE 390 UNCHAINED LABS: COMPANY OVERVIEW
  • TABLE 391 BIONAVIS LTD.: COMPANY OVERVIEW
  • TABLE 392 GATOR BIO: COMPANY OVERVIEW
  • TABLE 393 CARTERRA, INC.: COMPANY OVERVIEW
  • TABLE 394 NICOYA: COMPANY OVERVIEW
  • TABLE 395 BIOPTIX ANALYTICAL LLC: COMPANY OVERVIEW
  • TABLE 396 PLEXERA BIOSCIENCE: COMPANY OVERVIEW
  • TABLE 397 XANTEC BIOANALYTICS GMBH: COMPANY OVERVIEW
  • TABLE 398 BMG LABTECH: COMPANY OVERVIEW
  • TABLE 399 REDSHIFT BIOANALYTICS, INC.: COMPANY OVERVIEW
  • TABLE 400 LINO BIOTECH AG: COMPANY OVERVIEW
LIST OF FIGURES
 
  • FIGURE 1 LABEL-FREE DETECTION MARKET: RESEARCH DESIGN
  • FIGURE 2 LABEL-FREE DETECTION MARKET: BREAKDOWN OF PRIMARIES
  • FIGURE 3 LABEL-FREE DETECTION MARKET SIZE ESTIMATION (SUPPLY-SIDE ANALYSIS), 2023
  • FIGURE 4 MARKET SIZE ESTIMATION: APPROACH 1 (COMPANY REVENUE ANALYSIS-BASED ESTIMATION), 2023
  • FIGURE 5 ILLUSTRATIVE EXAMPLE OF DANAHER CORPORATION: REVENUE SHARE ANALYSIS (2023)
  • FIGURE 6 MARKET SIZE VALIDATION FROM PRIMARY SOURCES
  • FIGURE 7 MARKET SIZE ESTIMATION METHODOLOGY: TOP-DOWN APPROACH
  • FIGURE 8 LABEL-FREE DETECTION MARKET: CAGR PROJECTIONS (2024–2029)
  • FIGURE 9 DATA TRIANGULATION METHODOLOGY
  • FIGURE 10 LABEL-FREE DETECTION MARKET, BY OFFERING, 2024 VS. 2029 (USD MILLION)
  • FIGURE 11 LABEL-FREE DETECTION MARKET, BY TECHNOLOGY, 2024 VS. 2029 (USD MILLION)
  • FIGURE 12 LABEL-FREE DETECTION MARKET, BY APPLICATION, 2024 VS. 2029 (USD MILLION)
  • FIGURE 13 LABEL-FREE DETECTION MARKET, BY END USER, 2024 VS. 2029 (USD MILLION)
  • FIGURE 14 GEOGRAPHICAL SNAPSHOT: LABEL-FREE DETECTION MARKET
  • FIGURE 15 GROWING NUMBER OF DRUG DISCOVERY PROGRAMS TO DRIVE MARKET
  • FIGURE 16 INSTRUMENTS DOMINATED NORTH AMERICAN LABEL-FREE DETECTION MARKET IN 2023
  • FIGURE 17 PHARMACEUTICAL & BIOTECHNOLOGY COMPANIES ACCOUNTED FOR LARGEST SHARE OF ASIA PACIFIC MARKET IN 2023
  • FIGURE 18 PHARMACEUTICAL & BIOTECHNOLOGY COMPANIES ACCOUNTED FOR LARGEST MARKET SHARE IN 2023
  • FIGURE 19 ASIA PACIFIC TO REGISTER HIGHEST GROWTH RATE IN LABEL-FREE DETECTION MARKET FROM 2024 TO 2029
  • FIGURE 20 LABEL-FREE DETECTION MARKET: DRIVERS, RESTRAINTS, OPPORTUNITIES, AND CHALLENGES
  • FIGURE 21 GLOBAL PHARMACEUTICAL R&D SPENDING, 2021–2028
  • FIGURE 22 LABEL-FREE DETECTION MARKET: TRENDS/DISRUPTIONS IMPACTING CUSTOMERS’ BUSINESSES
  • FIGURE 23 LABEL-FREE DETECTION MARKET: SUPPLY CHAIN ANALYSIS
  • FIGURE 24 VALUE CHAIN ANALYSIS—MAXIMUM VALUE ADDED DURING RAW MATERIAL PROCUREMENT AND MANUFACTURING STAGES
  • FIGURE 25 AVERAGE SELLING PRICE TREND FOR LABEL-FREE DETECTION PRODUCTS, 2021–2023
  • FIGURE 26 LABEL-FREE DETECTION MARKET: ECOSYSTEM ANALYSIS
  • FIGURE 27 NUMBER OF PATENTS GRANTED, 2014–2023
  • FIGURE 28 TOP TEN PATENT APPLICANTS, 2014–2023
  • FIGURE 29 LABEL-FREE DETECTION MARKET: PORTER’S FIVE FORCES ANALYSIS
  • FIGURE 30 INFLUENCE OF STAKEHOLDERS ON BUYING PROCESS OF LABEL-FREE DETECTION TECHNOLOGIES
  • FIGURE 31 KEY BUYING CRITERIA FOR END USERS
  • FIGURE 32 NORTH AMERICA: LABEL-FREE DETECTION MARKET SNAPSHOT
  • FIGURE 33 ASIA PACIFIC: LABEL-FREE DETECTION MARKET SNAPSHOT
  • FIGURE 34 REVENUE ANALYSIS OF KEY PLAYERS, 2019–2023 (USD MILLION)
  • FIGURE 35 MARKET SHARE ANALYSIS OF KEY PLAYERS, 2023
  • FIGURE 36 LABEL-FREE DETECTION MARKET: COMPANY EVALUATION MATRIX (KEY PLAYERS), 2023
  • FIGURE 37 LABEL-FREE DETECTION MARKET: COMPANY FOOTPRINT, 2023
  • FIGURE 38 LABEL-FREE DETECTION MARKET: COMPANY EVALUATION MATRIX (STARTUPS/SMES), 2023
  • FIGURE 39 EV/EBITDA OF KEY LABEL-FREE DETECTION VENDORS
  • FIGURE 40 YEAR-TO-DATE (YTD) PRICE TOTAL RETURN AND 5-YEAR STOCK BETA OF KEY LABEL-FREE DETECTION VENDORS
  • FIGURE 41 BRAND/PRODUCT COMPARATIVE ANALYSIS
  • FIGURE 42 DANAHER CORPORATION: COMPANY SNAPSHOT (2023)
  • FIGURE 43 SARTORIUS AG: COMPANY SNAPSHOT (2023)
  • FIGURE 44 AGILENT TECHNOLOGIES, INC.: COMPANY SNAPSHOT (2023)
  • FIGURE 45 WATERS CORPORATION: COMPANY SNAPSHOT (2023)
  • FIGURE 46 CORNING INCORPORATED: COMPANY SNAPSHOT (2023)
  • FIGURE 47 REVVITY, INC.: COMPANY SNAPSHOT (2023)
  • FIGURE 48 AMETEK, INC.: COMPANY SNAPSHOT (2023)
  • FIGURE 49 HORIBA, LTD.: COMPANY SNAPSHOT (2023)
  • FIGURE 50 SPECTRIS: COMPANY SNAPSHOT (2023)
  • FIGURE 51 SHIMADZU CORPORATION: COMPANY SNAPSHOT (2023)
  • FIGURE 52 HITACHI HIGH-TECH CORPORATION: COMPANY SNAPSHOT (2023)
  • FIGURE 53 ATTANA AB: COMPANY SNAPSHOT (2023)
  • FIGURE 54 BRUKER: COMPANY SNAPSHOT (2023)
  • FIGURE 55 BIO-RAD LABORATORIES, INC.: COMPANY SNAPSHOT (2023)
  • FIGURE 56 ENDRESS+HAUSER GROUP SERVICES AG: COMPANY SNAPSHOT (2023)
  • FIGURE 57 BECTON, DICKINSON AND COMPANY: COMPANY SNAPSHOT (2023)

This research study involved the extensive use of secondary sources, directories, and databases to identify and collect valuable information for the analysis of the global label-free detection market. In-depth interviews were conducted with various primary respondents, including key industry participants, subject-matter experts (SMEs), C-level executives of key market players, and industry consultants, to obtain and verify critical qualitative and quantitative information and assess the growth prospects of the market. The global market size estimated through secondary research was then triangulated with inputs from primary research to arrive at the final market size.

Secondary Research

Secondary research was used mainly to identify and collect information for the extensive, technical, market-oriented, and commercial study of the label-free detection market. The secondary sources used for this study include World Health Organization (WHO), National Center for Biotechnology Information (NCBI), National Institutes of Health (NIH), US Food and Drug Administration (US FDA), International Molecular Exchange Consortium (IMEx), Biomolecular Interaction Network Database, Nature (Journal), Genome Medicine, PubMed, European Federation of Pharmaceutical Industries and Associations (EFPIA), European Lead Factory (ELF), India Brand Equity Foundation (IBEF), UK Research Partnership Investment Fund (UKRPIF), Pharmaceutical Research and Manufacturers of America (PhRMA), Eurostat, and Factiva, research journals; corporate filings such as annual reports, SEC filings, investor presentations, and financial statements; press releases; trade, business, professional associations and among others. These sources were also used to obtain key information about major players, market classification, and segmentation according to industry trends, regional/country-level markets, market developments, and technology perspectives.

Primary Research

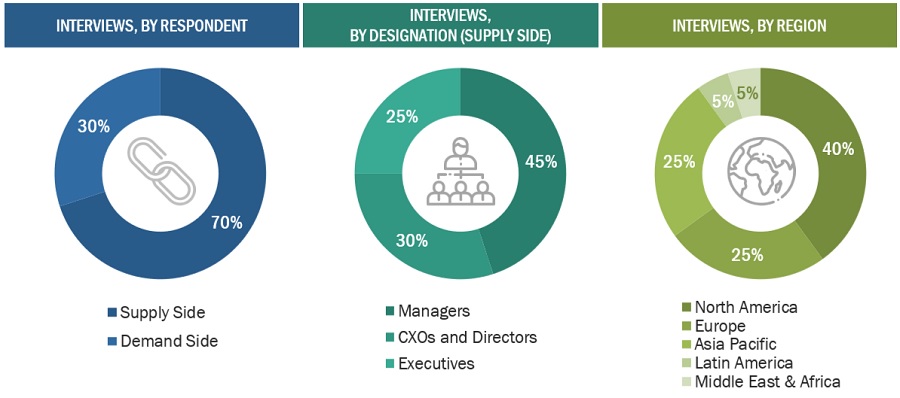
Extensive primary research was conducted after acquiring basic knowledge about the global label-free detection market scenario through secondary research. Several primary interviews were conducted with market experts from the demand side, such as pharmaceutical and biotechnology companies, CROs, CMOs, and academic & research institutes, and experts from the supply side, such as C-level and D-level executives, product managers, marketing & sales managers of key manufacturers, distributors, and channel partners. These interviews were conducted across six major regions, including the Asia Pacific, North America, Europe, Latin America, Middle East and Africa. Approximately 70% and 30% of the primary interviews were conducted with supply-side and demand-side participants, respectively. This primary data was collected through questionnaires, e-mails, online surveys, personal interviews, and telephonic interviews.

The following is a breakdown of the primary respondents:
Label-Free Detection Market Size, and Share

To know about the assumptions considered for the study, download the pdf brochure

Market Size Estimation

Both top-down and bottom-up approaches were used to estimate and validate the total size of the label-free detection market. These methods were also used extensively to estimate the size of various subsegments in the market. The research methodology used to estimate the market size includes the following:

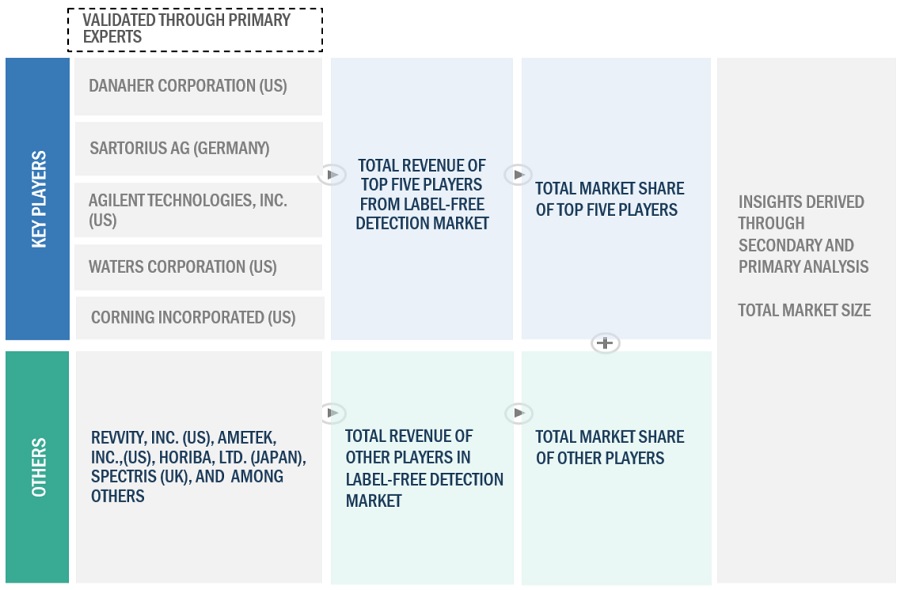
Bottom-up Approach

  • The key players in the market have been identified through extensive secondary research.
  • The revenues generated from the label-free detection business of leading players have been determined through primary and secondary research to arrive at the overall label-free detection market.
  • All percentage shares, splits, and breakdowns have been determined using secondary sources and verified through primary sources.
  • Additionally, to arrive at the label-free detection market for offering segments, the label-free detection business shares of leading players for separate product category (wherever available) were also gathered from secondary sources. In some instances, the shares of label-free detection product businesses were ascertained through a detailed analysis of various parameters, including product portfolios, market positioning and primary insights.
  • All assumptions, approaches and individual shares/revenue estimates were validated through expert interviews.
Label-Free Detection Market Size, and Share

To know about the assumptions considered for the study, Request for Free Sample Report

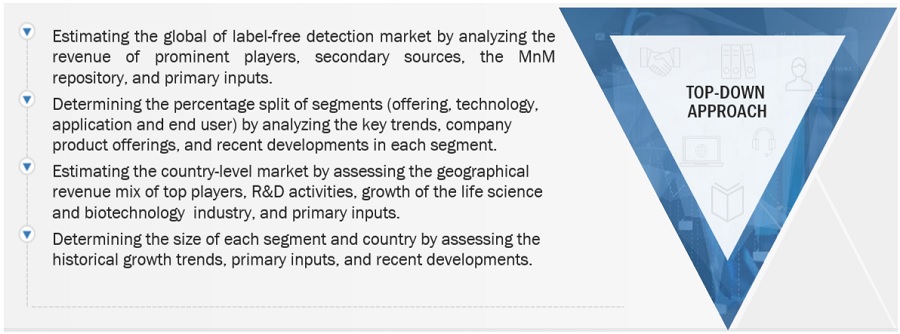
Top-down Approach

After arriving at the overall market size from the market size estimation process, the total market was split into several segments and subsegments.
Label-Free Detection Market Size, and Share

Data Triangulation

After arriving at the market size  from the market size estimation process explained above, the total market was divided into several segments and subsegments. To complete the overall market engineering process and arrive at the exact statistics for all segments and subsegments, data triangulation and market breakdown procedures were employed, wherever applicable. The data was triangulated by studying various factors and trends from both the demand and supply sides.

Market Definition

Label-free detection is gaining widespread acceptance as an important research and development tool in academic research institutes and biotechnology and pharmaceutical industries. It helps in the investigation of molecule-molecule interactions without using additional isotope or fluorescent labels that usually cause spatial interference or quenching.

Stakeholders

  • Pharmaceutical and biotechnology research associations
  • Label-free equipment manufacturers and vendors
  • Research and consulting firms
  • Pathologists and pathology laboratories
  • Distributors of label-free detection equipment
  • Research institutes
  • Contract research organizations (CROs)
  • Venture capitalists
  • Government associations
  • CROs & CDMOs
  • Forensic laboratories
  • Market research and consulting firms
  • Government & independent regulatory authorities

Report Objectives

  • To define, describe, and forecast the label-free detection market based on offering, technology, application, end user, and region
  • To provide detailed information regarding the major factors influencing market growth (such as drivers, restraints, opportunities, and challenges)
  • To strategically analyze micro-markets with respect to individual growth trends, prospects, and contributions to the overall label-free detection market
  • To analyze opportunities in the market for stakeholders and provide details of the competitive landscape for market leaders
  • To forecast the size of the market segments with respect to six main regions: North America, Europe, the Asia Pacific, Latin America, the Middle East, and Africa
  • To profile the key players in the label-free detection market and comprehensively analyze their product portfolios, market positions, and core competencies
  • To track and analyze competitive developments in the label-free detection market, such as acquisitions, product launches, expansions, agreements, partnerships, and collaborations
  • To benchmark players within the label-free detection market using the ‘Company Evaluation Matrix' framework, which analyzes market players based on various parameters within the broad categories of business strategy and product strategy

Available Customizations

With the given market data, MarketsandMarkets offers customizations as per the company’s specific needs. The following customization options are available for this report:

Portfolio Assessment
  • Product Matrix, which gives a detailed comparison of the product portfolios of the top three companies.
Company Information
  • Detailed analysis and profiling of additional market players (up to three).
Geographical Analysis
  • A further breakdown of the Rest of Asia Pacific Label-free detection market into countries
  • A further breakdown of the Rest of European Label-free detection market into countries
  • A further breakdown of the Rest of Latin American Label-free detection market into countries
Custom Market Research Services

We will customize the research for you, in case the report listed above does not meet with your exact requirements. Our custom research will comprehensively cover the business information you require to help you arrive at strategic and profitable business decisions.

Request Customization

Instant Answers with GPT - Ask Now!

Ask real questions. Get complete answers !
Report Code
BT 2455
Published ON
Aug, 2024
Choose License Type
BUY NOW
  • SHARE
X
Request Customization
Speak to Analyst
Speak to Analyst
OR FACE-TO-FACE MEETING
PERSONALIZE THIS RESEARCH
  • Triangulate with your Own Data
  • Get Data as per your Format and Definition
  • Gain a Deeper Dive on a Specific Application, Geography, Customer or Competitor
  • Any level of Personalization
REQUEST A FREE CUSTOMIZATION
LET US HELP YOU!
  • What are the Known and Unknown Adjacencies Impacting the Label Free Detection Market
  • What will your New Revenue Sources be?
  • Who will be your Top Customer; what will make them switch?
  • Defend your Market Share or Win Competitors
  • Get a Scorecard for Target Partners
CUSTOMIZED WORKSHOP REQUEST
knowledgestore logo

Want to explore hidden markets that can drive new revenue in Label Free Detection Market?

Find Hidden Markets
  • Call Us
  • +1-888-600-6441 (Corporate office hours)
  • +1-888-600-6441 (US/Can toll free)
  • +44-800-368-9399 (UK office hours)
CONNECT WITH US
ABOUT TRUST ONLINE
©2024 MarketsandMarkets Research Private Ltd. All rights reserved
DMCA.com Protection Status
Website Feedback