Previous Versions of this Report
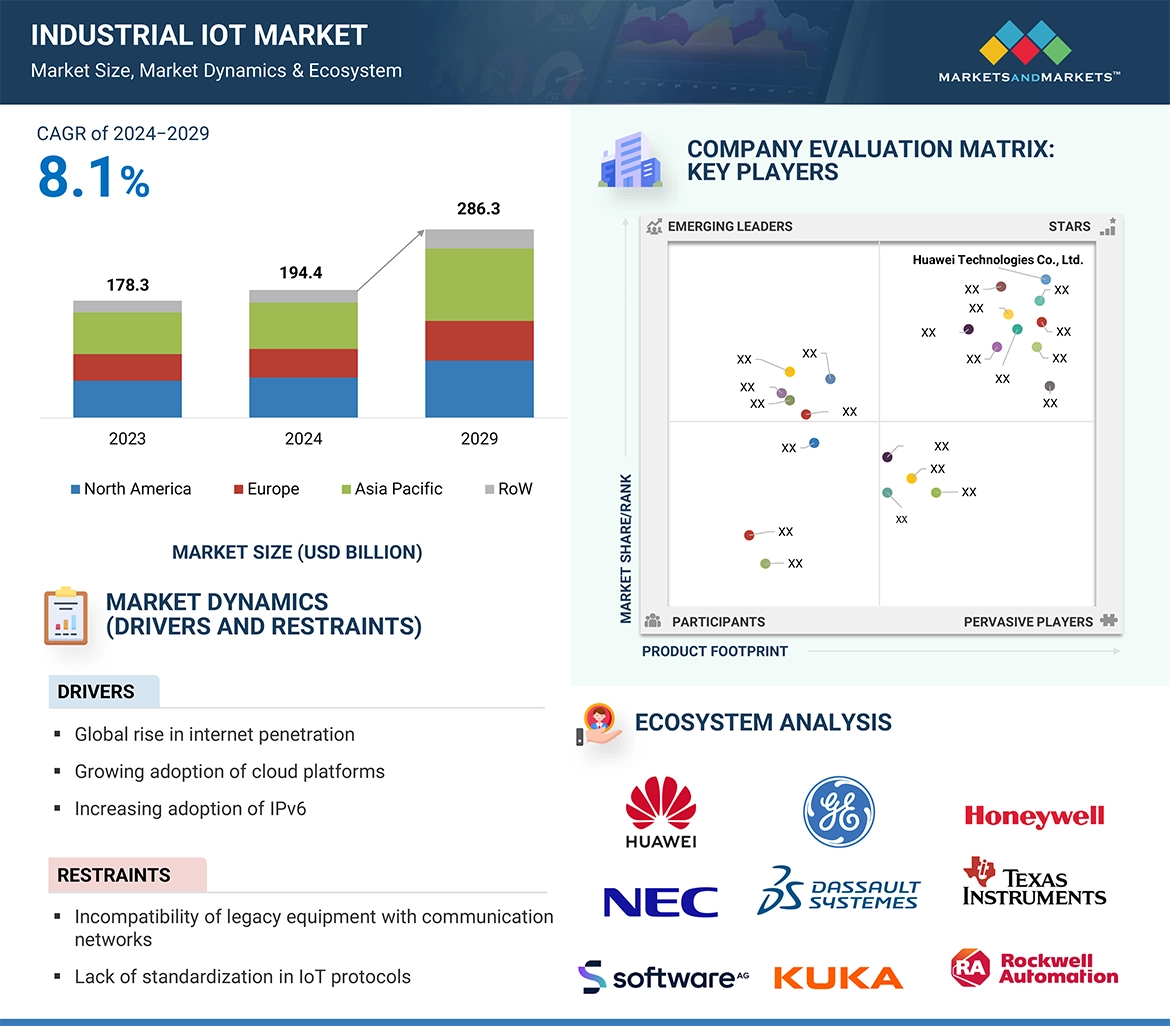
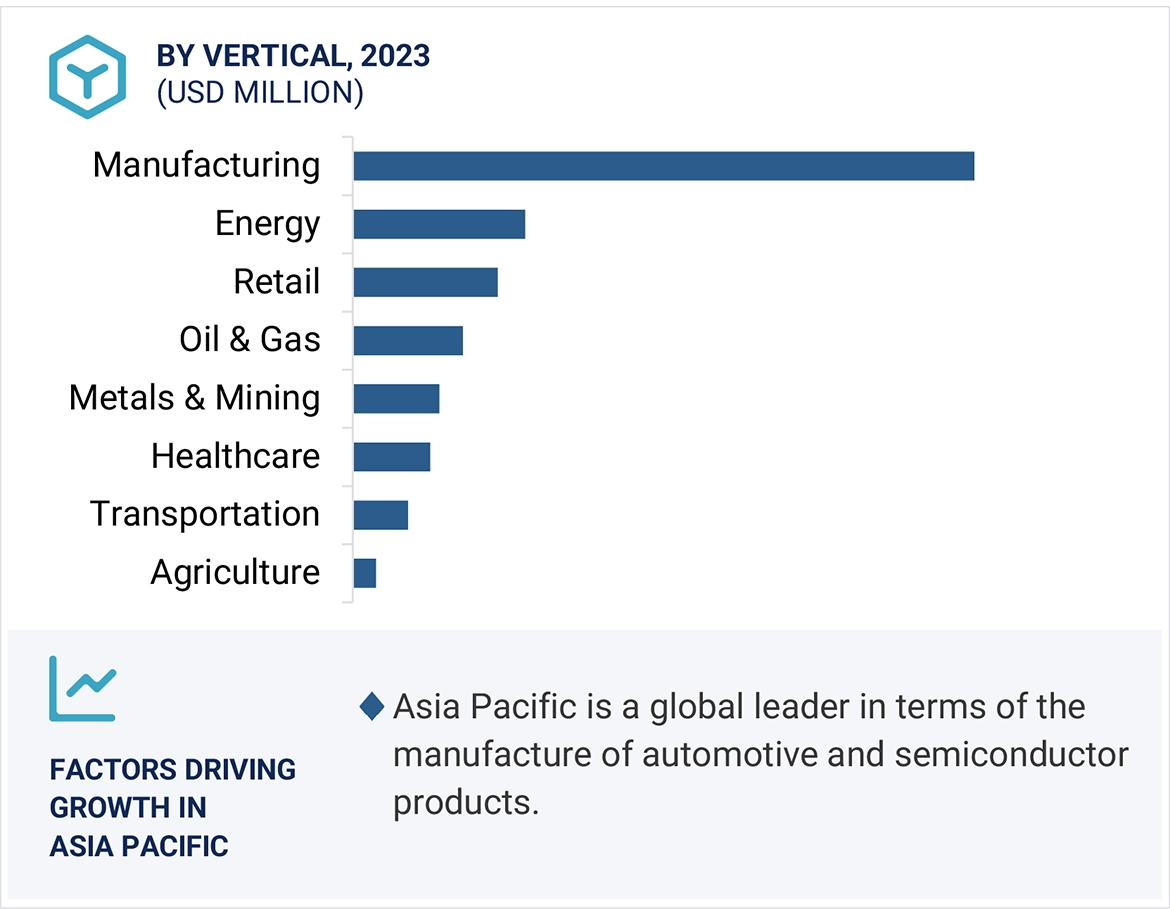
Industrial IoT Market by Device & Technology, Connectivity Type, Software, Vertical (Manufacturing, Energy, Oil & Gas, Healthcare, Retail, Transportation, Metals & Mining, Agriculture), and Geography - Global Forecast to 2026
Report Code
SE 2909
Published in
Jul, 2021, By MarketsandMarkets™
Industrial IoT (IIoT) Market by Device & Technology (Sensor, RFID, Industrial Robotics, DCS, Condition Monitoring, Networking Technology), Connectivity (Wired, Wireless, Field Technology), Software (PLM, MES, SCADA), Vertical, Region - Global Forecast to 2025
Report Code
SE 2909
Published in
Mar, 2020, By MarketsandMarkets™
IIoT Market by Device & Technology (Sensor, RFID, Industrial Robotics, DCS, Condition Monitoring, Smart Meter, Camera System, Networking Technology), Software (PLM, MES, SCADA), Vertical, and Geography - Global Forecast to 2023
Report Code
SE 2909
Published in
Jun, 2018, By MarketsandMarkets™
Industrial IoT Market by Device & Technology (Sensors, RFID, Industrial Robotics, DCS, Condition Monitoring, Smart Meters, AHS, Camera System, Networking Technologies), Software (PLM Systems, MES, SCADA), Vertical, and Geography - Global Forecast to 2022
Report Code
SE 2909
Published in
Feb, 2017, By MarketsandMarkets™
Industrial IoT Market by Industry Vertical (Manufacturing, Energy & Power, Oil & Gas, Metals & Mining, Healthcare, & Agriculture), Technology (Sensors, Networking Technology, DCS, & Others), Software, & Geography - Global Forecast to 2020
Report Code
SE 2909
Published in
Jan, 2016, By MarketsandMarkets™
Industrial IoT Market by Technology (Wired, Wireless), Components (Sensors, Memory & Processors, Networking Components, RFID & others), Industry Verticals (Manufacturing, Transportation, Retail, Healthcare & others), & Geography - Global Forecast to 2020
Report Code
SE 2909
Published in
Nov, 2014, By MarketsandMarkets™


phan
Sep, 2019
Which is the leading application for IoT? Where would the market lie in the future for IoT?.
Kei
Feb, 2016
I would like to understand what kind of components are included in the revenue forecast of IoT in each industry vertical..
Jamal
Feb, 2017
We are specifically interested in Gateway Appliances, Analytics Software, Sensors, and vertical industries. Does the IoT study scope revolve around these pointers?.
Vinoth
May, 2019
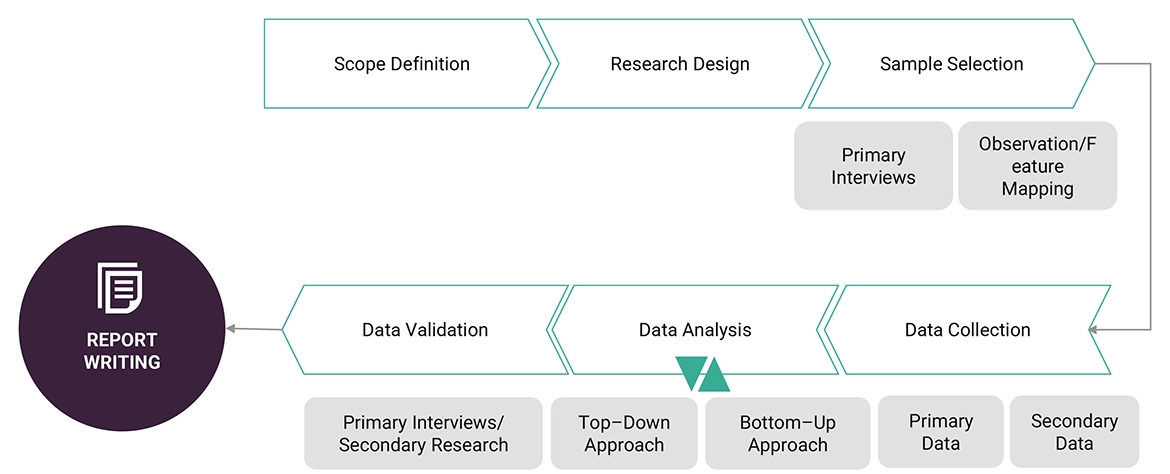
Need to know the Industrial IoT for discrete manufacturing industries growth and forecast by region wise and technology wise. Also would like to know the methodology you have considered in the research. .
Tara
Jan, 2015
Interested in price--does TI receive any discounts? Also wondering if my team can request additional data/analysis that's important to us. What are the other future trends considered?.
kynan
Apr, 2019
I require the ability to determine the market size, growth rate etc. for industrial edge computing. Specifically for the oil and gas market. Does the research include these?.
RAM
Oct, 2016
We are formulating standards on IOT, we need to understand the technology and the trends worldwide. Can you provide us with the regional trends for the same?.
N.
Feb, 2017
I would like to know more about the segments that you have considered for IoT. Does the report contain ranking of the various applications?.
User
Sep, 2019
How are adjacent market such as industrial control and factory automation, Smart Factory, Digital Twin, and Industrial Networking Solutions markets are going impact the revenue of players operating in Industrial IOT Market ?.
Bernd
Jul, 2019
Our business is consulting and engineering services for manufacturing and process industries in the field of IIoT. Therefore we're always looking for studies and trend forecasts in this area. Can you provide us with the inclusions or the scope of your study?.
Antonio
Oct, 2015
Good morning, I am interesting in understanding if the reports provides a view on how much is valued the industrial IoT market for Italian manufacturing sector. Moreover, does the report have specific section about Italy? Have you included any other future trends in IoT?.
Shane
Aug, 2019
to identify the biggest shipment for the device driven by IIOT and also new applications which can generate the big potential shipment to the IIOT market..
Tim
Jul, 2019
Developing correct interfaces for our line of Industrial Gateways, whether, wired, wireless, industrial or other. Can you provide us with an information for the same?.
Huy
Mar, 2019
We are providing one stop IoT solution call Neqto: Power by JIG-SAW. We are expanding to US market and looking for partner in Asia so far. Can you tell us the best bet or the major market for IIoT in the US and APAC regions? .
Oleg
Jan, 2016
Our goal to provide Ukrainian Industry with modern trends for better and faster development and growth. We see in IoT positive challenge for our members. Have you covered Ukraine as a part of your study?.
Abhi
Nov, 2018
We're interested in the context of Connectivity of the devices, wireless connectivity over 5G or LPWAN. Are these covered in the scope of your study?.
User
Sep, 2019
How Technologies such as RFID, Industrial Robotics, and Networking technology is expected to impact the growth of the industrial IOT market, also the market of RFID by region such as North America, APAC, Europe and RoW .
Victor
Sep, 2019
Looking for IoT report that covers major IIoT applications including Retail/Hospitality, Agriculture, Manufacturing and Transportation. Also, includes Porter 5 forces analysis and geo breakdown (US, Europe etc.). CAGR analysis and unit shipments for key players. Also, analysis of key players in each sector..
Haider
Jun, 2016
IIoT TAM both top down and bottoms up. Also detailed company profiles with market share and units sold. Can you provide me or have you included it in the study?.
Niladri
Jun, 2016
1. Growth rate of processor adoption by Intel Architecture and ARM Architecture 2. Growth rate of Programmable Logic (FPGA and CPLD) devices. Have you included it in the research? .
Ashutosh
Apr, 2019
Hi, We are an Industrial IoT company with focus on power plant and manufacturing. We were trying to understand the global market size and the major applications of the same. .
User
Sep, 2019
what are the major players operating in digital twin and Edge computing application and how its going impact the revenue of the players operating in Industrial IOT market and adjacent markets ?.
User
Nov, 2019
Would like to know the market opportunities for SCADA systems and software for the APAC Region. Also the impact on revenue of major players operating in Smart Grid and Industrial IOT market .
Craig
Oct, 2019
I am trying to obtain some facts about Industrial IOT market available in U.S. and North America. What are the estimated market shares of the major vendors in this market?.
Jessie
Sep, 2017
I would like to understand the history and development of the top industrial gases companies in the world and the market size and share analysis. Can you provide us with the same? Also, have you included it in your scope?.
Tucker
Sep, 2018
Looking to understand how ICS and robotics community is treated in calculating market sizing and growth of IIoT (in-scope or not) with regard to the three views on IIoT sizing discussed in the summary overview. .
Atharva
Sep, 2019
We are an automation company which is providing Industry 4.0 services. We want further expand our scope in this domain and so requesting the brochure. Also would like to know if the major applications and the connection of Industry 4.0 with IIoT along with the use cases. .
Salvador
Jul, 2015
I like to see if this report could be a good tool to me, because I need to prepare a business plan to sell by volume a suite build by gateways, sensors and software. My market target is world wide. Can you justify the methodology provided by you?.
Mohan
Jul, 2019
How I can use my eHealth kit to aggregate all vitals from thousands of patients across hospitals and provide meaningful data to healthcare professionals at point of care? Do our have any specific solution for this? Have you included it in the scope of IIoT?.
Mohan
Jul, 2019
How I can use my eHealth kit to aggregate all vitals from thousands of patients across hospitals and provide meaningful data to healthcare professionals at point of care? Do our have any specific solution for this? Have you included it in the scope of IIoT?.
User
May, 2021
May I get a sample for this report? Interested in few sections..
Yosuke
May, 2017
Can you provide us the details in "Manufacturing"? like automotive, Electric, Chemical, foods and so on..
Carles
May, 2019
We're a Barcelona Based startup company willing to have a broader view of the market in order to select our path of action. We are dealing with energy harvesting and applying it in the industrial internet of things (IoT) field. How is the IIoT market related to it? .
Manoj
Mar, 2020
What is the type of TRAI license/Regulation for setting up a new LLP startup of Industrial Internet of Things (IIoT).
Deepak
Mar, 2015
Fire Fighting & Fire Alarm Systems, Pumps, Health, Safety & Environmental Industries, and Personal Protective equipment. Have you considered it in your study? .
User
Mar, 2019
How increasing deployment of 5G network Infrastructure would impact the growth of Industrial IoT Market and adjacent market such as smart factory and Industrial Networking Solutions markets.
Mar, 2017
We are looking for the overview of market status, TAM market, trends, and industry sectors for IIoT. Also, I would like to understand the key players list and their contribution to the market share. .
Andrew
Mar, 2016
I would like to understand the data tables for market sizes and growth by connection or economic size/revenues by industry and business size. My regions of interest are in the US, UK or Europe, As and NZ. Have you included these in your study?.
rene
Mar, 2016
Drones, 3D printing, satellites, Virtual Reality (VR) and Augmented Reality (AR), Materials Sciences (Carbon). Does your research revolve along these parameters?.
Marleen
Feb, 2016
Wireless connectivity, Wi-Fi Hallow (802.11ah), ZigBee, 6LowpAN, IPV6, sensor networks, IoT and mobiles. Have you included these in your study for IIoT?.