Internet of Robotic Things Market (IoRT) by Component (Sensor, Power, Control), Service (Professional, Managed), Platform (Device, Application, Network), Software (Analytics, Data, Security, Monitoring, Bandwidth), Application - Global Forecast to 2022


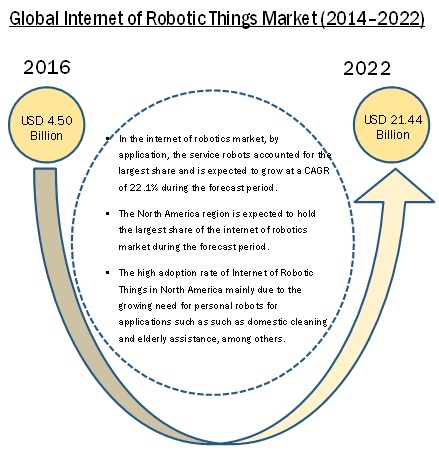
[187 Pages Report] The Internet of Robotic Things Market was valued at USD 3.89 billion in 2015 and is expected to reach USD 21.44 billion by 2022, at a CAGR of 29.7% between 2016 and 2022.
The years considered for the study are as follows:
- Historic Year: 2014
- Base Year: 2015
- Estimated Year: 2016
- Projected Year: 2022
- Forecast Period: 2016 to 2022
The major objectives of the study are as follows:
- To define, describe, and forecast the global Internet of Robotic Things market based on component, software, platform, services, application, and region
- To forecast the market size, in terms of value, for various segments with respect to five regions, namely, North America (NA), Europe, Asia-Pacific (APAC), and Rest of the World (RoW)
- To provide detailed information regarding major factors influencing the growth of the market (drivers, restraints, opportunities, and challenges)
- To strategically analyze micro-markets with respect to individual growth trends, future prospects, and contributions to the total market
- To analyze opportunities in the market for stakeholders by identifying the high-growth segments of internet of robotic things, and provide details of the competitive landscape for market leaders
- To analyze the competitive environment prevailing in the global Internet of Robotic Things market through Porter’s five forces analytical framework
- To strategically profile key players and comprehensively analyze their product portfolios, market share, and core competencies
- To analyze strategic developments such as new product launches, acquisitions, expansions, and agreements in the global internet of robotic things market
Adoption of e-commerce industry and increasing application areas owing to integration of robots with various technologies to drive the global internet of robotic things market to reach to USD 21.44 billion by 2022
The e-commerce fulfillment centers that are struggling to make their operations more efficient and cost-effective, systems with smart robotics technology can provide an efficient solution to improve order throughput and order accuracy while reducing labor costs and optimizing space requirements. There is an increase in the e-commerce business. Companies such as Amazon.com, Inc. (U.S.), Wal-Mart Stores, Inc. (U.S.), Apple Inc. (U.S.), and Dell Inc. (U.S.) are facing challenges such as insufficient warehouse space, large stock keeping unit (SKU) counts, and pressure of fast delivery, among others. The Internet of robotic things would help to overcome these challenges. With the increase in the growth of online ordering, the adoption of smart robotics has been witnessed by the e-commerce sector.
Robots have several applications in industrial manufacturing environments. However, significant investments have been undertaken into designing robots applications that can be used outside factories. Smart robots are the focus of several research and development centers in the recent years. Currently, smart robots find applications in several areas such as computers; cognitive and social sciences; electrical; and electronic and mechanical engineering. Robots are becoming a stimulating area of development in robotics owing to the integration of robots with various technologies such as smartphones, tablets, and other electronic appliances, artificial intelligence, and computational vision.
Market Dynamics
Market Drivers
- Adoption by e-commerce industry
- Increasing application areas owing to integration of robots with various technologies
- Short Payback Period and ROI
Restraints
- High cost of research and development (R&D)
- Long process of new product development
Opportunities
- Increasing demand of robots in education sector
Challenges
- Implementation of high quality and reliable robots, and testing them with suitable solutions
- Data security and interoperability issues
Critical questions would be;
- The Internet of Robotic Things market witness concern of high cost of R&D and long process of product development, when will these scenarios ease out?
- How are the industry players addressing this challenge?
The Internet of Robotic Things (IoRT) market is expected to be valued at USD 21.44 billion by 2022, growing at a CAGR of 29.7% between 2016 and 2022. The growth of this market is majorly driven by the adoption of IoRT by e-commerce industry, increasing application areas owing to integration of robots with various technologies, short payback period and ROI.
The IoRT services market is expected to grow at the highest rate during the forecast period. Factors such as increasing adoption of connected devices across organizations and evolution of high-speed networking technologies have encouraged organizations in every industry sector to adopt IoRT solutions. However, for the integration of new solutions into the company’s existing infrastructure, companies would need managed and professional services to adopt IoRT solutions.
The market for device management platform was the largest in IoRT platform market in 2015 and is expected to grow at the highest rate during the forecast period. Organizations while using IoRT devices require platforms to manage information and applications. The major reason for growth for device management platform is because of growing requirements for access and control over IoRT devices across industries.
The market for security solutions is expected grow at the highest CAGR during the forecast period in the IoRT software market. The IoRT has brought about several security challenges such as point-of-sale (PoS) threat, threats at sensors, gateways, and end devices.
The IoRT market for smart robot component held the largest market size in 2015 as developing the IoRT products requires a lot of integration and assembly of various components such as sensors, actuators, power systems, control systems, and many other electrical and electronic devices. These are the key contributors for the connected robotic products. More customized and application-specific product requires more and more classified components.
The market for service robots application was the largest in 2015. The wide range of applications in service robotics is still expanding with the introduction of Internet of Things and its different capabilities in robotics. The medical, healthcare, domestic, and defense and security are few industries that have been adopting IoRT technology in its operations.
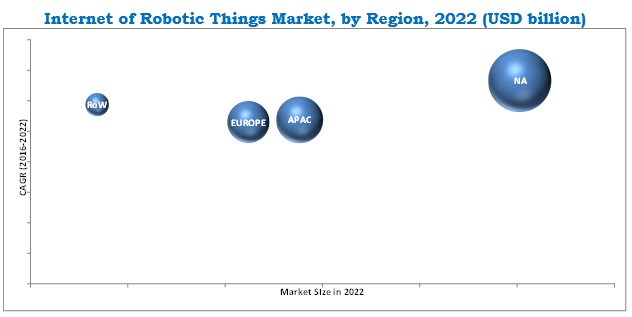
North America accounted for the largest market share of IoRT market followed by Europe in 2015. The rate of adoption of IoRT in North America is expected to be more as compared to other regions; it is expected to grow at the highest rate during the forecast period.
The major challenge for the companies in the market is implementation of high quality and reliable robots, and testing them with suitable solutions and data security and interoperability issues. High cost of R&D and long process of new product development are few restraints for the growth of IoRT market.
ABB Ltd. (Switzerland) is one of the leading companies in the IoRT market, followed by KUKA AG (Germany) providing integrated and connected robotic solutions with advancing technology to sustain in the collaborative industrial robots market. Key players in this market are increasingly undertaking mergers and acquisitions to acquire new technologies.
The key companies in the Internet of Robotic Things include ABB Ltd. (Switzerland), KUKA AG (Germany), iRobot Corp. (U.S.), Amazon.com, Inc. (U.S.), Google, Inc. (U.S.), Fanuc, Corp. (Japan), Cisco Systems, Inc. (U.S.), Intel Corporation (U.S.), Honda Motors Co., Ltd. (Japan), Yaskawa Electric Corporation (Japan), Northrop Grumman Corporation (U.S.), Aethon Inc. (U.S.), Bluefin Robotics Corporation (U.S.), Adept Technologies, Inc. (U.S.), Geckosystems International Corporation (U.S.), ECA Group (France), Robert Bosch GmbH (Germany), and Samsung Electronics Co. Ltd. (South Korea).
Benefits in the process output, data analytics, real-time streaming, and cloud support advanced automotive electronics will lead to the increased adoption of Internet of Robotic Things
Automotive
In the automotive sector, there has been a paradigm shift from the cost-intensive robots to versatile and reliable smart robots. Besides, within the manufacturing process, high-tech robots has proven to be more profitable with respect to productivity, by achieving new levels of speed, accuracy, precision, flexibility, and agility. Smart robots are used in the automotive sector in the production line to transfer materials from one location to another. To accomplish such tasks autonomously guided vehicles (AGVs) are used, which are often equipped with inductive sensors to track metal strips embedded on the factory floor.
Electronics
The electronics industry is dynamic, with new products being launched every year, the availability of a variety of applications, and potential new areas of applications. This demands precision, utmost repeatability, quality, and speed in almost every process supply chain, thereby creating decisive competitive advantages in terms of high productivity and low production costs. Robots are mainly used in the assembly lines of computer hard drives, grinding of optical lenses or assembly of fuel cells, and other similar complicated tasks.
Field
The use of robots in the agriculture sector is fairly recent. Numerous milking robotic products have emerged in the recent years with resounding success. Milking robots, however, require huge initial investments, and since the cows are milked more frequently, the fat concentration in milk is also lesser. The future developments in this field may involve the detection of abnormal milk, detection of heat, and analysis of milk components.
Critical questions would be;
- Where will all these developments take the industry in the mid to long term?
- Which application will hold the major market potential in internet of robotic things ecosystem?
- Which will be the major market expansion strategy adopted by the players in the studied market?
To speak to our analyst for a discussion on the above findings, click Speak to Analyst
 Exclusive indicates content/data unique to MarketsandMarkets and not available with any competitors.
Table of Contents
1 Introduction (Page No. - 15)
1.1 Objectives of the Study
1.2 Market Definition
1.3 Scope of the Study
1.3.1 Markets Covered
1.3.2 Geographic Scope
1.3.3 Years Considered for the Study
1.4 Currency
1.5 Limitations
1.6 Stakeholders
2 Research Methodology (Page No. - 19)
2.1 Introduction
2.1.1 Secondary Data
2.1.1.1 Key Data From Secondary Sources
2.1.2 Primary Data
2.1.2.1 Key Data From Primary Sources
2.1.2.2 Key Industry Insights
2.1.2.3 Breakdown of Primaries
2.2 Market Size Estimation
2.2.1 Bottom-Up Approach
2.2.2 Top-Down Approach
2.3 Market Breakdown and Data Triangulation
2.4 Research Assumptions
3 Executive Summary (Page No. - 28)
4 Premium Insights (Page No. - 35)
4.1 Internet of Robotic Things Market Opportunities
4.2 Internet of Robotic Things Market, 2015
4.3 Geographic Snapshot of the Market
4.4 Market, By Service, 2016–2022 (USD Million)
4.5 Market, By Collaborative Industrial Robot Application, 2014–2022, (USD Million)
5 Market Overview (Page No. - 40)
5.1 Introduction
5.2 Market Segmentation
5.2.1 By Smart Robot Component
5.2.2 By Software
5.2.3 By Platform
5.2.4 By Service
5.2.5 By Application
5.3 Market Dynamics
5.3.1 Drivers
5.3.1.1 Adoption By E-Commerce Industry
5.3.1.2 Increasing Application Areas Owing to Integration of Robots With Various Technologies
5.3.1.3 Short Payback Period and ROI
5.3.2 Restraints
5.3.2.1 High Cost of Research & Development
5.3.2.2 Long Process of New Product Development
5.3.3 Opportunities
5.3.3.1 Increasing Demand of Robots in Education Sector
5.3.4 Challenges
5.3.4.1 Implementation of High-Quality and Reliable Robots and Testing Them With Suitable Solutions
5.3.4.2 Data Security and Interoperability Issues
6 Industry Trends (Page No. - 48)
6.1 Introduction
6.2 Value Chain Analysis
6.3 Industry Trends
6.4 Porter’s Five Forces Analysis
6.4.1 Threat of New Entrants
6.4.2 Threat 0f Substitutes
6.4.3 Bargaining Power of Buyers
6.4.4 Bargaining Power of Suppliers
6.4.5 Degree of Competitions
7 Market, By Smart Robot Component (Page No. - 60)
7.1 Introduction
7.2 Sensors
7.3 Actuators
7.4 Power Sources
7.5 Control Systems
7.6 Others
8 Market, By Software (Page No. - 65)
8.1 Introduction
8.2 Real-Time Streaming Analytics
8.3 Security Solutions
8.4 Data Management
8.5 Remote Monitoring Systems
8.6 Network Bandwidth Management
9 Market, By Platform (Page No. - 71)
9.1 Introduction
9.2 Device Management Platform
9.3 Application Management Platform
9.4 Network Management Platform
10 Market, By Service (Page No. - 75)
10.1 Introduction
10.2 Professional Services
10.2.1 Deployment and Integration
10.2.2 Support and Maintenance
10.2.3 Consulting Services
10.3 Managed Services
11 Market, By Application (Page No. - 80)
11.1 Introduction
11.2 Collaborative Industrial Robots
11.2.1 Automotive
11.2.2 Electronics
11.2.3 Food & Beverages
11.3 Service Robots
11.3.1 Personal Services
11.3.1.1 Domestic
11.3.1.1.1 Vacuum & Floor Cleaning
11.3.1.1.2 Lawn Mowing
11.3.1.1.3 Pool Cleaning
11.3.1.2 Entertainment
11.3.1.2.1 Smart Toys
11.3.1.2.2 Robotic Pets
11.3.1.3 Others
11.3.1.3.1 Elderly & Handicap Assistance
11.3.1.3.2 Home Security & Surveillance
11.3.2 Professional Services
11.3.2.1 Defense & Security
11.3.2.1.1 Demining
11.3.2.1.2 Fire & Bomb Fighting
11.3.2.2 Field
11.3.2.2.1 Agriculture & Forestry
11.3.2.2.2 Milking Robots
11.3.2.3 Medical
11.3.2.3.1 Rehabilitation Systems
11.3.2.3.2 Others (Assistive Robots)
11.3.2.4 Underwater
11.3.2.5 Logistics
11.3.2.5.1 Factory Logistics
11.3.2.5.2 Service Logistics
11.3.2.6 Telepresence
11.3.2.6.1 Business
11.3.2.6.2 Healthcare
11.3.2.6.3 Personal
11.3.2.7 Inspection & Maintenance
11.3.2.7.1 Facilities & Plants
11.3.2.7.2 Tank, Tubes, Pipes, and Sewers
11.3.2.7.3 Ships & Turbines
11.3.2.7.4 Others (Infrastructure Construction)
11.3.2.8 Others
12 Market, By Geography (Page No. - 113)
12.1 Introduction
12.2 North America
12.2.1 U.S.
12.2.2 Canada
12.2.3 Mexico
12.3 Europe
12.3.1 U.K.
12.3.2 Germany
12.3.3 France
12.3.4 Rest of Europe
12.4 APAC
12.4.1 India
12.4.2 China
12.4.3 Japan
12.4.4 South Korea
12.4.5 Rest of APAC
12.5 RoW
12.5.1 Middle East & Africa
12.5.2 South America
13 Competitive Landscape (Page No. - 127)
13.1 Overview
13.2 Key Players in Internet of Robotic Things Market
13.3 Competitive Situation and Trends
13.3.1 Partnership and Collaborations
13.3.2 New Product Development/ Launch
13.3.3 Acquisitions
13.3.4 Expansions, Investment, Restructuring
13.3.5 Agreements and Contracts
14 Company Profiles (Page No. - 135)
(Company at A Glance, Recent Financials, Products & Services, Strategies & Insights, & Recent Developments)*
14.1 Introduction
14.2 ABB Ltd. (Switzerland)
14.3 Kuka AG (Germany)
14.4 Irobot Corporation (U.S.)
14.5 Fanuc Corporation (Japan)
14.6 Amazon.Com, Inc. (U.S.)
14.7 Google, Inc (U.S.)
14.8 Cisco Systems, Inc. (U.S.)
14.9 Intel Corporation (U.S.)
14.10 Honda Motors Co., Ltd (Japan)
14.11 Yaskawa Electric Corporation (Japan)
14.12 Northrop Grumman Corporation (U.S.)
14.13 Aethon Inc. (U.S.)
14.14 Blufin Robotics Corporation (U.S.)
14.15 Omron Adept Technologies, Inc. (U.S.)
14.16 Geckosytems International Corporation (U.S.)
14.17 ECA Group (France)
14.18 Robert Bosch GmbH (Germany)
14.19 Samsung Electronics Co., Ltd (South Korea)
*Details on Company at A Glance, Recent Financials, Products & Services, Strategies & Insights, & Recent Developments Might Not Be Captured in Case of Unlisted Companies.
15 Appendix (Page No. - 180)
15.1 Insights of Industry Experts
15.2 Discussion Guide
15.3 Knowledge Store: Marketsandmarkets’ Subscription Portal
15.4 Introducing RT: Real-Time Market Intelligence
15.5 Available Customizations
15.6 Related Report
List of Tables (69 Tables)
Table 1 Internet of Robotic Things Market, By Smart Robot Component, 2014–2022, (USD Million)
Table 2 Market for Smart Robot Components, By Geography (USD Million)
Table 3 Market, By Software, 2014–2022, (USD Million)
Table 4 Internet of Robotic Things Market for Software, By Geography (USD Million)
Table 5 Market, By Platform, 2014–2022, (USD Million)
Table 6 Market for Platform, By Geography (USD Million)
Table 7 Internet of Robotic Things Market, By Service, 2014–2022, (USD Million)
Table 8 Market for Services, By Geography (USD Million)
Table 9 Market, By Professional Service, 2014–2022, (USD Million)
Table 10 Market, By Application, 2014–2022, (USD Million)
Table 11 Market for Collaborative Industrial Robots, By Application, 2014–2022, (USD Million)
Table 12 Market for Collaborative Industrial Robots, By Region (USD Million)
Table 13 Internet of Robotic Things Market for Service Robots, By Application, 2014–2022, (USD Million)
Table 14 Market for Personal Services, By Application, 2014–2022, (USD Million)
Table 15 Market for Personal Services, By Region (USD Million)
Table 16 Market for Domestic Applications, By Type, 2014–2022, (USD Million)
Table 17 Market for Domestic Applications, By Region (USD Million)
Table 18 Market for Vacuum & Floor Cleaning Robots, By Region (USD Million)
Table 19 Market for Lawn Mowing Robots, By Region (USD Million)
Table 20 Market for Pool Cleaning Robots, By Region (USD Million)
Table 21 Internet of Robotic Things Market for Entertainment Applications, By Type, 2014–2022, (USD Million)
Table 22 Market for Entertainment Applications, By Region (USD Million)
Table 23 Market for Smart Toys, By Region (USD Million)
Table 24 Market for Robotic Pets, By Region (USD Million)
Table 25 Internet of Robotic Things Market for Other Applications, By Type, 2014—2022, (USD Million)
Table 26 Market for Other Applications, By Region (USD Million)
Table 27 Market for Elderly & Handicap Assistance Applications, By Region (USD Million)
Table 28 Market for Home Security & Surveillance Applications, By Region (USD Million)
Table 29 Market for Professional Services, By Application, 2014–2022, (USD Million)
Table 30 Market for Professional Services, By Region (USD Million)
Table 31 Internet of Robotic Things Market for Defense Applications, By Type, 2014–2022, (USD Million)
Table 32 Market for Defense Applications, By Region (USD Million)
Table 33 Market for Demining Applications, By Region (USD Million)
Table 34 Market for Fire & Bomb Fighting Applications, By Region (USD Million)
Table 35 Market for Field Applications, By Type, 2014–2022, (USD Million)
Table 36 Market for Field Applications, By Region (USD Million)
Table 37 Market for Agriculture & Forestry Applications, By Region (USD Million)
Table 38 Market for Milking Robots Applications, By Region (USD Million)
Table 39 Market for Medical Applications, By Type, 2014–2022, (USD Million)
Table 40 Internet of Robotic Things Market for Medical Applications, By Region (USD Million)
Table 41 Market for Rehabilitation Systems, By Region (USD Million)
Table 42 Market for Other Medical Applications, By Region (USD Million)
Table 43 Market for Underwater Applications, By Region (USD Million)
Table 44 Market for Logistics Applications, By Type, 2014–2022, (USD Million)
Table 45 Market for Logistics Applications, By Region (USD Million)
Table 46 Internet of Robotic Things Market for Factory Logistics Applications, By Region (USD Million)
Table 47 Market for Service Logistics Applications, By Region (USD Million)
Table 48 Market for Telepresence Applications, By Type, 2014–2022, (USD Million)
Table 49 Market for Telepresence Applications, By Region (USD Million)
Table 50 Internet of Robotic Things Market for Business Applications, By Region (USD Million)
Table 51 Market for Healthcare Applications, By Region (USD Million)
Table 52 Market for Personal Applications, By Region (USD Million)
Table 53 Market for Inspection & Maintenance Applications, By Type, 2014–2022, (USD Million)
Table 54 Market for Inspection & Maintenance Applications, By Region (USD Thousand)
Table 55 Market for Facilities & Plants, By Region (USD Thousand)
Table 56 Internet of Robotic Things Market for Tank, Tubes, Pipes, & Sewers, By Region (USD Thousand)
Table 57 Market for Ships & Turbines , By Region (USD Thousand)
Table 58 Market for Other Applications, By Region (USD Thousand)
Table 59 Market for Others Professional Applications, By Region (USD Million)
Table 60 Internet of Robotic Things Market, By Region, 2014–2022, (USD Million)
Table 61 Market in North America, By Country, 2014–2022, (USD Million)
Table 62 Market in Europe, By Country, 2014–2022, (USD Million)
Table 63 Market in APAC, By Country, 2014–2022, (USD Million)
Table 64 Internet of Robotic Things Market in RoW, By Region, 2014–2020, (USD Million)
Table 65 Partnerships and Collaborations, 2015–2016
Table 66 New Product Development/ Launch
Table 67 Aquisitions
Table 68 Expansions, Investment, Restructuring 2014–2016
Table 69 Agreements and Contracts, 2014–2016
List of Figures (61 Figures)
Figure 1 Market Segmentation
Figure 2 Internet of Robotic Things Market: Research Design
Figure 3 Market Size Estimation Methodology: Bottom-Up Approach
Figure 4 Internet of Robotic Things Market Size Estimation Methodology: Top-Down Approach
Figure 5 Market Breakdown and Data Triangulation
Figure 6 Services Segment of the IORT Market is Expected to Grow at the Highest Rate Between 2016 and 2022
Figure 7 Sensors Expected to Register Highest Growth During the Forecast Period in the IORT Market for Smart Robot Components
Figure 8 Security Solution Segment Expected to Grow at the Highest CAGR During the Forecast Period in the IORT Market for Software
Figure 9 Devices Management Platform Expected to Grow at the Highest Rate During the Forecast Period in the IORT Market for Platforms
Figure 10 Collaborative Industrial Robot Application to Grow at A Higher Rate During the Forecast Period
Figure 11 North America Accounted for the Largest Market Share in 2015
Figure 12 Emerging Markets in APAC and South America to Create Opportunities for IORT Market During the Forecast Period
Figure 13 Smart Robot Component Segment Accounted for the Largest Share of the IORT Market in 2015
Figure 14 The Market in Mexico is Expected to Grow at the Highest CAGR During the Forecast Period
Figure 15 Professional Service Segment is Expected to Grow at A Higher Rate During the Forecast Period
Figure 16 Electronics Application Expected to Grow at the Highest Rate During the Forecast Period
Figure 17 Geographic Segmentation of the Market
Figure 18 Increasing Application Areas Owing to Integration of Robots With Various Technologies is the Major Driver for the IORT Market
Figure 19 Online Retail Market Growth of Major Countires, 2015—2016
Figure 20 Value Chain: Internet of Robotic Things Market
Figure 21 Key Industry Trends in Market
Figure 22 The Porter’s Five Forces Analysis (2015)
Figure 23 Porter’s Five Forces Analysis for the Market, 2015
Figure 24 The Impact of Threat of New Entrants Was Medium as Sound Technical and Industrial Knowledge is Required to Enter the Market
Figure 25 The Impact of Threat of Substitutes Was Low Since the Technological Alternatives are Less
Figure 26 Bargaining Power of Buyers Was Low Due to Increasing Switching Cost and Customization in Products in the Market
Figure 27 Bargaining Power of Suppliers Was Medium as the Impact of Inputs By Suppliers on End Product and End Users is Considerable.
Figure 28 Internet of Robotic Things Market, By Smart Robot Component
Figure 29 Market for Sensors Expected to Grow at the Highest CAGR During the Forecast Period
Figure 30 Market, By Software
Figure 31 Market for Security Solutions Expected to Grow at the Highest CAGR During the Forecast Period
Figure 32 Market, By Platform
Figure 33 Market for Device Management Platform Expected to Grow at the Highest CAGR During the Forecast Period
Figure 34 Internet of Robotic Things Market, By Service
Figure 35 Market for Deployment and Integration Services Expected to Grow at the Highest CAGR During the Forecast Period
Figure 36 Internet of Robotic Things Market, By Application
Figure 37 Market for Collaborative Industrial Robots Expected to Grow at the Highest Rate During the Forecast Period
Figure 38 Geographic Snapshot: Internet of Robotic Things Market (2016–2022)
Figure 39 Snapshot: Market in North America
Figure 40 Snapshot: Market in Europe
Figure 41 Snapshot: Market in APAC
Figure 42 Snapshot: Market in RoW
Figure 43 Companies Adopted New Product Launches and Acquisitions as the Key Growth Strategies Over the Last Four Years (2013–2016)
Figure 44 Battle for Market Share: Partnerships ADN Collaborations Have Been the Key Strategy
Figure 45 Geographic Revenue Mix of the Top Five Market Players
Figure 46 ABB Ltd. : Company Snapshot
Figure 47 Kuka AG :Company Snapshot
Figure 48 Irobot Corporatipon (U.S.):Company Snapshot
Figure 49 Fanuc Corporatipon (Japan): Company Snapshot
Figure 50 Amazon.Com, Inc. (U.S.): Company Snapshot
Figure 51 Google Inc. (U.S.):Company Snapshot
Figure 52 Cisco Systems, Inc. (U.S.): Company Snapshot
Figure 53 Intel Corporation (U.S.): Company Snapshot
Figure 54 Honda Motors Co., Ltd (Japan): Company Snapshot
Figure 55 Yaskawa Electrical Corporation (Japan): Company Snapshot
Figure 56 Northrop Grumman Corporation (U.S.): Company Snapshot
Figure 57 Omron Adept Technologies, Inc. (U.S.): Company Snapshot
Figure 58 Geckosystems International Corporation (U.S.): Company Snapshot
Figure 59 ECA Group (France): Company Snapshot
Figure 60 Robert Bosch GmbH (Germany):Company Snapshot
Figure 61 Samsung Electronics Co., Ltd (South Korea):Company Snapshot
Research Methodology
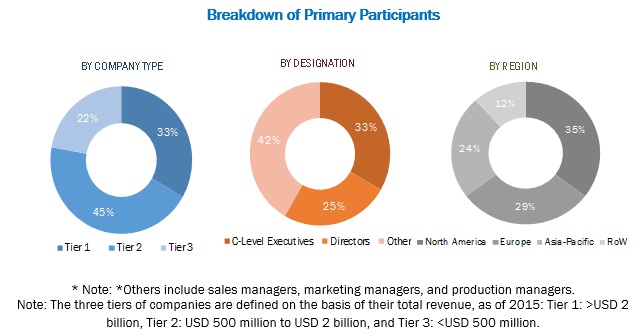
During this research study, major players of the Internet of Robotic Things ecosystem in various regions have been identified and their offerings, regional presence, and distribution channels have been understood through in-depth discussions. To find the overall market size, top-down and bottom-up approaches have been used to estimate the sizes of other individual markets by using percentage splits from secondary sources such as Hoovers, Bloomberg Business, Factiva, and OneSource and primary research. The entire procedure includes the study of the annual and financial reports of the top market players and extensive interview of industry leaders such as CEOs, VPs, directors, and marketing executives for key insights (both qualitative and quantitative) pertaining to the market. The figure below shows the breakdown of the primaries on the basis of the company type, designation, and region conducted during the research study.
To know about the assumptions considered for the study, download the pdf brochure
The ecosystem of Internet of Robotic Things market comprises a well-established network of manufacturers, distributors, hardware vendors, and service providers. The key companies in the Internet of Robotic Things include ABB Ltd. (Switzerland), KUKA AG (Germany), iRobot Corp. (U.S.), Amazon.com, Inc. (U.S.), Google, Inc. (U.S.), Fanuc, Corp. (Japan). The prominent companies in the markets include the well-established, financially stable and technically expertise players that have been operating in the industry for several years and have diversified product portfolios, proprietary technologies, and strong distribution networks through collaborations and acquisitions.
Target Audience:
- Semiconductor foundries
- Original Equipment Manufacturers (OEMs)
- ODM and OEM technology solution providers
- Research Institutes
- Market research and consulting firms
- Internet of things (IoT) forums, alliances, and associations
- Technology investors
- Governments and financial institutions
- Analysts and strategic business planners
- End-users who want to know more about the smart robots technology and the latest technological developments in the IoT and robotics industry
Report Scope
By Smart Robot Component:
- Sensors
- Actuators
- Power source
- Control systems
- Other (Electrical, Electronic and Mechanical)
By Software:
- Real Time Streaming Analytics
- Security Solution
- Data Management
- Remote Monitoring System
- Network Bandwidth Management
By Platform:
- Introduction
- Device Management Platform
- Application Management Platform
- Network Management Platform
By Service:
-
Professional Services
- Deployment and Integration
- Support and Maintenance
- Consulting Services
- Managed Services
By Application:
-
Collaborative Industrial Robots
- Automotive
- Electronics
- Food and Beverages
- Others
-
Service Sector
-
Personal Services
- Domestic
-
Entertainment
- Smart Toys
- Robotic Pets
- Others
-
Professional Services
-
Defense and Security
- Demining
- Fire and Bomb Fighting
-
Field
- Agriculture and forestry
- Milking robots
-
Medical
- Rehabilitation system
- Others (Assistive robots)
- Underwater
-
Logistics (Automated Guided Vehicles)
- Factory logistics
- Service logistics
-
Telepresence
- Business
- Healthcare
- Personal
-
Inspection & Maintenance
- Factory facilities
- Tank, tubes, pipes and sewers
- Ships and turbines
- Others (Infrastructure and construction)
- Others
-
Defense and Security
-
Personal Services
By Geography:
- North America
- Europe
- APAC
- Rest of the World
Available Customizations:
With the given market data, MarketsandMarkets offers customizations according to the client’s specific needs. The following customization options are available for the report:
Geographic Analysis
- Further analysis of the Internet of Robotic Things market for additional countries
Company Information
- Detailed analysis and profiling of additional market players (up to five)


Growth opportunities and latent adjacency in Internet of Robotic Things Market