Functional Safety Market Size, Share and Trends

Report Code SE 5286
Published in Dec, 2024, By MarketsandMarkets™
Download PDF

Choose License Type

Buy Report Now Inquire Before Buying

Functional Safety Market by Safety Sensors (Emergency Stop, Temperature, Pressure, Gas), Safety Light Curtain, Safety Controller, Programmable Safety System, Safety Switches, TIC Analysis Type (Fault & Event Analysis), Robotics – Global Forecast to 2029


Functional Safety Market Size, Share & Trends

The global functional safety market is projected to grow from USD 5,883.3 million in 2024 to USD 7,896.6 million by 2029, at a CAGR of 6.1% during the forecast period.

Regulatory standards undertaken by governments and the surging demand for functional safety solutions to reduce accidents and ensure asset protection in industrial environments drive the market. The integration of IoT and AI into industrial processes has increased the demand for functional safety systems capable of addressing safety challenges. The key segments, such as safety sensors, controllers, and emergency shutdown systems, drive the market by ensuring compliance, operational safety, and efficiency across industries.

Functional Safety Market

Attractive Opportunities in the Functional Safety Market

ASIA PACIFIC

The market growth in Asia Pacific can be attributed to rapid industrialization in countries such as India.

Enforcement of stringent safety regulations by governments is a key factor driving the functional safety market growth.

Increasing deployment of IIoT technology in industries presents significant growth opportunities in the functional safety market.

The growing use of the Industrial Internet of Things (IIoT) and Artificial Intelligence (AI) in factories is revolutionizing industries by enabling predictive maintenance, real-time data collection, and improved process control. This is expected to provide lucrative opportunities for functional safety market players.

Complexities related to designing systems that comply with safety standards are expected to challenge the growth of this market.

Impact of AI in Functional Safety Market

Currently, Al is revolutionizing functional safety in functional industrial settings. A functional safety platform based on Al can quickly analyze enormous volumes of data incoming from sensors and equipment and identify potential risks and anomalies prior to developing into failures and accidents. Al-driven predictive maintenance models are able to identify the condition of equipment and forecast failures, providing certain actions to prevent breaks and emergencies.

Functional Safety Market

Global Functional Safety Market Dynamics

Driver: Enforcement of stringent safety regulations by governments

Functional safety regulations play a significant role in the growth of the functional safety market. The US and European governments are undertaking several measures to prevent accidents by enforcing regulations related to process safety and installing certified equipment, including explosion-proof sensors, switches, and actuators in hazardous locations. Several organizations such as OSHA, IEC, ISO, and ANSI have laid down the safety regulations and the overseeing procedures to enhance the safety and effectiveness of industrial operations. According to the Health and Safety Authority in Europe, employers must ensure that machinery is designed and maintained to be safe, minimizing risks to workers. a risk assessment plan should cover any machinery used in a plant. According to UK health and safety regulations, organizations involved in designing, developing, testing, and installing devices or systems for safety-related industries must adhere to corporate policies and procedures related to functional safety management to ensure product integrity. Furthermore, countries in the European Economic Area (EEA) comply with the European Norm (EN) safety standards, replicating IEC and ISO standards for functional safety.

Restraint: High installation and maintenance costs

Functional safety is a necessity for the protection of machines and production lines in case of emergency situations. However, expenses incurred in functional safety components, installation, maintenance, and repairs can become a huge burden on the resources of an organization. Large conglomerates may be able to sustain these costs intermittently, but the same cannot be said for small and medium organizations. For instance, ABB Ltd. has quite a reputation for successfully delivering and installing functional safety systems in more than 55 nations across the globe. Employees of the company and safety system teams always exist on all continents and work on safety solutions. Being in a position to have significant investment capacities, ABB can roll out systems in many regions, which smaller players in the functional safety market might find difficult to achieve.

Safety systems must comply with certain regulatory requirements, which are regularly homologated to new technological advancements and regulations. This indicates that organizations must continually develop their safety systems, thus requiring more resources on safety components and systems. This just may be a trivial constraint for small and medium-sized enterprises.


Opportunity: Increasing deployment of IIoT technology in industries

The Industrial Internet of Things (IIoT) introduces new concepts of integrated safety and compliance services. IIoT gathers data from sensors, which include pressures, levels, flow, temperature, and vibration data, and feeds this information to monitors. The data is transmitted through conductive and non-conductive networks, processed in real time, and can be alerted and even perhaps solved in an emergency. Through IIoT, companies can link their processes with safety systems, and the results can be observed in real time. IIoT provides the features of low cost, low power consumption of microprocessors, and increased security, convenience, and efficiency, besides satisfying the requirement of industrial security and stability. However, it is worth admitting that most manufacturing companies have not integrated IIoT for safety instrumented functions in plants, factories, or areas where industrial hazardous materials are processed. Furthermore, targeted monitoring, analysis, and control occur quickly while offering virtual physical system management that enhances operational performance. During the forecasting period, there will be a rise in the use of IIoT, and therefore, there will be an increase in demand for functional safety investments.

Challenge: Complexities related to designing systems that comply with safety standards

Because the rising number of applications in recent times as well as a variety of factors including types of industries, installation location and operational needs such as less downtime, and absence of fire design of safety functional systems have become relatively challenging for designers. Design of safety systems involves different stages, limits, and above all, necessity for smooth communication of the intended end users' system.

One of the significant challenges is that the architectures must protect against hardware and software failures with the Safety Integrity Level 3. SIL 3 requires risk assessments at every module with the performance of components that must reach the required safety rating. This complexity is further increased because the component is coming from different manufacturers, which means designers must look for the best options that suit the system integration. Installation difficulty becomes severe and raises maintenance demands.

Furthermore, the intricacies of software and hardware design under functional safety standards create additional pressures on producers. Meeting these stringent requirements while addressing system complexity and ensuring reliability requires significant effort and expertise, making the development of functional safety systems both time-consuming and demanding.

Functional Safety Market Ecosystem

Major companies offering functional safety include Schneider Electric (France), ABB (Switzerland), Honeywell International Inc. (US), Emerson Electric Co. (US), Rockwell Automation (US), Yokogawa Electric Corporation (Japan), HIMA (Germany), Omron Corporation (Japan), Siemens (Germany), and General Electric (US). The functional safety ecosystem comprises device providers, system providers, and end-use industries.

Top Companies in Functional Safety Market
 

Safety sensor segment to share largest market share from 2024 to 2029

The safety sensor segment will share the largest market share during the forecast period. Various types of safety sensors, such as emergency stop, temperature, pressure, and gas sensors, are used in a functional safety system. Safety sensors are essential components in safety systems, designed to ensure safe operations even when measurements or signal transmissions fail. They act as the first line of defense by spotting potential hazards, irregularities, or malfunctions and initiating preventative actions to reduce risks and avert accidents. These sensors are designed to be redundant. In the event of a failure, one component takes the place of the other, preventing productivity losses from shutdown.

Safety sensors are very critical for many functional safety systems, such as Turbomachinery Control Systems (TMCs), Burner Management Systems (BMS), Fire and Gas Monitoring Systems (FGS), High Integrity Pressure Protection Systems (HIPPS), and Emergency Shutdown Systems (ESDs). These sensors can be used to record tooling data, integrate with the automated system, and track the position and movement of machinery for safe and efficient operation. These sensors are available in automatic safety barriers, electronic safety devices, emergency stops (e-stops), and safety controls. Advancements in industrial automation, automotive technologies like electric and autonomous vehicles, and the expansion of renewable energy systems drive the demand for safety sensor devices in the functional safety market.

The automotive industry segment is expected to grow at the highest CAGR during the forecast period.

The Automotive will represent the highest CAGR in the functional safety market during the forecast period; this is due to the key functions of functional safety systems as guarantees for operational safety and efficiency. These systems ensure detection of hazardous conditions and actions taken in those directions to prevent damage, making machines and personnel safe. The examples for common ones include emergency stopping systems, advanced safety sensors, and safety programmable logic controllers. These are implemented for minimizing the effects of the hazards inherent in high-risk operations.

Modern automotive production lines, which rely extensively on robotics for assembly, welding, and painting, significantly benefit from functional safety solutions. Functional safety systems increase the reliability of the production process by ensuring the safe operation of these machines. The need for integrated safety measures is even more pronounced in dynamic production environments that use techniques such as just-in-time manufacturing and modular assembly lines, where precision and adaptability are paramount.

These systems do not only resolve safety issues but also enable the manufacturers to achieve the goals of high productivity and security. Reducing downtime with the compliance of very strict standards of safety, functional safety systems become inevitable for optimal operational performance of the car manufacturing plants.

Asia Pacific is projected to register the highest CAGR in the functional safety market.

Asia Pacific is expected to record the highest CAGR for the functional safety market during the estimated period due to rapid industrialization and urbanization and growing manufacturing sectors. Governments of different countries like China, India, Japan, and South Korea are implementing smart manufacturing visionary schemes, including the Made in China 2025 strategy prototype in China and Make in India in India for getting more automation to increase efficiency and competitive advantage. Some factors fueling the Asia Pacific functional safety market are industrialization, smart manufacturing, and expanding industries like automobile and renewable power.

Furthermore, recent enhancements and government acts have also supported the market to a greater extent. New renewable energy projects include India’s National Solar Mission and China’s stepped-up plans for wind energy, pointing to the need for functionally safe energy systems. Furthermore, many nations in Asia Pacific are increasing the standards to correspond with crucial global standards, including IEC 61508, ISO 26262, and ISO 13849, especially in the automotive, oil and gas, and chemical industries. These regulations are compelling organizations to adopt higher orders of functional safety solutions.

LARGEST MARKET SHARE IN 2020-2029
CHINA FASTER-GROWING MARKET IN REGION
Functional Safety Market Size and Share

Recent Developments of Functional Safety Market

  • In September 2024, Rockwell Automation added a new chapter to its rich legacy of innovations in safety technology with the launch of the Logix SIS, a new generation SIS for responding to today’s complex industrial challenges.
  • In April 2024, Emerson Electric Co. launched the new ASCO Series 148/149 safety valve and motorized actuator, designed for industrial fuel oil burner recirculation and safety shutoff applications. This solution offers industrial users a dependable and versatile tool to prevent overpressure, leaks, and system malfunctions that could lead to health and safety risks.
  • In April 2024, Johnson Controls Inc., a provider of integrated building solutions characterized as smart, healthy, and sustainable, announced the North American commercial debut of the Security Operations Centers (SOC) service. Built on 50 years of central monitoring and response experience worldwide, this SOC solution offers North American clients improved business resilience and minimized risks at a fixed price per service.
  • In August 2023, Schneider Electric introduced a new MSS solution to assist clients in OT domains in dealing with new threats arising from increased dependence on remote and other connectivity solutions.
  • In August 2023, Yokogawa Electric Corporation released the update of a part of the OpreX Control and Safety System named Collaborative Information Server aimed at improving the functions of alarm monitoring and treatment, instrument maintenance data acquisition, and compliance with international communication standards.

Key Market Players

List of Top Functional Safety Market

Want to explore hidden markets that can drive new revenue in Functional Safety Market?

Scope of the Report

Report Attribute Details
Estimated Market Size USD 5,883.3 million
Projected Market Size USD 7,896.6 million
Growth Rate CAGR of 6.1%
Market size available for years 2020–2029
Base year considered 2023
Forecast period 2024–2030
Forecast units Value (USD Million/Billion)
Segments Covered By Device, Service, System, Application, industry, and region
Regions covered North America, Europe, Asia Pacific, and RoW

Frequently Asked Questions (FAQs)

Who are the major players in the functional safety market? What are their major strategies to strengthen their market presence?
The major players in the functional safety market include Schneider Electric (France), ABB (Switzerland), Honeywell International Inc. (US), Emerson Electric Co. (US), Rockwell Automation (US), Yokogawa Electric Corporation (Japan), HIMA (Germany), Omron Corporation (Japan), Siemens (Germany), and General Electric (US). The major strategies adopted by these players are product launches and developments. Also, these companies have a wide market presence and robust portfolio of functional safety instrumented systems.
What is functional safety automation?
Functional safety systems comprise sensors, logic solvers, switches, and final control elements, which are planned and installed to protect personnel, equipment, and the environment. Functional safety systems act to prevent or reduce the risk of abnormal process conditions that can occur in an industry. These systems are engineered to perform specific control functions to maintain safety in a process operation during dangerous situations. Nowadays, there is a requirement for functional safety in industries to ensure uninterrupted operations, reliability, and safety of processes under all conditions.
Which region is expected to witness the highest CAGR in the functional safety market?
Asia Pacific is expected to record the highest CAGR for the functional safety market during the forecast period due to rapid industrialization and urbanization and growing manufacturing sectors.
What are the drivers and opportunities for the functional safety market?
Enforcement of stringent safety regulations by government safety, increasing investment in oil and gas plants to meet energy demand, and adopting advanced safety solutions to prevent accidents in industrial facilities are the drivers. Rising emphasis on workplace safety in developed countries, increasing deployment of IIoT technology in industries and growing demand for advanced driver assistance systems and autonomous vehicles are major opportunities for players in the functional safety market.
What are the restraints and challenges for the functional safety market?
? High installation and maintenance costs and complexities associated with development and integration are the restraints in the market. Complexities related to designing systems that comply with safety standards and the shortage of skilled functional safety-certified workforce are challenges in the functional safety market.


Personalize This Research

  • Triangulate with your Own Data
  • Get Data as per your Format and Definition
  • Gain a Deeper Dive on a Specific Application, Geography, Customer or Competitor
  • Any level of Personalization
Request A Free Customisation

Let Us Help You

  • What are the Known and Unknown Adjacencies Impacting the Functional Safety Market
  • What will your New Revenue Sources be?
  • Who will be your Top Customer; what will make them switch?
  • Defend your Market Share or Win Competitors
  • Get a Scorecard for Target Partners
Customized Workshop Request

Table of Contents

Exclusive indicates content/data unique to MarketsandMarkets and not available with any competitors.

TITLE
PAGE NO
INTRODUCTION
28
RESEARCH METHODOLOGY
33
EXECUTIVE SUMMARY
46
PREMIUM INSIGHTS
51
MARKET OVERVIEW
54
  • 5.1 INTRODUCTION
  • 5.2 MARKET DYNAMICS
    DRIVERS
    - Enforcement of stringent safety regulations by government authorities
    - Increasing investment in oil and gas plants to meet energy demand
    - Mounting adoption of advanced safety solutions to prevent accidents in industrial facilities
    - Rapid digital transformation to revolutionize traditional manufacturing
    RESTRAINTS
    - High installation and maintenance costs
    - Lack of awareness about safety devices
    OPPORTUNITIES
    - Rising emphasis on occupational safety in developed countries
    - Increasing deployment of IIoT technology in industries
    CHALLENGES
    - Complexities related to designing systems that comply with complex safety standards
    - Shortage of skilled workforce
  • 5.3 TRENDS/DISRUPTIONS IMPACTING CUSTOMER BUSINESS
  • 5.4 PROCESS FLOW ANALYSIS
  • 5.5 PRICING ANALYSIS
    AVERAGE SELLING PRICE TREND OF KEY PLAYERS, BY DEVICE, 2023
    AVERAGE SELLING PRICE TREND, BY DEVICE, 2020–2023
    AVERAGE SELLING PRICE TREND, BY REGION, 2020–2023
  • 5.6 SUPPLY CHAIN ANALYSIS
  • 5.7 ECOSYSTEM ANALYSIS
  • 5.8 TECHNOLOGY ANALYSIS
    KEY TECHNOLOGIES
    - Computer vision
    - Cybersecurity solutions
    - 5G
    - Automated machine learning
    COMPLEMENTARY TECHNOLOGIES
    - IIoT
    - Predictive maintenance tools
    ADJACENT TECHNOLOGIES
    - Virtual reality
    - Remote monitoring systems
  • 5.9 PATENT ANALYSIS
  • 5.10 TRADE ANALYSIS
    IMPORT SCENARIO (HS CODE 8481)
    EXPORT SCENARIO (HS CODE 8481)
  • 5.11 KEY CONFERENCES AND EVENTS, 2025–2026
  • 5.12 CASE STUDY ANALYSIS
    MP EQUIPMENT USES ALLEN-BRADLEY GUARDMASTER SAFETY RELAYS TO PROVIDE STRUCTURED APPROACH TO SAFETY IMPLEMENTATION
    MP EQUIPMENT PARTNERS WITH ROCKWELL AUTOMATION TO REEVALUATE PROTEIN PORTIONING MACHINE DESIGN
    BP CHOSES EMERSON ELECTRIC CO.’S SAFETY SYSTEMS FOR OIL OVERSPILL PROTECTION
    FERTILIZER MANUFACTURER IN ASIA PACIFIC ADOPTS EMERSON ELECTRIC CO.’S INCUS ULTRASONIC SYSTEM TO IMPROVE GAS LEAK DETECTION
    EXIDA ESTABLISHES PROCEDURES TO SUPPORT IOWA FERTILIZER COMPANY IN MAINTENANCE AND OPERATION PHASE OF FUNCTIONAL SAFETY LIFECYCLE
  • 5.13 INVESTMENT AND FUNDING SCENARIO
  • 5.14 REGULATORY LANDSCAPE
    REGULATORY BODIES, GOVERNMENT AGENCIES, AND OTHER ORGANIZATIONS
    STANDARDS
  • 5.15 PORTER’S FIVE FORCES ANALYSIS
    THREAT OF NEW ENTRANTS
    THREAT OF SUBSTITUTES
    BARGAINING POWER OF SUPPLIERS
    BARGAINING POWER OF BUYERS
    INTENSITY OF COMPETITIVE RIVALRY
  • 5.16 KEY STAKEHOLDERS AND BUYING CRITERIA
    KEY STAKEHOLDERS IN BUYING PROCESS
    BUYING CRITERIA
  • 5.17 IMPACT OF AI/GEN AI ON FUNCTIONAL SAFETY MARKET
    INTRODUCTION
    AI USE CASES
SIL TYPES FOR FUNCTIONAL SAFETY SYSTEMS
90
  • 6.1 INTRODUCTION
  • 6.2 SIL 2
  • 6.3 SIL 3
  • 6.4 SIL 4
SALES CHANNELS OF FUNCTIONAL SAFETY SYSTEMS
93
  • 7.1 INTRODUCTION
  • 7.2 DIRECT CHANNELS
  • 7.3 DISTRIBUTORS/RESELLERS
  • 7.4 SYSTEM INTEGRATORS
FUNCTIONAL SAFETY MARKET, BY APPLICATION
95
  • 8.1 INTRODUCTION
  • 8.2 ROBOTIC
    TRADITIONAL ROBOTS
    - Escalating adoption in high-speed, high-force industrial environments to expedite segmental growth
    COLLABORATIVE ROBOTS
    - Growing demand to ensure safe and dynamic human-robot collaborations to bolster segmental growth
  • 8.3 NON-ROBOTIC
    RISING FOCUS ON WORKER SAFETY AND ENVIRONMENTAL PROTECTION TO ACCELERATE SEGMENTAL GROWTH
FUNCTIONAL SAFETY MARKET, BY DEVICE
99
  • 9.1 INTRODUCTION
  • 9.2 SAFETY SENSORS
    RISING ADOPTION TO INTEGRATE AUTOMATED SYSTEMS AND TRACK TOOLS TO BOOST SEGMENTAL GROWTH
    - Emergency stop sensors
    - Temperature sensors
    - Pressure sensors
    - Gas sensors
  • 9.3 SAFETY CONTROLLERS/MODULES/RELAYS
    INCREASING USE TO MEET EXISTING SAFETY STANDARDS AND REDUCE RISKS TO ACCEPTABLE LEVEL TO FUEL SEGMENTAL GROWTH
  • 9.4 PROGRAMMABLE SAFETY SYSTEMS
    ESCALATING ADOPTION TO OFFER SIGNAL ANALYSIS, EQUIPMENT STATUS MONITORING, AND OTHER DIAGNOSTICS TO DRIVE MARKET
  • 9.5 SAFETY SWITCHES
    GROWING DEMAND DUE TO ABILITY TO SAFEGUARD EQUIPMENT AND PREVENT INJURIES TO AUGMENT SEGMENTAL GROWTH
  • 9.6 VALVES
    RISING APPLICATION IN INDUSTRIAL SECTORS TO CONTRIBUTE TO SEGMENTAL GROWTH
  • 9.7 ACTUATORS
    INCREASING USE IN OIL & GAS AND OTHER INDUSTRIES TO DRIVE MARKET
  • 9.8 EMERGENCY STOP DEVICES
    MOUNTING NEED FOR SAFETY MEASURES DUE TO HIGH INCIDENCE OF INDUSTRIAL ACCIDENTS TO FOSTER SEGMENTAL GROWTH
  • 9.9 OTHER DEVICES
    FUNCTIONAL SAFETY MARKET, BY SERVICE
FUNCTIONAL SAFETY MARKET, BY SERVICE
114
  • 10.1 INTRODUCTION
  • 10.2 TESTING, INSPECTION & CERTIFICATION
    INCREASING DEMAND FOR SAFETY-CERTIFIED SYSTEMS IN PROCESS INDUSTRIES TO BOOST SEGMENTAL GROWTH
    FAILURE MODES, EFFECTS, AND DIAGNOSTIC COVERAGE ANALYSIS (FMEDA)
    FAULT TREE ANALYSIS (FTA)
    EVENT TREE ANALYSIS (ETA)
    HAZARD & OPERABILITY STUDY (HAZOP)
  • 10.3 DESIGN, ENGINEERING & MAINTENANCE
    RISING EMPHASIS ON COMPLIANCE WITH SAFETY STANDARDS TO FUEL SEGMENTAL GROWTH
  • 10.4 TRAINING & CONSULTING SERVICES
    INCREASING NEED FOR HIGH-SKILLED AND TRAINED PERSONNEL TO MAINTAIN FUNCTIONAL SAFETY TO AUGMENT SEGMENTAL GROWTH
FUNCTIONAL SAFETY MARKET, BY SYSTEM
119
  • 11.1 INTRODUCTION
  • 11.2 EMERGENCY SHUTDOWN SYSTEMS
    RISING EMPHASIS ON INDUSTRIAL SAFETY AND OPERATIONAL RISK MITIGATION TO FUEL SEGMENTAL GROWTH
  • 11.3 FIRE & GAS MONITORING CONTROL SYSTEMS
    INCREASING NEED FOR ASSET PROTECTION ACROSS VARIOUS INDUSTRIES TO BOOST SEGMENTAL GROWTH
  • 11.4 TURBOMACHINERY CONTROL SYSTEMS
    GROWING ADOPTION OF ADVANCED POWER GENERATION TECHNOLOGIES TO CONTRIBUTE TO SEGMENTAL GROWTH
  • 11.5 BURNER MANAGEMENT SYSTEMS
    INCREASING COMPLEXITY OF INDUSTRIAL PROCESSES AND NEED FOR RELIABLE SYSTEMS TO PREVENT HAZARDOUS EVENTS TO DRIVE MARKET
  • 11.6 HIGH INTEGRITY PRESSURE PROTECTION SYSTEMS
    RISING DEMAND FOR RELIABLE SAFETY SOLUTIONS FOR PERSONNEL AND ASSET PROTECTION IN HIGH-PRESSURE ENVIRONMENTS TO SPUR SEGMENTAL GROWTH
  • 11.7 DISTRIBUTED CONTROL SYSTEMS
    RISING NEED FOR PROCESS OPTIMIZATION, AUTOMATION, AND SAFETY ACROSS VARIOUS INDUSTRIES TO FUEL SEGMENTAL GROWTH
  • 11.8 SUPERVISORY CONTROL & DATA ACQUISITION SYSTEMS
    INCREASING NEED TO IMPROVE OPERATIONAL EFFICIENCY AND REAL-TIME MONITORING OF CRITICAL INFRASTRUCTURE TO DRIVE MARKET
FUNCTIONAL SAFETY MARKET, BY INDUSTRY
145
  • 12.1 INTRODUCTION
  • 12.2 OIL & GAS
    UPSTREAM
    - Growing emphasis on optimizing exploration, drilling, and extraction processes to bolster segmental growth
    MIDSTREAM
    - Increasing focus on pipeline maintenance to avoid cracking and bursting to fuel segmental growth
    DOWNSTREAM
    - Rising need to address challenges associated with refining, marketing, and distributing end products to drive market
  • 12.3 POWER GENERATION
    GROWING FOCUS ON ENERGY EFFICIENCY AND PRODUCTION OPTIMIZATION TO CONTRIBUTE TO SEGMENTAL GROWTH
  • 12.4 CHEMICALS
    RISING EMPHASIS ON COST REDUCTION AND TRANSPORTATION IMPROVEMENT TO FOSTER SEGMENTAL GROWTH
  • 12.5 FOOD & BEVERAGES
    GROWING AWARENESS ABOUT PENALTIES FOR NON-ADHERENCE TO SAFETY STANDARDS TO AUGMENT SEGMENTAL GROWTH
  • 12.6 WATER & WASTEWATER TREATMENT
    INCREASING ADOPTION OF SAFETY SOLUTIONS TO SAFEGUARD PERSONNEL AND PLANT ENVIRONMENTS FROM SYSTEM FAILURES TO DRIVE MARKET
  • 12.7 PHARMACEUTICALS
    GROWING FOCUS ON PREVENTING POTENTIAL HAZARDS AND ENSURING MACHINE SAFETY TO BOOST SEGMENTAL GROWTH
  • 12.8 METALS & MINING
    RISING IMPLEMENTATION OF STRINGENT SAFETY REGULATIONS TO CONTRIBUTE TO SEGMENTAL GROWTH
  • 12.9 AUTOMOTIVE
    INCREASING PREFERENCE FOR AUTONOMOUS VEHICLES TO ACCELERATE SEGMENTAL GROWTH
  • 12.10 AEROSPACE
    MOUNTING DEMAND FOR INCREASINGLY ADVANCED, AUTONOMOUS, AND INTERCONNECTED SYSTEMS TO FUEL SEGMENTAL GROWTH
  • 12.11 RAILWAYS
    INCREASING DEPLOYMENT OF SAFETY DEVICES TO MONITOR AND CONTROL SENSORS TO AUGMENT SEGMENTAL GROWTH
  • 12.12 MEDICAL
    RISING ADOPTION OF SAFETY SOLUTIONS TO CONTROL MANUFACTURING PROCESSES TO CONTRIBUTE TO SEGMENTAL GROWTH
  • 12.13 OTHER INDUSTRIES
FUNCTIONAL SAFETY MARKET, BY REGION
173
  • 13.1 INTRODUCTION
  • 13.2 EUROPE
    MACROECONOMIC OUTLOOK FOR EUROPE
    GERMANY
    - Increasing deployment of Industry 4.0 to automate manufacturing operations to drive market
    UK
    - Increasing commitment to maintaining safe operations in oil & gas sector to spur market growth
    FRANCE
    - Rising concern about safety of chemical plants to augment market growth
    REST OF EUROPE
  • 13.3 NORTH AMERICA
    MACROECONOMIC OUTLOOK FOR NORTH AMERICA
    US
    - Rising implementation of industrial safety standards and guidelines to foster market growth
    CANADA
    - Growing emphasis on maintaining safety and minimizing emissions in oil & gas sector to boost market growth
    MEXICO
    - Increasing production of petroleum and other liquids to contribute to market growth
  • 13.4 ASIA PACIFIC
    MACROECONOMIC OUTLOOK FOR ASIA PACIFIC
    CHINA
    - Flourishing manufacturing sector and electric vehicle adoption to boost market growth
    JAPAN
    - Rising emphasis on implementing smart factory systems to augment market growth
    INDIA
    - Increasing focus on electricity projects to contribute to market growth
    SOUTH KOREA
    - Rising implementation of stringent safety measures at workplace to prevent industrial accidents to drive market
    REST OF ASIA PACIFIC
  • 13.5 ROW
    MACROECONOMIC OUTLOOK FOR ROW
    MIDDLE EAST
    - Rising oil and gas exploration activities to contribute to market growth
    - GCC countries
    - Rest of Middle East
    AFRICA
    - Thriving power, chemicals, and mining industries to bolster market growth
    SOUTH AMERICA
    - Increased adoption of automation solutions in industries to fuel market growth
COMPETITIVE LANDSCAPE
201
  • 14.1 OVERVIEW
  • 14.2 KEY PLAYER STRATEGIES/RIGHT TO WIN, 2022–2024
  • 14.3 REVENUE ANALYSIS, 2019–2023
  • 14.4 MARKET SHARE ANALYSIS, 2023
  • 14.5 COMPANY VALUATION AND FINANCIAL METRICS, 2024
  • 14.6 PRODUCT COMPARISON
  • 14.7 COMPANY EVALUATION MATRIX: KEY PLAYERS, 2023
    STARS
    EMERGING LEADERS
    PERVASIVE PLAYERS
    PARTICIPANTS
    COMPANY FOOTPRINT: KEY PLAYERS, 2023
    - Company footprint
    - Region footprint
    - Industry footprint
    - Device footprint
    - System footprint
  • 14.8 COMPANY EVALUATION MATRIX: STARTUPS/SMES, 2023
    PROGRESSIVE COMPANIES
    RESPONSIVE COMPANIES
    DYNAMIC COMPANIES
    STARTING BLOCKS
    COMPETITIVE BENCHMARKING: STARTUPS/SMES, 2023
    - Detailed list of key startups/SMEs
    - Competitive benchmarking of key startups/SMEs
  • 14.9 COMPETITIVE SCENARIO
    PRODUCT LAUNCHES
    DEALS
    EXPANSIONS
    OTHER DEVELOPMENTS
COMPANY PROFILES
224
  • 15.1 KEY PLAYERS
    SCHNEIDER ELECTRIC
    - Business overview
    - Products/Solutions/Services offered
    - Recent developments
    - MnM view
    ABB
    - Business overview
    - Products/Solutions/Services offered
    - Recent developments
    - MnM view
    HONEYWELL INTERNATIONAL INC.
    - Business overview
    - Products/Solutions/Services offered
    - Recent developments
    - MnM view
    EMERSON ELECTRIC CO.
    - Business overview
    - Products/Solutions/Services offered
    - Recent developments
    - MnM view
    ROCKWELL AUTOMATION
    - Business overview
    - Products/Solutions/Services offered
    - Recent developments
    - MnM view
    YOKOGAWA ELECTRIC CORPORATION
    - Business overview
    - Products/Solutions/Services offered
    - Recent developments
    HIMA
    - Business overview
    - Products/Solutions/Services offered
    - Recent developments
    GENERAL ELECTRIC COMPANY
    - Business overview
    - Products/Solutions/Services offered
    OMRON CORPORATION
    - Business overview
    - Products/Solutions/Services offered
    SIEMENS
    - Business overview
    - Products/Solutions/Services offered
    JOHNSON CONTROLS INC.
    - Business overview
    - Products/Solutions/Services offered
    - Recent developments
    DEKRA
    - Business overview
    - Products/Solutions/Services offered
    - Recent developments
    TÜV RHEINLAND
    - Business overview
    - Products/Solutions/Services offered
    - Recent developments
    BALLUFF GMBH
    - Business overview
    - Products/Solutions/Services offered
    ENDRESS+HAUSER GROUP SERVICES AG
    - Business overview
    - Products/Solutions/Services offered
    - Recent developments
  • 15.2 OTHER KEY PLAYERS
    SLB
    VELAN INC.
    PALADON SYSTEMS S.R.L.
    INTERTEK GROUP PLC
    SGS GENERAL SURVEILLANCE COMPANY SA.
    WEIDMÜLLER INTERFACE GMBH & CO. KG
    SMC CORPORATION
    TEXAS INSTRUMENTS INCORPORATED
    WITTENSTEIN HIGH INTEGRITY SYSTEMS LTD
    IMAGINATION TECHNOLOGIES
APPENDIX
284
  • 16.1 INSIGHTS FROM INDUSTRY EXPERTS
  • 16.2 DISCUSSION GUIDE
  • 16.3 KNOWLEDGESTORE: MARKETSANDMARKETS’ SUBSCRIPTION PORTAL
  • 16.4 CUSTOMIZATION OPTIONS
  • 16.5 RELATED REPORTS
  • 16.6 AUTHOR DETAILS
LIST OF TABLES
 
  • TABLE 1 FUNCTIONAL SAFETY MARKET: RISK ANALYSIS
  • TABLE 2 INDICATIVE PRICING OF FUNCTIONAL SAFETY SOLUTIONS OFFERED BY KEY PLAYERS, BY DEVICE, 2023 (USD)
  • TABLE 3 INDICATIVE PRICING OF FUNCTIONAL SAFETY SOLUTIONS, 2023 (USD)
  • TABLE 4 AVERAGE SELLING PRICE TREND OF FUNCTIONAL SAFETY SOLUTIONS, BY DEVICE, 2020–2023 (USD THOUSAND)
  • TABLE 5 ROLE OF COMPANIES IN FUNCTIONAL SAFETY ECOSYSTEM
  • TABLE 6 LIST OF MAJOR PATENTS, 2021–2023
  • TABLE 7 IMPORT DATA FOR HS CODE 8481-COMPLIANT PRODUCTS, BY COUNTRY, 2019–2023 (USD MILLION)
  • TABLE 8 EXPORT DATA FOR HS CODE 8481-COMPLIANT PRODUCTS, BY COUNTRY, 2019–2023 (USD MILLION)
  • TABLE 9 LIST OF KEY CONFERENCES & EVENTS, 2025–2026
  • TABLE 10 NORTH AMERICA: LIST OF REGULATORY BODIES, GOVERNMENT AGENCIES, AND OTHER ORGANIZATIONS
  • TABLE 11 EUROPE: LIST OF REGULATORY BODIES, GOVERNMENT AGENCIES, AND OTHER ORGANIZATIONS
  • TABLE 12 ASIA PACIFIC: LIST OF REGULATORY BODIES, GOVERNMENT AGENCIES, AND OTHER ORGANIZATIONS
  • TABLE 13 ROW: LIST OF REGULATORY BODIES, GOVERNMENT AGENCIES, AND OTHER ORGANIZATIONS
  • TABLE 14 STANDARDS FOR FUNCTIONAL SAFETY DEVICES
  • TABLE 15 PORTER’S FIVE FORCES ANALYSIS
  • TABLE 16 INFLUENCE OF STAKEHOLDERS ON BUYING PROCESS FOR TOP 3 INDUSTRIES
  • TABLE 17 KEY BUYING CRITERIA FOR TOP 3 INDUSTRIES
  • TABLE 18 FUNCTIONAL SAFETY MARKET, BY APPLICATION, 2020–2023 (USD MILLION)
  • TABLE 19 MARKET, BY APPLICATION, 2024–2029 (USD MILLION)
  • TABLE 20 ROBOTIC: FUNCTIONAL SAFETY MARKET, BY ROBOT TYPE, 2020–2023 (USD MILLION)
  • TABLE 21 ROBOTIC: MARKET, BY ROBOT TYPE, 2024–2029 (USD MILLION)
  • TABLE 22 FUNCTIONAL SAFETY MARKET, BY DEVICE, 2020–2023 (USD MILLION)
  • TABLE 23 MARKET, BY DEVICE, 2024–2029 (USD MILLION)
  • TABLE 24 MARKET, BY DEVICE, 2020–2023 (THOUSAND UNITS)
  • TABLE 25 MARKET, BY DEVICE, 2024–2029 (THOUSAND UNITS)
  • TABLE 26 SAFETY SENSORS: FUNCTIONAL SAFETY MARKET, BY SYSTEM, 2020–2023 (USD MILLION)
  • TABLE 27 SAFETY SENSORS: MARKET, BY SYSTEM, 2024–2029 (USD MILLION)
  • TABLE 28 SAFETY CONTROLLERS/MODULES/RELAYS: FUNCTIONAL SAFETY MARKET, BY SYSTEM, 2020–2023 (USD MILLION)
  • TABLE 29 SAFETY CONTROLLERS/MODULES/RELAYS: MARKET, BY SYSTEM, 2024–2029 (USD MILLION)
  • TABLE 30 PROGRAMMABLE SAFETY SYSTEMS: FUNCTIONAL SAFETY MARKET, BY SYSTEM, 2020–2023 (USD MILLION)
  • TABLE 31 PROGRAMMABLE SAFETY SYSTEMS: MARKET, BY SYSTEM, 2024–2029 (USD MILLION)
  • TABLE 32 SAFETY SWITCHES: FUNCTIONAL SAFETY MARKET, BY SYSTEM, 2020–2023 (USD MILLION)
  • TABLE 33 SAFETY SWITCHES: MARKET, BY SYSTEM, 2024–2029 (USD MILLION)
  • TABLE 34 VALVES: FUNCTIONAL SAFETY MARKET, BY SYSTEM, 2020–2023 (USD MILLION)
  • TABLE 35 VALVES: MARKET, BY SYSTEM, 2024–2029 (USD MILLION)
  • TABLE 36 ACTUATORS: FUNCTIONAL SAFETY MARKET, BY SYSTEM, 2020–2023 (USD MILLION)
  • TABLE 37 ACTUATORS: MARKET, BY SYSTEM, 2024–2029 (USD MILLION)
  • TABLE 38 THREE COMMON TYPES OF EMERGENCY STOP DEVICES
  • TABLE 39 EMERGENCY STOP DEVICES: FUNCTIONAL SAFETY MARKET, BY SYSTEM, 2020–2023 (USD MILLION)
  • TABLE 40 EMERGENCY STOP DEVICES: MARKET, BY SYSTEM, 2024–2029 (USD MILLION)
  • TABLE 41 OTHER DEVICES: FUNCTIONAL SAFETY MARKET, BY SYSTEM, 2020–2023 (USD MILLION)
  • TABLE 42 OTHER DEVICES: MARKET, BY SYSTEM, 2024–2029 (USD MILLION)
  • TABLE 43 FUNCTIONAL SAFETY MARKET, BY SERVICE, 2020–2023 (USD MILLION)
  • TABLE 44 MARKET, BY SERVICE, 2024–2029 (USD MILLION)
  • TABLE 45 MARKET, BY SYSTEM, 2020–2023 (USD MILLION)
  • TABLE 46 MARKET, BY SYSTEM, 2024–2029 (USD MILLION)
  • TABLE 47 EMERGENCY SHUTDOWN SYSTEMS: FUNCTIONAL SAFETY MARKET, BY DEVICE, 2020–2023 (USD MILLION)
  • TABLE 48 EMERGENCY SHUTDOWN SYSTEMS: MARKET, BY DEVICE, 2024–2029 (USD MILLION)
  • TABLE 49 EMERGENCY SHUTDOWN SYSTEMS: MARKET, BY INDUSTRY, 2020–2023 (USD MILLION)
  • TABLE 50 EMERGENCY SHUTDOWN SYSTEMS: MARKET, BY INDUSTRY, 2024–2029 (USD MILLION)
  • TABLE 51 EMERGENCY SHUTDOWN SYSTEMS: MARKET, BY REGION, 2020–2023 (USD MILLION)
  • TABLE 52 EMERGENCY SHUTDOWN SYSTEMS: MARKET, BY REGION, 2024–2029 (USD MILLION)
  • TABLE 53 FIRE & GAS MONITORING CONTROL SYSTEMS: FUNCTIONAL SAFETY MARKET, BY DEVICE, 2020–2023 (USD MILLION)
  • TABLE 54 FIRE & GAS MONITORING CONTROL SYSTEMS: MARKET, BY DEVICE, 2024–2029 (USD MILLION)
  • TABLE 55 FIRE & GAS MONITORING CONTROL SYSTEMS: MARKET, BY INDUSTRY, 2020–2023 (USD MILLION)
  • TABLE 56 FIRE & GAS MONITORING CONTROL SYSTEMS: MARKET, BY INDUSTRY, 2024–2029 (USD MILLION)
  • TABLE 57 FIRE & GAS MONITORING CONTROL SYSTEMS: MARKET, BY REGION, 2020–2023 (USD MILLION)
  • TABLE 58 FIRE & GAS MONITORING CONTROL SYSTEMS: MARKET, BY REGION, 2024–2029 (USD MILLION)
  • TABLE 59 TURBOMACHINERY CONTROL SYSTEMS: FUNCTIONAL SAFETY MARKET, BY DEVICE, 2020–2023 (USD MILLION)
  • TABLE 60 TURBOMACHINERY CONTROL SYSTEMS: MARKET, BY DEVICE, 2024–2029 (USD MILLION)
  • TABLE 61 TURBOMACHINERY CONTROL SYSTEMS: MARKET, BY INDUSTRY, 2020–2023 (USD MILLION)
  • TABLE 62 TURBOMACHINERY CONTROL SYSTEMS: MARKET, BY INDUSTRY, 2024–2029 (USD MILLION)
  • TABLE 63 TURBOMACHINERY CONTROL SYSTEMS: MARKET, BY REGION, 2020–2023 (USD MILLION)
  • TABLE 64 TURBOMACHINERY CONTROL SYSTEMS: MARKET, BY REGION, 2024–2029 (USD MILLION)
  • TABLE 65 BURNER MANAGEMENT SYSTEMS: FUNCTIONAL SAFETY MARKET, BY DEVICE, 2020–2023 (USD MILLION)
  • TABLE 66 BURNER MANAGEMENT SYSTEMS: MARKET, BY DEVICE, 2024–2029 (USD MILLION)
  • TABLE 67 BURNER MANAGEMENT SYSTEMS: MARKET, BY INDUSTRY, 2020–2023 (USD MILLION)
  • TABLE 68 BURNER MANAGEMENT SYSTEMS: MARKET, BY INDUSTRY, 2024–2029 (USD MILLION)
  • TABLE 69 BURNER MANAGEMENT SYSTEMS: MARKET, BY REGION, 2020–2023 (USD MILLION)
  • TABLE 70 BURNER MANAGEMENT SYSTEMS: MARKET, BY REGION, 2024–2029 (USD MILLION)
  • TABLE 71 HIGH INTEGRITY PRESSURE PROTECTION SYSTEMS: FUNCTIONAL SAFETY MARKET, BY DEVICE, 2020–2023 (USD MILLION)
  • TABLE 72 HIGH INTEGRITY PRESSURE PROTECTION SYSTEMS: MARKET, BY DEVICE, 2024–2029 (USD MILLION)
  • TABLE 73 HIGH INTEGRITY PRESSURE PROTECTION SYSTEMS: MARKET, BY INDUSTRY, 2020–2023 (USD MILLION)
  • TABLE 74 HIGH INTEGRITY PRESSURE PROTECTION SYSTEMS: MARKET, BY INDUSTRY, 2024–2029 (USD MILLION)
  • TABLE 75 HIGH INTEGRITY PRESSURE PROTECTION SYSTEMS: MARKET, BY REGION, 2020–2023 (USD MILLION)
  • TABLE 76 HIGH INTEGRITY PRESSURE PROTECTION SYSTEMS: MARKET, BY REGION, 2024–2029 (USD MILLION)
  • TABLE 77 DISTRIBUTED CONTROL SYSTEMS: FUNCTIONAL SAFETY MARKET, BY DEVICE, 2020–2023 (USD MILLION)
  • TABLE 78 DISTRIBUTED CONTROL SYSTEMS: MARKET, BY DEVICE, 2024–2029 (USD MILLION)
  • TABLE 79 DISTRIBUTED CONTROL SYSTEMS: MARKET, BY INDUSTRY, 2020–2023 (USD MILLION)
  • TABLE 80 DISTRIBUTED CONTROL SYSTEMS: MARKET, BY INDUSTRY, 2024–2029 (USD MILLION)
  • TABLE 81 DISTRIBUTED CONTROL SYSTEMS: MARKET, BY REGION, 2020–2023 (USD MILLION)
  • TABLE 82 DISTRIBUTED CONTROL SYSTEMS: MARKET, BY REGION, 2024–2029 (USD MILLION)
  • TABLE 83 SUPERVISORY CONTROL & DATA ACQUISITION SYSTEMS: FUNCTIONAL SAFETY MARKET, BY DEVICE, 2020–2023 (USD MILLION)
  • TABLE 84 SUPERVISORY CONTROL & DATA ACQUISITION SYSTEMS: MARKET, BY DEVICE, 2024–2029 (USD MILLION)
  • TABLE 85 SUPERVISORY CONTROL & DATA ACQUISITION SYSTEMS: MARKET, BY INDUSTRY, 2020–2023 (USD MILLION)
  • TABLE 86 SUPERVISORY CONTROL & DATA ACQUISITION SYSTEMS: MARKET, BY INDUSTRY, 2024–2029 (USD MILLION)
  • TABLE 87 SUPERVISORY CONTROL & DATA ACQUISITION SYSTEMS: MARKET, BY REGION, 2020–2023 (USD MILLION)
  • TABLE 88 SUPERVISORY CONTROL & DATA ACQUISITION SYSTEMS: MARKET, BY REGION, 2024–2029 (USD MILLION)
  • TABLE 89 FUNCTIONAL SAFETY MARKET, BY INDUSTRY, 2020–2023 (USD MILLION)
  • TABLE 90 MARKET, BY INDUSTRY, 2024–2029 (USD MILLION)
  • TABLE 91 OIL & GAS: FUNCTIONAL SAFETY MARKET, BY STREAM, 2020–2023 (USD MILLION)
  • TABLE 92 OIL & GAS: MARKET, BY STREAM, 2024–2029 (USD MILLION)
  • TABLE 93 OIL & GAS: MARKET, BY SYSTEM, 2020–2023 (USD MILLION)
  • TABLE 94 OIL & GAS: MARKET, BY SYSTEM, 2024–2029 (USD MILLION)
  • TABLE 95 OIL & GAS: MARKET, BY REGION, 2020–2023 (USD MILLION)
  • TABLE 96 OIL & GAS: MARKET, BY REGION, 2024–2029 (USD MILLION)
  • TABLE 97 POWER GENERATION: FUNCTIONAL SAFETY MARKET, BY SYSTEM, 2020–2023 (USD MILLION)
  • TABLE 98 POWER GENERATION: MARKET, BY SYSTEM, 2024–2029 (USD MILLION)
  • TABLE 99 POWER GENERATION: MARKET, BY REGION, 2020–2023 (USD MILLION)
  • TABLE 100 POWER GENERATION: FUNCTIONAL SAFETY MARKET, BY REGION, 2024–2029 (USD MILLION)
  • TABLE 101 CHEMICALS: FUNCTIONAL SAFETY MARKET, BY SYSTEM, 2020–2023 (USD MILLION)
  • TABLE 102 CHEMICALS: MARKET, BY SYSTEM, 2024–2029 (USD MILLION)
  • TABLE 103 CHEMICALS: FUNCTIONAL SAFETY MARKET, BY REGION, 2020–2023 (USD MILLION)
  • TABLE 104 CHEMICALS: FUNCTIONAL SAFETY MARKET, BY REGION, 2024–2029 (USD MILLION)
  • TABLE 105 FOOD & BEVERAGES: FUNCTIONAL SAFETY MARKET, BY SYSTEM, 2020–2023 (USD MILLION)
  • TABLE 106 FOOD & BEVERAGES: FUNCTIONAL SAFETY MARKET, BY SYSTEM, 2024–2029 (USD MILLION)
  • TABLE 107 FOOD & BEVERAGES: FUNCTIONAL SAFETY MARKET, BY REGION, 2020–2023 (USD MILLION)
  • TABLE 108 FOOD & BEVERAGES: FUNCTIONAL SAFETY MARKET, BY REGION, 2024–2029 (USD MILLION)
  • TABLE 109 WATER & WASTEWATER TREATMENT: FUNCTIONAL SAFETY MARKET, BY SYSTEM, 2020–2023 (USD MILLION)
  • TABLE 110 WATER & WASTEWATER TREATMENT: FUNCTIONAL SAFETY MARKET, BY SYSTEM, 2024–2029 (USD MILLION)
  • TABLE 111 WATER & WASTEWATER TREATMENT: FUNCTIONAL SAFETY MARKET, BY REGION, 2020–2023 (USD MILLION)
  • TABLE 112 WATER & WASTEWATER TREATMENT: FUNCTIONAL SAFETY MARKET, BY REGION, 2024–2029 (USD MILLION)
  • TABLE 113 PHARMACEUTICALS: FUNCTIONAL SAFETY MARKET, BY SYSTEM, 2020–2023 (USD MILLION)
  • TABLE 114 PHARMACEUTICALS: FUNCTIONAL SAFETY MARKET, BY SYSTEM, 2024–2029 (USD MILLION)
  • TABLE 115 PHARMACEUTICALS: FUNCTIONAL SAFETY MARKET, BY REGION, 2020–2023 (USD MILLION)
  • TABLE 116 PHARMACEUTICALS: FUNCTIONAL SAFETY MARKET, BY REGION, 2024–2029 (USD MILLION)
  • TABLE 117 METALS & MINING: FUNCTIONAL SAFETY MARKET, BY SYSTEM, 2020–2023 (USD MILLION)
  • TABLE 118 METALS & MINING: FUNCTIONAL SAFETY MARKET, BY SYSTEM, 2024–2029 (USD MILLION)
  • TABLE 119 METALS & MINING: FUNCTIONAL SAFETY MARKET, BY REGION, 2020–2023 (USD MILLION)
  • TABLE 120 METALS & MINING: FUNCTIONAL SAFETY MARKET, BY REGION, 2024–2029 (USD MILLION)
  • TABLE 121 AUTOMOTIVE: FUNCTIONAL SAFETY MARKET, BY SYSTEM, 2020–2023 (USD MILLION)
  • TABLE 122 AUTOMOTIVE: FUNCTIONAL SAFETY MARKET, BY SYSTEM, 2024–2029 (USD MILLION)
  • TABLE 123 AUTOMOTIVE: FUNCTIONAL SAFETY MARKET, BY REGION, 2020–2023 (USD MILLION)
  • TABLE 124 AUTOMOTIVE: FUNCTIONAL SAFETY MARKET, BY REGION, 2024–2029 (USD MILLION)
  • TABLE 125 AEROSPACE: FUNCTIONAL SAFETY MARKET, BY SYSTEM, 2020–2023 (USD MILLION)
  • TABLE 126 AEROSPACE: FUNCTIONAL SAFETY MARKET, BY SYSTEM, 2024–2029 (USD MILLION)
  • TABLE 127 AEROSPACE: FUNCTIONAL SAFETY MARKET, BY REGION, 2020–2023 (USD MILLION)
  • TABLE 128 AEROSPACE: FUNCTIONAL SAFETY MARKET, BY REGION, 2024–2029 (USD MILLION)
  • TABLE 129 RAILWAYS: FUNCTIONAL SAFETY MARKET, BY SYSTEM, 2020–2023 (USD MILLION)
  • TABLE 130 RAILWAYS: FUNCTIONAL SAFETY MARKET, BY SYSTEM, 2024–2029 (USD MILLION)
  • TABLE 131 RAILWAYS: FUNCTIONAL SAFETY MARKET, BY REGION, 2020–2023 (USD MILLION)
  • TABLE 132 RAILWAYS: FUNCTIONAL SAFETY MARKET, BY REGION, 2024–2029 (USD MILLION)
  • TABLE 133 MEDICAL: FUNCTIONAL SAFETY MARKET, BY SYSTEM, 2020–2023 (USD MILLION)
  • TABLE 134 MEDICAL: FUNCTIONAL SAFETY MARKET, BY SYSTEM, 2024–2029 (USD MILLION)
  • TABLE 135 MEDICAL: FUNCTIONAL SAFETY MARKET, BY REGION, 2020–2023 (USD MILLION)
  • TABLE 136 MEDICAL: FUNCTIONAL SAFETY MARKET, BY REGION, 2024–2029 (USD MILLION)
  • TABLE 137 OTHER INDUSTRIES: FUNCTIONAL SAFETY MARKET, BY SYSTEM, 2020–2023 (USD MILLION)
  • TABLE 138 OTHER INDUSTRIES: FUNCTIONAL SAFETY MARKET, BY SYSTEM, 2024–2029 (USD MILLION)
  • TABLE 139 OTHER INDUSTRIES: FUNCTIONAL SAFETY MARKET, BY REGION, 2020–2023 (USD MILLION)
  • TABLE 140 OTHER INDUSTRIES: FUNCTIONAL SAFETY MARKET, BY REGION, 2024–2029 (USD MILLION)
  • TABLE 141 FUNCTIONAL SAFETY MARKET, BY REGION, 2020–2023 (USD MILLION)
  • TABLE 142 FUNCTIONAL SAFETY MARKET, BY REGION, 2024–2029 (USD MILLION)
  • TABLE 143 EUROPE: FUNCTIONAL SAFETY MARKET, BY COUNTRY, 2020–2023 (USD MILLION)
  • TABLE 144 EUROPE: FUNCTIONAL SAFETY MARKET, BY COUNTRY, 2024–2029 (USD MILLION)
  • TABLE 145 EUROPE: FUNCTIONAL SAFETY MARKET, BY SYSTEM, 2020–2023 (USD MILLION)
  • TABLE 146 EUROPE: FUNCTIONAL SAFETY MARKET, BY SYSTEM, 2024–2029 (USD MILLION)
  • TABLE 147 EUROPE: FUNCTIONAL SAFETY MARKET, BY INDUSTRY, 2020–2023 (USD MILLION)
  • TABLE 148 EUROPE: FUNCTIONAL SAFETY MARKET, BY INDUSTRY, 2024–2029 (USD MILLION)
  • TABLE 149 NORTH AMERICA: FUNCTIONAL SAFETY MARKET, BY COUNTRY, 2020–2023 (USD MILLION)
  • TABLE 150 NORTH AMERICA: FUNCTIONAL SAFETY MARKET, BY COUNTRY, 2024–2029 (USD MILLION)
  • TABLE 151 NORTH AMERICA: FUNCTIONAL SAFETY MARKET, BY SYSTEM, 2020–2023 (USD MILLION)
  • TABLE 152 NORTH AMERICA: FUNCTIONAL SAFETY MARKET, BY SYSTEM, 2024–2029 (USD MILLION)
  • TABLE 153 NORTH AMERICA: FUNCTIONAL SAFETY MARKET, BY INDUSTRY, 2020–2023 (USD MILLION)
  • TABLE 154 NORTH AMERICA: FUNCTIONAL SAFETY MARKET, BY INDUSTRY, 2024–2029 (USD MILLION)
  • TABLE 155 ASIA PACIFIC: FUNCTIONAL SAFETY MARKET, BY COUNTRY, 2020–2023 (USD MILLION)
  • TABLE 156 ASIA PACIFIC: FUNCTIONAL SAFETY MARKET, BY COUNTRY, 2024–2029 (USD MILLION)
  • TABLE 157 ASIA PACIFIC: FUNCTIONAL SAFETY MARKET, BY SYSTEM, 2020–2023 (USD MILLION)
  • TABLE 158 ASIA PACIFIC: FUNCTIONAL SAFETY MARKET, BY SYSTEM, 2024–2029 (USD MILLION)
  • TABLE 159 ASIA PACIFIC: FUNCTIONAL SAFETY MARKET, BY INDUSTRY, 2020–2023 (USD MILLION)
  • TABLE 160 ASIA PACIFIC: FUNCTIONAL SAFETY MARKET, BY INDUSTRY, 2024–2029 (USD MILLION)
  • TABLE 161 ROW: FUNCTIONAL SAFETY MARKET, BY REGION, 2020–2023 (USD MILLION)
  • TABLE 162 ROW: FUNCTIONAL SAFETY MARKET, BY REGION, 2024–2029 (USD MILLION)
  • TABLE 163 MIDDLE EAST: FUNCTIONAL SAFETY MARKET, BY COUNTRY, 2020–2023 (USD MILLION)
  • TABLE 164 MIDDLE EAST: FUNCTIONAL SAFETY MARKET, BY COUNTRY, 2024–2029 (USD MILLION)
  • TABLE 165 ROW: FUNCTIONAL SAFETY MARKET, BY SYSTEM, 2020–2023 (USD MILLION)
  • TABLE 166 ROW: FUNCTIONAL SAFETY MARKET, BY SYSTEM, 2024–2029 (USD MILLION)
  • TABLE 167 ROW: FUNCTIONAL SAFETY MARKET, BY INDUSTRY, 2020–2023 (USD MILLION)
  • TABLE 168 ROW: FUNCTIONAL SAFETY MARKET, BY INDUSTRY, 2024–2029 (USD MILLION)
  • TABLE 169 FUNCTIONAL SAFETY MARKET: OVERVIEW OF STRATEGIES ADOPTED BY KEY PLAYERS, JANUARY 2022–SEPTEMBER 2024
  • TABLE 170 FUNCTIONAL SAFETY MARKET: DEGREE OF COMPETITION, 2023
  • TABLE 171 FUNCTIONAL SAFETY MARKET: REGION FOOTPRINT
  • TABLE 172 FUNCTIONAL SAFETY MARKET: INDUSTRY FOOTPRINT
  • TABLE 173 FUNCTIONAL SAFETY MARKET: DEVICE FOOTPRINT
  • TABLE 174 FUNCTIONAL SAFETY MARKET: SYSTEM FOOTPRINT
  • TABLE 175 FUNCTIONAL SAFETY MARKET: DETAILED LIST OF KEY STARTUPS/SMES
  • TABLE 176 FUNCTIONAL SAFETY MARKET: COMPETITIVE BENCHMARKING OF KEY STARTUPS/SMES
  • TABLE 177 FUNCTIONAL SAFETY MARKET: PRODUCT LAUNCHES, JANUARY 2022–SEPTEMBER 2024
  • TABLE 178 FUNCTIONAL SAFETY MARKET: DEALS, JANUARY 2022–SEPTEMBER 2024
  • TABLE 179 FUNCTIONAL SAFETY MARKET: EXPANSIONS, JANUARY 2022–SEPTEMBER 2024
  • TABLE 180 FUNCTIONAL SAFETY MARKET: OTHER DEVELOPMENTS, JANUARY 2022–SEPTEMBER 2024
  • TABLE 181 SCHNEIDER ELECTRIC: COMPANY OVERVIEW
  • TABLE 182 SCHNEIDER ELECTRIC: PRODUCTS/SOLUTIONS/SERVICES OFFERED
  • TABLE 183 SCHNEIDER ELECTRIC: PRODUCT LAUNCHES
  • TABLE 184 ABB: COMPANY OVERVIEW
  • TABLE 185 ABB: PRODUCTS/SOLUTIONS/SERVICES OFFERED
  • TABLE 186 ABB: PRODUCT LAUNCHES
  • TABLE 187 ABB: DEALS
  • TABLE 188 HONEYWELL INTERNATIONAL INC.: COMPANY OVERVIEW
  • TABLE 189 HONEYWELL INTERNATIONAL INC.: PRODUCTS/SOLUTIONS/SERVICES OFFERED
  • TABLE 190 HONEYWELL INTERNATIONAL INC.: PRODUCT LAUNCHES
  • TABLE 191 HONEYWELL INTERNATIONAL INC.: EXPANSIONS
  • TABLE 192 EMERSON ELECTRIC CO.: COMPANY OVERVIEW
  • TABLE 193 EMERSON ELECTRIC CO.: PRODUCTS/SOLUTIONS/SERVICES OFFERED
  • TABLE 194 EMERSON ELECTRIC CO.: PRODUCT LAUNCHES
  • TABLE 195 ROCKWELL AUTOMATION: COMPANY OVERVIEW
  • TABLE 196 ROCKWELL AUTOMATION: PRODUCTS/SOLUTIONS/SERVICES OFFERED
  • TABLE 197 ROCKWELL AUTOMATION: PRODUCT LAUNCHES
  • TABLE 198 YOKOGAWA ELECTRIC CORPORATION: COMPANY OVERVIEW
  • TABLE 199 YOKOGAWA ELECTRIC CORPORATION: PRODUCTS/SOLUTIONS/SERVICES OFFERED
  • TABLE 200 YOKOGAWA ELECTRIC CORPORATION: PRODUCT LAUNCHES
  • TABLE 201 YOKOGAWA ELECTRIC CORPORATION: OTHER DEVELOPMENTS
  • TABLE 202 HIMA: COMPANY OVERVIEW
  • TABLE 203 HIMA: PRODUCTS/SOLUTIONS/SERVICES OFFERED
  • TABLE 204 HIMA: PRODUCT LAUNCHES
  • TABLE 205 GENERAL ELECTRIC COMPANY: COMPANY OVERVIEW
  • TABLE 206 GENERAL ELECTRIC COMPANY: PRODUCTS/SOLUTIONS/SERVICES OFFERED
  • TABLE 207 OMRON CORPORATION: COMPANY OVERVIEW
  • TABLE 208 OMRON CORPORATION: PRODUCTS/SOLUTIONS/SERVICES OFFERED
  • TABLE 209 SIEMENS: COMPANY OVERVIEW
  • TABLE 210 SIEMENS: PRODUCTS/SOLUTIONS/SERVICES OFFERED
  • TABLE 211 JOHNSON CONTROLS INC.: COMPANY OVERVIEW
  • TABLE 212 JOHNSON CONTROLS INC.: PRODUCTS/SOLUTIONS/SERVICES OFFERED
  • TABLE 213 JOHNSON CONTROLS INC.: PRODUCT LAUNCHES
  • TABLE 214 JOHNSON CONTROLS INC.: EXPANSIONS
  • TABLE 215 DEKRA: COMPANY OVERVIEW
  • TABLE 216 DEKRA: PRODUCTS/SOLUTIONS/SERVICES OFFERED
  • TABLE 217 DEKRA: OTHER DEVELOPMENTS
  • TABLE 218 TÜV RHEINLAND: COMPANY OVERVIEW
  • TABLE 219 TÜV RHEINLAND: PRODUCTS/SOLUTIONS/SERVICES OFFERED
  • TABLE 220 TÜV RHEINLAND: DEALS
  • TABLE 221 BALLUFF GMBH: COMPANY OVERVIEW
  • TABLE 222 BALLUFF GMBH: PRODUCTS/SOLUTIONS/SERVICES OFFERED
  • TABLE 223 ENDRESS+HAUSER GROUP SERVICES AG: COMPANY OVERVIEW
  • TABLE 224 ENDRESS+HAUSER GROUP SERVICES AG: PRODUCTS/SOLUTIONS/SERVICES OFFERED
  • TABLE 225 ENDRESS+HAUSER GROUP SERVICES AG: DEALS
LIST OF FIGURES
 
  • FIGURE 1 FUNCTIONAL SAFETY MARKET: RESEARCH DESIGN
  • FIGURE 2 FUNCTIONAL SAFETY MARKET: BOTTOM-UP APPROACH
  • FIGURE 3 FUNCTIONAL SAFETY MARKET: TOP-DOWN APPROACH
  • FIGURE 4 FUNCTIONAL SAFETY MARKET SIZE ESTIMATION METHODOLOGY (SUPPLY SIDE)
  • FIGURE 5 FUNCTIONAL SAFETY MARKET: DATA TRIANGULATION
  • FIGURE 6 FUNCTIONAL SAFETY MARKET: RESEARCH ASSUMPTIONS
  • FIGURE 7 FUNCTIONAL SAFETY MARKET, 2020–2029 (USD MILLION)
  • FIGURE 8 PROGRAMMABLE SAFETY SYSTEMS SEGMENT TO RECORD HIGHEST CAGR IN FUNCTIONAL SAFETY MARKET DURING FORECAST PERIOD
  • FIGURE 9 EMERGENCY SHUTDOWN SYSTEMS SEGMENT TO HOLD LARGEST MARKET SHARE IN 2024
  • FIGURE 10 DESIGN, ENGINEERING & MAINTENANCE SEGMENT TO HOLD LARGEST MARKET SHARE IN 2029
  • FIGURE 11 NON-ROBOTIC SEGMENT ACCOUNTED FOR LARGER MARKET SHARE IN 2023
  • FIGURE 12 OIL & GAS SEGMENT TO DOMINATE FUNCTIONAL SAFETY MARKET BETWEEN 2024 AND 2029
  • FIGURE 13 ASIA PACIFIC TO EXHIBIT HIGHEST CAGR IN FUNCTIONAL SAFETY MARKET FROM 2024 TO 2029
  • FIGURE 14 RISING IMPLEMENTATION OF STRICT MANDATES AND SAFETY REGULATIONS TO FUEL MARKET GROWTH DURING FORECAST PERIOD
  • FIGURE 15 SAFETY SENSORS TO CAPTURE LARGEST MARKET SHARE FROM 2024 TO 2029
  • FIGURE 16 FIRE & GAS MONITORING CONTROL SYSTEMS SEGMENT TO REGISTER HIGHEST CAGR FROM 2024 TO 2029
  • FIGURE 17 OIL & GAS SEGMENT TO CAPTURE LARGEST SHARE OF FUNCTIONAL SAFETY MARKET IN 2029
  • FIGURE 18 EUROPE TO DOMINATE FUNCTIONAL SAFETY MARKET DURING FORECAST PERIOD
  • FIGURE 19 CHINA TO EXHIBIT HIGHEST CAGR IN GLOBAL FUNCTIONAL SAFETY MARKET FROM 2024 TO 2029
  • FIGURE 20 DRIVERS, RESTRAINTS, OPPORTUNITIES, AND CHALLENGES
  • FIGURE 21 IMPACT ANALYSIS: DRIVERS
  • FIGURE 22 IMPACT ANALYSIS: RESTRAINTS
  • FIGURE 23 IMPACT ANALYSIS: OPPORTUNITIES
  • FIGURE 24 IMPACT ANALYSIS: CHALLENGES
  • FIGURE 25 TRENDS/DISRUPTIONS IMPACTING CUSTOMER BUSINESS
  • FIGURE 26 PROCESS FLOW ANALYSIS
  • FIGURE 27 AVERAGE SELLING PRICE TREND OF FUNCTIONAL SAFETY SOLUTIONS OFFERED BY KEY PLAYERS, BY DEVICE, 2023
  • FIGURE 28 AVERAGE SELLING PRICE TREND OF FUNCTIONAL SAFETY SOLUTIONS, BY DEVICE, 2020–2023
  • FIGURE 29 AVERAGE SELLING PRICE TREND OF FUNCTIONAL SAFETY SOLUTIONS, BY REGION, 2020–2023
  • FIGURE 30 SUPPLY CHAIN ANALYSIS
  • FIGURE 31 ECOSYSTEM ANALYSIS
  • FIGURE 32 PATENT APPLIED AND GRANTED, 2014–2023
  • FIGURE 33 IMPORT DATA FOR HS CODE 8481-COMPLIANT PRODUCTS FOR TOP 5 COUNTRIES, 2019−2023
  • FIGURE 34 EXPORT DATA FOR HS CODE 8481-COMPLIANT PRODUCTS FOR TOP 5 COUNTRIES, 2019−2023
  • FIGURE 35 INVESTMENT AND FUNDING SCENARIO, 2020–2024
  • FIGURE 36 PORTER’S FIVE FORCES ANALYSIS
  • FIGURE 37 INFLUENCE OF STAKEHOLDERS ON BUYING PROCESS FOR TOP 3 INDUSTRIES
  • FIGURE 38 KEY BUYING CRITERIA FOR TOP 3 INDUSTRIES
  • FIGURE 39 AI USE CASES
  • FIGURE 40 PERCENTAGE CONTRIBUTIONS OF SIL TYPES FOR FUNCTIONAL SAFETY SYSTEMS, 2023
  • FIGURE 41 PERCENTAGE CONTRIBUTION OF SALES CHANNELS OF FUNCTIONAL SAFETY, 2023
  • FIGURE 42 NON-ROBOTIC SEGMENT ACCOUNTED FOR LARGER SHARE OF FUNCTIONAL SAFETY MARKET IN 2023
  • FIGURE 43 FUNCTIONAL SAFETY MARKET, BY DEVICE
  • FIGURE 44 SAFETY SENSORS SEGMENT TO HOLD LARGEST SHARE OF FUNCTIONAL SAFETY MARKET IN 2024
  • FIGURE 45 FUNCTIONAL SAFETY MARKET, BY SERVICE
  • FIGURE 46 FUNCTIONAL SAFETY MARKET, BY SYSTEM
  • FIGURE 47 EMERGENCY SHUTDOWN SYSTEMS SEGMENT TO CAPTURE LARGEST SHARE OF FUNCTIONAL SAFETY MARKET IN 2029
  • FIGURE 48 FUNCTIONAL SAFETY MARKET, BY INDUSTRY
  • FIGURE 49 OIL & GAS SEGMENT TO HOLD LARGEST SHARE OF FUNCTIONAL SAFETY MARKET IN 2029
  • FIGURE 50 FUNCTIONAL SAFETY MARKET, BY REGION
  • FIGURE 51 EUROPE: FUNCTIONAL SAFETY MARKET SNAPSHOT
  • FIGURE 52 GERMANY TO REGISTER HIGHEST CAGR IN EUROPEAN FUNCTIONAL SAFETY MARKET DURING FORECAST PERIOD
  • FIGURE 53 NORTH AMERICA: FUNCTIONAL SAFETY MARKET SNAPSHOT
  • FIGURE 54 US TO ACCOUNT FOR LARGEST SHARE OF NORTH AMERICAN FUNCTIONAL SAFETY MARKET IN 2024
  • FIGURE 55 ASIA PACIFIC: FUNCTIONAL SAFETY MARKET SNAPSHOT
  • FIGURE 56 CHINA TO DOMINATE ASIA PACIFIC FUNCTIONAL SAFETY MARKET BETWEEN 2024 AND 2029
  • FIGURE 57 MIDDLE EAST TO CAPTURE LARGEST SHARE OF ROW FUNCTIONAL SAFETY MARKET IN 2029
  • FIGURE 58 FUNCTIONAL SAFETY MARKET: REVENUE ANALYSIS OF FIVE KEY PLAYERS, 2019–2023
  • FIGURE 59 MARKET SHARE ANALYSIS OF COMPANIES OFFERING FUNCTIONAL SAFETY SOLUTIONS, 2023
  • FIGURE 60 COMPANY VALUATION, 2024
  • FIGURE 61 FINANCIAL METRICS, 2024 (EV/EBITDA)
  • FIGURE 62 PRODUCT COMPARISON
  • FIGURE 63 FUNCTIONAL SAFETY MARKET: COMPANY EVALUATION MATRIX (KEY PLAYERS), 2023
  • FIGURE 64 FUNCTIONAL SAFETY MARKET: COMPANY FOOTPRINT
  • FIGURE 65 FUNCTIONAL SAFETY MARKET: COMPANY EVALUATION MATRIX (STARTUPS/SMES), 2023
  • FIGURE 66 SCHNEIDER ELECTRIC: COMPANY SNAPSHOT
  • FIGURE 67 ABB: COMPANY SNAPSHOT
  • FIGURE 68 HONEYWELL INTERNATIONAL INC.: COMPANY SNAPSHOT
  • FIGURE 69 EMERSON ELECTRIC CO.: COMPANY SNAPSHOT
  • FIGURE 70 ROCKWELL AUTOMATION: COMPANY SNAPSHOT
  • FIGURE 71 YOKOGAWA ELECTRIC CORPORATION: COMPANY SNAPSHOT
  • FIGURE 72 GENERAL ELECTRIC COMPANY: COMPANY SNAPSHOT
  • FIGURE 73 OMRON CORPORATION: COMPANY SNAPSHOT
  • FIGURE 74 SIEMENS: COMPANY SNAPSHOT
  • FIGURE 75 JOHNSON CONTROLS INC.: COMPANY SNAPSHOT
  • FIGURE 76 DEKRA: COMPANY SNAPSHOT
  • FIGURE 77 TÜV RHEINLAND: COMPANY SNAPSHOT
  • FIGURE 78 ENDRESS+HAUSER GROUP SERVICES AG: COMPANY SNAPSHOT


The study involved major activities in estimating the current market size for the functional safety market. Exhaustive secondary research was done to collect information on the functional safety industry. The next step was to validate these findings, assumptions, and sizing with industry experts across the value chain using primary research. Different approaches, such as top-down and bottom-up, were employed to estimate the total market size. After that, the market breakup and data triangulation procedures were used to estimate the market size of the segments and subsegments of the functional safety market.

Secondary Research

The market for the companies offering functional safety solutions is arrived at by secondary data available through paid and unpaid sources, analyzing the product portfolios of the major companies in the ecosystem, and rating the companies by their performance and quality. Various sources were referred to in the secondary research process to identify and collect information for this study. The secondary sources include annual reports, press releases, investor presentations of companies, white papers, journals, certified publications, and articles from recognized authors, directories, and databases. In the secondary research process, various secondary sources were referred to for identifying and collecting information related to the study. Secondary sources included annual reports, press releases, and investor presentations of blockchain vendors, forums, certified publications, and whitepapers. The secondary research was used to obtain critical information on the industry's value chain, the total pool of key players, market classification, and segmentation from the market and technology-oriented perspectives.

Primary Research

Extensive primary research has been conducted after understanding and analyzing the current scenario of the functional safety market through secondary research. Several primary interviews have been conducted with the key opinion leaders from the demand and supply sides across four main regions—North America, Europe, Asia Pacific, and the Rest of Europe. Approximately 25% of the primary interviews were conducted with the demand-side respondents, while approximately 75% were conducted with the supply-side respondents. The primary data has been collected through questionnaires, emails, and telephone interviews.

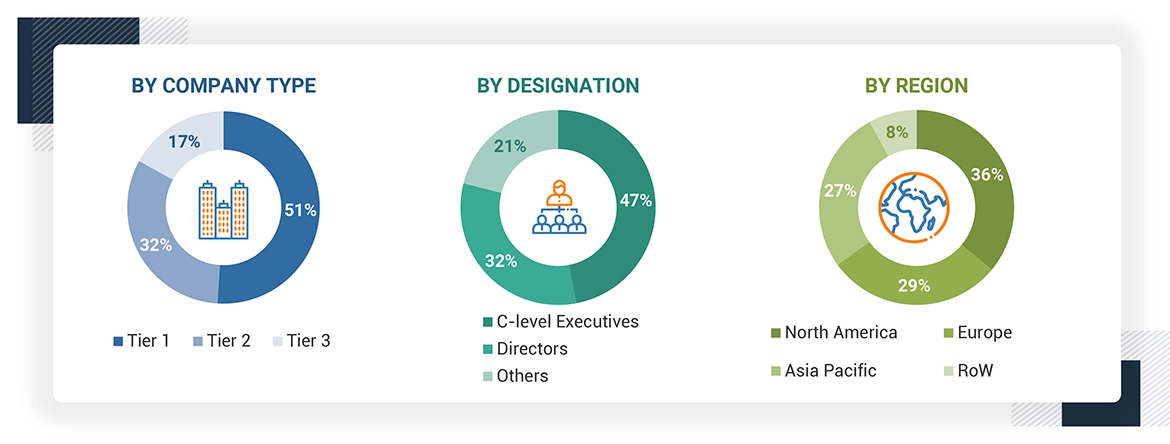
After interacting with industry experts, brief sessions were conducted with highly experienced independent consultants to reinforce the findings from our primary. This, along with the in-house subject matter experts’ opinions, has led us to the findings as described in the remainder of this report. The breakdown of primary respondents is as follows
Functional Safety Market Size, and Share

To know about the assumptions considered for the study, download the pdf brochure

Market Size Estimation

Both top-down and bottom-up approaches wete used to estimate and validate the total size of the functional safety market. These methods were also used extensively to estimate the size of various subsegments in the market. The research methodology used to estimate the market size includes the following:

Functional Safety Market : Top-Down and Bottom-Up Approach

Functional Safety Market Top Down and Bottom Up Approach

Data Triangulation

After arriving at the overall market size using the market size estimation processes as explained above, the market was split into several segments and subsegments. The data triangulation and market breakdown procedures were employed, wherever applicable, to complete the overall market engineering process and arrive at the exact statistics of each market segment and subsegment. The data was triangulated by studying various factors and trends from the demand and supply sides.

Market Definition

Functional safety systems are composed of sensors, logic solvers, switches, and final control elements, which are planned and installed to protect personnel, equipment, and the environment. Functional safety systems prevent or reduce the risk of abnormal process conditions that can occur in an industry. These systems are engineered to perform specific control functions to maintain safety in a process operation when unacceptable or dangerous conditions occur. There is an increased requirement for functional safety in industries to ensure uninterrupted operations, reliability, and safety of processes under all conditions.

Key Stakeholders

  • End users
  • Government bodies and policymakers
  • Industry-standard organizations, forums, alliances, and associations
  • Market research and consulting firms
  • Raw material suppliers and distributors
  • Research institutes and organizations
  • Original equipment manufacturers (OEMs)
  • Safety instrumented system suppliers
  • Testing, inspection, and certification providers
  • Distributors and resellers
  • Technology consultants

Report Objectives

  • To describe and forecast the functional safety market by system, device, service, application, and industry, in terms of value
  • To describe SIL types and sales channels of functional safety systems
  • To forecast the functional safety market, by device, in terms of volume
  • To forecast the market size for four main regions, namely North America, Europe, Asia Pacific, and the Rest of the World (RoW), in terms of value
  • To provide detailed information regarding drivers, restraints, opportunities, and challenges influencing the market growth
  • To provide a detailed overview of the supply chain of the functional safety ecosystem
  • To strategically analyze micromarkets1 with respect to individual growth trends, prospects, and contributions to the total market
  • To provide an ecosystem analysis, case study analysis, key conferences, patent analysis, trade analysis, technology analysis, average selling price (ASP) analysis, Porter’s five forces analysis, buying criteria, and regulations pertaining to the market
  • To track and analyze competitive developments undertaken by key players in the functional safety market
  • To profile key players and analyze their market share, core competencies2, and detailed competitive landscape for market leaders
  • To benchmark market players using the company evaluation matrix, analyzing players based on various parameters within broad business categories and product strategies.
  • To analyze strategies, such as product launches, acquisitions, partnerships, and expansions, adopted by the players in the functional safety market
  • To study the impact of AI/Gen AI on the market under study, along with the macroeconomic outlook for each region

Available Customizations

With the given market data, MarketsandMarkets offers customizations according to the specific requirements of companies. The following customization options are available for the report:

  • Detailed analysis and profiling of additional market players based on various blocks of the supply chain
 

Previous Versions of this Report

Functional Safety Market by System (ESD, F&G, TMC, BMS, HIPPS, SCADA, DCS), Device (Safety Sensors, Safety Controllers, Programmable Safety Systems, Safety Switches, Emergency Stop Devices), Sales Channel, Industry & Region - Global Forecast to 2027

Report Code SE 5286
Published in May, 2022, By MarketsandMarkets™

Functional Safety Market by Offering (Component (Safety Sensor, Programmable Safety System, Final Control Element), Services), System (ESD, TMC, F&G, HIPPS, BMS), Industry (Oil & Gas, Chemicals, Power Generation), and Region - Global Forecast to 2025

Report Code SE 5286
Published in Jul, 2020, By MarketsandMarkets™

Functional Safety Market by Offering (Component (Safety Sensor, Programmable Safety System, Final Control Element), Services), System (ESD, TMC, F&G, HIPPS, BMS), Industry (Oil & Gas, Chemicals, Power Generation), and Region - Global Forecast to 2024

Report Code SE 5286
Published in Nov, 2019, By MarketsandMarkets™

Functional Safety Market by Offering (Component (Safety Sensor, Programmable Safety System, Final Control Element), Services), System (ESD, TMC, F&G, HIPPS, BMS), Industry (Oil & Gas, Chemicals, Power Generation), and Region - Global Forecast to 2024

Report Code SE 5286
Published in May, 2017, By MarketsandMarkets™
"Our USP is "providing game-changing business opportunities reports with free customization" - so please feel free to provide us with your specific areas of interest / business challenges in much greater detail !!"

We appreciate your interest in this report. Once you fill out the form, you'll be immediately directed to an exclusive solution tailored to your needs. This high-value offering can help boost your revenue by 30% - a must-see opportunity for anyone looking to maximize growth.


By clicking the "Submit" button, you are agreeing to the Terms of Use and Privacy Policy.

Custom Market Research Services

We Will Customise The Research For You, In Case The Report Listed Above Does Not Meet With Your Requirements

Get 10% Free Customisation

Growth opportunities and latent adjacency in Functional Safety Market

DMCA.com Protection Status