Data Center Networking Market

Report Code TC 1493
Published in Aug, 2024, By MarketsandMarkets™
Download PDF

Choose License Type

Buy Report Now Inquire Before Buying

Data Center Networking Market by Hardware (Network Switches [Fixed, Modular], Routers), Fixed Switches (Managed, Unmanaged), Speed, Routers, Software (Network Management & Monitoring, NFV, Software-defined Networking) - Global Forecast to 2029

Overview

The global data center networking market size reached US$ 37.6 Billion in 2024. Looking forward, expects the market to reach US$ 64.2 Billion by 2029, exhibiting a growth rate (CAGR) of 11.3% during 2024-2029. Several technological developments and a move toward more efficient, scalable, and secure networking solutions mark the evolution of the data center networking market. The drivers of the evolution of the data center networking market have been substantial technological strides toward more efficient, scalable, and secure networking solutions. Traditionally, the data center has been characterized by traditional network architectures featuring hardware-centric design styles that were often bottlenecked and less scalable. The early 2000s, with the innovation of virtualization, became the first milestone; its paradigm shift to resource usage and flexibility was much more comprehensive. Against this backdrop, cloud computing growth raised the need for scalable networking infrastructure to handle workload and environmental changes. Data Center Networking includes computing and storage resources connected within a data center via networking equipment and software. These components provide data flow between servers, storage devices, and other critical parts, thereby providing reliable data handling, communication, and processing. The recent surge in demand could be due to the following key factors: the rise of Internet of Things devices, big data, and abnormal data traffic like video streaming and gaming applications; 5G deployment needing low latency and high bandwidth networking solutions; and a digitalization focus in many verticals that continues to drive investment into the making of modern data center strategies. The COVID-19 pandemic boosted remote work and online services, hence the need for efficient data center networking to facilitate smooth connectivity and reliable digital resource access; this had a market shift towards SDN, NFV, and edge computing—solution concepts designed to make activities like flexibility, scalability, and efficiency easy, and to meet new-age requirements.

Attractive Opportunities in the Data Center Networking Market

Asia Pacific

The market growth in Asia Pacific can be attributed to the rapid economic growth and urbanization which is leading to an increase in digital consumption and the proliferation of data

The proliferation of IoT devices and the need for real-time data processing at the edge drive demand for robust data center networking.

The shift towards cloud-based services has significantly increased the need for robust data center networking solutions

Acquisitions and product launches would offer lucrative opportunities for the market players in the next five years.

Rapid digitalization in emerging markets such as MEA and Latin America to offer significant opportunities.

Global Data Center Networking Market Dynamics

Driver: Increasing data traffic and bandwidth boosting the adoption of data center networking components

The acceleration of data traffic and bandwidth usage is vital to data center networking. Confronting radical growth in the usage of data-intensive applications and services, data centers must scale their networking infrastructure. Data center networks are under mounting pressure to support virtualized workloads and changing traffic patterns as businesses move to private and hybrid clouds—the rapid growth of east-west traffic between servers. As server densities and processing power rise, there's a growing need for better edge control and visibility. The technology landscape is increasing, and the need for network bandwidth is growing with it, where the speeds of 25/100Gbps and 100/400Gbps have become increasingly common in cloud data center networks; this requires the implementation of advanced networking technologies and scalable architectures to ensure seamless data transmission and optimal performance, thereby supporting the evolving needs of businesses in today's digital landscape.

Restraint: High CapEx and ongoing OpEx speeding down the growth of the data center networking market

The high cost of data center networking components, such as hardware purchases, maintenance, and upgrades, is a significant obstacle to progress in the networking market. Capital (CapEx) and operating expenses (OpEx) create financial barriers, making it difficult for organizations, especially smaller ones, to build or upgrade their networking infrastructure. High CapEx demands substantial upfront investments for building or purchasing data centers, investing in physical infrastructure, and procuring software licenses. According to secondary data, the costs associated with constructing the physical facility, buying and installing the necessary hardware, and setting up the cooling and power systems can range from USD 600 to USD1,100 per gross square foot or USD 7 million to USD 12 million per megawatt of commissioned IT load. High operating expenses, such as continuous costs for maintenance, energy use, and staffing, cause financial stress. To address these economic problems and elaborate innovation in the data center field with the help of advanced planning, efficiency improvements, and the hybrid deployment model, Balancing financial considerations with performance and scalability is crucial for the success of data center networking projects.


Opportunity: Growing adoption of virtualization technologies to optimize resource utilization

The development of virtualization technologies significantly enhances data center networking by boosting efficiency, scalability, and flexibility. Virtualization improves resource utilization and reduces costs by allowing multiple virtual machines to run on a single physical server. It also allows for dynamic resource allocation and supports software-defined networking (SDN) and network functions virtualization (NFV), simplifying network management and speeding up service delivery. It advances data center networking, making it more adaptable and cost-effective for modern businesses. VMware, a global leader in virtualization and cloud infrastructure, offers data center virtualization solutions to organizations worldwide. In VMware's own data center, they use their vSphere platform to create a virtual infrastructure; this has enabled VMware to consolidate multiple physical servers into a smaller number of more powerful servers, resulting in reduced power consumption, lower cooling costs, and improved overall performance.

Challenge: Need for robust data security measures

Data security has been one of the significant challenges in the data center networking industry. The most important task has crucially been protecting sensitive data against cyber attacks, particularly data breaches, DDoS attacks, and malware. Indeed, security measures have to be more elaborate to achieve this, and the regulatory demands must evolve with the technology. Strong security measures are key as attack methods get smarter and rules change. Implementing a solid security strategy supported by encryption technology for data protection, access monitoring, and intrusion detection/prevention systems requires continuous resources and management. Therefore, the comprehensive authority for mixing networks, including cloud technology and several such systems, makes it more complex. The security issue has become more challenging when administering it across diverse network environments, including cloud and hybrid infrastructures. As per the IMS Information Management Society, 32 percent of CIOs identified security as their priority. Further, with remote work becoming a norm and mobile devices everywhere, access control is a bigger hassle as organizations need to protect access to digital assets from various endpoints. Organizations, in particular, must implement measures that guarantee the security of sensitive data and manifest compliance by using audit trails and reporting features.

Global Data Center Networking Market Ecosystem Analysis

ECOSYSTEM This section highlights the data center networking ecosystem, comprising comprehensive and customized suits and solutions. The data center networking ecosystem varies depending on providers. Data center networking hardware and software providers offer solutions and services with different benefits and use cases.


Based on the switch type, the modular switches segment will grow at the highest CAGR during the forecast period.

Modular switches offer flexibility, scalability, and high-bandwidth capacity for handling demanding applications. It allows organizations to start with a base configuration and add modules progressively to support increasing network demands, allowing incremental upgrades and lessening the need for an expensive total system overhaul. Qualities such as adaptability, cost efficiency, and future-proofing make modular switches an excellent and competitive choice for the evolving data center environment. These switches offer advanced network management tools and enhanced display, control, and operation of complex network environments. As demand for reliable networking solutions grows with technological advances such as cloud computing, big data, and virtualization, modular switches are becoming the preferred solution for organizations.

Based on software, network management & monitoring software holds the largest share of the market during the forecast period.

Networking management and monitoring software are highly demanded due to the complicated and large data centers being built, which require advanced tools for optimal performance and security. These software solutions offer fault detection, performance analytics, and security monitoring features, enabling them to proactively address issues and optimize resource allocation. The growth of cloud computing, virtualization, and IoT has significantly increased the demand for network management solutions, addressing the challenges of poorly designed networks and making them less relevant. Firms are looking for the latest monitoring technology to secure the real-time vision of their network infrastructures, improving the decision-making process and enhancing operations. These tools assist compliance with regulatory standards while shielding networks against cyber threats owing to their continuous surveillance and rapid incident response. As data traffic increases daily and networking becomes complex, the need for networking management and monitoring software also boosts.

North America Region Holds the Largest Share of the Data Center Networking Market.

North America dominates the data center networking market mainly due to the increased adoption of high-performance computing and cloud services supported by the right policy frameworks and government support for data center infrastructure. The early implementation of advanced technologies such as artificial intelligence, big data, and the Internet of Things (IoT) in the region requires capable data center networks to handle large volumes of data. A well-established ecosystem of hardware and software vendors, service providers, and research institutions continuously innovates and enhances data center networking capabilities. The partnerships and collaborations among the leading firms in the industry also improve the implementation of sophisticated networking solutions. The major networking hardware suppliers, including Cisco Systems, Juniper network, and Arista network, are critical players in this development. The Federal Data Center Enhancement Act of 2022 focuses on protecting government data centers, defining the minimums for cybersecurity, availability, and resilience. According to Baxter, North America hosts 2,778 data center facilities with 211,760,587 square feet and 30,901 megawatts. Its primary markets consist of Northern Virginia, Dallas, Silicon Valley, and the rest, and Northern Virginia is globally acknowledged as the data center capital of the world.


Recent Developments of Data Center Networking Market industry

  • In March 2024, Arista Networks introduced Arista Etherlink, a standards-based Ethernet solution tailored to AI tasks. Using AI-optimized Arista EOS, Etherlink provides efficient AI infrastructure and makes its use possible from a few thousand to a hundred thousand XPUs in both one- and two-tier network topologies.
  • In March 2024, NVIDIA introduced the new X800 series of switches that includes the Quantum-X800 InfiniBand and Spectrum-X800 Ethernet switches; these switches provide 800Gb/s speeds and become class-leading for both AI and GPU computing. Many companies use these switches to improve AI, cloud, and high-performance computing capabilities.

Key Market Players

KEY PLAYERS IN THE Data Center Networking Market INCLUDE

  •  NVIDIA (US)
  • Arista Networks (US)
  • Dell (US)
  • Cisco (US)
  • Huawei (China)
  • VMware (US)
  • HPE (US)
  • Nokia (Finland)
  • Intel (US)
  • ZTE (China)
  • Extreme Networks (US)
  • Edgecore Networks (Taiwan)
  • Lenovo (China)
  • Juniper Networks (US)
  • F5 (US)
  • A10 (US)
  • Alcatel-Lucent Enterprise (France)
  • NETGEAR (US)
  • 6WIND (France)
  • H3C (China)
  • Kaloom Networks (Canada)
  • Pica8 (US)
  • Arrcus (US)
  • Larch Networks (Israel)
  • ZPE Systems (US)
  • Nuage Networks (US)
  • Netris (US)

Want to explore hidden markets that can drive new revenue in Data Center Networking Market?

Scope of the Report

Report Attribute Details
Market Size Available For Years 2019–2029
Base Year Considered 2023
Forecast Period 2024–2029
Forecast Units Value (USD Million/Billion/Thousands)
Segments Covered Offering (hardware, software, services) (hardware – network switches & routers, software – network management & monitoring software, software-defined networking, network function virtualization, other software, services – design & consulting, integration & deployment, support, and maintenance) end user (enterprises, cloud service provides, telecom service providers) and region
Regions Covered North America, Europe, Asia Pacific, Middle East & Africa, and Latin America
Companies Covered NVIDIA (US), Arista Networks (US), Dell (US), Cisco (US), Huawei (China), Broadcom (US), HPE (US), Nokia (Finland), Intel (US) ZTE (China), Extreme Networks (US), Edgecore Networks (Taiwan), Lenovo (China),  Juniper Networks (US), F5 (US), A10 (US), Alcatel-Lucent Enterprise (France), NETGEAR (US), 6WIND (France),  H3C (China), Kaloom Networks (Canada), Pica8 (US), Arrcus (US), Larch Networks (Israel), ZPE Systems (US), Nuage Networks (US), and Netris (US).


Key Questions Addressed by the Report

What is a Data center networking?
Data center networking refers to a technology that encompasses exceptional infrastructures and technologies to facilitate connectivity between computing, storage, and network resources in the data center facility; this refers to all hardware, software, protocols, and services giving life to communication and data transfer between servers and storage devices, as well as other constituting elements of the data center environment. Data center networking is a part of the IT infrastructure that sustains the state-of-the-art systems of cloud computing, virtualization, edge computing, and IoT. The collaboration enables organizations to manage and distribute IT resources effectively. It does not separate from the rest of the company's activities simultaneously; thus, it becomes dependable, secure, and high-performing.
Which country was the early adopter of data center networking solutions?
The US was at the initial stage of adopting data center networking solutions.
Which are the key vendors exploring data center networking solutions?
Some of the significant vendors offering data center networking solutions across the globe include NVIDIA (US), Arista Networks (US), Dell (US), Cisco (US), Huawei (China), Broadcom (US), HPE (US), Nokia (Finland), Intel (US), ZTE (China), Extreme Networks (US), Edgecore Networks (Taiwan), Lenovo (China), Juniper Networks (US), F5 (US), A10 (US), Alcatel-Lucent Enterprise (France), NETGEAR (US), 6WIND (France), H3C (China), Kaloom Networks (Canada), Pica8 (US), Arrcus (US), Larch Networks (Israel), ZPE Systems (US), Nuage Networks (US), and Netris (US).
What is the total CAGR recorded for the data center networking market from 2024 to 2029?
The data center networking market will record a CAGR of 11.3% from 2024-2029
What is the projected market value of the data center networking market?
The data center networking market will grow from USD 37.6 billion in 2024 to USD 64.2 billion by 2029 at a Compound Annual Growth Rate (CAGR) of 11.3% during the forecast period.
What are the significant trends in the data center networking market?
Industry trends in data center networking include software-defined networking and network function virtualization for flexibility, edge computing for low latency requirements, and high-speed networking, including 400G and 800G ethernet. Simultaneously, IoT and AI are performing continuous surveillance and prognosis for industrial applications, complex security-related issues using AI threats, and the zero-trust model. Furthermore, energy-saving policies will be integrated with an energy-conserving approach and Green data centers, with solid solutions for hybrid and multi-cloud networking across different IT environments.


Personalize This Research

  • Triangulate with your Own Data
  • Get Data as per your Format and Definition
  • Gain a Deeper Dive on a Specific Application, Geography, Customer or Competitor
  • Any level of Personalization
Request A Free Customisation

Let Us Help You

  • What are the Known and Unknown Adjacencies Impacting the Data Center Networking Market
  • What will your New Revenue Sources be?
  • Who will be your Top Customer; what will make them switch?
  • Defend your Market Share or Win Competitors
  • Get a Scorecard for Target Partners
Customized Workshop Request

Table of Contents

Exclusive indicates content/data unique to MarketsandMarkets and not available with any competitors.

TITLE
PAGE NO
INTRODUCTION
31
RESEARCH METHODOLOGY
36
EXECUTIVE SUMMARY
50
PREMIUM INSIGHTS
54
MARKET OVERVIEW AND INDUSTRY TRENDS
56
  • 5.1 INTRODUCTION
  • 5.2 MARKET DYNAMICS
    DRIVERS
    - Growth in adoption of SD-WAN solutions to enhance connectivity
    - Rise in adoption of cloud computing models to enhance scalability
    - Increase in data traffic and bandwidth
    - Growing digitalization and business automation practices
    RESTRAINTS
    - High CapEx and ongoing OpEx
    OPPORTUNITIES
    - Investments in data center networking technologies
    - Growing adoption of 5G for high-speed connectivity and performance
    - Rise in adoption of virtualization technologies to optimize resource utilization
    - Growth of IoT devices
    CHALLENGES
    - Need for robust data security measures
    - Lack of skilled workforce
    - Inefficient capacity planning to impact network performance
  • 5.3 CASE STUDY ANALYSIS
    SKANSKA ADOPTED CISCO SOLUTIONS FOR HYBRID CLOUD AND ENHANCED NETWORK EFFICIENCY
    EVEREST ISP’S NETWORK UPGRADED WITH JUNIPER SOLUTIONS
    BONÀREA AGRUPA’S DATA CENTER TRANSFORMED WITH HUAWEI’S SDN SOLUTION
    DUBAI WORLD TRADE CENTER UPGRADED NETWORK INFRASTRUCTURE WITH EXTREME NETWORKS
    CABLE AMOS DESIGNED ROBUST NETWORK WITH NETGEAR’S SWITCHES
  • 5.4 SUPPLY CHAIN ANALYSIS
  • 5.5 ECOSYSTEM
  • 5.6 TECHNOLOGY ANALYSIS
    KEY TECHNOLOGIES
    - Software-Defined Networking (SD-WAN)
    - Network Functions Virtualization (NFV)
    - Advanced network fabrics
    - Hyper-Converged Infrastructure (HCI)
    - Artificial Intelligence (AI) and Machine Learning (ML)
    COMPLEMENTARY TECHNOLOGIES
    - Cloud computing
    - Virtualization
    - Load balancing and Application Delivery Controllers (ADCs)
    ADJACENT TECHNOLOGIES
    - Security technologies
    - Data Center Infrastructure Management (DCIM)
    - High Performance Computing (HPC)
    - Edge computing
  • 5.7 PRICING ANALYSIS
    NETWORKING HARDWARE
    - Switches
    - Routers
    NETWORKING SOFTWARE
    - Network Operating Systems (NOS)
    - Network management software
    - Software-Defined Networking (SDN) controllers
    AVERAGE SELLING PRICE TREND OF KEY PLAYERS, BY SWITCH
    INDICATIVE PRICING ANALYSIS
  • 5.8 PATENT ANALYSIS
  • 5.9 PORTER’S FIVE FORCES ANALYSIS
    THREAT OF NEW ENTRANTS
    THREAT OF SUBSTITUTES
    BARGAINING POWER OF BUYERS
    BARGAINING POWER OF SUPPLIERS
    INTENSITY OF COMPETITIVE RIVALRY
  • 5.10 REGULATORY LANDSCAPE
    REGULATORY BODIES, GOVERNMENT AGENCIES, AND OTHER ORGANIZATIONS
    REGULATIONS
  • 5.11 TRENDS AND DISRUPTIONS IMPACTING CUSTOMERS’ BUSINESSES
  • 5.12 KEY STAKEHOLDERS AND BUYING CRITERIA
    KEY STAKEHOLDERS IN BUYING PROCESS
    BUYING CRITERIA
  • 5.13 BUSINESS MODEL ANALYSIS
    SUBSCRIPTION-BASED MODEL
    PAY-PER USER PRICING MODEL
    TIERED PRICING MODEL
    USAGE-BASED PRICING MODEL
  • 5.14 KEY CONFERENCES AND EVENTS, 2024–2025
  • 5.15 TRADE ANALYSIS
  • 5.16 INVESTMENT AND FUNDING SCENARIO
  • 5.17 TYPES OF DATA CENTER NETWORKS
    THREE-TIER DATA CENTER NETWORK
    FAT TREE DATA CENTER NETWORK
    DCELL DATA CENTER NETWORK
  • 5.18 IMPACT OF AI/GEN AI IN DATA CENTER NETWORKING MARKET
    INDUSTRY TRENDS: USE CASES
    - Use Case 1: Retail & eCommerce industry
    - Use Case 2: SaaS industry
    TOP CLIENTS ADAPTING TO AI/GEN AI
    - NVIDIA
    - Arista Networks
    NETWORKING SWITCHES REQUIRED IN AI DATA CENTERS
    - NVLink switches
    - InfiniBand fabric
DATA CENTER NETWORKING MARKET, BY OFFERING
93
  • 6.1 INTRODUCTION
    OFFERING: DATA CENTER NETWORKING MARKET DRIVERS
  • 6.2 HARDWARE
    RAPID INCREASE IN DATA TRAFFIC, WIDESPREAD ADOPTION OF IOT DEVICES, AND GROWING RELIANCE ON CLOUD SERVICES TO DRIVE MARKET
    NETWORK SWITCHES
    - Network Switches, by type
    - Fixed switches, by type
    - Network switches, by speed
    ROUTERS
  • 6.3 SOFTWARE
    SOFTWARE SOLUTIONS TO FACILITATE EFFICIENT CONFIGURATION, MONITORING, AND ORCHESTRATION OF NETWORK INFRASTRUCTURE
    NETWORK MANAGEMENT & MONITORING SOFTWARE
    - Network monitoring tools
    - Network configuration tools
    - Performance management tools
    SOFTWARE-DEFINED NETWORKING (SDN)
    - SDN controllers
    - SDN applications
    - SDN infrastructure
    NETWORK FUNCTION VIRTUALIZATION
    - Virtual routers
    - Virtual load balancers
    OTHER SOFTWARE
  • 6.4 SERVICES
    NEED FOR ENHANCING PERFORMANCE OF DATA CENTER NETWORKS TO FUEL DEMAND FOR SERVICES
    DESIGN & CONSULTING
    INTEGRATION & DEPLOYMENT
    SUPPORT & MAINTENANCE
DATA CENTER NETWORKING MARKET, BY END USER
119
  • 7.1 INTRODUCTION
    END USER: DATA CENTER NETWORKING MARKET DRIVERS
  • 7.2 ENTERPRISES
    NEED TO STREAMLINE NETWORK MANAGEMENT, IMPROVE AGILITY, AND SUPPORT DYNAMIC BUSINESS ENVIRONMENTS TO DRIVE MARKET
  • 7.3 TELECOM SERVICE PROVIDERS
    TELECOM SERVICE PROVIDERS TO IMPROVE OPERATIONAL EFFICIENCY, REDUCE COSTS, AND DELIVER INNOVATIVE SERVICES
  • 7.4 CLOUD SERVICE PROVIDERS
    NEED FOR SCALABILITY TO HANDLE FLUCTUATING WORKLOADS, LOW-LATENCY CONNECTIVITY TO IMPROVE USER EXPERIENCE, AND COMPREHENSIVE SECURITY MEASURES TO PROTECT SENSITIVE DATA TO PROPEL MARKET
DATA CENTER NETWORKING MARKET, BY REGION
125
  • 8.1 INTRODUCTION
  • 8.2 NORTH AMERICA
    NORTH AMERICA: DATA CENTER NETWORKING MARKET DRIVERS
    NORTH AMERICA: MACROECONOMIC OUTLOOK
    US
    - High demand for digital services, technological innovation, and strategic infrastructure investments to drive market
    CANADA
    - Growing investments by cloud service providers in data center technologies to propel market
  • 8.3 EUROPE
    EUROPE: DATA CENTER NETWORKING MARKET DRIVERS
    EUROPE: MACROECONOMIC OUTLOOK
    UK
    - Adoption of wireless networking technology to fuel demand for data center networking solutions
    GERMANY
    - Growing focus on cybersecurity to safeguard data to foster market growth
    FRANCE
    - Growing adoption of cloud computing to accelerate market growth
    ITALY
    - Investment in connectivity technologies to drive market growth
    REST OF EUROPE
  • 8.4 ASIA PACIFIC
    ASIA PACIFIC: DATA CENTER NETWORKING MARKET DRIVERS
    ASIA PACIFIC: MACROECONOMIC OUTLOOK
    CHINA
    - Growing investments in underwater data center development to fuel market growth
    JAPAN
    - Strong government support for technological adoption to boost market growth
    INDIA
    - Digital growth with strong network and government support to foster demand for data center networking
    REST OF ASIA PACIFIC
  • 8.5 MIDDLE EAST & AFRICA
    MIDDLE EAST & AFRICA: DATA CENTER NETWORKING MARKET DRIVERS
    MIDDLE EAST & AFRICA: MACROECONOMIC OUTLOOK
    MIDDLE EAST
    - UAE
    - KSA
    - Kuwait
    - Bahrain
    - Rest of Middle Eastern countries
    AFRICA
    - Investments from foreign cloud providers to fuel adoption of data center networking solutions
  • 8.6 LATIN AMERICA
    LATIN AMERICA: DATA CENTER NETWORKING MARKET DRIVERS
    LATIN AMERICA: MACROECONOMIC OUTLOOK
    BRAZIL
    - Investments by global data center operators to fuel demand for data center networking solutions
    MEXICO
    - Increased demand for IT infrastructure and cloud services and adoption of emerging technologies to foster market growth
    REST OF LATIN AMERICA
COMPETITIVE LANDSCAPE
177
  • 9.1 OVERVIEW
  • 9.2 KEY PLAYER STRATEGIES/RIGHT TO WIN
  • 9.3 REVENUE ANALYSIS
  • 9.4 MARKET SHARE ANALYSIS
  • 9.5 COMPANY EVALUATION MATRIX: KEY PLAYERS, 2023
    STARS
    EMERGING LEADERS
    PERVASIVE PLAYERS
    PARTICIPANTS
    COMPANY FOOTPRINT: KEY PLAYERS, 2023
    - Company footprint
    - Regional footprint
    - Offering footprint
    - End-user footprint
  • 9.6 COMPANY EVALUATION MATRIX: START-UPS/SMES, 2023
    PROGRESSIVE COMPANIES
    RESPONSIVE COMPANIES
    DYNAMIC COMPANIES
    STARTING BLOCKS
    COMPETITIVE BENCHMARKING: START-UPS/SMES, 2023
  • 9.7 COMPETITIVE SCENARIO AND TRENDS
    PRODUCT LAUNCHES AND ENHANCEMENTS
    DEALS
  • 9.8 COMPANY VALUATION AND FINANCIAL METRICS
  • 9.9 BRAND/PRODUCT COMPARISON
COMPANY PROFILES
195
  • 10.1 INTRODUCTION
  • 10.2 MAJOR PLAYERS
    NVIDIA
    - Business overview
    - Products/Solutions/Services offered
    - Recent developments
    - MnM view
    ARISTA NETWORKS
    - Business overview
    - Products/Solutions/Services offered
    - Recent developments
    - MnM view
    DELL
    - Business overview
    - Products/Solutions/Services offered
    - Recent developments
    - MnM view
    CISCO
    - Business overview
    - Products/Solutions/Services offered
    - Recent developments
    - MnM view
    HUAWEI
    - Business overview
    - Products/Solutions/Services offered
    - Recent developments
    - MnM view
    BROADCOM
    - Business overview
    - Products/Solutions/Services offered
    - Recent developments
    INTEL
    - Business overview
    - Products/Solutions/Services offered
    - Recent developments
    HPE
    - Business overview
    - Products/Solutions/Services offered
    - Recent developments
    NOKIA
    - Business overview
    - Products/Solutions/Services offered
    - Recent developments
    ZTE
    - Business overview
    - Products/Solutions/Services offered
    - Recent developments
    JUNIPER NETWORKS
    EXTREME NETWORKS
    EDGECORE NETWORKS
    F5
    A10
    LENOVO
    ALCATEL-LUCENT
    6WIND
    NETGEAR
    H3C
  • 10.3 OTHER PLAYERS
    ZPE SYSTEMS
    PICA8
    ARRCUS
    KALOOM NETWORKS
    NUAGE NETWORKS
    NETRIS
    LARCH NETWORKS
ADJACENT MARKETS
257
  • 11.1 INTRODUCTION
    RELATED MARKETS
  • 11.2 DATA CENTER SOLUTIONS MARKET
  • 11.3 SOFTWARE-DEFINED NETWORKING MARKET
  • 11.4 NETWORK FUNCTION VIRTUALIZATION MARKET
APPENDIX
268
  • 12.1 DISCUSSION GUIDE
  • 12.2 KNOWLEDGESTORE: MARKETSANDMARKETS’ SUBSCRIPTION PORTAL
  • 12.3 CUSTOMIZATION OPTIONS
  • 12.4 RELATED REPORTS
  • 12.5 AUTHOR DETAILS
LIST OF TABLES
 
  • TABLE 1 USD EXCHANGE RATES, 2019–2023
  • TABLE 2 FACTOR ANALYSIS
  • TABLE 3 DATA CENTER NETWORKING MARKET: ECOSYSTEM
  • TABLE 4 AVERAGE SELLING PRICES FOR TOP THREE DATA CENTER SWITCH TYPES, 2021–2023 (USD)
  • TABLE 5 INDICATIVE PRICING LEVELS OF DATA CENTER NETWORKING SOLUTIONS, BY HARDWARE (USD)
  • TABLE 6 TOP 10 PATENT OWNERS (US) IN LAST 10 YEARS
  • TABLE 7 PORTER’S FIVE FORCES IMPACT ON DATA CENTER NETWORKING MARKET
  • TABLE 8 NORTH AMERICA: LIST OF REGULATORY BODIES, GOVERNMENT AGENCIES, AND OTHER ORGANIZATIONS
  • TABLE 9 EUROPE: LIST OF REGULATORY BODIES, GOVERNMENT AGENCIES, AND OTHER ORGANIZATIONS
  • TABLE 10 ASIA PACIFIC: LIST OF REGULATORY BODIES, GOVERNMENT AGENCIES, AND OTHER ORGANIZATIONS
  • TABLE 11 ROW: LIST OF REGULATORY BODIES, GOVERNMENT AGENCIES, AND OTHER ORGANIZATIONS
  • TABLE 12 REGULATIONS, BY REGION
  • TABLE 13 INFLUENCE OF STAKEHOLDERS ON BUYING PROCESS FOR TOP THREE END USERS
  • TABLE 14 KEY BUYING CRITERIA FOR TOP THREE END USERS
  • TABLE 15 DATA CENTER NETWORKING MARKET: LIST OF KEY CONFERENCES AND EVENTS, 2024–2025
  • TABLE 16 IMPORT DATA, BY COUNTRY, 2019–2023 (USD MILLION)
  • TABLE 17 EXPORT DATA, BY COUNTRY, 2019–2023 (USD MILLION)
  • TABLE 18 DATA CENTER NETWORKING MARKET, BY OFFERING, 2019–2023 (USD MILLION)
  • TABLE 19 DATA CENTER NETWORKING MARKET, BY OFFERING, 2024–2029 (USD MILLION)
  • TABLE 20 MARKET, BY HARDWARE, 2019–2023 (USD MILLION)
  • TABLE 21 MARKET, BY HARDWARE, 2024–2029 (USD MILLION)
  • TABLE 22 MARKET, BY NETWORK SWITCH, 2019–2023 (USD MILLION)
  • TABLE 23 MARKET, BY NETWORK SWITCH, 2024–2029 (USD MILLION)
  • TABLE 24 NETWORK SWITCHES: MARKET, BY REGION, 2019–2023 (USD MILLION)
  • TABLE 25 NETWORK SWITCHES: MARKET, BY REGION, 2024–2029 (USD MILLION)
  • TABLE 26 FIXED SWITCHES: MARKET, BY REGION, 2019–2023 (USD MILLION)
  • TABLE 27 FIXED SWITCHES: MARKET, BY REGION, 2024–2029 (USD MILLION)
  • TABLE 28 MARKET, BY FIXED SWITCH, 2019–2023 (USD MILLION)
  • TABLE 29 MARKET, BY FIXED SWITCH, 2024–2029 (USD MILLION)
  • TABLE 30 MODULAR SWITCHES: MARKET, BY REGION, 2019–2023 (USD MILLION)
  • TABLE 31 MODULAR SWITCHES: MARKET, BY REGION, 2024–2029 (USD MILLION)
  • TABLE 32 MANAGED SWITCHES: MARKET, BY REGION, 2019–2023 (USD MILLION)
  • TABLE 33 MANAGED SWITCHES: MARKET, BY REGION, 2024–2029 (USD MILLION)
  • TABLE 34 UNMANAGED SWITCHES: MARKET, BY REGION, 2019–2023 (USD MILLION)
  • TABLE 35 UNMANAGED SWITCHES: MARKET, BY REGION, 2024–2029 (USD MILLION)
  • TABLE 36 MARKET, BY SWITCHES SPEED, 2019–2023 (USD MILLION)
  • TABLE 37 MARKET, BY SWITCHES SPEED, 2024–2029 (USD MILLION)
  • TABLE 38 MARKET, BY SWITCHES SPEED, 2023–2029 (THOUSAND UNITS)
  • TABLE 39 >1GBPS TO ≤ 10GBPS: MARKET, BY REGION, 2019–2023 (USD MILLION)
  • TABLE 40 >1GBPS TO ≤ 10GBPS: DATA CENTER NETWORKING MARKET, BY REGION, 2024–2029 (USD MILLION)
  • TABLE 41 >10 GBPS TO ≤ 40 GBPS: MARKET, BY REGION, 2019–2023 (USD MILLION)
  • TABLE 42 >10 GBPS TO ≤ 40 GBPS: MARKET, BY REGION, 2024–2029 (USD MILLION)
  • TABLE 43 >40 GBPS TO ≤ 100 GBPS: MARKET, BY REGION, 2019–2023 (USD MILLION)
  • TABLE 44 >40 GBPS TO ≤ 100 GBPS: MARKET, BY REGION, 2024–2029 (USD MILLION)
  • TABLE 45 >100 GBPS TO < 400 GBPS: MARKET, BY REGION, 2019–2023 (USD MILLION)
  • TABLE 46 >100 GBPS TO < 400 GBPS: MARKET, BY REGION, 2024–2029 (USD MILLION)
  • TABLE 47 400 GBPS AND ABOVE: MARKET, BY REGION, 2019–2023 (USD MILLION)
  • TABLE 48 400 GBPS AND ABOVE: MARKET, BY REGION, 2024–2029 (USD MILLION)
  • TABLE 49 MARKET, BY ROUTER, 2023–2029 (THOUSAND UNITS)
  • TABLE 50 ROUTERS: MARKET, BY REGION, 2019–2023 (USD MILLION)
  • TABLE 51 ROUTERS: MARKET, BY REGION, 2024–2029 (USD MILLION)
  • TABLE 52 DATA CENTER NETWORKING MARKET, BY SOFTWARE, 2019–2023 (USD MILLION)
  • TABLE 53 MARKET, BY SOFTWARE, 2024–2029 (USD MILLION)
  • TABLE 54 NETWORK MANAGEMENT & MONITORING SOFTWARE: MARKET, BY REGION, 2019–2023 (USD MILLION)
  • TABLE 55 NETWORK MANAGEMENT & MONITORING SOFTWARE: MARKET, BY REGION, 2024–2029 (USD MILLION)
  • TABLE 56 SOFTWARE-DEFINED NETWORKING: MARKET, BY REGION, 2019–2023 (USD MILLION)
  • TABLE 57 SOFTWARE-DEFINED NETWORKING: MARKET, BY REGION, 2024–2029 (USD MILLION)
  • TABLE 58 NETWORK FUNCTION VIRTUALIZATION: MARKET, BY REGION, 2019–2023 (USD MILLION)
  • TABLE 59 NETWORK FUNCTION VIRTUALIZATION: MARKET, BY REGION, 2024–2029 (USD MILLION)
  • TABLE 60 OTHER SOFTWARE: MARKET, BY REGION, 2019–2023 (USD MILLION)
  • TABLE 61 OTHER SOFTWARE: MARKET, BY REGION, 2024–2029 (USD MILLION)
  • TABLE 62 DATA CENTER NETWORKING MARKET, BY SERVICE, 2019–2023 (USD MILLION)
  • TABLE 63 MARKET, BY SERVICE, 2024–2029 (USD MILLION)
  • TABLE 64 DESIGN & CONSULTING: MARKET, BY REGION, 2019–2023 (USD MILLION)
  • TABLE 65 DESIGN & CONSULTING: MARKET, BY REGION, 2024–2029 (USD MILLION)
  • TABLE 66 INTEGRATION & DEPLOYMENT: MARKET, BY REGION, 2019–2023 (USD MILLION)
  • TABLE 67 INTEGRATION & DEPLOYMENT: MARKET, BY REGION, 2024–2029 (USD MILLION)
  • TABLE 68 SUPPORT & MAINTENANCE: MARKET, BY REGION, 2019–2023 (USD MILLION)
  • TABLE 69 SUPPORT & MAINTENANCE: MARKET, BY REGION, 2024–2029 (USD MILLION)
  • TABLE 70 MARKET, BY END USER, 2019–2023 (USD MILLION)
  • TABLE 71 MARKET, BY END USER, 2024–2029 (USD MILLION)
  • TABLE 72 ENTERPRISES: MARKET, BY REGION, 2019–2023 (USD MILLION)
  • TABLE 73 ENTERPRISES: MARKET, BY REGION, 2024–2029 (USD MILLION)
  • TABLE 74 TELECOM SERVICE PROVIDERS: MARKET, BY REGION, 2019–2023 (USD MILLION)
  • TABLE 75 TELECOM SERVICE PROVIDERS: MARKET, BY REGION, 2024–2029 (USD MILLION)
  • TABLE 76 CLOUD SERVICE PROVIDERS: MARKET, BY REGION, 2019–2023 (USD MILLION)
  • TABLE 77 CLOUD SERVICE PROVIDERS: MARKET, BY REGION, 2024–2029 (USD MILLION)
  • TABLE 78 DATA CENTER NETWORKING MARKET, BY REGION, 2019–2023 (USD MILLION)
  • TABLE 79 MARKET, BY REGION, 2024–2029 (USD MILLION)
  • TABLE 80 NORTH AMERICA: MARKET, BY OFFERING, 2019–2023 (USD MILLION)
  • TABLE 81 NORTH AMERICA: MARKET, BY OFFERING, 2024–2029 (USD MILLION)
  • TABLE 82 NORTH AMERICA: MARKET, BY HARDWARE, 2019–2023 (USD MILLION)
  • TABLE 83 NORTH AMERICA: MARKET, BY HARDWARE, 2024–2029 (USD MILLION)
  • TABLE 84 NORTH AMERICA: MARKET, BY NETWORK SWITCH, 2019–2023 (USD MILLION)
  • TABLE 85 NORTH AMERICA: MARKET, BY NETWORK SWITCH, 2024–2029 (USD MILLION)
  • TABLE 86 NORTH AMERICA: MARKET, BY FIXED SWITCH, 2019–2023 (USD MILLION)
  • TABLE 87 NORTH AMERICA: MARKET, BY FIXED SWITCH, 2024–2029 (USD MILLION)
  • TABLE 88 NORTH AMERICA: MARKET, BY SWITCHES SPEED, 2019–2023 (USD MILLION)
  • TABLE 89 NORTH AMERICA: MARKET, BY SWITCHES SPEED, 2024–2029 (USD MILLION)
  • TABLE 90 NORTH AMERICA: MARKET, BY SOFTWARE, 2019–2023 (USD MILLION)
  • TABLE 91 NORTH AMERICA: MARKET, BY SOFTWARE, 2024–2029 (USD MILLION)
  • TABLE 92 NORTH AMERICA: MARKET, BY SERVICE, 2019–2023 (USD MILLION)
  • TABLE 93 NORTH AMERICA: MARKET, BY SERVICE, 2024–2029 (USD MILLION)
  • TABLE 94 NORTH AMERICA: MARKET, BY END USER, 2019–2023 (USD MILLION)
  • TABLE 95 NORTH AMERICA: MARKET, BY END USER, 2024–2029 (USD MILLION)
  • TABLE 96 NORTH AMERICA: MARKET, BY COUNTRY, 2019–2023 (USD MILLION)
  • TABLE 97 NORTH AMERICA: DATA CENTER NETWORKING MARKET, BY COUNTRY, 2024–2029 (USD MILLION)
  • TABLE 98 US: MARKET, BY OFFERING, 2019–2023 (USD MILLION)
  • TABLE 99 US: MARKET, BY OFFERING, 2024–2029 (USD MILLION)
  • TABLE 100 CANADA: MARKET, BY OFFERING, 2019–2023 (USD MILLION)
  • TABLE 101 CANADA: MARKET, BY OFFERING, 2024–2029 (USD MILLION)
  • TABLE 102 EUROPE: MARKET, BY OFFERING, 2019–2023 (USD MILLION)
  • TABLE 103 EUROPE: MARKET, BY OFFERING, 2024–2029 (USD MILLION)
  • TABLE 104 EUROPE: MARKET, BY HARDWARE, 2019–2023 (USD MILLION)
  • TABLE 105 EUROPE: MARKET, BY HARDWARE, 2024–2029 (USD MILLION)
  • TABLE 106 EUROPE: MARKET, BY NETWORK SWITCH, 2019–2023 (USD MILLION)
  • TABLE 107 EUROPE: MARKET, BY NETWORK SWITCH, 2024–2029 (USD MILLION)
  • TABLE 108 EUROPE: MARKET, BY FIXED SWITCH, 2019–2023 (USD MILLION)
  • TABLE 109 EUROPE: DATA CENTER NETWORKING MARKET, BY FIXED SWITCH, 2024–2029 (USD MILLION)
  • TABLE 110 EUROPE: MARKET, BY SWITCHES SPEED, 2019–2023 (USD MILLION)
  • TABLE 111 EUROPE: MARKET, BY SWITCHES SPEED, 2024–2029 (USD MILLION)
  • TABLE 112 EUROPE: MARKET, BY SOFTWARE, 2019–2023 (USD MILLION)
  • TABLE 113 EUROPE: MARKET, BY SOFTWARE, 2024–2029 (USD MILLION)
  • TABLE 114 EUROPE: MARKET, BY SERVICE, 2019–2023 (USD MILLION)
  • TABLE 115 EUROPE: MARKET, BY SERVICE, 2024–2029 (USD MILLION)
  • TABLE 116 EUROPE: MARKET, BY END USER, 2019–2023 (USD MILLION)
  • TABLE 117 EUROPE: MARKET, BY END USER, 2024–2029 (USD MILLION)
  • TABLE 118 EUROPE: MARKET, BY COUNTRY, 2019–2023 (USD MILLION)
  • TABLE 119 EUROPE: MARKET, BY COUNTRY, 2024–2029 (USD MILLION)
  • TABLE 120 UK: DATA CENTER NETWORKING MARKET, BY OFFERING, 2019–2023 (USD MILLION)
  • TABLE 121 UK: MARKET, BY OFFERING, 2024–2029 (USD MILLION)
  • TABLE 122 GERMANY: MARKET, BY OFFERING, 2019–2023 (USD MILLION)
  • TABLE 123 GERMANY: MARKET, BY OFFERING, 2024–2029 (USD MILLION)
  • TABLE 124 FRANCE: MARKET, BY OFFERING, 2019–2023 (USD MILLION)
  • TABLE 125 FRANCE: MARKET, BY OFFERING, 2024–2029 (USD MILLION)
  • TABLE 126 ITALY: MARKET, BY OFFERING, 2019–2023 (USD MILLION)
  • TABLE 127 ITALY: MARKET, BY OFFERING, 2024–2029 (USD MILLION)
  • TABLE 128 REST OF EUROPE: MARKET, BY OFFERING, 2019–2023 (USD MILLION)
  • TABLE 129 REST OF EUROPE: MARKET, BY OFFERING, 2024–2029 (USD MILLION)
  • TABLE 130 ASIA PACIFIC: MARKET, BY OFFERING, 2019–2023 (USD MILLION)
  • TABLE 131 ASIA PACIFIC: MARKET, BY OFFERING, 2024–2029 (USD MILLION)
  • TABLE 132 ASIA PACIFIC: MARKET, BY HARDWARE, 2019–2023 (USD MILLION)
  • TABLE 133 ASIA PACIFIC: MARKET, BY HARDWARE, 2024–2029 (USD MILLION)
  • TABLE 134 ASIA PACIFIC: MARKET, BY NETWORK SWITCH, 2019–2023 (USD MILLION)
  • TABLE 135 ASIA PACIFIC: MARKET, BY NETWORK SWITCH, 2024–2029 (USD MILLION)
  • TABLE 136 ASIA PACIFIC: MARKET, BY FIXED SWITCH, 2019–2023 (USD MILLION)
  • TABLE 137 ASIA PACIFIC: MARKET, BY FIXED SWITCH, 2024–2029 (USD MILLION)
  • TABLE 138 ASIA PACIFIC: MARKET, BY SWITCHES SPEED, 2019–2023 (USD MILLION)
  • TABLE 139 ASIA PACIFIC: MARKET, BY SWITCHES SPEED, 2024–2029 (USD MILLION)
  • TABLE 140 ASIA PACIFIC: MARKET, BY SOFTWARE, 2019–2023 (USD MILLION)
  • TABLE 141 ASIA PACIFIC: DATA CENTER NETWORKING MARKET, BY SOFTWARE, 2024–2029 (USD MILLION)
  • TABLE 142 ASIA PACIFIC: MARKET, BY SERVICE, 2019–2023 (USD MILLION)
  • TABLE 143 ASIA PACIFIC: MARKET, BY SERVICE, 2024–2029 (USD MILLION)
  • TABLE 144 ASIA PACIFIC: MARKET, BY END USER, 2019–2023 (USD MILLION)
  • TABLE 145 ASIA PACIFIC: MARKET, BY END USER, 2024–2029 (USD MILLION)
  • TABLE 146 ASIA PACIFIC: MARKET, BY COUNTRY, 2019–2023 (USD MILLION)
  • TABLE 147 ASIA PACIFIC: MARKET, BY COUNTRY, 2024–2029 (USD MILLION)
  • TABLE 148 CHINA: MARKET, BY OFFERING, 2019–2023 (USD MILLION)
  • TABLE 149 CHINA: MARKET, BY OFFERING, 2024–2029 (USD MILLION)
  • TABLE 150 JAPAN: MARKET, BY OFFERING, 2019–2023 (USD MILLION)
  • TABLE 151 JAPAN: DATA CENTER NETWORKING MARKET, BY OFFERING, 2024–2029 (USD MILLION)
  • TABLE 152 INDIA: MARKET, BY OFFERING, 2019–2023 (USD MILLION)
  • TABLE 153 INDIA: MARKET, BY OFFERING, 2024–2029 (USD MILLION)
  • TABLE 154 REST OF ASIA PACIFIC: MARKET, BY OFFERING, 2019–2023 (USD MILLION)
  • TABLE 155 REST OF ASIA PACIFIC: MARKET, BY OFFERING, 2024–2029 (USD MILLION)
  • TABLE 156 MIDDLE EAST & AFRICA: MARKET, BY OFFERING, 2019–2023 (USD MILLION)
  • TABLE 157 MIDDLE EAST & AFRICA: MARKET, BY OFFERING, 2024–2029 (USD MILLION)
  • TABLE 158 MIDDLE EAST & AFRICA: MARKET, BY HARDWARE, 2019–2023 (USD MILLION)
  • TABLE 159 MIDDLE EAST & AFRICA: MARKET, BY HARDWARE, 2024–2029 (USD MILLION)
  • TABLE 160 MIDDLE EAST & AFRICA: MARKET, BY NETWORK SWITCH, 2019–2023 (USD MILLION)
  • TABLE 161 MIDDLE EAST & AFRICA-: MARKET, BY NETWORK SWITCH, 2024–2029 (USD MILLION)
  • TABLE 162 MIDDLE EAST & AFRICA: MARKET, BY FIXED SWITCH, 2019–2023 (USD MILLION)
  • TABLE 163 MIDDLE EAST & AFRICA: MARKET, BY FIXED SWITCH, 2024–2029 (USD MILLION)
  • TABLE 164 MIDDLE EAST & AFRICA: MARKET, BY SWITCHES SPEED, 2019–2023 (USD MILLION)
  • TABLE 165 MIDDLE EAST & AFRICA: DATA CENTER NETWORKING MARKET BY SWITCHES SPEED, 2024–2029 (USD MILLION)
  • TABLE 166 MIDDLE EAST & AFRICA: MARKET, BY SOFTWARE, 2019–2023 (USD MILLION)
  • TABLE 167 MIDDLE EAST & AFRICA: MARKET, BY SOFTWARE, 2024–2029 (USD MILLION)
  • TABLE 168 MIDDLE EAST & AFRICA: MARKET, BY SERVICE, 2019–2023 (USD MILLION)
  • TABLE 169 MIDDLE EAST & AFRICA: MARKET, BY SERVICE, 2024–2029 (USD MILLION)
  • TABLE 170 MIDDLE EAST & AFRICA: MARKET, BY END USER, 2019–2023 (USD MILLION)
  • TABLE 171 MIDDLE EAST & AFRICA: MARKET, BY END USER, 2024–2029 (USD MILLION)
  • TABLE 172 MIDDLE EAST & AFRICA: MARKET, BY REGION, 2019–2023 (USD MILLION)
  • TABLE 173 MIDDLE EAST & AFRICA: MARKET, BY REGION, 2024–2029 (USD MILLION)
  • TABLE 174 MIDDLE EAST : DATA CENTER NETWORKING MARKET, BY OFFERING, 2019–2023 (USD MILLION)
  • TABLE 175 MIDDLE EAST: MARKET, BY OFFERING, 2024–2029 (USD MILLION)
  • TABLE 176 MIDDLE EAST : MARKET, BY HARDWARE, 2019–2023 (USD MILLION)
  • TABLE 177 MIDDLE EAST : MARKET, BY HARDWARE, 2024–2029 (USD MILLION)
  • TABLE 178 MIDDLE EAST: MARKET, BY NETWORK SWITCH, 2019–2023 (USD MILLION)
  • TABLE 179 MIDDLE EAST -: MARKET, BY NETWORK SWITCH, 2024–2029 (USD MILLION)
  • TABLE 180 MIDDLE EAST: MARKET, BY FIXED SWITCH, 2019–2023 (USD MILLION)
  • TABLE 181 MIDDLE EAST: MARKET, BY FIXED SWITCH, 2024–2029 (USD MILLION)
  • TABLE 182 MIDDLE EAST: MARKET, BY SWITCHES SPEED, 2019–2023 (USD MILLION)
  • TABLE 183 MIDDLE EAST: MARKET, BY SWITCHES SPEED, 2024–2029 (USD MILLION)
  • TABLE 184 MIDDLE EAST: MARKET, BY SOFTWARE, 2019–2023 (USD MILLION)
  • TABLE 185 MIDDLE EAST: MARKET, BY SOFTWARE, 2024–2029 (USD MILLION)
  • TABLE 186 MIDDLE EAST: MARKET, BY SERVICE, 2019–2023 (USD MILLION)
  • TABLE 187 MIDDLE EAST: MARKET, BY SERVICE, 2024–2029 (USD MILLION)
  • TABLE 188 MIDDLE EAST: MARKET, BY END USER, 2019–2023 (USD MILLION)
  • TABLE 189 MIDDLE EAST: MARKET, BY END USER, 2024–2029 (USD MILLION)
  • TABLE 190 MIDDLE EAST: MARKET, BY COUNTRY, 2019–2023 (USD MILLION)
  • TABLE 191 MIDDLE EAST: MARKET, BY COUNTRY, 2024–2029 (USD MILLION)
  • TABLE 192 KSA: DATA CENTER NETWORKING MARKET, BY OFFERING, 2019–2023 (USD MILLION)
  • TABLE 193 KSA: MARKET, BY OFFERING, 2024–2029 (USD MILLION)
  • TABLE 194 AFRICA: MARKET, BY OFFERING, 2019–2023 (USD MILLION)
  • TABLE 195 AFRICA: MARKET, BY OFFERING, 2024–2029 (USD MILLION)
  • TABLE 196 LATIN AMERICA: MARKET, BY OFFERING, 2019–2023 (USD MILLION)
  • TABLE 197 LATIN AMERICA: MARKET, BY OFFERING, 2024–2029 (USD MILLION)
  • TABLE 198 LATIN AMERICA: MARKET, BY HARDWARE, 2019–2023 (USD MILLION)
  • TABLE 199 LATIN AMERICA: MARKET, BY HARDWARE, 2024–2029 (USD MILLION)
  • TABLE 200 LATIN AMERICA: DATA CENTER NETWORKING MARKET, BY NETWORK SWITCH, 2019–2023 (USD MILLION)
  • TABLE 201 LATIN AMERICA: DATA CENTER NETWORKING MARKET, BY NETWORK SWITCH, 2024–2029 (USD MILLION)
  • TABLE 202 LATIN AMERICA: DATA CENTER NETWORKING MARKET, BY FIXED SWITCH, 2019–2023 (USD MILLION)
  • TABLE 203 LATIN AMERICA: DATA CENTER NETWORKING MARKET, BY FIXED SWITCH, 2024–2029 (USD MILLION)
  • TABLE 204 LATIN AMERICA: DATA CENTER NETWORKING MARKET, BY SWITCHES SPEED, 2019–2023 (USD MILLION)
  • TABLE 205 LATIN AMERICA: DATA CENTER NETWORKING MARKET, BY SWITCHES SPEED, 2024–2029 (USD MILLION)
  • TABLE 206 LATIN AMERICA: DATA CENTER NETWORKING MARKET, BY SOFTWARE, 2019–2023 (USD MILLION)
  • TABLE 207 LATIN AMERICA: DATA CENTER NETWORKING MARKET, BY SOFTWARE, 2024–2029 (USD MILLION)
  • TABLE 208 LATIN AMERICA: DATA CENTER NETWORKING MARKET, BY SERVICE, 2019–2023 (USD MILLION)
  • TABLE 209 LATIN AMERICA: DATA CENTER NETWORKING MARKET, BY SERVICE, 2024–2029 (USD MILLION)
  • TABLE 210 LATIN AMERICA: DATA CENTER NETWORKING MARKET, BY END USER, 2019–2023 (USD MILLION)
  • TABLE 211 LATIN AMERICA: DATA CENTER NETWORKING MARKET, BY END USER, 2024–2029 (USD MILLION)
  • TABLE 212 LATIN AMERICA: DATA CENTER NETWORKING MARKET, BY COUNTRY, 2019–2023 (USD MILLION)
  • TABLE 213 LATIN AMERICA: DATA CENTER NETWORKING MARKET, BY COUNTRY, 2024–2029 (USD MILLION)
  • TABLE 214 BRAZIL: DATA CENTER NETWORKING MARKET, BY OFFERING, 2019–2023 (USD MILLION)
  • TABLE 215 BRAZIL: DATA CENTER NETWORKING MARKET, BY OFFERING, 2024–2029 (USD MILLION)
  • TABLE 216 MEXICO: DATA CENTER NETWORKING MARKET, BY OFFERING, 2019–2023 (USD MILLION)
  • TABLE 217 MEXICO: DATA CENTER NETWORKING MARKET, BY OFFERING, 2024–2029 (USD MILLION)
  • TABLE 218 REST OF LATIN AMERICA: DATA CENTER NETWORKING MARKET, BY OFFERING, 2019–2023 (USD MILLION)
  • TABLE 219 REST OF LATIN AMERICA: DATA CENTER NETWORKING MARKET, BY OFFERING, 2024–2029 (USD MILLION)
  • TABLE 220 OVERVIEW OF STRATEGIES BY KEY DATA CENTER NETWORKING VENDORS
  • TABLE 221 DATA CENTER NETWORKING MARKET: DEGREE OF COMPETITION
  • TABLE 222 REGIONAL FOOTPRINT, 2023
  • TABLE 223 OFFERING FOOTPRINT, 2023
  • TABLE 224 END-USER FOOTPRINT, 2023
  • TABLE 225 DATA CENTER NETWORKING MARKET: KEY START-UPS/SMES
  • TABLE 226 DATA CENTER NETWORKING MARKET: COMPETITIVE BENCHMARKING OF KEY START-UPS/SMES
  • TABLE 227 DATA CENTER NETWORKING MARKET: PRODUCT LAUNCHES AND ENHANCEMENTS, JUNE 2021–MAY 2024
  • TABLE 228 DATA CENTER NETWORKING MARKET: DEALS, AUGUST 2022–MARCH 2024
  • TABLE 229 NVIDIA: COMPANY OVERVIEW
  • TABLE 230 NVIDIA: PRODUCTS/SOLUTIONS/SERVICES OFFERED
  • TABLE 231 NVIDIA: PRODUCT LAUNCHES
  • TABLE 232 NVIDIA: DEALS
  • TABLE 233 ARISTA NETWORKS: COMPANY OVERVIEW
  • TABLE 234 ARISTA NETWORKS: PRODUCTS/SOLUTIONS/SERVICES OFFERED
  • TABLE 235 ARISTA NETWORKS: PRODUCT LAUNCHES AND ENHANCEMENTS
  • TABLE 236 ARISTA NETWORKS: DEALS
  • TABLE 237 DELL: COMPANY OVERVIEW
  • TABLE 238 DELL: PRODUCTS/SOLUTIONS/SERVICES OFFERED
  • TABLE 239 DELL: PRODUCT ENHANCEMENTS
  • TABLE 240 DELL: DEALS
  • TABLE 241 CISCO: COMPANY OVERVIEW
  • TABLE 242 CISCO: PRODUCTS/SOLUTIONS/SERVICES OFFERED
  • TABLE 243 CISCO: PRODUCT LAUNCHES
  • TABLE 244 CISCO: DEALS
  • TABLE 245 HUAWEI: COMPANY OVERVIEW
  • TABLE 246 HUAWEI: PRODUCTS/SOLUTIONS/SERVICES OFFERED
  • TABLE 247 HUAWEI: PRODUCT LAUNCHES AND ENHANCEMENTS
  • TABLE 248 HUAWEI: DEALS
  • TABLE 249 BROADCOM: COMPANY OVERVIEW
  • TABLE 250 BROADCOM: PRODUCTS/SOLUTIONS/SERVICES OFFERED
  • TABLE 251 BROADCOM: PRODUCT LAUNCHES AND ENHANCEMENTS
  • TABLE 252 BROADCOM: DEALS
  • TABLE 253 INTEL: COMPANY OVERVIEW
  • TABLE 254 INTEL: PRODUCTS/SOLUTIONS/SERVICES OFFERED
  • TABLE 255 INTEL: PRODUCT LAUNCHES
  • TABLE 256 HPE: COMPANY OVERVIEW
  • TABLE 257 HPE: PRODUCTS/SOLUTIONS/SERVICES OFFERED
  • TABLE 258 HPE: PRODUCT ENHANCEMENTS
  • TABLE 259 HPE: DEALS
  • TABLE 260 NOKIA: COMPANY OVERVIEW
  • TABLE 261 NOKIA: PRODUCTS/SOLUTIONS/SERVICES OFFERED
  • TABLE 262 NOKIA: DEALS
  • TABLE 263 ZTE: COMPANY OVERVIEW
  • TABLE 264 ZTE: PRODUCTS/SOLUTIONS/SERVICES OFFERED
  • TABLE 265 ZTE: PRODUCT ENHANCEMENTS
  • TABLE 266 ZTE: DEALS
  • TABLE 267 DATA CENTER SOLUTIONS MARKET, BY OFFERING, 2018–2022 (USD MILLION)
  • TABLE 268 DATA CENTER SOLUTIONS MARKET, BY OFFERING, 2023–2028 (USD MILLION)
  • TABLE 269 DATA CENTER SOLUTIONS MARKET, BY DATA CENTER TYPE, 2018–2022 (USD MILLION)
  • TABLE 270 DATA CENTER SOLUTIONS MARKET, BY DATA CENTER TYPE, 2023–2028 (USD MILLION)
  • TABLE 271 DATA CENTER SOLUTIONS MARKET, BY TIER TYPE, 2018–2022 (USD MILLION)
  • TABLE 272 DATA CENTER SOLUTIONS MARKET, BY TIER TYPE, 2023–2028 (USD MILLION)
  • TABLE 273 DATA CENTER SOLUTIONS MARKET, BY DATA CENTER SIZE, 2018–2022 (USD MILLION)
  • TABLE 274 DATA CENTER SOLUTIONS MARKET, BY DATA CENTER SIZE, 2023–2028 (USD MILLION)
  • TABLE 275 DATA CENTER SOLUTIONS MARKET, BY VERTICAL, 2018–2022 (USD MILLION)
  • TABLE 276 DATA CENTER SOLUTIONS MARKET, BY VERTICAL, 2023–2028 (USD MILLION)
  • TABLE 277 DATA CENTER SOLUTIONS MARKET, BY REGION, 2018–2022 (USD MILLION)
  • TABLE 278 DATA CENTER SOLUTIONS MARKET, BY REGION, 2023–2028 (USD MILLION)
  • TABLE 279 SOFTWARE-DEFINED NETWORKING MARKET, BY OFFERING, 2018–2022 (USD MILLION)
  • TABLE 280 SOFTWARE-DEFINED NETWORKING MARKET, BY OFFERING, 2023–2028 (USD MILLION)
  • TABLE 281 SOFTWARE-DEFINED NETWORKING MARKET, BY SDN TYPE, 2018–2022 (USD MILLION)
  • TABLE 282 SOFTWARE-DEFINED NETWORKING MARKET, BY SDN TYPE, 2023–2028 (USD MILLION)
  • TABLE 283 SOFTWARE-DEFINED NETWORKING MARKET, BY END USER, 2018–2022 (USD MILLION)
  • TABLE 284 SOFTWARE-DEFINED NETWORKING MARKET, BY END USER, 2023–2028 (USD MILLION)
  • TABLE 285 SOFTWARE-DEFINED NETWORKING MARKET, BY APPLICATION, 2018–2022 (USD MILLION)
  • TABLE 286 SOFTWARE-DEFINED NETWORKING MARKET, BY APPLICATION, 2023–2028 (USD MILLION)
  • TABLE 287 SOFTWARE-DEFINED NETWORKING MARKET, BY VERTICAL, 2018–2022 (USD MILLION)
  • TABLE 288 SOFTWARE-DEFINED NETWORKING MARKET, BY VERTICAL, 2023–2028 (USD MILLION)
  • TABLE 289 SOFTWARE-DEFINED NETWORKING MARKET, BY REGION, 2018–2022 (USD MILLION)
  • TABLE 290 SOFTWARE-DEFINED NETWORKING MARKET, BY REGION, 2023–2028 (USD MILLION)
  • TABLE 291 NETWORK FUNCTION VIRTUALIZATION MARKET, BY COMPONENT, 2017–2024 (USD MILLION)
  • TABLE 292 NETWORK FUNCTION VIRTUALIZATION MARKET, BY VIRTUALIZED NETWORK FUNCTION, 2017–2024 (USD MILLION)
  • TABLE 293 NETWORK FUNCTION VIRTUALIZATION MARKET, BY APPLICATION, 2017–2024 (USD MILLION)
  • TABLE 294 NETWORK FUNCTION VIRTUALIZATION MARKET, BY END USER, 2017–2024 (USD MILLION)
  • TABLE 295 ENTERPRISES: NETWORK FUNCTION VIRTUALIZATION MARKET, BY VERTICAL, 2017–2024 (USD MILLION)
  • TABLE 296 NETWORK FUNCTION VIRTUALIZATION MARKET, BY ENTERPRISE SIZE, 2017–2024 (USD MILLION)
  • TABLE 297 NETWORK FUNCTION VIRTUALIZATION MARKET, BY REGION, 2017–2024 (USD MILLION)
LIST OF FIGURES
 
  • FIGURE 1 DATA CENTER NETWORKING MARKET: RESEARCH DESIGN
  • FIGURE 2 DATA CENTER NETWORKING MARKET: MARKET BREAKUP
  • FIGURE 3 DATA CENTER NETWORKING MARKET: TOP-DOWN AND BOTTOM-UP APPROACHES
  • FIGURE 4 MARKET SIZE ESTIMATION METHODOLOGY: TOP-DOWN APPROACH
  • FIGURE 5 MARKET SIZE ESTIMATION METHODOLOGY: BOTTOM-UP APPROACH
  • FIGURE 6 DATA CENTER NETWORKING MARKET: RESEARCH FLOW
  • FIGURE 7 MARKET SIZE ESTIMATION METHODOLOGY: SUPPLY-SIDE ANALYSIS
  • FIGURE 8 MARKET SIZE ESTIMATION METHODOLOGY: BOTTOM-UP APPROACH FROM SUPPLY SIDE - COLLECTIVE REVENUE OF VENDORS
  • FIGURE 9 BOTTOM-UP APPROACH FROM SUPPLY SIDE: COLLECTIVE REVENUE OF VENDORS
  • FIGURE 10 DEMAND-SIDE APPROACH: DATA CENTER NETWORKING MARKET
  • FIGURE 11 NORTH AMERICA TO ACCOUNT FOR LARGEST MARKET SHARE DURING FORECAST PERIOD
  • FIGURE 12 FASTEST-GROWING SEGMENTS OF DATA CENTER NETWORKING MARKET
  • FIGURE 13 GROWING DEMAND FOR CLOUD COMPUTING, INTERNET OF THINGS, AND EDGE COMPUTING TO DRIVE MARKET
  • FIGURE 14 HARDWARE SEGMENT TO ACCOUNT FOR LARGEST MARKET SHARE DURING FORECAST PERIOD
  • FIGURE 15 ENTERPRISES SEGMENT TO ACCOUNT FOR LARGEST MARKET SHARE DURING FORECAST PERIOD
  • FIGURE 16 ASIA PACIFIC TO EMERGE AS BEST MARKET FOR INVESTMENT IN NEXT FIVE YEARS
  • FIGURE 17 DRIVERS, RESTRAINTS, OPPORTUNITIES, AND CHALLENGES: DATA CENTER NETWORKING MARKET
  • FIGURE 18 DATA CENTER NETWORKING MARKET: SUPPLY CHAIN ANALYSIS
  • FIGURE 19 KEY PLAYERS IN DATA CENTER NETWORKING MARKET ECOSYSTEM
  • FIGURE 20 AVERAGE SELLING PRICES OF KEY PLAYERS FOR SWITCHES, 2021–2023 (USD)
  • FIGURE 21 GLOBAL PATENT PUBLICATION TREND ANALYSIS, 2013–2023
  • FIGURE 22 TOP FIVE PATENT OWNERS (GLOBAL)
  • FIGURE 23 DATA CENTER NETWORKING MARKET: PORTER’S FIVE FORCES ANALYSIS
  • FIGURE 24 TRENDS AND DISRUPTIONS IMPACTING CUSTOMERS’ BUSINESSES
  • FIGURE 25 INFLUENCE OF STAKEHOLDERS ON BUYING PROCESS FOR TOP THREE END USERS
  • FIGURE 26 KEY BUYING CRITERIA FOR TOP THREE END USERS
  • FIGURE 27 IMPORT DATA, BY COUNTRY, 2019–2023 (USD MILLION)
  • FIGURE 28 EXPORT DATA, BY COUNTRY, 2019–2023 (USD MILLION)
  • FIGURE 29 INVESTMENT AND FUNDING SCENARIO OF MAJOR DATA CENTER NETWORKING VENDORS COMPANIES (USD MILLION)
  • FIGURE 30 AI IN DATA CENTER NETWORKING MARKET
  • FIGURE 31 HARDWARE SEGMENT TO HOLD LARGEST MARKET DURING FORECAST PERIOD
  • FIGURE 32 NETWORK SWITCHES SEGMENT TO GROW AT HIGHER CAGR DURING FORECAST PERIOD
  • FIGURE 33 SOFTWARE-DEFINED NETWORKING SEGMENT TO GROW AT HIGHEST CAGR DURING FORECAST PERIOD
  • FIGURE 34 CLOUD SERVICE PROVIDERS SEGMENT TO GROW AT HIGHEST CAGR DURING FORECAST PERIOD
  • FIGURE 35 NORTH AMERICA TO HOLD LARGEST MARKET SIZE IN DATA CENTER NETWORKING
  • FIGURE 36 NORTH AMERICA: MARKET SNAPSHOT
  • FIGURE 37 ASIA PACIFIC: MARKET SNAPSHOT
  • FIGURE 38 REVENUE ANALYSIS OF KEY DATA CENTER NETWORKING COMPANIES
  • FIGURE 39 MARKET SHARE ANALYSIS, 2023
  • FIGURE 40 DATA CENTER NETWORKING MARKET: COMPANY EVALUATION MATRIX (KEY PLAYERS), 2023
  • FIGURE 41 COMPANY FOOTPRINT, 2023
  • FIGURE 42 DATA CENTER NETWORKING MARKET: COMPANY EVALUATION MATRIX (START-UPS/SMES), 2023
  • FIGURE 43 COMPANY VALUATION OF KEY PLAYERS (USD BILLION)
  • FIGURE 44 FINANCIAL METRICS, 2024
  • FIGURE 45 YEAR-TO-DATE (YTD) PRICE TOTAL RETURN AND 5-YEAR STOCK BETA OF KEY VENDORS
  • FIGURE 46 BRAND/PRODUCT COMPARISON
  • FIGURE 47 NVIDIA: COMPANY SNAPSHOT
  • FIGURE 48 ARISTA NETWORKS: COMPANY SNAPSHOT
  • FIGURE 49 DELL: COMPANY SNAPSHOT
  • FIGURE 50 CISCO: COMPANY SNAPSHOT
  • FIGURE 51 HUAWEI: COMPANY SNAPSHOT
  • FIGURE 52 BROADCOM: COMPANY SNAPSHOT
  • FIGURE 53 INTEL: COMPANY SNAPSHOT
  • FIGURE 54 HPE: COMPANY SNAPSHOT
  • FIGURE 55 NOKIA: COMPANY SNAPSHOT
  • FIGURE 56 ZTE: COMPANY SNAPSHOT


The study involved four major activities in estimating the data center networking market. We performed extensive secondary research to collect information on the market, the competitive market, and the parent market. The next step was to validate these findings, assumptions, and sizing with industry experts across the value chain through primary research. Both top-down and bottom-up approaches were employed to estimate the complete market size. After that, we used the market breakup and data triangulation procedures to estimate the market size of the various segments in the data center networking market.

Secondary Research

In the secondary research process, various sources were referred to to identify and collect information for this study. Secondary sources included annual reports, press releases, and investor presentations of companies; white papers, journals, and certified publications; and articles from recognized authors, directories, and databases. The data was also collected from other secondary sources, such as journals, government websites, blogs, and vendors' websites.

Primary Research

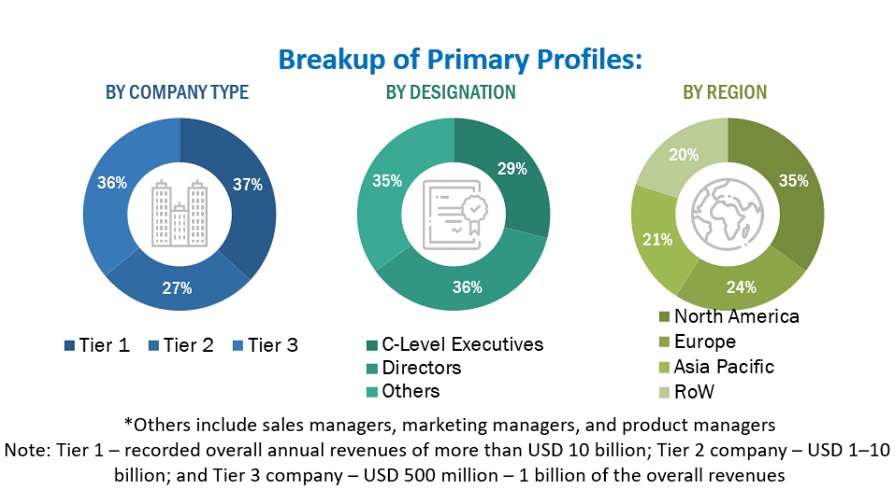
Primary sources were several industry experts from the core and related industries, preferred software providers, hardware manufacturers, distributors, service providers, technology developers, alliances, and organizations related to all segments of the industry's value chain. In-depth interviews were conducted with primary respondents, including key industry participants, subject-matter experts, C-level executives of key market players, and industry consultants, to obtain and verify critical qualitative and quantitative information and assess the market's prospects.

We conducted interviews to get information about market statistics, the latest trends, new use cases, revenue data, market segments, market size estimates, and forecasts. These interviews also helped us understand technology trends, market segments, industry trends, and regional insights. Demand-side stakeholders, such as Chief Information Officers (CIOs), Chief Technology Officers (CTOs), and Chief Security Officers (CSOs); the installation teams of governments/end users using data center networking solutions & services; and digital initiatives project teams, were interviewed to understand the buyer's perspective on suppliers, products, service providers, and their current use of services, which would affect the overall data center networking market.
Data Center Networking Market  Size, and Share

To know about the assumptions considered for the study, download the pdf brochure

Market Size Estimation

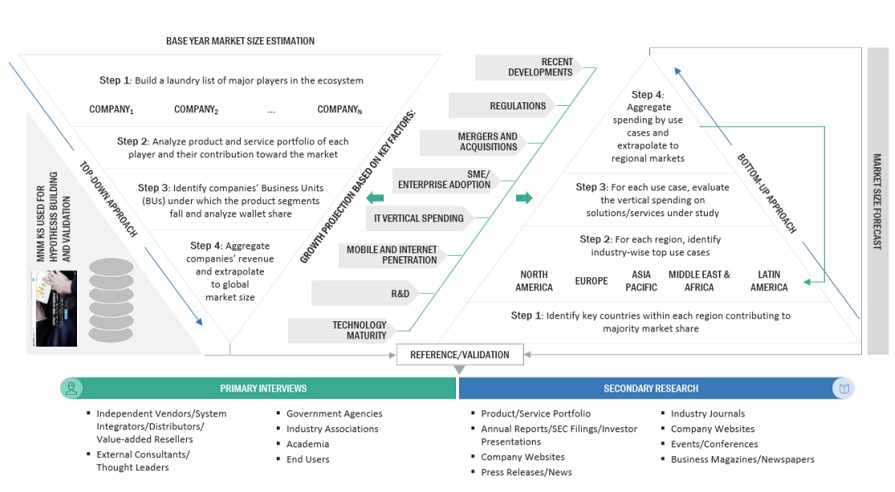
We used top-down and bottom-up approaches to estimate and forecast the data center networking and other dependent submarkets. We deployed a bottom-up procedure to arrive at the overall market size using the revenues and offerings of key companies in the market. With data triangulation methods and validation through primary interviews, this study determined and confirmed the exact value of the overall parent market size. We used the overall market size in the top-down procedure to estimate the size of other individual markets via percentage splits of the market segments.

We used top-down and bottom-up approaches to estimate and validate the data center networking market and other dependent subsegments.

The research methodology used to estimate the market size included the following details:

  • We identified key players in the market through secondary research. We then determined their revenue contributions in the respective countries through primary and secondary research.
  • This procedure included studying top market players' annual and financial reports and extensive interviews for key insights from industry leaders, such as Chief Executive Officers (CEOs), VPs, directors, and marketing executives.
  • All percentage splits and breakups were determined using secondary sources and verified through primary sources.

All the possible parameters that affect the market covered in this research study have been accounted for, viewed in extensive detail, verified through primary research, and analyzed to get the final quantitative and qualitative data. This data is consolidated and added with detailed inputs and analysis from MarketsandMarkets.

Data center networking market: Top-down and Bottom-up approaches
Data Center Networking Market  Top Down and Bottom Up Approach

To know about the assumptions considered for the study, Request for Free Sample Report

Data Triangulation

After arriving at the overall market size, the market was split into several segments and subsegments using the market size estimation processes explained above. Where applicable, data triangulation and market breakup procedures were employed to complete the overall market engineering process and determine each market segment's and subsegment's exact statistics. The data was triangulated by studying several factors and trends from the data center networking market's demand and supply sides.

Market Definition

"Data center networking is a technology that utilizes specialized infrastructure and technologies to connect computing, storage, and network resources within a data center facility. This includes hardware, software, protocols, and services that facilitate communication and data transfer between servers, storage devices, and other components in the data center environment. Data center networking supports modern IT infrastructure, cloud computing, virtualization, emerging edge computing, and IoT technologies. It allows organizations to effectively handle and expand their IT resources while maintaining optimal performance, dependability, and security."

Key Stakeholders

  • Data center networking vendors
  • Technology partners
  • Data Center Operators
  • Network Equipment Manufacturers
  • Consulting firms
  • Resellers and distributors
  • Enterprise users
  • Technology providers
  • Value-Added Resellers (VARs)
  • End users
  • System integrators

Report Objectives

  • To define, describe, and forecast the data center networking market based on offering (hardware, software, services), (hardware – network switches & router, software – network management & monitoring software, software-defined networking, network function virtualization, other software, services – design & consulting, integration & deployment, support and maintenance) end user (enterprises, cloud service provides, telecom service providers) and region
  • To provide detailed information about the major factors (drivers, opportunities, restraints, and challenges) influencing the growth of the market
  • To analyze the opportunities in the market for stakeholders by identifying the high-growth segments of the market
  • To forecast the market size concerning five central regions—North America, Europe, Asia Pacific, the Middle East & Africa, and Latin America
  • To analyze the subsegments of the market concerning individual growth trends, prospects, and contributions to the overall market
  • To profile the key players of the market and comprehensively analyze their market size and core competencies
  • To track and analyze the competitive developments, such as product enhancements, product launches, acquisitions, partnerships, and collaborations, in the data center networking market globally

Available Customizations

With the given market data, MarketsandMarkets offers customizations per the company's specific needs. The following customization options are available for the report:

Product Analysis

  • The product matrix provides a detailed comparison of each company's portfolio.

Geographic Analysis

  • Further breakup of the Asia Pacific market into countries contributing 75% to the regional market size
  • Further breakup of the North American market into countries contributing 75% to the regional market size
  • Further breakup of the Latin American market into countries contributing 75% to the regional market size
  • Further breakup of the Middle Eastern & African market into countries contributing 75% to the regional market size
  • Further breakup of the European market into countries contributing 75% to the regional market size

Company Information

  • Detailed analysis and profiling of additional market players (up to 5)

Previous Versions of this Report

Data Center Networking Market Size, Share, Growth Analysis, By Offering (Hardware, Software, Services), Hardware (Network Switches, Routers), Software (Network Management & Monitoring, SDN, NFV), End User and Region - Global Industry Forecast to 2029

Report Code TC 1493
Published in Oct, 2013, By MarketsandMarkets™
"Our USP is "providing game-changing business opportunities reports with free customization" - so please feel free to provide us with your specific areas of interest / business challenges in much greater detail !!"

We appreciate your interest in this report. Once you fill out the form, you'll be immediately directed to an exclusive solution tailored to your needs. This high-value offering can help boost your revenue by 30% - a must-see opportunity for anyone looking to maximize growth.


By clicking the "Submit" button, you are agreeing to the Terms of Use and Privacy Policy.

Custom Market Research Services

We Will Customise The Research For You, In Case The Report Listed Above Does Not Meet With Your Requirements

Get 10% Free Customisation

Growth opportunities and latent adjacency in Data Center Networking Market

DMCA.com Protection Status