The research study for the cloud analytics market involved extensive secondary sources, directories, and several journals. Primary sources were mainly industry experts from the core and related industries, preferred cloud analytics solutions providers, third-party service providers, consulting service providers, end users, and other commercial enterprises. In-depth interviews with primary respondents, including key industry participants and subject matter experts, were conducted to obtain and verify critical qualitative and quantitative information and assess the market’s prospects.
Secondary Research
The market size of companies offering cloud analytics solutions and services was determined based on secondary data from paid and unpaid sources. It was also arrived at by analyzing the product portfolios of major companies and rating the companies based on their performance and quality.
In the secondary research process, various sources were referred to for identifying and collecting information for this study. Secondary sources included annual reports, press releases, and investor presentations of companies; white papers, journals, and certified publications; and articles from recognized authors, directories, and databases. The data was also collected from other secondary sources, such as journals, government websites, blogs, and vendor websites. Additionally, cloud analytics spending of various countries was extracted from the respective sources. Secondary research was mainly used to obtain key information related to the industry’s value chain and supply chain to identify key players based on solutions, services, market classification, and segmentation according to offerings of major players, industry trends related to offering, data type, data processing, vertical, and region, and key developments from both market- and technology-oriented perspectives.
Primary Research
In the primary research process, various primary sources from both the supply and demand sides were interviewed to obtain qualitative and quantitative information on the market. The primary sources from the supply side included various industry experts, including Chief Experience Officers (CXOs); Vice Presidents (VPs); directors from business development, marketing, and cloud analytics expertise; related key executives from cloud analytics solutions vendors, System Integrators (SIs), professional service providers, and industry associations; and key opinion leaders.
Primary interviews were conducted to gather insights, such as market statistics, revenue data collected from solutions and services, market breakups, market size estimations, market forecasts, and data triangulation. Primary research also helped understand various trends related to technologies, applications, deployments, and regions. Stakeholders from the demand side, such as Chief Information Officers (CIOs), Chief Technology Officers (CTOs), Chief Strategy Officers (CSOs), and end users using cloud analytics, were interviewed to understand the buyer’s perspective on suppliers, products, service providers, and their current usage of cloud analytics solutions and services which would impact the overall cloud analytics market.
The following is the breakup of primary profiles:

To know about the assumptions considered for the study, download the pdf brochure
Market Size Estimation
Multiple approaches were adopted for estimating and forecasting the cloud analytics market. The first approach involves estimating the market size by summating companies’ revenue generated through the sale of solutions and services.
Market Size Estimation Methodology-Top-down approach
In the top-down approach, an exhaustive list of all the vendors offering solutions and services in the cloud analytics market was prepared. The revenue contribution of the market vendors was estimated through annual reports, press releases, funding, investor presentations, paid databases, and primary interviews. Each vendor’s offerings were evaluated based on the breadth of offering, data type, data processing, vertical, and region. The aggregate of all the companies’ revenue was extrapolated to reach the overall market size. Each subsegment was studied and analyzed for its global market size and regional penetration. The markets were triangulated through both primary and secondary research. The primary procedure included extensive interviews for key insights from industry leaders, such as CIOs, CEOs, VPs, directors, and marketing executives. The market numbers were further triangulated with the existing MarketsandMarkets repository for validation.
Market Size Estimation Methodology-Bottom-up approach
In the bottom-up approach, the adoption rate of cloud analytics offerings among different end users in key countries with respect to their regions contributing the most to the market share was identified. For cross-validation, the adoption of cloud analytics solutions and services among industries, along with different use cases with respect to their regions, was identified and extrapolated. Weightage was given to use cases identified in the different areas for the market size calculation.
Based on the market numbers, the regional split was determined by primary and secondary sources. The procedure included the analysis of the cloud analytics market’s regional penetration. Based on secondary research, the regional spending on Information and Communications Technology (ICT), socio-economic analysis of each country, strategic vendor analysis of major cloud analytics solutions providers, and organic and inorganic business development activities of regional and global players were estimated. With the data triangulation procedure and data validation through primaries, the exact values of the overall cloud analytics market size and segments’ size were determined and confirmed using the study.
Top-down and Bottom-up approaches

To know about the assumptions considered for the study, Request for Free Sample Report
Data Triangulation
After arriving at the overall market size using the market size estimation processes as explained above, the market was split into several segments and subsegments. To complete the overall market engineering process and arrive at the exact statistics of each market segment and subsegment, data triangulation and market breakup procedures were employed, wherever applicable. The overall market size was then used in the top-down procedure to estimate the size of other individual markets via percentage splits of the market segmentation.
Market Definition
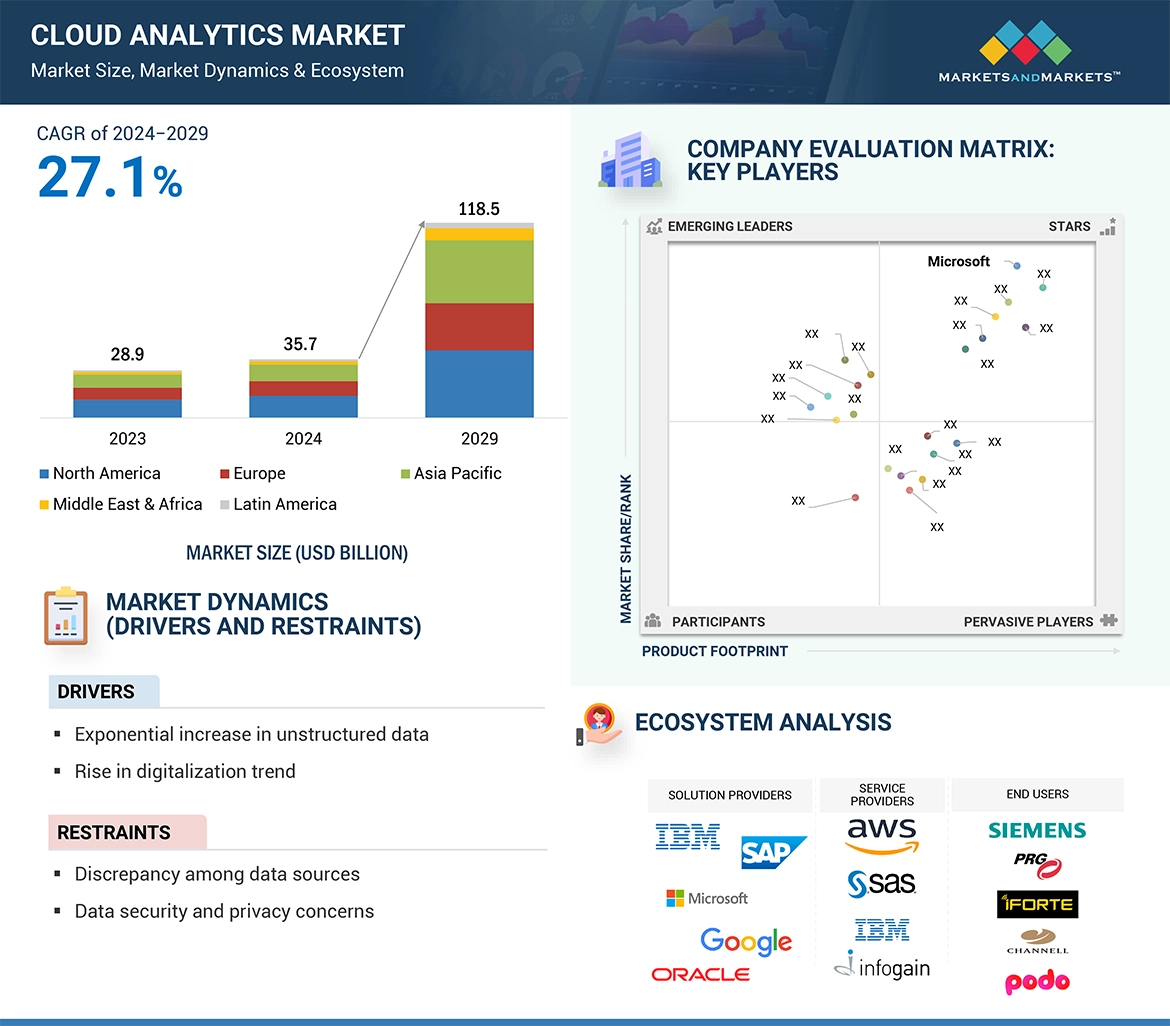
According to ThoughtSpot, Cloud analytics involves the process of scrutinizing data within a cloud-based data platform to unveil actionable business insights. This analytical approach empowers users to delve into extensive datasets stored in the cloud, revealing pertinent trends and patterns, forecasting outcomes, enhancing decision-making processes, and ultimately catalyzing business advancement.
Cloud analytics transfers data analysis tasks to a public or private cloud, it enables the processing of vast and complex datasets using algorithms and cloud tech, delivering actionable business insights. This involves applying analytic algorithms in the cloud to data stored there. Cloud analytics combines scalable computing with analytic software to uncover patterns and insights. Cloud analytics platforms are attractive to businesses due to their swift and cost-efficient deployment sans internal expertise. Additionally, it offer scalability, aligning seamlessly with evolving business needs, making them an attractive option for organizations seeking agile and adaptable solutions.
Stakeholders
-
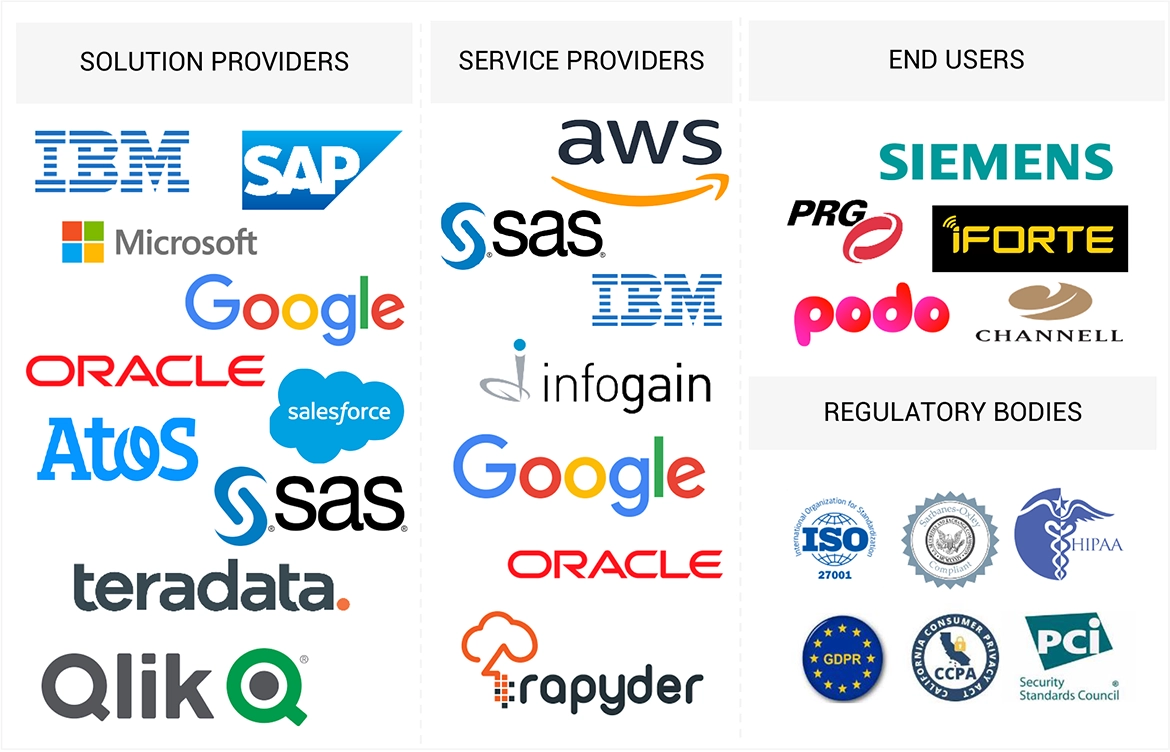
Cloud Analytics Market Solutions Providers
-
Cloud Analytics Market Service Providers
-
End-user Industries
-
System Integrators (SIs)
-
Managed Service Providers (MSPs)
-
Business Intelligence Solution Providers
-
Technology Providers
-
Value-added Resellers (VARs)
-
Government And Regulatory Bodies
Report Objectives
-
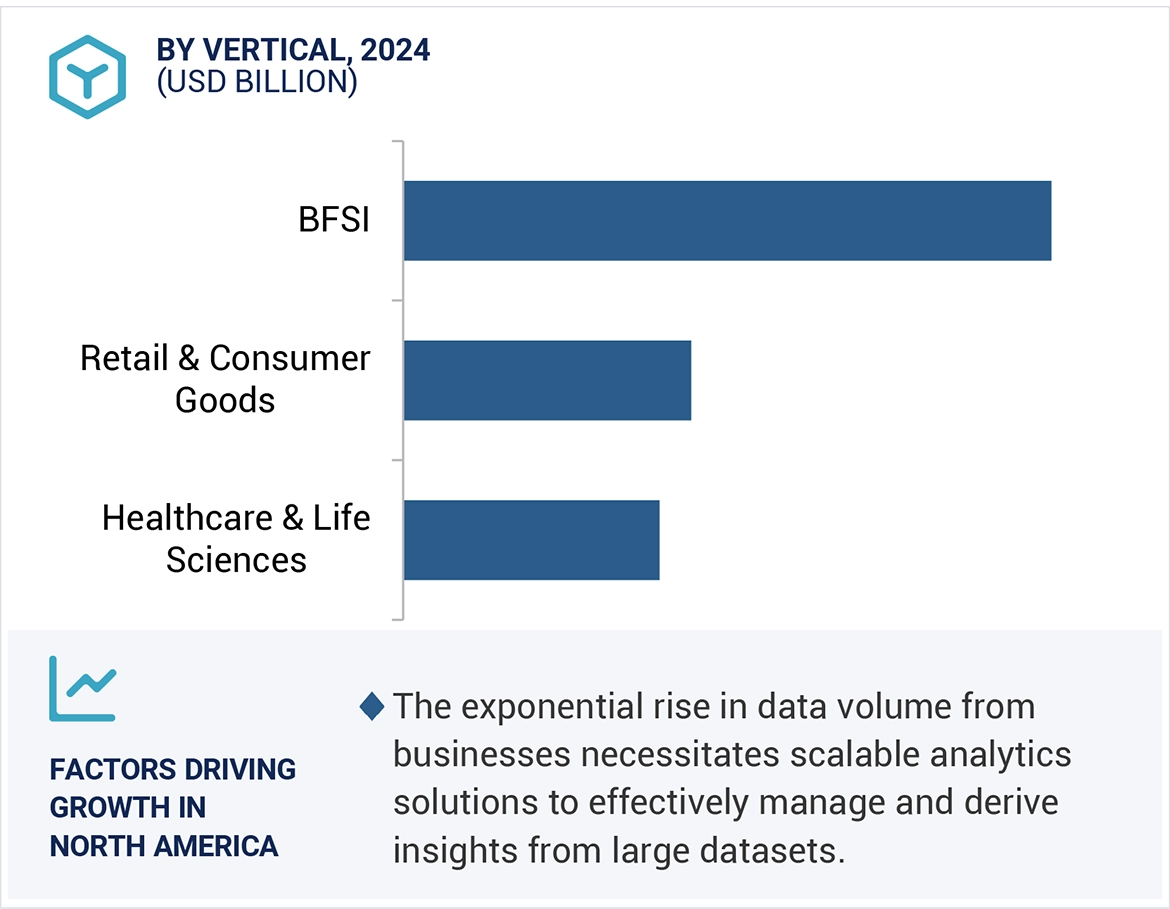
To define, describe, and predict the cloud analytics market by offering, data type, data processing, vertical, and region
-
To describe and forecast the cloud analytics market, in terms of value, by region—North America, Europe, Asia Pacific, Middle East & Africa, and Latin America
-
To provide detailed information regarding major factors influencing the market growth (drivers, restraints, opportunities, and challenges)
-
To strategically analyze micro markets with respect to individual growth trends, prospects, and contributions to the overall cloud analytics market
-
To profile key players and comprehensively analyze their market positions in terms of ranking and core competencies, along with detailing the competitive landscape for market leaders
-
To analyze competitive developments such as joint ventures, mergers and acquisitions, product developments, and ongoing research and development (R&D) in the cloud analytics market
-
To provide the illustrative segmentation, analysis, and projection of the main regional markets
Available Customizations
With the given market data, MarketsandMarkets offers customizations per the company’s specific needs. The following customization options are available for the report:
Product Analysis
-
The product matrix provides a detailed comparison of the product portfolio of each company.
Geographic Analysis as per Feasibility
-
Further breakup of the North American Cloud Analytics Market
-
Further breakup of the European Cloud Analytics Market
-
Further breakup of the Asia Pacific Cloud Analytics Market
-
Further breakup of the Middle East & Africa Cloud Analytics Market
-
Further breakup of the Latin America Cloud Analytics Market
Company Information
-
Detailed analysis and profiling of additional market players (up to five)


Growth opportunities and latent adjacency in Cloud Analytics Market