IoT Analytics Market by Application (Energy Management, Predictive Maintenance & Asset Management, Inventory Management, Remote Monitoring), Component, Analytics Type, Deployment, Organization Size, & Vertical - Global Forecast to 2022


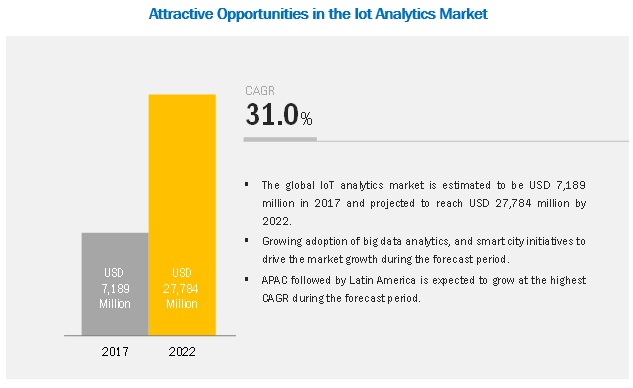
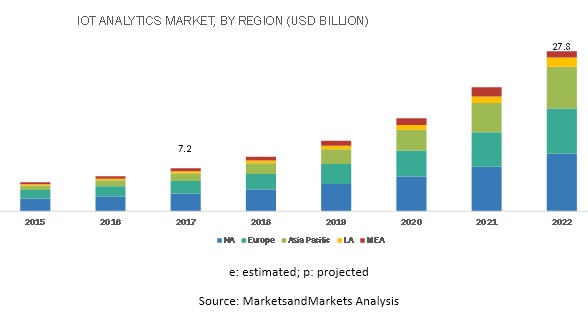
[187 Pages Report] The global IoT analytics market size is expected to grow from USD 7.2 billion in 2017 to USD 27.8 billion by 2022, at a Compound Annual Growth Rate (CAGR) of 26% during the forecast period. The key factors driving the IoT analytics market include tremendous rise in the IoT data generation due to increasing deployment of IoT devices, and the need of advanced analytics and automation for businesses to remain competitive.
Predictive Analytics to account for the largest market size during the forecast period
Predictive analytics transforms data into valuable insights, facilitating enterprises to optimize business processes, enhance process efficiencies, and increase customer satisfaction. Predictive analytics makes use of real-time data as well as historic data to come up with futuristic outcomes before the actual event takes place. The predictive analytics type is expected to have the largest share in the IoT Analytics market due to its ability to determine data and predict future outcomes and trends. The predictions that flow from predictive analytics are transformed into a set of recommended actions that will generate business value. This assists procurement professionals to view business scenario and build future operational strategies. Predictive analytics can also be used for demand forecasting using multiple regression models, which helps organizations determine demand and supply forecasts for different product categories. Such forecasts can prove beneficial while calculating the company revenue and budget growth. Companies are also focusing on providing predictive maintenance and asset maintenance using predictive analytics to understand the device repairing time, minimize downtime, and take swift corrective actions. Predictive analytics when incorporated in IoT Analytics , assists a manufacturing unit to ensure continuous operations by implementing asset maintenance or helps a government institute to shut down their servers if suspicious web traffic is detected.
APAC is expected to hold the highest CAGR during the forecast period
The IoT Analytics market growth in Asia Pacific (APAC) region has started to gain momentum and is expected to witness the highest growth rate in the next few years. Rising awareness about the increase in business productivity, supplemented by competently designed IoT Analytics solutions offered by the vendors present in this region, has led APAC to become a highly potential market. This region is witnessing an increasing demand for cloud-driven IoT Analytics solutions.
Market Dynamics
Driver: Growing demand for predictive analytics by businesses
Predictive analytics has gained significance due to the increasing number of IoT devices. It is an underlying part of smart decision making, autonomous of human users. For instance, a self-driven truck utilizes the Global Positioning System (GPS) to convey the parcel on time via the shortest possible route. The GPS makes use of predictive analytics algorithm for controlling the truck and additionally for choosing the shortest path. By making use of historical data, statistical algorithms, and M2M learning, predictive analytics identifies future outcomes. As predictive analytics utilizes the same IoT data as used by IoT devices and refines it to generate inferences and predictions. IoT Analytics has the capability to process IoT data and develop real-time dashboards mapped on varied parameters. The IoT Analytics solutions assist users in taking imperative business decisions by analyzing the current data as well as the historic data to predict future outcomes. Owing to these, the demand for predictive analytics by businesses is going to be a huge driving factor for the IoT Analytics market.
Restraint: Lack of real-time algorithms
The biggest thing limiting the rapid growth of the IoT Analytics market is the lack of efficient real-time algorithms. Real-time algorithms are outlined with a plan to serve real-time applications and process data without any deferral. IoT Analytics being a new domain does not possess the robust algorithms and platforms required to handle the increasing size of IoT data. The gap between data generation and data analysis is exceptionally huge. Due to this, the life span of new algorithms and platforms is restricted and they go obsolete rapidly prompting the failure of system to handle the overwhelming data generated through IoT devices. This makes a noteworthy concern for many companies as it ultimately results in loss of revenue for them. This is an acute issue which will gradually subside with technological innovation in the coming years.
Opportunity: The emergence of edge analytics
With the evolution of edge analytics, IoT Analytics has seen a great boost in its overall market. Edge analytics is a fundamentally the same as video or image analytics wherein the analysis capabilities are empowered in small devices as opposed to collaborating all the data in a centralized enterprise data warehouse. It is more than just about operational efficiencies and scalability. There are many business processes which do not require substantial analytics and thus the data collected, processed, and analyzed on or near the edge can drive automated decisions. For instance, a local valve can be turned off on detection of a leak. This has provided massive opportunity for IoT Analytics as it involves IoT devices and has reduced demands on the bandwidth of the network and storage requirements. It will enable analysis of massive volumes of data with superior performance and scalability in the near future.
Challenges: Heterogeneous data processing
Large amount of data is being assembled from various sensors such as vehicles, cameras, passengers, drivers, and medical sensors. It results in heterogeneous and similar data such as text, voice, and video. An IoT Analytics system may include many types of sensor data with heterogeneous data structures. For instance, the IoT Analytics system may contain many forms of sensor data, such as traffic sensor data, hydrological sensor data, geological sensor data, meteorological sensor data, and biomedical sensor data. Each category can be separated into different forms of sensor data. For example, data from traffic sensors can include data generated by RFID readers, GPS sensors, video-based traffic-flow analysis sensors, road condition sensors, traffic loop sensors, and so on. The sampling data from various sensors may have dissimilar semantics and data structures that fundamentally raise the inconveniences in data processing.
Scope of the Report
|
Report Metrics |
Details |
|
Market size available for years |
2015�2022 |
|
Base year considered |
2016 |
|
Forecast period |
2017�2022 |
|
Forecast units |
Billion (USD) |
|
Segments covered |
Type, Analytics Type, Application, Deployment Model, Vertical, & Region |
|
Geographies covered |
North America, Europe, APAC, MEA, and Latin America |
|
Companies covered |
IBM Corporation (US), Microsoft Corporation (US), Oracle Corporation (US), SAP SE (Germany), Cisco Systems, Inc., (US), Dell Technologies, Inc. (US), Google, Inc. (US), Amazon Web Services, Inc. (US), HP Enterprise Company (US), PTC, Inc. (US), Hitachi, Ltd. (Japan), Teradata Corporation (US), Salesforce.com, Inc. (US), and Greenwave Systems, Inc. (US). |
The research report categorizes the IoT Analytics Market to forecast the revenues and analyze the trends in each of the following sub-segments:
IoT Analytics Market By Type
- Software
- Sensor Data Analytics
- IoT Gateway Analytics
- Network Management
- Services
- Deployment and Integration
- Support and Maintenance
- Consulting Services
- Managed Services
IoT Analytics Market By Analytics Type
- Predictive Analytics
- Prescriptive Analytics
- Descriptive Analytics
IoT Analytics Market By Application
- Energy Management
- Predictive and Asset Management
- Inventory Management
- Security and Emergency Management
- Sales and Customer Management
- Building Automation
- Infrastructure Management
- Remote Monitoring
- Others
IoT Analytics Market By Deployment Model
- On-Premise
- Hosted
IoT Analytics Market By Industry Vertical
- Healthcare
- Government and Defense
- Manufacturing
- Energy and Utilities
- Telecommunication and IT
- Transportation and Logistics
- Retail
- Others (Outsourcing services, travel and hospitality, and education)
IoT Analytics Market By Region
- North America
- Europe
- Asia Pacific (APAC)
- Middle East and Africa (MEA)
- Latin America
Key Market Players
The global IoT Analytics market is fragmented in nature, as no single vendor dominates the market. Major vendors that offer IoT Analytics software and services include IBM Corporation (US), Microsoft Corporation (US), Oracle Corporation (US), SAP SE (Germany), Cisco Systems, Inc., (US), Dell Technologies, Inc. (US), Google, Inc. (US), Amazon Web Services, Inc. (US), HP Enterprise Company (US), PTC, Inc. (US), Hitachi, Ltd. (Japan), Teradata Corporation (US), Salesforce.com, Inc. (US), and Greenwave Systems, Inc. (US). These vendors have adopted different types of organic and inorganic growth strategies, such as new product launches, partnerships and collaborations, and mergers and acquisitions, to expand their offerings in the IoT Analytics market.
Recent Developments:
- In November 2019, IBM launched Maximo Asset Monitor, an AI-powered monitoring solution built assist maintenance and better understand and improve the performance of their important physical assets. The new solution is also expected to unravel essential insights though its AI-powered capability for anomaly detection and offer visibility across enterprise into critical equipment performance.
- In November 2019, AWS announced new updates for its Alexa Voice Service and to its edge services IoT Greengrass and added new capabilities for it IoT Analytics. This allows easy management of new devices as well as secured AWS IoT Device Management
Key Questions addressed by the report:
- What are the opportunities in the IoT Analytics market?
- What is the competitive landscape in the IoT Analytics market?
- What are the emerging applications showing the adoption of IoT Analytics solutions in the global market?
- What are the key use cases existing in the IoT Analytics market?
- What are the key trends and dynamics existing in the IoT Analytics market?
To speak to our analyst for a discussion on the above findings, click Speak to Analyst
 Exclusive indicates content/data unique to MarketsandMarkets and not available with any competitors.
Table of Contents
1 Introduction
1.1 Objectives Of The Study
1.2 Market Definition
1.2.1 Inclusions And Exclusions
1.3 Market Scope
1.3.1 Market Segmentation
1.3.2 Regions Covered
1.4 Years Considered For The Study
1.5 Currency
1.6 Stakeholders
2 Research Methodology
2.1 Research Data
2.1.1 Secondary Data
2.1.2 Primary Data
2.1.2.1 Breakdown of Primaries
2.1.2.2 Key Industry Insights
2.2 Market Size Estimation
2.3 Microquadrant Research Methodology
2.3.1 Vendor Inclusion Criteria
2.4 Research Assumptions and Limitations
2.5 Limitations
3 Executive Summary
4 Premium Insights
4.1 Attractive Opportunities in the IOT Analytics Market
4.2 Analytics of Things Market: Market Share, By Region
4.3 Analytics of Things Market, By Industry Vertical and Region
4.4 Lifecycle Analysis, By Region, 2017
5 IoT Analytics Market Overview and Industry Trends
5.1 Market Overview
5.1.1 Introduction
5.1.2 Market Dynamics
5.1.3 Drivers
5.1.3.1 Tremendous Growth of IoT Data
5.1.3.2 Need for Advanced Analytics and Automation for Businesses
5.1.4 Restraints
5.1.4.1 Ownership and Control of IoT Data
5.1.4.2 Lack of Real-Time Algorithms
5.1.5 Opportunities
5.1.5.1 Emergence of Edge Analytics
5.1.5.2 Technological Development in Paas
5.1.6 Challenges
5.1.6.1 Data Security and Privacy Concerns
5.1.6.2 Heterogeneous Data Processing
5.2 Industry Trends
5.2.1 AOT Ecosystem
5.3 Regulatory Implications
5.3.1 International Electrotechnical Commission (IEC)
5.3.2 ISO/International Electrotechnical Commission Joint Technical Committee 1
5.3.2.1 IOS/IEC JTC 1/Special Working Group 5
5.3.2.2 IOS/IEC JTC 1/SC 31
5.3.2.3 IOS/IEC JTC 1/SC 27
5.3.2.4 IOS/IEC JTC 1/WG 7 Sensor Networks (WGSN)
5.3.3 Institute of Electrical and Electronics Engineers Standards Association
5.3.4 European Committee for Standardization (CEN)/ISO
5.3.5 CEN/European Committee for Electrotechnical Standardization (Cenelec)
5.3.6 European Technical Standards Institute
5.3.7 International Telecommunication Union (ITU-T)
5.3.8 IOT Analytics Market : Use Cases
5.3.8.1 Introduction
5.3.8.2 Use Case 1: Manufacturing
5.3.8.3 Use Case 2: Healthcare
5.3.8.4 Use Case 3: Transportation
5.3.8.5 Use Case 4: Telecom
5.3.8.6 Use Case 5: Government
5.3.8.7 Use Case 6: Utilities
5.3.8.8 Use Case 7: Retail
6 IoT Analytics Market Analysis, By Application
6.1 Introduction
6.2 Energy Management
6.3 Predictive Maintenance and Asset Management
6.4 Inventory Management
6.5 Security and Emergency Management
6.6 Sales and Customer Management
6.7 Building Automation
6.8 IT Infrastructure Management
6.9 Remote Monitoring
6.10 Others
7 IoT Analytics Market Analysis, By Component
7.1 Introduction
7.2 Software
7.2.1 Sensor Data Analytics
7.2.2 IoT Gateway Analytics
7.2.3 Network Management
7.3 Services
7.3.1 Managed Services
7.3.1.1 Professional Services
7.3.2 Support and Maintenance
7.3.3 Consulting
8 IoT Analytics Market Analysis, By Analytics Type
8.1 Introduction
8.2 Predictive Analytics
8.3 Prescriptive Analytics
8.4 Descriptive Analytics
9 Market Analysis, By Deployment Model
9.1 Introduction
9.2 On-Premises
9.3 Cloud
10 IoT Analytics Market Analysis, By Organization Size
10.1 Introduction
10.2 Small and Medium-Sized Enterprises
10.3 Large Enterprises
11 IoT Analytics Market Analysis, By Industry Vertical
11.1 Introduction
11.2 Manufacturing
11.3 Retail and Ecommerce
11.4 Government and Defense
11.5 Healthcare and Life Sciences
11.6 Energy and Utilities
11.7 Telecommunications and IT
11.8 Transportation and Logistics
11.9 Others
12 IoT Analytics Market Geographic Analysis
12.1 Introduction
12.2 North America
12.2.1 By Component
12.2.2 By Application
12.2.3 By Deployment Mode
12.2.4 By Organization Size
12.2.5 By Analytics Type
12.2.6 By Industry Vertical
12.3 Europe
12.3.1 By Component
12.3.2 By Application
12.3.3 By Deployment Mode
12.3.4 By Organization Size
12.3.5 By Analytics Type
12.3.6 By Industry Vertical
12.4 Asia Pacific
12.4.1 By Component
12.4.2 By Application
12.4.3 By Deployment Mode
12.4.4 By Organization Size
12.4.5 By Analytics Type
12.4.6 By Industry Vertical
12.5 Middle East And Africa
12.5.1 By Component
12.5.2 By Application
12.5.3 By Deployment Mode
12.5.4 By Organization Size
12.5.5 By Analytics Type
12.5.6 By Industry Vertical
12.6 Latin America
12.6.1 By Component
12.6.2 By Application
12.6.3 By Deployment Mode
12.6.4 By Organization Size
12.6.5 By Analytics Type
12.6.6 By Industry Vertical
13 Competitive Landscape
13.1 Microqudrant Overview
13.1.1 Visionary Leaders
13.1.2 Innovators
13.1.3 Dynamic Differentiators
13.1.4 Emerging Companies
13.2 Competitive Benchmarking
13.2.1 Business Strategy Excellence Adopted By Major Players in the Analytics of Things Market
13.2.2 Strength of Product Portfolio Adopted By Major Players in the Analytics of Things Market
14 Company Profiles
14.1 IBM
14.1.1 Businsess Overview
14.1.2 Financial Performance
14.1.3 Products And Services Offered
14.1.4 Recent Developments
14.1.5 Swot Analysis
14.1.6 MnM View
14.2 Microsoft
14.3 Oracle
14.4 Sap
14.5 Cisco Systems
14.6 Dell Technologies
14.7 Google
14.8 Amazon Web Services
14.9 Hpe
14.10 Hitachi
14.11 Teradata
14.12 Salesforce.Com
14.13 Greenwave Systems
14.14 Mnubo
*Details on Overview, Strength of Product Portfolio, Business Strategy Excellence, Recent Developments Might Not Be Captured in Case of Unlisted Companies.
15 Appendix
15.1 Key Insights of Industry Experts
15.2 Discussion Guide
15.3 Knowledge Store: Marketsandmarkets� Subscription Portal
15.4 Introducing RT: Real-Time Market Intelligence
15.5 Available Customization
15.6 Related Reports
15.7 Author Details
List of Tables (99 Tables)
Table 1 United States Dollar Exchange Rate, 2014�2016
Table 2 Evaluation Criteria
Table 3 IOT Analytics Market Size, By Application, 2015�2022 (USD Million)
Table 4 Energy Management: Analytics of Things Market Size, By Region, 2015�2022 (USD Million)
Table 5 Predictive Maintenance and Asset Management: Analytics of Things Market Size, By Region, 2015�2022 (USD Million)
Table 6 Inventory Management: Analytics of Things Market Size, By Region, 2015�2022 (USD Million)
Table 7 Security and Emergency Management: Analytics of Things Market Size, By Region, 2015�2022 (USD Million)
Table 8 Sales and Customer Management: Market Size, By Region, 2015�2022 (USD Million)
Table 9 Building Automation: Market Size, By Region, 2015�2022 (USD Million)
Table 10 IT Infrastructure Management: Market Size, By Region, 2015�2022 (USD Million)
Table 11 Remote Monitoring: Analytics of Things Market Size, By Region, 2015�2022 (USD Million)
Table 12 Others: Market Size, By Region, 2015�2022 (USD Million)
Table 13 Analytics of Things Market Size, By Component, 2015�2022 (USD Million)
Table 14 Software: Analytics of Things Market Size, By Region, 2015�2022 (USD Million)
Table 15 Analytics of Things Market Size, By Software, 2015�2022 (USD Million)
Table 16 Sensor Data Analytics: Market Size, By Region, 2015�2022 (USD Million)
Table 17 IoT Gateway Analytics: Market Size, By Region, 2015�2022 (USD Million)
Table 18 Network Management: Market Size, By Region, 2015�2022 (USD Million)
Table 19 Services: Analytics of Things Market Size, By Region, 2015�2022 (USD Million)
Table 20 Services: Analytics of Things Market Size, By Type, 2015�2022 (USD Million)
Table 21 Managed Services: Market Size, By Region, 2015�2022 (USD Million)
Table 22 Professional Services: Market Size, By Region, 2015�2022 (USD Million)
Table 23 Professional Services: Market Size, By Type, 2015�2022 (USD Million)
Table 24 Support and Maintenance: Market Size, By Region, 2015�2022 (USD Million)
Table 25 Consulting: Analytics of Things Market Size, By Region, 2015�2022 (USD Million)
Table 26 IOT Analytics Market Size, By Analytics Type, 2015�2022 (USD Million)
Table 27 Predictive Analytics: Market Size, By Region, 2015�2022 (USD Million)
Table 28 Prescriptive Analytics: Market Size, By Region, 2015�2022 (USD Million)
Table 29 Descriptive Analytics: Market Size, By Region, 2015�2022 (USD Million)
Table 30 Analytics of Things Market Size, By Deployment Model, 2015�2022 (USD Million)
Table 31 On-Premises: Analytics of Things Market Size, By Region, 2015�2022 (USD Million)
Table 32 Cloud: Analytics of Things Market Size, By Region, 2015�2022 (USD Million)
Table 33 Analytics of Things Market Size, By Organization Size, 2015�2022 (USD Million)
Table 34 Small and Medium-Sized Enterprises: Analytics of Things Market Size, By Region, 2015�2022 (USD Million)
Table 35 Large Enterprises: Analytics of Things Market Size, By Region, 2015�2022 (USD Million)
Table 36 IOT Analytics Market Size, By Industry Vertical, 2015�2022 (USD Million)
Table 37 Manufacturing: Analytics of Things Market Size, By Region, 2015�2022 (USD Million)
Table 38 Manufacturing: Market Size, By Application, 2015�2022 (USD Million)
Table 39 Retail and Ecommerce: Market Size, By Region, 2015�2022 (USD Million)
Table 40 Retail and Ecommerce: Market Size, By Application, 2015�2022 (USD Million)
Table 41 Government and Defense: Market Size, By Region, 2015�2022 (USD Million)
Table 42 Government and Defense: Market Size, By Application, 2015�2022 (USD Million)
Table 43 Healthcare and Life Sciences: Market Size, By Region, 2015�2022 (USD Million)
Table 44 Healthcare and Life Sciences: Market Size, By Application, 2015�2022 (USD Million)
Table 45 Energy and Utilities: Market Size, By Region, 2015�2022 (USD Million)
Table 46 Energy and Utilities: Market Size, By Application, 2015�2022 (USD Million)
Table 47 Telecommunications and IT: Analytics of Things Market Size, By Region, 2015�2022 (USD Million)
Table 48 Telecommunications and IT: Market Size, By Application, 2015�2022 (USD Million)
Table 49 Transportation and Logistics: Market Size, By Region, 2015�2022 (USD Million)
Table 50 Transportation and Logistics: Market Size, By Application, 2015�2022 (USD Million)
Table 51 Others: Analytics of Things Market Size, By Region, 2015�2022 (USD Million)
Table 52 Others: Analytics of Things Market Size, By Application, 2015�2022 (USD Million)
Table 53 IOT Analytics Market Size, By Region, 2015�2022 (USD Million)
Table 54 North America: Market Size, By Component, 2015�2022 (USD Million)
Table 55 North America: Market Size, By Software, 2015�2022 (USD Million)
Table 56 North America: Market Size, By Service, 2015�2022 (USD Million)
Table 57 North America: Market Size, By Professional Service, 2015�2022 (USD Million)
Table 58 North America: Market Size, By Application, 2015�2022 (USD Million)
Table 59 North America: Analytics of Things Market Size, By Analytics Type, 2015�2022 (USD Million)
Table 60 North America: Market Size, By Deployment Model, 2015�2022 (USD Million)
Table 61 North America: Market Size, By Organization Size, 2015�2022 (USD Million)
Table 62 North America: Market Size, By Industry Vertical, 2015�2022 (USD Million)
Table 63 Europe: IOT Analytics Market Size, By Component, 2015�2022 (USD Million)
Table 64 Europe: Market Size, By Software, 2015�2022 (USD Million)
Table 65 Europe: Market Size, By Service, 2015�2022 (USD Million)
Table 66 Europe: Market Size, By Professional Service, 2015�2022 (USD Million)
Table 67 Europe: Market Size, By Application, 2015�2022 (USD Million)
Table 68 Europe: Analytics of Things Market Size, By Analytics Type, 2015�2022 (USD Million)
Table 69 Europe: Market Size, By Deployment Model, 2015�2022 (USD Million)
Table 70 Europe: Market Size, By Organization Size, 2015�2022 (USD Million)
Table 71 Europe: Market Size, By Industry Vertical, 2015�2022 (USD Million)
Table 72 Asia Pacific: IOT Analytics Market Size, By Component, 2015�2022 (USD Million)
Table 73 Asia Pacific: Market Size, By Software, 2015�2022 (USD Million)
Table 74 Asia Pacific: Market Size, By Service, 2015�2022 (USD Million)
Table 75 Asia Pacific: Market Size, By Professional Service, 2015�2022 (USD Million)
Table 76 Asia Pacific: Analytics of Things Market Size, By Application, 2015�2022 (USD Million)
Table 77 Asia Pacific: Market Size, By Analytics Type, 2015�2022 (USD Million)
Table 78 Asia Pacific: Market Size, By Deployment Model, 2015�2022 (USD Million)
Table 79 Asia Pacific: Market Size, By Organization Size, 2015�2022 (USD Million)
Table 80 Asia Pacific: Market Size, By Industry Vertical, 2015�2022 (USD Million)
Table 81 Middle East and Africa: IOT Analytics Market Size, By Component, 2015�2022 (USD Million)
Table 82 Middle East and Africa: Market Size, By Software, 2015�2022 (USD Million)
Table 83 Middle East and Africa: Market Size, By Service, 2015�2022 (USD Million)
Table 84 Middle East and Africa: Market Size, By Professional Service, 2015�2022 (USD Million)
Table 85 Middle East and Africa: Market Size, By Application, 2015�2022 (USD Million)
Table 86 Middle East and Africa: Analytics of Things Market Size, By Analytics Type, 2015�2022 (USD Million)
Table 87 Middle East and Africa: Market Size, By Deployment Model, 2015�2022 (USD Million)
Table 88 Middle East and Africa: Market Size, By Organization Size, 2015�2022 (USD Million)
Table 89 Middle East and Africa: Market Size, By Industry Vertical, 2015�2022 (USD Million)
Table 90 Latin America: IOT Analytics Market Size, By Component, 2015�2022 (USD Million)
Table 91 Latin America: Market Size, By Software, 2015�2022 (USD Million)
Table 92 Latin America: Market Size, By Service, 2015�2022 (USD Million)
Table 93 Latin America: Market Size, By Professional Service, 2015�2022 (USD Million)
Table 94 Latin America: Market Size, By Application, 2015�2022 (USD Million)
Table 95 Latin America: Analytics of Things Market Size, By Analytics Type, 2015�2022 (USD Million)
Table 96 Latin America: Market Size, By Deployment Model, 2015�2022 (USD Million)
Table 97 Latin America: Market Size, By Organization Size, 2015�2022 (USD Million)
Table 98 Latin America: Market Size, By Industry Vertical, 2015�2022 (USD Million)
Table 99 Market Ranking for Analytics of Things Market, 2017
List of Figures (37 Figures)
Figure 1 Iot Analytics Market: Market Segmentation
Figure 2 Regional Scope
Figure 3 Iot Analytics Market: Research Design
Figure 4 Breakdown Of Primary Interviews: By Company, Designation, And Region
Figure 5 Data Triangulation
Figure 6 Market Size Estimation Methodology: Bottom-Up Approach
Figure 7 Market Size Estimation Methodology: Top-Down Approach
Figure 8 Iot Analytics Market: Assumptions
Figure 9 Iot Analytics Market Is Poised To Witness Growth In The Global Market For The Period 2017�2022
Figure 10 Iot Analytics Market Snapshot, By Component (2017 Vs. 2022)
Figure 11 Iot Analytics Market Snapshot, By Service (2017�2022)
Figure 12 Iot Analytics Market Snapshot, By Application (2017 Vs. 2022)
Figure 13 Iot Analytics Market Snapshot, By Deployment Model (2017 Vs. 2022)
Figure 14 Iot Analytics Market Snapshot, By Analytics Type (2017 Vs. 2022)
Figure 15 Iot Analytics Market Snapshot, By Organization Size (2017 Vs. 2022)
Figure 16 Iot Analytics Market Snapshot, By Industry Vertical (2017 Vs. 2022)
Figure 17 Need To Generate Valuable Insights From Iot Data And The Availability Of Custom Aot Applications Are Driving The Iot Analytics Market Growth
Figure 18 North America Is Expected To Have The Largest Market Share In 2017 Because Of Early Adoption Of Iot Analytics Software And Services In The Region
Figure 19 Manufacturing Industry Vertical And North America Are Expected To Have The Largest Market Sizes In 2017
Figure 20 Asia Pacific Is Expected To Have An Exponential Growth During The Forecast Period
Figure 21 Iot Analytics Market: Drivers, Restraints, Opportunities, And Challenges
Figure 22 Iot Analytics Architecture
Figure 23 Inventory Management Application Segment Is Expected To Grow At The Highest Cagr During The Forecast Period
Figure 24 Services Segment Is Expected To Grow At A Higher Cagr During The Forecast Period
Figure 25 Iot Gateway Analytics Is Expected To Have The Highest Cagr During The Forecast Period
Figure 26 Managed Services Subsegment Is Expected To Grow At A Higher Cagr During The Forecast Period
Figure 27 Consulting Services Segment Is Expected To Grow At A Higher Cagr During The Forecast Period
Figure 28 Descriptive Analytics Type Is Expected To Grow At The Highest Cagr During The Forecast Period
Figure 29 Cloud Deployment Model Is Expected To Grow At A Higher Cagr During The Forecast Period
Figure 30 Small And Medium-Sized Enterprises Segment Is Expected To Grow At A Higher Cagr During The Forecast Period
Figure 31 Healthcare And Life Sciences Industry Vertical Is Expected To Grow At The Highest Cagr During The Forecast Period
Figure 32 Geographic Snapshot: Asia Pacific Is Expected To Have The Highest Cagr In The Iot Analytics Market During The Forecast Period
Figure 33 Apac Is Projected To Have The Highest Growth Rate In The Iot Analytics Market
Figure 34 North America: Market Snapshot
Figure 35 Asia Pacific: Market Snapshot
Figure 36 Iot Analytics Market (Global) Competitive Leadership Mapping, 2017
Figure 37 Ibm: Company Snapshot
The IoT Analytics market size is expected to grow from USD 7.19 Billion in 2017 to USD 27.78 Billion by 2022, at a Compound Annual Growth Rate (CAGR) of 31.0%. The report segments the market by application, component, analytics type, deployment model, organization size, industry vertical, and region. The major growth drivers of the IoT Analytics market include tremendous growth of Internet of Things (IoT) data and the need for advanced analytics and automation of businesses. The base year considered for this report is 2016, and the market forecast period is 2017�2022.
Objectives of the Study
The main objective of the report is to define, describe, and forecast the global IoT Analytics market on the basis of applications, components, analytics types, deployment models, organization sizes, industry verticals, and regions. The report provides detailed information regarding the major factors influencing the growth of the market (drivers, restraints, opportunities, and industry-specific challenges). The report aims to strategically analyze micromarkets with respect to individual growth trends, future prospects, and contributions to the total market. The report attempts to forecast the market size with respect to five main regions, namely, North America, Europe, Asia Pacific (APAC), Middle East and Africa (MEA), and Latin America. The report strategically profiles key players and comprehensively analyzes their core competencies. It also tracks and analyzes competitive developments, such as partnerships, collaborations, and agreements; mergers and acquisitions; new product launches and new product developments; and Research and Development (R&D) activities in the IoT Analytics market.
Research Methodology
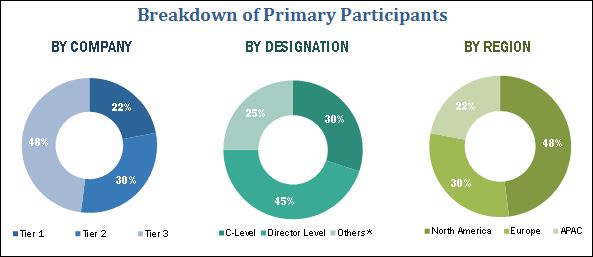
The research methodology used to estimate and forecast the market begins with capturing data on key vendor revenues through secondary research, which includes directories and databases (D&B Hoovers, Bloomberg Businessweek, and Factiva). The vendor offerings have also been taken into consideration to determine the market segmentation. The bottom-up procedure was employed to arrive at the overall market size of the global IoT Analytics market that was derived from the revenue of the key players in the market. After arriving at the overall market size, the total market was split into several segments and subsegments, which were then verified through primary research by conducting extensive interviews with key people, such as Chief Executive Officers (CEOs), Vice Presidents (VPs), directors, and executives. The data triangulation and market breakdown procedures were employed to complete the overall market engineering process and arrive at the exact statistics for all segments and subsegments. The breakdown of profiles of primary participants is depicted in the figure below:
To know about the assumptions considered for the study, download the pdf brochure
The IoT Analytics ecosystem comprises vendors such as IBM Corporation (US), Microsoft Corporation (US), Oracle Corporation (US), SAP SE (Germany), Cisco Systems, Inc. (US), Dell Technologies, Inc. (US), Google, Inc., (US), Amazon Web Services (US), Hewlett Packard Enterprise Company (US), PTC, Inc. (US), Hitachi, Ltd. (Japan), Teradata Corporation (US), Salesforce.com, Inc. (US), and Greenwave Systems, Inc. (US). Other stakeholders of the IoT Analytics market include vendors, research organizations, network and system integrators, IoT Analytics managed service providers, Business Intelligence (BI) solution providers, marketing analytics executives, predictive analytics providers, third-party providers, and technology providers. These Analytics of Things Solutions Vendors are rated and listed by us on the basis of product quality, reliability, and their business strategy. Please visit 360Quadrants to see the vendor listing of Analytics of Things Solutions
IoT Analytics Key Target Audience
- Service providers and distributors
- IoT Analytics application builders
- Independent Software Vendors (ISVs)
- Analytics consulting companies
- Enterprises
- End-users
The study answers several questions for the stakeholders, primarily which market segments to focus on in the next 2�5 years for prioritizing efforts and investments.
Scope of the IoT Analytics Market Research Report
The research report categorizes the market to forecast the revenues and analyze trends in each of the following subsegments:
By Application
- Energy management
- Predictive maintenance and asset management
- Inventory management
- Security and emergency management
- Sales and customer management
- Building automation
- IT infrastructure management
- Remote monitoring
- Others (product and process management, and cost optimization)
By Component
- Software
- Sensor data analytics
- IoT gateway analytics
- Network management
- Services
- Managed services
- Professional services
- Consulting services
- Support and maintenance
By Analytics Type
- Predictive analytics
- Prescriptive analytics
- Descriptive analytics
By Deployment Model
- On-premises
- Cloud
IoT Analytics Market By Organization Size
- Small and Medium Enterprises (SMEs)
- Large enterprises
By Industry Vertical
- Manufacturing
- Retail and eCommerce
- Government and defense
- Healthcare and life sciences
- Energy and utilities
- Telecommunications and IT
- Transportation and logistics
- Others (outsourcing services, travel and hospitality, and education)
By Region
- North America
- Europe
- APAC
- Latin America
- MEA
Available Customizations
With the given market data, MarketsandMarkets offers customizations as per the company�s specific needs. The following customization options are available for the report:
Product Analysis
- Product matrix gives a detailed comparison of the product portfolio of each company
Geographic Analysis
- Further breakdown of the North American IoT Analytics market
- Further breakdown of the European market
- Further breakdown of the APAC market
- Further breakdown of the Latin American market
- Further breakdown of the MEA market
Company Information
- Detailed analysis and profiling of additional market players upto 5.


Growth opportunities and latent adjacency in IoT Analytics Market
I am interested in knowing more about the IoT analytics use cases