Customer Analytics Market by Component, Deployment Mode, Organization Size, Application (Campaign Management, Customer Behavioral Analysis, and Churn Management), Data Source, Industry Vertical, and Region - Global Forecast to 2025


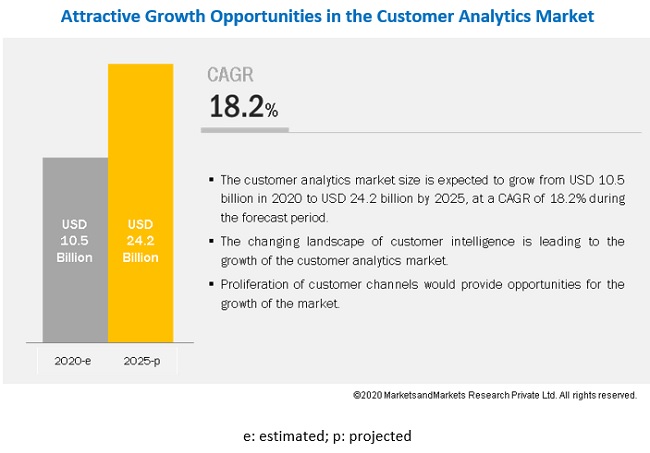
[236 Pages Report] The customer analytics market size is projected to grow from USD 10.5 billion in 2020 to USD 24.2 billion by 2025, at a Compound Annual Growth Rate (CAGR) of 18.2% during the forecast period. The major factors driving the growth of customer analytics market include the need to understand customer buying behavior for a more personalized customer experience and advent of technologies, such as Artificial Intelligence (AI), Machine Learning (ML), and business process automation to streamline marketing operations.
Cloud deployment mode to grow at a rapid pace during the forecast period
Cloud solutions are Software as a Service (SaaS) solutions are provided by a service provider within their data centers or other facilities. These solutions are usually accessible through the internet and can be accessed from anywhere, whenever required. The cloud solutions facilitate various advantages, including scalability, adaptability, easy deployment, and cost-effectiveness, which promote the adoption of cloud deployment across organizations. The low cost and ease of implementation have made cloud a highly desirable delivery mode among the organizations. Small and Medium-sized Enterprises (SMEs) tend to adopt cloud-based solutions as compared to on-premises ones owing to its cost factor, and 24x7 support and maintenance provided by the software vendors. Majority of the vendors in this market offer cloud-based customer analytics solutions to lure the customers.
Product management to expand at the highest CAGR during the forecast period
A vast amount of product-related information, such as product features, functions, prices, and delivery related data is generated during customer journeys. This helps customers across journeys to provide valuable information regarding product features, functionalities, prices, and delivery models. Customer analytics helps analyze the customers� purchasing behavior, which provides information about product categories that are not performing well. Large organizations invest significant amounts of capital on product management to cater to the customers in a better way and enhance their experience. Marketers easily analyze the customer behavior toward their products and services, and make necessary changes to retain them. Customer analytics helps alter these strategies in real-time and move ahead of the competitors. Marketers can adopt pricing, product development, or addition of new purchase options, based on the information gathered through customer journey mapping.
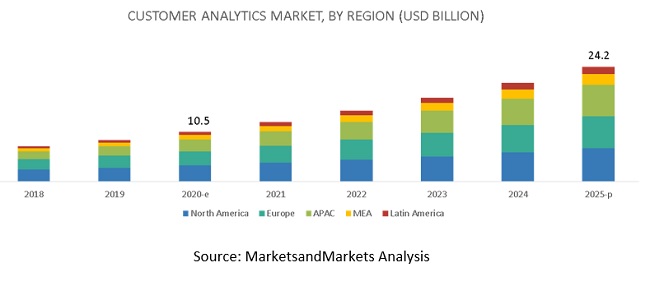
North America to hold the largest market size during the forecast period
North America is expected to hold the largest share in the global customer analytics market, while Asia Pacific (APAC) is expected to grow at the highest CAGR during the forecast period. The region is led by the US and Canada, where organizations are have deployed customer analytics solutions to utilize customer data to stay competitive in the market. Rising customer information through numerous data sources is forcing new development and better integrations in new and existing customer analytics solutions and services to cater to various business and customer needs. Also, North America is home to multiple customer analytics solution vendors, such as Google, Adobe, SAP, Microsoft, Oracle, and Salesforce. These companies are targeting higher revenue and business expansions due to high competition and demand prevailing across the North American region. Organizations in North America focus on innovations to keep pace with the latest advancements in the market.
Key market players
Major vendors in the global customer analytics market include Google (US), Microsoft (US), Adobe (US), SAP (Germany), SAS Institute (US), Teradata (US), Oracle (US), Salesforce (US), Mixpanel (US), Manthan System (India), Second Measure (US), Absolute Data (US), NGData (Belgium), Customer Analytics (US), Neustar (US), NICE Systems (Israel), Segment (US), Calibremind (US), Clarity Insight (US), and Amperity (US). These vendors have adopted various organic and inorganic growth strategies, such as new product launches, partnerships and collaborations, and mergers and acquisitions, to expand their presence in the global customer analytics market.
Salesforce is one of the global providers of the Customer Relationship Management (CRM) technology that helps companies to improve their relationships and interactions with customers. On June 2019, Salesforce acquired Tableau, a leading provider of analytical data, which would strengthen the Salesforce Customer 360 platform, enabling customers to make smarter decisions. The integrated platform provides a single share view of every customer across departments, such as marketing, sales, commerce, and services. Salesforce has a community of over 10 million innovators, disruptors, and community shapers who are called as Trailblazers. The company offers a wide range of products and services across segments, which include sales, services, marketing, application, analytics, employee experience, trailblazers and reskilling, and enablement and collaboration, most of which operate on a single trusted cloud platform. Its service offerings can be easily deployed through mobile devices and internet browsers, and can be integrated with other platforms and enterprise applications. Salesforce offers the cross-cloud technology, Salesforce 360, which helps its customers to have a single integrated holistic customer profile for various departments. As on January 31, 2019, the company had more than 36,000 employees. It offers customer analytics solutions through the Salesforce Marketing Cloud, a platform for delivering relevant, personalized journeys across channels and devices, thus � enabling marketers to deliver the right message at the right time throughout all phases of the relationship.
Scope of the Report
|
Report Metric |
Details |
|
Market size available for years |
2018�2025 |
|
Base year considered |
2019 |
|
Forecast period |
2020�2025 |
|
Forecast units |
Value (USD) |
|
Segments covered |
Component, Deployment Mode, Organization Size, Application, Industry Vertical, Data Source and Region |
|
Geographies covered |
North America, Europe, APAC, Latin America, and MEA |
|
Companies covered |
Google (US), Microsoft (US), Adobe (US), SAP (Germany), SAS Institute (US), Teradata (US), Oracle (US), Salesforce (US), Mixpanel (US), Manthan System (India), Second Measure (US), Absolute Data (US), NGData (Belgium), Customer Analytics (US), Neustar (US), NICE Systems (Israel), Segment (US), Calibremind (US), Clarity Insight(US), and Amperity (US) |
This research report categorizes the market based on component, deployment mode, organization size, application, data source, industry vertical, and region.
By component, the customer analytics market is segmented into:
- Component
- Solutions
- Services
- Services
- Consulting Services
- Support and Maintenance
- Education and Training
- Integration and Deployment
By deployment mode, the customer analytics market is segmented into:
- On-premises
- Cloud
By organization size, the customer analytics market is divided into the following segments:
- Large Enterprises
- Small and Medium-Sized Enterprises (SMEs)
By Application, the customer analytics market is segmented into:
- Brand Management
- Campaign Management
- Churn Management
- Customer Behavioral Analysis
- Product Management
- Others*
By Data Source, the customer analytics market is segmented into:
- Web
- Social Media
- Smartphone
- Store
- Call Center
- Others*
By industry vertical, the customer analytics market is divided into the following segments:
- Banking, Financial Services, and Insurance (BFSI)
- Retail and eCommerce
- Telecommunications and IT
- Energy and Utilities
- Manufacturing
- Transportation and Logistics
- Government and Defense
- Healthcare and Life Sciences
- Media and Entertainment
- Travel and Hospitality
- Others*
By region, the customer analytics market is divided into the following segments:
- North America
- United States (US)
- Canada
- Europe
- United Kingdom (UK)
- Germany
- France
- Spain
- Rest of Europe
- Asia Pacific (APAC)
- China
- Singapore
- Australia and New Zealand (ANZ)
- India
- Rest of APAC
- Middle East and Africa (MEA)
- Kingdom of Saudi Arabia (KSA)
- United Arab Emirates (UAE)
- South Africa
- Rest of MEA
- Latin America
- Brazil
- Mexico
- Rest of Latin America
Critical questions the report answers
- What are the current trends driving the customer analytics market?
- In which vertical are most industrial companies deploying customer analytics solutions?
- Where will recent developments of market vendors take the industry in the mid- to long-term?
- Who are the top vendors in the market, and what is their competitive analysis?
- What are the drivers and challenges faced by vendors in the market?
Frequently Asked Questions (FAQ):
How big is the Customer Analytics Market?
The global customer analytics market size was estimated at 10.5 billion in 2020 and is expected to reach USD 24.2 billion by 2025.
What is the Customer Analytics Market Growth?
The global customer analytics market is expected to grow at a compound annual growth rate of 18.2% from 2020 to 2025 to reach USD 24.2 billion by 2025.
What are the top companies providing Customer Analytics Market?
Google (US), Microsoft (US), Adobe (US), SAP (Germany), SAS Institute (US), Teradata (US), Oracle (US), Salesforce (US), Mixpanel (US), Manthan System (India), Second Measure (US), Absolute Data (US), NGData (Belgium), Customer Analytics (US), Neustar (US), NICE Systems (Israel), Segment (US), Calibremind (US), Clarity Insight (US), and Amperity (US)are the major vendors of customer analytics market.
What are the top industries adopting Customer Analytics Market?
The major industries adopting Customer Analytics Market areBFSI,Retail and eCommerceTelecommunications and IT,Energy and Utilities, Manufacturing,Transportation and Logistics,Government and Defense,Healthcare and Life Sciences, Media and Entertainment,and Travel and Hospitality.
Which region is expected to have highest growth rate in the Customer AnalyticsMarket?
APAC region is expected to grow at the highest growth rate during the forecast period.This growth of the customer analytics market in APAC can be attributed to the large populations, with diversified perceptions pertaining to their purchases.
What is the major factor driving the growth ofCustomer Analytics Market?
The major factors driving the growth of customer analytics market include the need to understand customer buying behavior for a more personalized customer experience and advent of technologies, such as Artificial Intelligence (AI), Machine Learning (ML), and business process automation to streamline marketing operations. .
To speak to our analyst for a discussion on the above findings, click Speak to Analyst
 Exclusive indicates content/data unique to MarketsandMarkets and not available with any competitors.
TABLE OF CONTENTS
1 INTRODUCTION (Page No. - 22)
1.1 OBJECTIVES OF THE STUDY
1.2 MARKET DEFINITION
1.2.1 INCLUSIONS AND EXCLUSIONS
1.3 MARKET SCOPE
1.3.1 MARKET SEGMENTATION
1.3.2 REGIONS COVERED
1.3.3 YEARS CONSIDERED FOR THE STUDY
1.4 CURRENCY CONSIDERED
1.5 STAKEHOLDERS
2 RESEARCH METHODOLOGY (Page No. - 26)
2.1 RESEARCH DATA
2.1.1 SECONDARY DATA
2.1.2 PRIMARY DATA
2.1.2.1 Breakup of primary profiles
2.1.2.2 Key industry insights
2.2 MARKET BREAKUP AND DATA TRIANGULATION
2.3 MARKET SIZE ESTIMATION
2.3.1 TOP-DOWN APPROACH
2.3.2 BOTTOM-UP APPROACH
2.4 MARKET FORECAST
2.5 COMPETITIVE LEADERSHIP MAPPING RESEARCH METHODOLOGY
2.5.1 VENDOR INCLUSION CRITERIA
2.6 ASSUMPTIONS FOR THE STUDY
2.7 LIMITATIONS OF THE STUDY
3 EXECUTIVE SUMMARY (Page No. - 37)
4 PREMIUM INSIGHTS (Page No. - 42)
4.1 ATTRACTIVE OPPORTUNITIES IN THE MARKET
4.2 TOP 3 APPLICATIONS
4.3 CUSTOMER ANALYTICS MARKET, BY REGION
4.4 CUSTOMER ANALYTICS MARKET IN NORTH AMERICA, BY APPLICATION AND INDUSTRY VERTICAL
5 MARKET OVERVIEW AND INDUSTRY TRENDS (Page No. - 45)
5.1 INTRODUCTION
5.2 MARKET DYNAMICS
5.2.1 DRIVERS
5.2.1.1 Need to understand customer buying behavior for a more personalized customer experience
5.2.1.2 Technologies such as AI, ML, and business process automation to streamline marketing operations
5.2.2 RESTRAINTS
5.2.2.1 Data privacy laws and protection of customer data critical for customer analytics
5.2.3 OPPORTUNITIES
5.2.3.1 Reduced advertising, campaigning, and marketing costs
5.2.3.2 Greater collaboration between departments for better and faster decision making
5.2.4 CHALLENGES
5.2.4.1 Organizational failures pertaining to optimum use of customer data
5.2.4.2 Inability to understand customer journey
5.3 INDUSTRY TRENDS
5.3.1 USE CASES
5.3.1.1 Use case 1: Increasing sales with advanced analytics
5.3.1.2 Use case 2: Enhance customer engagement using real-time personalized communication
5.3.1.3 Use case 3: Real-time predictability, informed decision-making, and connected users across departments using system of insight solution
5.3.1.4 Use case 4: To deliver an enhanced experience to its customers when booking travel
5.3.1.5 Use case 5: To monitor and analyze trending content to increase customer engagements
5.3.1.6 Use case 6: To provide account managers with tools to boost sales and productivity
5.3.1.7 Use case 7: Enhancing Customer Experience With Cognitive Services
5.4 REGULATORY IMPLICATIONS
5.4.1 GENERAL DATA PROTECTION REGULATION
5.4.2 UNITED STATES SECURITIES AND EXCHANGE COMMISSION
5.4.3 COMPREHENSIVE CAPITAL ANALYSIS AND REVIEW
5.4.4 DODD-FRANK ACT
5.4.5 PAYMENT CARD INDUSTRY DATA SECURITY STANDARD
5.4.6 THE INTERNATIONAL ORGANIZATION FOR STANDARDIZATION 27001
5.4.7 CALIFORNIA CONSUMER PRIVACY ACT
5.4.8 HEALTH INSURANCE PORTABILITY AND ACCOUNTABILITY ACT OF 1996
5.4.9 HEALTH INFORMATION TECHNOLOGY FOR ECONOMIC AND CLINICAL HEALTH ACT
5.4.10 EUROPEAN MARKET INFRASTRUCTURE REGULATION
5.4.11 BASEL COMMITTEE ON BANKING SUPERVISION 239 COMPLIANCE
5.4.12 SARBANES-OXLEY ACT OF 2002
5.4.13 PERSONAL DATA PROTECTION ACT
6 CUSTOMER ANALYTICS MARKET, BY COMPONENT (Page No. - 58)
6.1 INTRODUCTION
6.1.1 COMPONENT: MARKET DRIVERS
6.2 SOLUTIONS
6.2.1 DATA MANAGEMENT/EXTRACT, TRANSFORM, LOAD
6.2.2 VOICE OF CUSTOMER
6.2.3 SOCIAL MEDIA ANALYTICS
6.2.4 ANALYTICAL TOOLS
6.2.5 DASHBOARD AND REPORTING
6.3 SERVICES
6.3.1 PROFESSIONAL SERVICES
6.3.1.1 Consulting
6.3.1.2 Integration and deployment
6.3.1.3 Support and maintenance
6.3.1.4 Education and training
6.3.2 MANAGED SERVICES
7 CUSTOMER ANALYTICS MARKET, BY DEPLOYMENT MODE (Page No. - 73)
7.1 INTRODUCTION
7.1.1 DEPLOYMENT MODE: MARKET DRIVERS
7.2 CLOUD
7.3 ON-PREMISES
8 CUSTOMER ANALYTICS MARKET, BY ORGANIZATION SIZE (Page No. - 77)
8.1 INTRODUCTION
8.1.1 ORGANIZATION SIZE: MARKET DRIVERS
8.2 LARGE ENTERPRISES
8.3 SMALL AND MEDIUM-SIZED ENTERPRISES
9 CUSTOMER ANALYTICS MARKET, BY APPLICATION (Page No. - 81)
9.1 INTRODUCTION
9.1.1 APPLICATION: MARKET DRIVERS
9.2 BRAND MANAGEMENT
9.3 CAMPAIGN MANAGEMENT
9.4 CHURN MANAGEMENT
9.5 CUSTOMER BEHAVIORAL ANALYSIS
9.6 PRODUCT MANAGEMENT
9.7 OTHERS
10 CUSTOMER ANALYTICS MARKET, BY DATA SOURCE (Page No. - 89)
10.1 INTRODUCTION
10.1.1 DATA SOURCE: MARKET DRIVERS
10.2 WEB
10.3 SOCIAL MEDIA
10.4 SMARTPHONE
10.5 EMAIL
10.6 STORE
10.7 CALL CENTER
10.8 OTHER DATA SOURCES
11 CUSTOMER ANALYTICS MARKET, BY INDUSTRY VERTICAL (Page No. - 97)
11.1 INTRODUCTION
11.1.1 INDUSTRY VERTICAL: MARKET DRIVERS
11.2 BANKING, FINANCIAL SERVICES, AND INSURANCE
11.3 RETAIL AND ECOMMERCE
11.4 TELECOMMUNICATIONS AND INFORMATION TECHNOLOGY
11.5 ENERGY AND UTILITIES
11.6 MANUFACTURING
11.7 TRANSPORTATION AND LOGISTICS
11.8 GOVERNMENT AND DEFENSE
11.9 HEALTHCARE AND LIFE SCIENCES
11.10 MEDIA AND ENTERTAINMENT
11.11 TRAVEL AND HOSPITALITY
11.12 OTHER INDUSTRY VERTICALS
12 CUSTOMER ANALYTICS MARKET, BY REGION (Page No. - 111)
12.1 INTRODUCTION
12.2 NORTH AMERICA
12.2.1 NORTH AMERICA: MARKET DRIVERS
12.2.2 UNITED STATES
12.2.3 CANADA
12.3 EUROPE
12.3.1 EUROPE: MARKET DRIVERS
12.3.2 UNITED KINGDOM
12.3.3 SPAIN
12.3.4 GERMANY
12.3.5 FRANCE
12.3.6 REST OF EUROPE
12.4 ASIA PACIFIC
12.4.1 ASIA PACIFIC: MARKET DRIVERS
12.4.2 CHINA
12.4.3 SINGAPORE
12.4.4 INDIA
12.4.5 AUSTRALIA AND NEW ZEALAND
12.4.6 REST OF ASIA PACIFIC
12.5 MIDDLE EAST AND AFRICA
12.5.1 MIDDLE EAST AND AFRICA: MARKET DRIVERS
12.5.2 KINGDOM OF SAUDI ARABIA
12.5.3 UNITED ARAB EMIRATES
12.5.4 SOUTH AFRICA
12.5.5 REST OF MIDDLE EAST AND AFRICA
12.6 LATIN AMERICA
12.6.1 LATIN AMERICA: MARKET DRIVERS
12.6.2 BRAZIL
12.6.3 MEXICO
12.6.4 ARGENTINA
12.6.5 REST OF LATIN AMERICA
13 COMPETITIVE LANDSCAPE (Page No. - 177)
13.1 INTRODUCTION
13.2 COMPETITIVE LEADERSHIP MAPPING
13.2.1 VISIONARIES
13.2.2 INNOVATORS
13.2.3 DYNAMIC DIFFERENTIATORS
13.2.4 EMERGING COMPANIES
13.3 STRENGTH OF PRODUCT PORTFOLIO
13.4 BUSINESS STRATEGY EXCELLENCE
14 COMPANY PROFILES (Page No. - 181)
14.1 INTRODUCTION
(Business Overview, Platforms, Solutions & Services, Key Insights, Recent Developments, SWOT Analysis, )*
14.2 GOOGLE
14.3 ADOBE
14.4 SAP
14.5 MICROSOFT
14.6 ORACLE
14.7 SALESFORCE
14.8 SAS INSTITUTE
14.9 TERADATA
14.1 NICE
14.11 MANTHAN
14.12 MIXPANEL
14.13 CUSTOMER ANALYTICS
14.14 CLARITY INSIGHTS (ACCENTURE APPLIED INTELLIGENCE)
14.15 ABSOLUTDATA ANALYTICS
14.16 NGDATA
14.17 NEUSTAR
14.18 SEGMENT
14.19 SECOND MEASURE
14.20 CALIBERMIND
14.21 AMPERITY
*Details on Business Overview, Platforms, Solutions & Services, Key Insights, Recent Developments, SWOT Analysis, might not be captured in case of unlisted companies.
14.22 RIGHT TO WIN
15 APPENDIX (Page No. - 229)
15.1 DISCUSSION GUIDE
15.2 KNOWLEDGE STORE: MARKETSANDMARKETS� SUBSCRIPTION PORTAL
15.3 AVAILABLE CUSTOMIZATION
15.4 RELATED REPORTS
15.5 AUTHOR DETAILS
LIST OF TABLES (145 Tables)
TABLE 1 UNITED STATES DOLLAR EXCHANGE RATE, 2017�2019
TABLE 2 FACTOR ANALYSIS
TABLE 3 EVALUATION CRITERIA
TABLE 4 CUSTOMER ANALYTICS MARKET SIZE AND GROWTH, 2018�2025 (USD MILLION)
TABLE 5 MARKET SIZE, BY COMPONENT, 2018�2025 (USD MILLION)
TABLE 6 SOLUTIONS: MARKET SIZE, BY TYPE, 2018�2025 (USD MILLION)
TABLE 7 SOLUTIONS: MARKET SIZE, BY REGION, 2018�2025 (USD MILLION)
TABLE 8 DATA MANAGEMENT/ EXTRACT, TRANSFORM, LOAD MARKET SIZE, BY REGION, 2018�2025 (USD MILLION)
TABLE 9 VOICE OF CUSTOMER MARKET SIZE, BY REGION, 2018�2025 (USD MILLION)
TABLE 10 SOCIAL MEDIA ANALYTICS MARKET SIZE, BY REGION, 2018�2025 (USD MILLION)
TABLE 11 ANALYTICAL TOOLS MARKET SIZE, BY REGION, 2018�2025 (USD MILLION)
TABLE 12 DASHBOARD AND REPORTING MARKET SIZE, BY REGION, 2018�2025 (USD MILLION)
TABLE 13 SERVICES: CUSTOMER ANALYTICS MARKET SIZE, BY TYPE, 2018�2025 (USD MILLION)
TABLE 14 SERVICES: MARKET SIZE, BY REGION, 2018�2025 (USD MILLION)
TABLE 15 PROFESSIONAL SERVICES MARKET SIZE, BY TYPE, 2018�2025 (USD MILLION)
TABLE 16 PROFESSIONAL SERVICES MARKET SIZE, BY REGION, 2018�2025 (USD MILLION)
TABLE 17 CONSULTING MARKET SIZE, BY REGION, 2018�2025 (USD MILLION)
TABLE 18 INTEGRATION AND DEPLOYMENT MARKET SIZE, BY REGION, 2018�2025 (USD MILLION)
TABLE 19 SUPPORT AND MAINTENANCE MARKET SIZE, BY REGION, 2018�2025 (USD MILLION)
TABLE 20 EDUCATION AND TRAINING MARKET SIZE, BY REGION, 2018�2025 (USD MILLION)
TABLE 21 MANAGED SERVICES MARKET SIZE, BY REGION, 2018�2025 (USD MILLION)
TABLE 22 CUSTOMER ANALYTICS MARKET SIZE, BY DEPLOYMENT MODE, 2018�2025 (USD MILLION)
TABLE 23 CLOUD: MARKET SIZE, BY REGION, 2018�2025 (USD MILLION)
TABLE 24 ON-PREMISES: MARKET SIZE, BY REGION, 2018�2025 (USD MILLION)
TABLE 25 CUSTOMER ANALYTICS MARKET SIZE, BY ORGANIZATION SIZE, 2018�2025 (USD MILLION)
TABLE 26 LARGE ENTERPRISES: MARKET SIZE, BY REGION, 2018�2025 (USD MILLION)
TABLE 27 SMALL AND MEDIUM-SIZED ENTERPRISES: MARKET SIZE, BY REGION, 2018�2025 (USD MILLION)
TABLE 28 CUSTOMER ANALYTICS MARKET SIZE, BY APPLICATION, 2018�2025 (USD MILLION)
TABLE 29 BRAND MANAGEMENT: MARKET SIZE, BY REGION, 2018�2025 (USD MILLION)
TABLE 30 CAMPAIGN MANAGEMENT: MARKET SIZE, BY REGION, 2018�2025 (USD MILLION)
TABLE 31 CHURN MANAGEMENT: MARKET SIZE, BY REGION, 2018�2025 (USD MILLION)
TABLE 32 CUSTOMER BEHAVIORAL ANALYSIS: MARKET SIZE, BY REGION, 2018�2025 (USD MILLION)
TABLE 33 PRODUCT MANAGEMENT: MARKET SIZE, BY REGION, 2018�2025 (USD MILLION)
TABLE 34 OTHERS: MARKET SIZE, BY REGION, 2018�2025 (USD MILLION)
TABLE 35 CUSTOMER ANALYTICS MARKET SIZE, BY DATA SOURCE, 2018�2025 (USD MILLION)
TABLE 36 WEB: MARKET SIZE, BY REGION, 2018�2025 (USD MILLION)
TABLE 37 SOCIAL MEDIA: MARKET SIZE, BY REGION, 2018�2025 (USD MILLION)
TABLE 38 SMARTPHONE: MARKET SIZE, BY REGION, 2018�2025 (USD MILLION)
TABLE 39 EMAIL: MARKET SIZE, BY REGION, 2018�2025 (USD MILLION)
TABLE 40 STORE: MARKET SIZE, BY REGION, 2018�2025 (USD MILLION)
TABLE 41 CALL CENTER: MARKET SIZE, BY REGION, 2018�2025 (USD MILLION)
TABLE 42 OTHER DATA SOURCES: MARKET SIZE, BY REGION, 2018�2025 (USD MILLION)
TABLE 43 CUSTOMER ANALYTICS MARKET SIZE, BY INDUSTRY VERTICAL, 2018�2025 (USD MILLION)
TABLE 44 BANKING, FINANCIAL SERVICES, AND INSURANCE: MARKET SIZE, BY REGION, 2018�2025 (USD MILLION)
TABLE 45 RETAIL AND ECOMMERCE: MARKET SIZE, BY REGION, 2018�2025 (USD MILLION)
TABLE 46 TELECOMMUNICATIONS AND INFORMATION AND TECHNOLOGY: MARKET SIZE, BY REGION, 2018�2025 (USD MILLION)
TABLE 47 ENERGY AND UTILITIES: MARKET SIZE, BY REGION, 2018�2025 (USD MILLION)
TABLE 48 MANUFACTURING: MARKET SIZE, BY REGION, 2018�2025 (USD MILLION)
TABLE 49 TRANSPORTATION AND LOGISTICS: MARKET SIZE, BY REGION, 2018�2025 (USD MILLION)
TABLE 50 GOVERNMENT AND DEFENSE: MARKET SIZE, BY REGION, 2018�2025 (USD MILLION)
TABLE 51 HEALTHCARE AND LIFE SCIENCES: MARKET SIZE, BY REGION, 2018�2025 (USD MILLION)
TABLE 52 MEDIA AND ENTERTAINMENT: MARKET SIZE, BY REGION, 2018�2025 (USD MILLION)
TABLE 53 TRAVEL AND HOSPITALITY: MARKET SIZE, BY REGION, 2018�2025 (USD MILLION)
TABLE 54 OTHER INDUSTRY VERTICALS: MARKET SIZE, BY REGION, 2018�2025 (USD MILLION)
TABLE 55 CUSTOMER ANALYTICS MARKET SIZE, BY REGION, 2018�2025 (USD MILLION)
TABLE 56 NORTH AMERICA: MARKET SIZE, BY COMPONENT, 2018�2025 (USD MILLION)
TABLE 57 NORTH AMERICA: MARKET SIZE, BY SOLUTION, 2018�2025 (USD MILLION)
TABLE 58 NORTH AMERICA: MARKET SIZE, BY SERVICE, 2018�2025 (USD MILLION)
TABLE 59 NORTH AMERICA: MARKET SIZE, BY PROFESSIONAL SERVICE, 2018�2025 (USD MILLION)
TABLE 60 NORTH AMERICA: MARKET SIZE, BY DEPLOYMENT MODE, 2018�2025 (USD MILLION)
TABLE 61 NORTH AMERICA: MARKET SIZE, BY ORGANIZATION SIZE, 2018�2025 (USD MILLION)
TABLE 62 NORTH AMERICA: MARKET SIZE, BY APPLICATION, 2018�2025 (USD MILLION)
TABLE 63 NORTH AMERICA: MARKET SIZE, BY DATA SOURCE, 2018�2025 (USD MILLION)
TABLE 64 NORTH AMERICA: MARKET SIZE, BY INDUSTRY VERTICAL, 2018�2025 (USD MILLION)
TABLE 65 NORTH AMERICA: MARKET SIZE, BY COUNTRY, 2018�2025 (USD MILLION)
TABLE 66 UNITED STATES: CUSTOMER ANALYTICS MARKET SIZE, BY INDUSTRY VERTICAL, 2018�2025 (USD MILLION)
TABLE 67 UNITED STATES: MARKET SIZE, BY APPLICATION, 2018�2025 (USD MILLION)
TABLE 68 CANADA: MARKET SIZE, BY INDUSTRY VERTICAL, 2018�2025 (USD MILLION)
TABLE 69 CANADA: MARKET SIZE, BY APPLICATION, 2018�2025 (USD MILLION)
TABLE 70 EUROPE: CUSTOMER ANALYTICS MARKET SIZE, BY COMPONENT, 2018�2025 (USD MILLION)
TABLE 71 EUROPE: MARKET SIZE, BY SOLUTION, 2018�2025 (USD MILLION)
TABLE 72 EUROPE: MARKET SIZE, BY SERVICE, 2018�2025 (USD MILLION)
TABLE 73 EUROPE: MARKET SIZE, BY PROFESSIONAL SERVICE, 2018�2025 (USD MILLION)
TABLE 74 EUROPE: MARKET SIZE, BY DEPLOYMENT MODE, 2018�2025 (USD MILLION)
TABLE 75 EUROPE: MARKET SIZE, BY ORGANIZATION SIZE, 2018�2025 (USD MILLION)
TABLE 76 EUROPE: MARKET SIZE, BY APPLICATION, 2018�2025 (USD MILLION)
TABLE 77 EUROPE: MARKET SIZE, BY DATA SOURCE, 2018�2025 (USD MILLION)
TABLE 78 EUROPE: MARKET SIZE, BY INDUSTRY VERTICAL, 2018�2025 (USD MILLION)
TABLE 79 EUROPE: MARKET SIZE, BY COUNTRY, 2018�2025 (USD MILLION)
TABLE 80 UNITED KINGDOM: MARKET SIZE, BY INDUSTRY VERTICAL, 2018�2025 (USD MILLION)
TABLE 81 UNITED KINGDOM: MARKET SIZE, BY APPLICATION, 2018�2025 (USD MILLION)
TABLE 82 SPAIN: MARKET SIZE, BY INDUSTRY VERTICAL, 2018�2025 (USD MILLION)
TABLE 83 SPAIN: MARKET SIZE, BY APPLICATION, 2018�2025 (USD MILLION)
TABLE 84 GERMANY: MARKET SIZE, BY INDUSTRY VERTICAL, 2018�2025 (USD MILLION)
TABLE 85 GERMANY: MARKET SIZE, BY APPLICATION, 2018�2025 (USD MILLION)
TABLE 86 FRANCE: MARKET SIZE, BY INDUSTRY VERTICAL, 2018�2025 (USD MILLION)
TABLE 87 FRANCE: MARKET SIZE, BY APPLICATION, 2018�2025 (USD MILLION)
TABLE 88 REST OF EUROPE: MARKET SIZE, BY INDUSTRY VERTICAL, 2018�2025 (USD MILLION)
TABLE 89 REST OF EUROPE: MARKET SIZE, BY APPLICATION, 2018�2025 (USD MILLION)
TABLE 90 ASIA PACIFIC: CUSTOMER ANALYTICS MARKET SIZE, BY COMPONENT, 2018�2025 (USD MILLION)
TABLE 91 ASIA PACIFIC: MARKET SIZE, BY SOLUTION, 2018�2025 (USD MILLION)
TABLE 92 ASIA PACIFIC: MARKET SIZE, BY SERVICE, 2018�2025 (USD MILLION)
TABLE 93 ASIA PACIFIC: MARKET SIZE, BY PROFESSIONAL SERVICE, 2018�2025 (USD MILLION)
TABLE 94 ASIA PACIFIC: MARKET SIZE, BY DEPLOYMENT MODE, 2018�2025 (USD MILLION)
TABLE 95 ASIA PACIFIC: MARKET SIZE, BY ORGANIZATION SIZE, 2018�2025 (USD MILLION)
TABLE 96 ASIA PACIFIC: MARKET SIZE, BY APPLICATION, 2018�2025 (USD MILLION)
TABLE 97 ASIA PACIFIC: MARKET SIZE, BY DATA SOURCE, 2018�2025 (USD MILLION)
TABLE 98 ASIA PACIFIC: MARKET SIZE, BY INDUSTRY VERTICAL, 2018�2025 (USD MILLION)
TABLE 99 ASIA PACIFIC: MARKET SIZE, BY COUNTRY, 2018�2025 (USD MILLION)
TABLE 100 CHINA: MARKET SIZE, BY INDUSTRY VERTICAL, 2018�2025 (USD MILLION)
TABLE 101 CHINA: MARKET SIZE, BY APPLICATION, 2018�2025 (USD MILLION)
TABLE 102 SINGAPORE: MARKET SIZE, BY INDUSTRY VERTICAL, 2018�2025 (USD MILLION)
TABLE 103 SINGAPORE: MARKET SIZE, BY APPLICATION, 2018�2025 (USD MILLION)
TABLE 104 INDIA: MARKET SIZE, BY INDUSTRY VERTICAL, 2018�2025 (USD MILLION)
TABLE 105 INDIA: MARKET SIZE, BY APPLICATION, 2018�2025 (USD MILLION)
TABLE 106 AUSTRALIA AND NEW ZEALAND: MARKET SIZE, BY INDUSTRY VERTICAL, 2018�2025 (USD MILLION)
TABLE 107 AUSTRALIA AND NEW ZEALAND: MARKET SIZE, BY APPLICATION, 2018�2025 (USD MILLION)
TABLE 108 REST OF ASIA PACIFIC: MARKET SIZE, BY INDUSTRY VERTICAL, 2018�2025 (USD MILLION)
TABLE 109 REST OF ASIA PACIFIC: MARKET SIZE, BY APPLICATION, 2018�2025 (USD MILLION)
TABLE 110 MIDDLE EAST AND AFRICA: CUSTOMER ANALYTICS MARKET SIZE, BY COMPONENT, 2018�2025 (USD MILLION)
TABLE 111 MIDDLE EAST AND AFRICA: MARKET SIZE, BY SOLUTION, 2018�2025 (USD MILLION)
TABLE 112 MIDDLE EAST AND AFRICA: MARKET SIZE, BY SERVICE, 2018�2025 (USD MILLION)
TABLE 113 MIDDLE EAST AND AFRICA: MARKET SIZE, BY PROFESSIONAL SERVICE, 2018�2025 (USD MILLION)
TABLE 114 MIDDLE EAST AND AFRICA: MARKET SIZE, BY DEPLOYMENT MODE, 2018�2025 (USD MILLION)
TABLE 115 MIDDLE EAST AND AFRICA: MARKET SIZE, BY ORGANIZATION SIZE, 2018�2025 (USD MILLION)
TABLE 116 MIDDLE EAST AND AFRICA: MARKET SIZE, BY APPLICATION, 2018�2025 (USD MILLION)
TABLE 117 MIDDLE EAST AND AFRICA: MARKET SIZE, BY DATA SOURCE, 2018�2025 (USD MILLION)
TABLE 118 MIDDLE EAST AND AFRICA: MARKET SIZE, BY INDUSTRY VERTICAL, 2018�2025 (USD MILLION)
TABLE 119 MIDDLE EAST AND AFRICA: MARKET SIZE, BY COUNTRY, 2018�2025 (USD MILLION)
TABLE 120 KINGDOM OF SAUDI ARABIA: MARKET SIZE, BY INDUSTRY VERTICAL, 2018�2025 (USD MILLION)
TABLE 121 KINGDOM OF SAUDI ARABIA: MARKET SIZE, BY APPLICATION, 2018�2025 (USD MILLION)
TABLE 122 UNITED ARAB EMIRATES: MARKET SIZE, BY INDUSTRY VERTICAL, 2018�2025 (USD MILLION)
TABLE 123 UNITED ARAB EMIRATES: MARKET SIZE, BY APPLICATION, 2018�2025 (USD MILLION)
TABLE 124 SOUTH AFRICA: MARKET SIZE, BY INDUSTRY VERTICAL, 2018�2025 (USD MILLION)
TABLE 125 SOUTH AFRICA: MARKET SIZE, BY APPLICATION, 2018�2025 (USD MILLION)
TABLE 126 REST OF MIDDLE EAST AND AFRICA: MARKET SIZE, BY INDUSTRY VERTICAL, 2018�2025 (USD MILLION)
TABLE 127 REST OF MIDDLE EAST AND AFRICA: MARKET SIZE, BY APPLICATION, 2018�2025 (USD MILLION)
TABLE 128 LATIN AMERICA: CUSTOMER ANALYTICS MARKET SIZE, BY COMPONENT, 2018�2025 (USD MILLION)
TABLE 129 LATIN AMERICA: MARKET SIZE, BY SOLUTION, 2018�2025 (USD MILLION)
TABLE 130 LATIN AMERICA: MARKET SIZE, BY SERVICE, 2018�2025 (USD MILLION)
TABLE 131 LATIN AMERICA: MARKET SIZE, BY PROFESSIONAL SERVICE, 2018�2025 (USD MILLION)
TABLE 132 LATIN AMERICA: MARKET SIZE, BY DEPLOYMENT MODE, 2018�2025 (USD MILLION)
TABLE 133 LATIN AMERICA: MARKET SIZE, BY ORGANIZATION SIZE, 2018�2025 (USD MILLION)
TABLE 134 LATIN AMERICA: MARKET SIZE, BY APPLICATION, 2018�2025 (USD MILLION)
TABLE 135 LATIN AMERICA: MARKET SIZE, BY DATA SOURCE, 2018�2025 (USD MILLION)
TABLE 136 LATIN AMERICA: MARKET SIZE, BY INDUSTRY VERTICAL, 2018�2025 (USD MILLION)
TABLE 137 LATIN AMERICA: MARKET SIZE, BY COUNTRY, 2018�2025 (USD MILLION)
TABLE 138 BRAZIL: MARKET SIZE, BY INDUSTRY VERTICAL, 2018�2025 (USD MILLION)
TABLE 139 BRAZIL: MARKET SIZE, BY APPLICATION, 2018�2025 (USD MILLION)
TABLE 140 MEXICO: MARKET SIZE, BY INDUSTRY VERTICAL, 2018�2025 (USD MILLION)
TABLE 141 MEXICO: MARKET SIZE, BY APPLICATION, 2018�2025 (USD MILLION)
TABLE 142 ARGENTINA: MARKET SIZE, BY INDUSTRY VERTICAL, 2018�2025 (USD MILLION)
TABLE 143 ARGENTINA: MARKET SIZE, BY APPLICATION, 2018�2025 (USD MILLION)
TABLE 144 REST OF LATIN AMERICA: MARKET SIZE, BY INDUSTRY VERTICAL, 2018�2025 (USD MILLION)
TABLE 145 REST OF LATIN AMERICA: CUSTOMER ANALYTICS MARKET SIZE, BY APPLICATION, 2018�2025 (USD MILLION)
LIST OF FIGURES (55 Figures)
FIGURE 1 CUSTOMER ANALYTICS MARKET: RESEARCH DESIGN
FIGURE 2 MARKET SIZE ESTIMATION METHODOLOGY- APPROACH 1 (SUPPLY SIDE): REVENUE OF SOLUTIONS/SERVICES OF THE CUSTOMER ANALYTICS MARKET
FIGURE 3 MARKET SIZE ESTIMATION METHODOLOGY - APPROACH 2 BOTTOM-UP (SUPPLY SIDE): COLLECTIVE REVENUE OF ALL SOLUTIONS/SERVICES OF THE CUSTOMER ANALYTICS MARKET
FIGURE 4 MARKET SIZE ESTIMATION METHODOLOGY - APPROACH 3 TOP-DOWN (DEMAND SIDE): SHARE OF CUSTOMER ANALYTICS THROUGH THE OVERALL CUSTOMER ANALYTICS SPENDING
FIGURE 5 MARKET SIZE ESTIMATION METHODOLOGY - APPROACH 4 BOTTOM-UP (DEMAND SIDE): PRODUCTS/SOLUTIONS/SERVICES SOLD AND THEIR AVERAGE SELLING PRICE
FIGURE 6 TOP-DOWN AND BOTTOM-UP APPROACHES
FIGURE 7 CUSTOMER ANALYTICS MARKET SNAPSHOT, BY COMPONENT
FIGURE 8 MARKET SNAPSHOT, BY SOLUTION
FIGURE 9 MARKET SNAPSHOT, BY SERVICE
FIGURE 10 MARKET SNAPSHOT, BY DEPLOYMENT MODE
FIGURE 11 MARKET SNAPSHOT, BY ORGANIZATION SIZE
FIGURE 12 MARKET SNAPSHOT, BY APPLICATION
FIGURE 13 MARKET SNAPSHOT, BY DATA SOURCE
FIGURE 14 MARKET SNAPSHOT, BY REGION
FIGURE 15 INCREASING SPENDING ON MARKETING AND ADVERTISING BY ENTERPRISES"AND GROWING CUSTOMER CHANNELS TO DRIVE THE CUSTOMER ANALYTICS MARKET GROWTH
FIGURE 16 CAMPAIGN MANAGEMENT SEGMENT TO HOLD THE LARGEST MARKET SIZE DURING THE FORECAST PERIOD
FIGURE 17 NORTH AMERICA TO HOLD THE HIGHEST MARKET SHARE IN 2020
FIGURE 18 CAMPAIGN MANAGEMENT APPLICATION AND BANKING, FINANCIAL SERVICES AND INSURANCE INDUSTRY VERTICAL TO ACCOUNT FOR THE HIGHEST SHARES IN THE NORTH AMERICA CUSTOMER ANALYTICS MARKET IN 2020
FIGURE 19 CUSTOMER ANALYTICS MARKET: DRIVERS, RESTRAINTS, OPPORTUNITIES, AND CHALLENGES
FIGURE 20 SOLUTIONS SEGMENT TO HOLD A LARGER MARKET SIZE DURING THE FORECAST PERIOD
FIGURE 21 VOICE OF CUSTOMER SEGMENT TO GROW AT THE HIGHEST CAGR DURING THE FORECAST PERIOD
FIGURE 22 MANAGED SERVICES SEGMENT TO GROW AT A HIGHER CAGR DURING THE FORECAST PERIOD
FIGURE 23 EDUCATION AND TRAINING SEGMENT TO GROW AT THE HIGHEST CAGR DURING THE FORECAST PERIOD
FIGURE 24 CLOUD SEGMENT TO GROW AT A HIGHER CAGR DURING THE FORECAST PERIOD
FIGURE 25 SMALL AND MEDIUM-SIZED ENTERPRISES SEGMENT TO GROW AT A HIGHER CAGR DURING THE FORECAST PERIOD
FIGURE 26 PRODUCT MANAGEMENT SEGMENT TO REGISTER THE HIGHEST CAGR DURING THE FORECAST PERIOD
FIGURE 27 SMARTPHONE SEGMENT TO GROW AT THE HIGHEST CAGR DURING THE FORECAST PERIOD
FIGURE 28 RETAIL AND ECOMMERCE INDUSTRY VERTICAL TO GROW AT THE HIGHEST CAGR DURING THE FORECAST PERIOD
FIGURE 29 ASIA PACIFIC TO GROW AT THE HIGHEST CAGR DURING THE FORECAST PERIOD
FIGURE 30 INDIA TO REGISTER THE HIGHEST CAGR DURING THE FORECAST PERIOD
FIGURE 31 NORTH AMERICA: MARKET SNAPSHOT
FIGURE 32 PRODUCT MANAGEMENT SEGMENT TO REGISTER THE HIGHEST CAGR IN NORTH AMERICA DURING THE FORECAST PERIOD
FIGURE 33 PRODUCT MANAGEMENT SEGMENT TO GROW AT THE HIGHEST CAGR IN EUROPE DURING THE FORECAST PERIOD
FIGURE 34 ASIA PACIFIC: MARKET SNAPSHOT
FIGURE 35 PRODUCT MANAGEMENT SEGMENT TO GROW AT THE HIGHEST CAGR IN ASIA PACIFIC DURING THE FORECAST PERIOD
FIGURE 36 PRODUCT MANAGEMENT SEGMENT TO GROW AT THE HIGHEST CAGR IN MIDDLE EAST AND AFRICA DURING THE FORECAST PERIOD
FIGURE 37 BRAND MANAGEMENT SEGMENT TO GROW AT THE HIGHEST CAGR IN LATIN AMERICA DURING THE FORECAST PERIOD
FIGURE 38 CUSTOMER ANALYTICS MARKET (GLOBAL), COMPETITIVE LEADERSHIP MAPPING, 2020
FIGURE 39 PRODUCT PORTFOLIO ANALYSIS OF TOP PLAYERS IN MARKET
FIGURE 40 BUSINESS STRATEGY EXCELLENCE OF TOP PLAYERS IN CUSTOMER ANALYTICS MARKET
FIGURE 41 GOOGLE: COMPANY SNAPSHOT
FIGURE 42 GOOGLE: SWOT ANALYSIS
FIGURE 43 ADOBE: COMPANY SNAPSHOT
FIGURE 44 ADOBE: SWOT ANALYSIS
FIGURE 45 SAP: COMPANY SNAPSHOT
FIGURE 46 SAP: SWOT ANALYSIS
FIGURE 47 MICROSOFT: COMPANY SNAPSHOT
FIGURE 48 MICROSOFT: SWOT ANALYSIS
FIGURE 49 ORACLE: COMPANY SNAPSHOT
FIGURE 50 ORACLE: SWOT ANALYSIS
FIGURE 51 SALESFORCE: COMPANY SNAPSHOT
FIGURE 52 SALESFORCE: SWOT ANALYSIS
FIGURE 53 SAS INSTITUTE: COMPANY SNAPSHOT
FIGURE 54 TERADATA: COMPANY SNAPSHOT
FIGURE 55 NICE: COMPANY SNAPSHOT
The study involved four major activities in estimating the current market size of the customer analytics market. An extensive secondary research was done to collect information on the market, peer market, and the parent market. The next step was to validate these findings, assumptions, and sizing with industry experts across the value chain through primary research. Both top-down and bottom-up approaches were used to estimate the total market size. After that, the market breakup and data triangulation procedures were used to estimate the market size of the segments and subsegments of the customer analytics market.
Secondary Research
In the secondary research process, various secondary sources, such as D&B Hoovers and Bloomberg, BusinessWeek, Duns & Bradstreet, and Factiva have been referred to for identifying and collecting information for this study. Secondary sources included annual reports; press releases and investor presentations of companies; whitepapers, certified publications, and articles by recognized authors; gold standard and silver standard websites; Research and Development (R&D) organizations; regulatory bodies; and databases. Journals, repositories, and resources, such as The Role of a customer analytics by Institute of Electrical and Electronics Engineers (IEEE) Computer Society and The Purpose and Value of a Customer Analytics solutions were referred to understand the integration of these solutions.
Primary Research
Various primary sources from both the supply and demand sides of the customer analytics market were interviewed to obtain qualitative and quantitative information for this study. The primary sources from the supply side included industry experts, such as Chief Executive Officers (CEOs), Vice Presidents (VPs), technology and innovation directors, and related key executives from various vendors offering customer analytics solutions, associated service providers, and system integrators operating in the targeted regions. All possible parameters that affect the market covered in this research study have been accounted for, viewed in extensive detail, verified through primary research, and analyzed to get the final quantitative and qualitative data.
The following is the breakup of primary profiles:
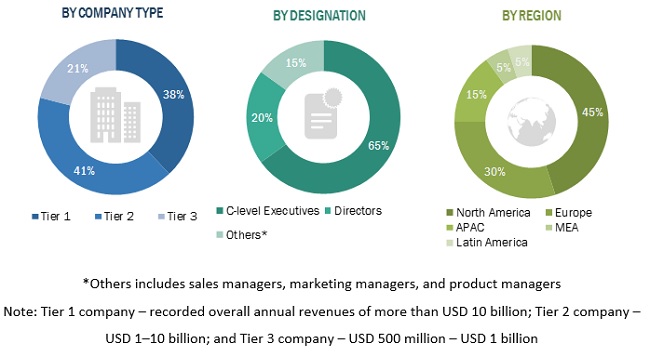
To know about the assumptions considered for the study, download the pdf brochure
Market Size Estimation
Both top-down and bottom-up approaches were used to estimate and validate the total size of the customer analytics market. The top-down approach was used to derive the revenue contribution of top vendors and their offerings in the market. The bottom-up approach was used to arrive at the overall market size of the global market using key companies� revenue and their offerings in the market. The research methodology used to estimate the market size includes the following:
- The key players in the market were identified through extensive secondary research.
- The market size, in terms of value, was determined through primary and secondary research processes.
- All percentage, shares split, and breakups were determined using secondary sources and verified through primary sources.
Data Triangulation
After arriving at the overall market size using the market size estimation processes as explained above, the market was split into several segments and subsegments. To complete the overall market engineering process and arrive at the exact statistics of each market segment and subsegment, data triangulation and market breakup procedures were employed, wherever applicable. The overall market size was then used in the top-down procedure to estimate the size of other individual markets via percentage splits of the market segmentation.
Report Objectives
- To define, segment, and project the global market size for customer analytics
- To understand the structure of the customer analytics market by identifying its various subsegments
- To provide detailed information about the key factors influencing the growth of the market (drivers, restraints, opportunities, and industry-specific challenges)
- To analyze the micromarkets concerning individual growth trends, prospects, and their contribution to the overall market
- To project the size of the market and its submarkets, in terms of value, for the five regions (along with their respective key countries)
- To profile key players and comprehensively analyze their core competencies
- To understand the competitive landscape and identify significant growth strategies adopted by players across key regions
- To analyze competitive developments, such as expansions and fundings, new product launches, mergers and acquisitions, strategic partnerships and agreements in the customer analytics market
Available customizations
With the given market data, MarketsandMarkets offers customizations as per the company�s specific needs. The following customization options are available for the report:
Product analysis
- Product matrix provides a detailed comparison of the product portfolio of each company
Geographic analysis
- Further breakup of the North American customer analytics market
- Further breakup of the European market
- Further breakup of the APAC market
- Further breakup of the Latin American market
- Further breakup of the MEA market
Company information
- Detailed analysis and profiling of additional market players up to 5


Growth opportunities and latent adjacency in Customer Analytics Market