Automotive Lighting Market

Automotive Lighting Market for ICE & Electric Vehicle by Technology (Halogen, LED, Xenon), Position and Application (Front, Rear, Side, Interior), Adaptive Lighting, Electric Vehicle, Two-Wheeler Position Type and Region - Global Forecast to 2030

Report Code: AT 3506 Jan, 2024, by marketsandmarkets.com

Automotive Lighting Market Size, Growth Report & Forecast

[378 Pages Report] Automotive Lighting market is projected to grow from USD 22.5 Billion in 2023 to USD 30.4 Billion by 2030, at a CAGR of 4.4%. The automotive lighting market is driven by government safety regulations, the development of cost-effective lighting solutions, and the rising demand for comfort & luxury, which drives the demand for interior lighting. The LED lighting market is leading due to its energy efficiency, durability, and advanced features like matrix and OLED technologies. Adopting ambient & decorative lighting in mid to premium-range vehicles is also expanding as manufacturers prioritize enhanced interior styling and refresh appeal with personalization features. Asia Pacific remains the largest market, propelled by increasing vehicle production and rapid industrialization.

Automotive Lighting Market

To know about the assumptions considered for the study, Request for Free Sample Report

Automotive Lighting Market

To know about the assumptions considered for the study, download the pdf brochure

Market Dynamics

DRIVER: High demand for adaptive lighting systems in passenger cars and entry-level SUVs

The automotive lighting market is experiencing significant growth, primarily driven by the high demand for adaptive lighting systems with growing sales of mid- & high segment cars and SUV demand. These systems significantly enhance safety and comfort by adjusting the light beam based on driving conditions, especially during night driving or bad weather. Adaptive lighting helps prevent the dazzle effect, where headlights temporarily blind oncoming drivers.

Developed economies are leading this trend with increasing penetration of adaptive lighting systems, especially in high-end vehicles. For instance, in 2022-2023, BMW Group and Mercedes-Benz have already adopted adaptive front lighting systems in some models such as BMW X5, X6, X7 and AMG-GT, S-Class, and SL-Class by Mercedes-Benz. However, emerging markets like China and India, known for their significant automotive production, are rapidly adopting these technologies in passenger cars and mid-level SUVs. Moreover, government norms surrounding adaptive lighting have evolved to enhance road safety and driver comfort. In the US, the National Highway Traffic Safety Administration (NHTSA) legalized Adaptive Driving Beam (ADB) technology in 2022, previously only available in Europe. The technology adjusts headlights based on road conditions to avoid glare on other drivers, improving visibility and safety. Japan also mandated automatic headlamps in 2020 to reduce pedestrian accidents at dusk. Suppliers have adapted by developing cost-effective, advanced lighting systems to meet these regulatory requirements. Suppliers can leverage innovations like sensors and ADB technology to provide competitive lighting solutions that enhance vehicle safety and comply with international standards, ensuring broader market adoption.

Several key players are driving advancements in this space. For instance, the Koito Group's Adaptive Driving Beam (ADB) headlight technology leverages artificial intelligence from Reality AI to keep high beams perpetually activated until oncoming traffic is detected, significantly reducing glare. In October 2018, Hyundai Mobis launched the world's first advanced adaptive driving beam, integrated with the advanced driver assistance system (ADAS) to boost driving safety. HELLA GmbH & Co. KGaA is another key player offering dynamic adaptive front-lighting systems (AFS), which adjust illumination according to vehicle speed and steering angle to optimize road visibility. These innovations and government regulations promoting road safety are expected to boost adoption in mid-range vehicles.

RESTRAINT: High Cost of LED Lights

The high cost of LED lights is a major restraint for the automotive led lighting market. While halogen and Xenon lights have lost popularity due to inefficiencies like energy wastage and delayed brightness, LEDs offer advantages such as brighter light, energy efficiency, and flexibility in design. However, LEDs are significantly more expensive due to costly materials like indium gallium nitride and aluminum gallium arsenide. Using projectors with LEDs further increases the cost, making LED lighting systems primarily accessible in mid to high-end vehicles. Despite superior performance, advanced technologies like OLED and matrix LEDs remain restricted to premium cars due to their high costs. Brands like Mercedes-Benz, JLR, BMW, Audi, Ferrari, and Lamborghini have already incorporated LED systems into their premium vehicles. Repair costs for LED lighting are also a concern, with SRA (Sécurité et Réparation Automobiles) surveys showing a 15.6% price increase for LED lighting in France in 2023. However, as the LED light market expands and reaches mass customers, LED lighting suppliers will likely notice the fall in prices and be able to improve their profit margins.

OPPORTUNITY: Evolution of new lighting technologies

The evolution of new technologies like Matrix LED, OLED, and laser lighting is transforming the automotive lighting industry. For instance, matrix LED headlights use multiple small LEDs that can be individually controlled to adjust light distribution and avoid dazzling other drivers. Audi's Matrix LED headlights can be controlled with camera and sensor-based adjustments.

OLED lighting is another emerging technology that emits light across large surfaces. It is mainly found in the premium vehicles segment in the current scenario and is expected to grow over the coming years. Alternatively, laser lighting, known for its bright light and small size, is already used in high-end models like the BMW i8 and Audi R8 LMX. This technology offers extended range and improved visibility. Adaptive Front Lighting Systems (AFS) enhance safety by adjusting the headlight angle based on driving conditions. New developments like Valeo's Premium Adaptive Driving Beam (ADB) technology improve lighting while reducing glare for oncoming drivers. These advancements offer a significant opportunity for automotive lighting suppliers to innovate and capture market share. OEMs focus on improving design for automotive lighting, mainly for headlights, to demonstrate a fresh look; this advanced lighting solution would make life easier for the R&D and product development team as it can be designed to be much smaller and more efficient with laser light. As global demand for premium vehicles increases, the demand for advanced lighting technologies will also increase. Companies often install these vehicles with the latest advanced lighting technologies, such as adaptive driving beams (ADB), matrix LEDs, laser, cornering, and auto leveling. Premium car buyers prioritize enhanced visibility, safety, and personalized lighting experiences. For instance, high-end premium vehicles such as the BMW i8 and AUDI R8 LMX models are equipped with laser and OLED lights. Also, the rising penetration of premium vehicles fitted with luxury items in Asian countries will prompt regional players to make advancements in these technologies at competitive prices to extend the customer base; the demand is likely to boost the potential suppliers in the region.

CHALLENGE: Less penetration of advanced lighting in commercial vehicles

The limited penetration of advanced lighting systems in commercial vehicles presents a challenge for the automotive lighting industry. Freight trucks and other commercial vehicles operate extensively, often covering thousands of miles daily. Given their long-time and continuous operations, integrating advanced lighting technologies like adaptive driving beams and Matrix LEDs may only be feasible for some manufacturers due to high costs and concerns about durability and reliability. Advanced lighting systems offer significant benefits, such as improved visibility and safety, which are crucial for long-haul drivers. However, their high expense compared to traditional halogen or xenon headlights challenges fleet managers who prioritize operational efficiency and profit margins. The cost barrier remains a significant hurdle, especially for fleets that operate under tight budgets. Regulations also play a role in the adoption of advanced lighting. For instance, European regulations mandate that trucks have automatic leveling and LED headlamps if they exceed 2,000 lumens (usually xenon). Despite these requirements, only some commercial vehicle manufacturers have incorporated advanced lighting systems due to their high costs.

Automotive Lighting Market Ecosystem.

The major OEMs of the automotive lighting market share have the latest technologies, diversified portfolios, and strong distribution networks globally. The major players in the Automotive Lighting Market include Robert Bosch (Germany), HELLA GmbH & Co. KGaA (Germany), Johnson Electric (China), Denso Corporation (Japan), and Continental AG (Germany).

Automotive Lighting Market

The ambient lighting segment will dominate during the forecast period in the adaptive lighting market.

Ambient lighting is a leading segment in the adaptive lighting market. In modern vehicles, ambient lighting enhances the cabin environment, making it more comfortable and visually appealing. Beyond aesthetics, ambient lighting is crucial in safety and user experience. This type of lighting is designed to enhance the interior experience of vehicles by adding customizable color and intensity effects. These lighting systems also support take-over requests (TORs) in semi-autonomous vehicles, alerting drivers to pay attention when necessary.

Ambient lighting is becoming more common in luxury and high-end vehicles. Modern cars use RGB (Red, Green, and Blue) LEDs that can change colors and brightness quickly to show different actions or statuses. This looks great and helps with safety by providing clear visual signals. For instance, in the Mercedes-Benz EQS, the ambient light changes color based on the air conditioning—blue for cooling and red for heating. High-end models like Rolls-Royce and BMW i7 also use ambient lighting in the ceiling and footrests to create a comfortable and well-lit space for passengers.

Ambient lighting is promising in top-end variants of mid-range cars. This trend is mainly found in countries such as India, China, Thailand, and Indonesia, where it costs less. Moreover, dealers provide customization offers per company standards without violating warranty, giving better customer experience. As lighting technology continues to improve, the demand for ambient lighting is expected to grow, driven by innovations and the desire for more personalized and functional cabin environments.

LEDs in the electric vehicle lighting market are growing fastest during the forecast period.

For several reasons, LED lighting quickly becomes the top choice for electric vehicles (EVs). These are used in applications such as tail lamps, side indicators, headlamps, parking lights, reverse lights, fog lights, daytime running lights (DRL), and interior cabin lights. LEDs are energy-efficient, using less power while delivering bright, clear light. This helps extend the driving range of EVs, which are designed to be energy-efficient. New advancements, such as matrix LEDs and OLEDs, have improved LED brightness, color options, and design flexibility.

Automakers like Tesla, BMW, and Mercedes-Benz are increasingly incorporating LEDs into their models, using them to create distinctive lighting signatures and improve the aesthetic appeal of their vehicles. LEDs also offer significant advantages in durability and lifespan compared to traditional halogen bulbs, reducing maintenance costs for vehicle owners. Their rapid response times contribute to advanced safety features, including adaptive lighting systems. Additionally, LEDs are compact and produce less heat, making them ideal for modern EV designs and battery safety. With electric vehicle sales rising and LED production costs expected to drop, LEDs are set to lead the global EV lighting market. This growth is robust in regions like Asia Pacific, where LED use is increasing rapidly.

Headlights are expected to witness the fastest growth in the two-wheeler lighting market.

The headlights segment will grow at a higher rate for the two-wheeler lighting market. The higher growth of the headlight segment is mainly influenced by the rising adoption of LED technology for front lighting. Halogen lights hold the maximum share for headlamps. However, LED lights have grown at a promising pace in recent years. Earlier, LED headlamps were limited to expensive bikes only. Now, two-wheelers sold in developing countries are also equipped with LED headlamps owing to various advantages, including power saving, sharp & bright view, and improved appearance. In recent years, many motorbikes and scooters have launched with LED front lighting in the global market. For instance, in June 2023, KTM launched the KTM 200 Duke, equipped with LED headlamps. In Oct 2023, Royal Enfield launched its Super Meteor 650 in the US and Canada. This bike has a circular LED headlamp, the company’s triple navigation system, Bluetooth connectivity, and a USB charging port. In August 2023, Hera launched its Hero Karizma XMR, equipped with LED projector lights and an H-shaped DRL pattern. In 2022, OLA launched its Ola S1 Pro is equipped with two projector lamps and the smiley-faced LED daytime running light. Modern two-wheeler OEMs increasingly focus on using LED lights for headlights, creating futuristic opportunities for the two-wheeler lighting suppliers.

Asia Pacific is the largest region in the Automotive Lighting market.

The Asia Pacific (APAC) region is the largest automotive oled lighting market due to its rapid industrialization and infrastructural growth. Increased automobile production and rising disposable incomes across emerging economies are key drivers. This region offers significant opportunities for automotive OEMs as the growing purchasing power fuels vehicle demand.

China, Japan, India, and South Korea are significant players in the APAC automotive sector. China, in particular, has seen a surge in demand for premium vehicles, leading to increased automotive lighting needs. The country's significant investments in automotive production and expanding collaborations, like HELLA's recent project with BMW Group and other partners, further drive market growth. With automotive giants like DENSO and Koito Manufacturing Co., Ltd., Japan follows, contributing to advanced lighting solutions. Government initiatives and OEM efforts to boost exports bolstered South Korea's automotive growth. Companies such as Hyundai Motor Company and Kia Motors are at the forefront of developing new vehicles and lighting technologies.

Meanwhile, India's automotive market is expanding due to increased investments and a shift towards advanced technologies. Despite the current dominance of low-cost halogen technology, the LED market is gaining traction due to its visual effects and longevity advantages. The region's diverse lighting needs are met by halogen and LED technologies, with LEDs gaining ground as prices decrease and consumer preferences shift towards more advanced solutions.

Automotive Lighting Market Size, and Share

Key Market Players

The Automotive Lighting market is consolidated with players such as Koito Manufacturing (Japan), Magnetic Marelli (Italy), Valeo (France), HELLA GmbH & Co. KGaA (Germany), Stanley Electric (Japan), are the prominent players in the Automotive Lighting market. These companies adopted new product launches, partnerships, and joint ventures to gain traction in the Automotive Lighting market.

Want to explore hidden markets that can drive new revenue in Automotive Lighting Market?

Scope of the Report

Report Attribute

Details

Market size available for years

2018–2030

Base year considered

2022

Market Growth forecast 

USD 30.38 billion by 2030 from USD 22.53 billion in 2023 at a CAGR of 4.4%

Forecast period

2023–2030

Forecast units

Value (USD Million/Billion)

Segments Covered

By technology type, by application, by position, by vehicle type, by electric & hybrid application, by electric & hybrid vehicle technology, by electric & hybrid vehicle type, by two-wheeler position type, and by region

Geographies covered

Asia Pacific, North America, Europe, and Rest of the World.

Top Players

Koito Manufacturing Co., Ltd. (Japan), Magnetic Marelli (Italy), Valeo SA (France), HELLA GmbH & Co. KGaA (Germany) and Stanley Electric Co., Ltd (Japan).
A total of 31 major players covered

With the given market data, MarketsandMarkets offers customizations per the company’s specific needs.

The study segments the Automotive Lighting Market:

Automotive Lighting Market, By Technology Type
  • HALOGEN
  • LED
    • OLED
    • MATRIX LED
  • XENON/HID
Automotive Lighting Market, By Application
  • Front Lighting
  • Rear Lighting
  • Side Lighting
  • Interior Lighting
Automotive Lighting Market, By Vehicle Type
  • Passenger cars
  • Light Commercial Vehicles
  • Trucks
  • Buses
Automotive Adaptive Lighting Market, By Type
  • Front Adaptive Lighting
    • Auto On/Off
    • Bending/Cornering Lights
    • High Beam Assists
    • Headlight Levelling
  • Rear Adaptive Lighting
  • Ambient Lighting
Electric & Hybrid Lighting Market, By Vehicle Type
  • Battery Electric Vehicle (BEV)
  • Plug-in Hybrid Vehicle (PHEV)
  • Fuel-cell Electric Vehicle (FCEV)
Electric & Hybrid Lighting Market, By Technology
  • HALOGEN
  • LED
  • XENON/HID
Electric & Hybrid Lighting Market, By Application
  • Exterior Lighting
  • Interior Lighting
Two-Wheeler Lighting Market, By Position
  • Font
  • Side
  • Rear
Automotive Lighting Market, By Region
  • Asia Pacific
  • Europe
  • North America
  • Rest of the World

Recent Developments

  • In July 2024, HELLA collaborated with Audi and developed a new headlamp concept for the Q6 e-tron. It features adaptive matrix LED headlamps with customizable digital daytime running lights, allowing users to select up to eight unique light designs.
  • In May 2024, HELLA showcased its latest lighting and electronic solutions for municipal vehicles at IFAT. The LED combination headlamp C240 integrates essential lighting functions and a customizable logo option, and the Bi-LED SlimLine headlamp offers a unique look through colored bezels.
  • In November 2023, HELLA launched its new HELLA Value Fit BLADE auxiliary headlamp series primarily for trucks and off-road vehicles. These auxiliary headlamps are equipped with innovative LED lighting technology and provide a new growth path entry into the world of LED vehicle lighting.
  • In July 2023, HELLA and Porsche launched the world's first high-resolution headlamp powered by matrix LED technology. This raised automotive lighting technology to a new level.
  • In January 2023, Cepton and Koito Manufacturing Co., Ltd. launched their new LiDAR integration solutions at CES 2023.
  • In December 2022, OSRAM launched new automotive forward lighting or headlamp LED units named OSLON Black Flat X series (OBF X) with a higher efficiency and almost unlimited operating lifetime.
  • In June 2021, Hyundai Mobis developed a lighting grille that applies LED lighting function to the front grille. This can show externally that the car is in autonomous or EV charging mode.
  • In January 2019, Valeo and Cree, Inc. (US) announced their joint development of the first complete high-definition (HD) LED array solution for automotive lighting systems. Valeo PictureBeam Monolithic is the first full HD lighting system that provides glare-free and high-beam road marking functions with high-performance low and high beams in a single compact solution.

Frequently Asked Questions (FAQ):

To speak to our analyst for a discussion on the above findings, click Speak to Analyst

Exclusive indicates content/data unique to MarketsandMarkets and not available with any competitors.

INTRODUCTION
34
RESEARCH METHODOLOGY
39
EXECUTIVE SUMMARY
56
PREMIUM INSIGHTS
61
MARKET OVERVIEW
65
  • 5.1 INTRODUCTION
  • 5.2 MARKET DYNAMICS
    DRIVERS
    - Increase in demand for premium vehicles
    - Stringent lighting regulations for better visibility and safety
    - High demand for adaptive lighting systems in passenger cars and entry-level SUVs in emerging economies
    RESTRAINTS
    - High cost of LED lights
    - Low penetration of advanced lighting systems in hatchbacks, compact sedans, and entry-level SUVs
    OPPORTUNITIES
    - Partnerships between automotive OEMs and lighting system manufacturers
    - Evolution of new technologies
    - Development of advanced lighting solutions for autonomous vehicles
    CHALLENGES
    - Volatility of raw material prices
    - Increasing competition from local companies offering counterfeit/retrofit solutions
    - Less penetration of advanced lighting systems in commercial vehicles
    - Development of software capabilities to incorporate AI and other technologies in adaptive lighting systems
  • 5.3 TRENDS AND DISRUPTIONS IMPACTING CUSTOMER BUSINESS
  • 5.4 ECOSYSTEM ANALYSIS
    AUTOMOTIVE LIGHTING MANUFACTURERS
    DISTRIBUTORS AND SALES REPRESENTATIVES
    END USERS
  • 5.5 VALUE CHAIN ANALYSIS
  • 5.6 PATENT ANALYSIS
  • 5.7 TECHNOLOGY ANALYSIS
    ADAPTIVE DRIVING BEAM
    LASER TECHNOLOGY
    OLED
    MICRO AFS LED
    BEND LIGHTING
  • 5.8 CASE STUDY ANALYSIS
    CASE STUDY: LED INTELLIGENT LIGHT SYSTEM
    CASE STUDY: DYNAMIC INTERIOR LIGHTING
    CASE STUDY: OBJECT RECOGNITION SYSTEM
    CASE STUDY: LED INTELLIGENT LIGHT SYSTEM
  • 5.9 TRADE ANALYSIS
    IMPORT DATA
    EXPORT DATA
  • 5.10 PRICING ANALYSIS
    PRICING ANALYSIS
    BY TECHNOLOGY
    BY REGION
  • 5.11 REGULATORY FRAMEWORK
    REGULATORY BODIES, GOVERNMENT AGENCIES, AND OTHER ORGANIZATIONS
    - North America
    - Europe
    - Asia Pacific
    REGULATORY BODIES/GOVERNMENT AGENCIES
  • 5.12 KEY CONFERENCES AND EVENTS IN 2024
  • 5.13 KEY STAKEHOLDERS AND BUYING CRITERIA
    KEY STAKEHOLDERS IN BUYING PROCESS
    BUYING CRITERIA
  • 5.14 SUPPLIER ANALYSIS
    HEADLAMPS
    FOG LAMPS
    REAR LAMPS
    INTERIOR LIGHTING
    EXTERIOR LIGHTING
AUTOMOTIVE LIGHTING MARKET, BY TECHNOLOGY
110
  • 6.1 INTRODUCTION
    INDUSTRY INSIGHTS
  • 6.2 HALOGEN
    GROWING POPULARITY OF LED TO DRIVE MARKET
  • 6.3 LED
    OLED
    - Advancements in OLED technology to drive market
    MATRIX LED
    - Growing interest from major automakers to drive demand
  • 6.4 XENON
    ASIA PACIFIC TO REMAIN LARGEST MARKET FOR XENON TECHNOLOGY
  • 6.5 LASER
    LASER TECHNOLOGY AS ABSOLUTE INNOVATION IN LIGHTING
AUTOMOTIVE LIGHTING MARKET, BY APPLICATION
120
  • 7.1 INTRODUCTION
    INDUSTRY INSIGHTS
  • 7.2 MARKET DEFINITIONS
    FRONT LIGHTING
    - Headlights
    - Fog lights
    - Daytime running lights (DRL)
    REAR LIGHTING
    - Taillights
    - Center high-mount stop lights (CHMSL)
    - License plate lamps
    SIDE LIGHTING
    - Sidelights
    - Side rear-view mirror indicators
    INTERIOR LIGHTING
    - Dashboards
    - Glove boxes
    - Reading lights
    - Dome lights
    - Rear-view mirror interior lights
    FRONT LIGHTING, BY VEHICLE TYPE
    REAR LIGHTING, BY VEHICLE TYPE
    SIDE LIGHTING, BY VEHICLE TYPE
    INTERIOR LIGHTING, BY VEHICLE TYPE
  • 7.3 PASSENGER CAR LIGHTING MARKET, BY APPLICATION
  • 7.4 PASSENGER CAR INTERIOR LIGHTING MARKET, BY APPLICATION
    DASHBOARD LIGHTS
    GLOVE BOX
    READING LIGHTS
    DOME LIGHTS
    REAR-VIEW MIRROR INTERIOR LIGHTS
  • 7.5 PASSENGER CAR FRONT LIGHTING MARKET, BY APPLICATION
    HEADLIGHTS
    FOG LIGHTS
    DAYTIME RUNNING LIGHTS
  • 7.6 PASSENGER CAR REAR LIGHTING MARKET, BY APPLICATION
    TAIL LIGHTS
    CENTER HIGH-MOUNT STOP LIGHTS
    LICENSE PLATE LIGHTS
  • 7.7 PASSENGER CAR SIDE LIGHTING MARKET, BY APPLICATION
    SIDELIGHTS
    SIDE REAR-VIEW MIRROR INDICATOR LIGHTS
  • 7.8 LIGHT COMMERCIAL VEHICLE LIGHTING MARKET, BY POSITION
  • 7.9 LIGHT COMMERCIAL VEHICLE (LCV) INTERIOR LIGHTING MARKET, BY APPLICATION
    DASHBOARD LIGHTS
    GLOVE BOX
    READING LIGHTS
    DOME LIGHTS
    REAR-VIEW MIRROR INTERIOR LIGHTS
  • 7.10 LIGHT COMMERCIAL VEHICLE (LCV) FRONT LIGHTING MARKET, BY APPLICATION
    HEADLIGHTS
    FOG LIGHTS
    DAYTIME RUNNING LIGHTS (DRL)
  • 7.11 LIGHT COMMERCIAL VEHICLE (LCV) REAR LIGHTING MARKET, BY APPLICATION
    TAIL LIGHTS
    CENTER HIGH-MOUNT STOP LIGHTS (CHMSL)
    LICENSE PLATE LIGHTS
  • 7.12 LIGHT COMMERCIAL VEHICLE (LCV) SIDE LIGHTING MARKET, BY APPLICATION
    SIDELIGHTS
  • 7.13 TRUCK LIGHTING MARKET, BY POSITION
  • 7.14 TRUCK INTERIOR LIGHTING MARKET, BY APPLICATION
    DASHBOARD LIGHTS
    CABIN AND READING LIGHTS
    ENGINE COMPARTMENT LIGHTS
  • 7.15 TRUCK FRONT LIGHTING MARKET, BY APPLICATION
    HEADLIGHTS
    FOG LIGHTS
    CLEARANCE LAMPS
    TURN SIGNAL LAMPS
    DAYTIME RUNNING LIGHTS
  • 7.16 TRUCK REAR LIGHTING MARKET, BY APPLICATION
    STOP LAMPS
    TAIL LAMPS
    LICENSE PLATE LAMPS
    TURN SIGNAL LAMPS
  • 7.17 TRUCK SIDE LIGHTING MARKET, BY APPLICATION
    MARKER LAMPS
  • 7.18 BUS LIGHTING MARKET, BY POSITION
  • 7.19 BUS INTERIOR LIGHTING MARKET, BY APPLICATION
    DASHBOARD LAMPS
    BUS AREA LIGHTS
    DRIVER AREA LIGHTS
    FOOTWELL LIGHTS
  • 7.20 BUS FRONT LIGHTING MARKET, BY APPLICATION
    HEADLAMP UNITS
    CLEARANCE LAMPS
    INDICATOR LAMPS
    IDENTIFICATION LAMPS
    DAYTIME RUNNING LIGHTS
  • 7.21 BUS REAR LIGHTING MARKET, BY APPLICATION
    LICENSE PLATE LAMPS
    TAIL LAMPS
    REAR CLEARANCE LAMPS
    REAR IDENTIFICATION LAMPS
    STOP LAMPS
  • 7.22 BUS SIDE LIGHTING MARKET, BY APPLICATION
    MARKER LAMPS
AUTOMOTIVE LIGHTING MARKET, BY VEHICLE TYPE
174
  • 8.1 INTRODUCTION
    INDUSTRY INSIGHTS
  • 8.2 PASSENGER CARS
    INCREASING ADOPTION OF ADVANCED LIGHTING SYSTEMS AND GROWING DEMAND FOR PREMIUM AND LUXURY CARS TO DRIVE MARKET
  • 8.3 LIGHT COMMERCIAL VEHICLES
    GROWING LIGHT COMMERCIAL VEHICLE PRODUCTION TO DRIVE MARKET
  • 8.4 TRUCKS
    INCREASING PENETRATION OF ADVANCED HEADLIGHTS TO DRIVE MARKET
  • 8.5 BUSES
    GROWING PUBLIC TRANSPORTATION SYSTEM TO DRIVE MARKET
AUTOMOTIVE ADAPTIVE LIGHTING MARKET, BY TYPE
184
  • 9.1 INTRODUCTION
    INDUSTRY INSIGHTS
  • 9.2 FRONT ADAPTIVE LIGHTING
    AUTO ON/OFF
    - Increasing incorporation of on/off features by automakers to drive market
    BENDING/CORNERING LIGHTING
    - Technical benefits like enhanced visibility and safety to drive market
    HIGH BEAM ASSIST
    - Availability of vehicle models with this feature to drive demand
    HEADLIGHT LEVELING
    - Growing developments in headlight leveling technology to drive market
  • 9.3 REAR ADAPTIVE LIGHTING
    FAVORABLE GOVERNMENT REGULATIONS TO DRIVE MARKET
  • 9.4 AMBIENT LIGHTING
    DEVELOPMENTS AND INCREASED R&D BY AUTOMOTIVE LIGHTING MANUFACTURERS TO DRIVE MARKET
ELECTRIC VEHICLE LIGHTING MARKET, BY VEHICLE TYPE
198
  • 10.1 INTRODUCTION
    INDUSTRY INSIGHTS
  • 10.2 BEVS
    INCREASING INVESTMENT BY AUTOMAKERS TO ELECTRIFY THEIR PRODUCTS TO DRIVE MARKET
  • 10.3 PHEVS
    GROWING SALES OF PHEVS IN EUROPE AND STRINGENT SAFETY STANDARDS TO DRIVE MARKET
  • 10.4 FCEVS
    INCREASING LAUNCH OF FCEV MODELS WITH ADVANCED SAFETY FEATURES TO DRIVE MARKET
ELECTRIC VEHICLE LIGHTING MARKET, BY TECHNOLOGY
206
  • 11.1 INTRODUCTION
    INDUSTRY INSIGHTS
  • 11.2 HALOGEN
    GROWING ADOPTION OF LED TO IMPACT HALOGEN MARKET
  • 11.3 LED
    GROWING ADOPTION AND TECHNOLOGICAL DEVELOPMENTS TO DRIVE MARKET
  • 11.4 XENON/HID
    DEMAND FOR XENON TO DECLINE DUE TO RISING POPULARITY OF LED
ELECTRIC VEHICLE LIGHTING MARKET, BY APPLICATION
214
  • 12.1 INTRODUCTION
    INDUSTRY INSIGHTS
  • 12.2 EXTERIOR LIGHTING
    HEADLIGHTS
    FOG LIGHTS
    DAYTIME RUNNING LIGHTS
    TAILLIGHTS
    SIDELIGHTS
    CENTER HIGH-MOUNT STOP LIGHTS
  • 12.3 INTERIOR LIGHTING
    DASHBOARD LIGHTS
    GLOVE BOX LIGHTS
    READING LIGHTS
    DOME LIGHTS
TWO-WHEELER LIGHTING MARKET, BY POSITION
234
  • 13.1 INTRODUCTION
    INDUSTRY INSIGHTS
  • 13.2 FRONT
    GROWING POPULARITY OF LED HEADLIGHTS TO DRIVE MARKET
  • 13.3 SIDE
    GROWING TWO-WHEELER SALES TO DRIVE MARKET
  • 13.4 REAR
    DEMAND FOR ENHANCED SAFETY AND VISIBILITY TO DRIVE MARKET
AUTOMOTIVE LIGHTING MARKET, BY REGION
242
  • 14.1 INTRODUCTION
    INDUSTRY INSIGHTS
  • 14.2 ASIA PACIFIC
    RECESSION IMPACT
    CHINA
    - Strong presence of leading vehicle manufacturers to drive market
    JAPAN
    - Development of advanced ADAS features to drive market
    SOUTH KOREA
    - Developments in autonomous vehicles to boost demand for advanced lighting systems
    INDIA
    - Growing demand for SUVs and MUVs to drive market
    REST OF ASIA PACIFIC
  • 14.3 EUROPE
    RECESSION IMPACT
    GERMANY
    - Government mandates for safety standards to drive market
    FRANCE
    - Increasing sales of premium and luxury vehicles to drive market
    SPAIN
    - Increasing production of passenger cars and LCVs to drive market
    UK
    - High demand for premium and luxury cars to drive market
    REST OF EUROPE
  • 14.4 NORTH AMERICA
    RECESSION IMPACT
    US
    - Government regulations mandating adaptive lighting to drive market
    CANADA
    - Growing demand for advanced vehicles and premium cars to drive market
    MEXICO
    - Trade agreement between US, Canada, and Mexico to drive market
  • 14.5 REST OF WORLD (ROW)
    RECESSION IMPACT
    BRAZIL
    - Trade agreements with US to drive market
    IRAN
    - Government programs to boost domestic vehicle production to drive market
    OTHERS
COMPETITIVE LANDSCAPE
280
  • 15.1 KEY PLAYER STRATEGIES/RIGHT TO WIN
  • 15.2 REVENUE ANALYSIS
  • 15.3 MARKET SHARE ANALYSIS
  • 15.4 COMPANY EVALUATION MATRIX
    STARS
    EMERGING LEADERS
    PERVASIVE PLAYERS
    PARTICIPANTS
    COMPANY FOOTPRINT
  • 15.5 START-UP/SME EVALUATION MATRIX: AUTOMOTIVE ADAPTIVE LIGHTING MANUFACTURERS
    PROGRESSIVE COMPANIES
    RESPONSIVE COMPANIES
    DYNAMIC COMPANIES
    STARTING BLOCKS
    COMPETITIVE BENCHMARKING
  • 15.6 COMPETITIVE SCENARIO
    PRODUCT LAUNCHES
    DEALS
    OTHERS
COMPANY PROFILES
305
  • 16.1 KEY PLAYERS
    KOITO MANUFACTURING CO., LTD.
    - Business overview
    - Products offered
    - Recent developments
    - MnM view
    HELLA GMBH & CO. KGAA
    - Business overview
    - Products offered
    - Recent developments
    - MnM view
    VALEO SA
    - Business overview
    - Products offered
    - Recent developments
    - MnM view
    OSRAM GMBH
    - Business overview
    - Products offered
    - Recent developments
    - MnM view
    CONTINENTAL AG
    - Business overview
    - Products offered
    - Recent developments
    - MnM view
    HYUNDAI MOBIS
    - Business overview
    - Products offered
    - Recent developments
    MAGNETI MARELLI
    - Business overview
    - Products offered
    - Recent developments
    ICHIKOH INDUSTRIES, LTD.
    - Business overview
    - Products offered
    - Recent developments
    STANLEY ELECTRIC CO., LTD.
    - Business overview
    - Products offered
    - Recent developments
    SIGNIFY (KONINKLIJKE PHILIPS N.V.)
    - Business overview
    - Products offered
    - Recent developments
    TUNGSRAM GROUP
    - Business overview
    - Products offered
    - Recent developments
  • 16.2 OTHER PLAYERS
    ZIZALA LICHTSYSTEME GMBH
    ROBERT BOSCH GMBH
    NXP SEMICONDUCTORS NV
    GRUPO ANTOLIN
    FEDERAL-MOGUL CORPORATION
    GENTEX CORPORATION
    FLEX-N-GATE
    NORTH AMERICAN LIGHTING
    DENSO CORPORATION
    RENESAS ELECTRONICS CORPORATION
    KEBODA
    VARROC
    LUMAX INDUSTRIES
    SEOUL SEMICONDUCTOR CO., LTD.
    INFINEON TECHNOLOGIES
    SAMVARDHANA MOTHERSON
AUTOMOTIVE LIGHTING MARKET- RECOMMENDATIONS BY MARKETSANDMARKETS
369
  • 17.1 ASIA PACIFIC TO BE KEY MARKET FOR AUTOMOTIVE LIGHTING
  • 17.2 LED TECHNOLOGY TO CREATE LUCRATIVE OPPORTUNITIES FOR LIGHTING MANUFACTURERS
  • 17.3 CONCLUSION
APPENDIX
371
  • 18.1 INSIGHTS FROM INDUSTRY EXPERTS
  • 18.2 DISCUSSION GUIDE
  • 18.3 KNOWLEDGESTORE: MARKETSANDMARKETS’ SUBSCRIPTION PORTAL
  • 18.4 CUSTOMIZATION OPTIONS
  • 18.5 RELATED REPORTS
  • 18.6 AUTHOR DETAILS
LIST OF TABLES
 
  • TABLE 1 CURRENCY EXCHANGE RATES
  • TABLE 2 ASSUMPTIONS MADE FOR NUMBER OF LIGHTING UNITS, BY POSITION
  • TABLE 3 COUNTRY-WISE PREMIUM VEHICLE PRODUCTION, 2020–2022 P(UNITS)
  • TABLE 4 AUTOMOTIVE LIGHTING REGULATIONS
  • TABLE 5 MODEL-WISE ADAPTIVE FRONT LIGHTING TECHNOLOGY
  • TABLE 6 PARTNERSHIPS AND AGREEMENTS BETWEEN LIGHTING MANUFACTURERS
  • TABLE 7 AUTOMOTIVE LIGHTING MARKET: ECOSYSTEM
  • TABLE 8 PATENT ANALYSIS
  • TABLE 9 US: AUTOMOTIVE LIGHTING IMPORT SHARE, BY COUNTRY (VALUE %)
  • TABLE 10 CANADA: AUTOMOTIVE LIGHTING IMPORT SHARE, BY COUNTRY (VALUE %)
  • TABLE 11 CHINA: AUTOMOTIVE LIGHTING IMPORT SHARE, BY COUNTRY (VALUE %)
  • TABLE 12 JAPAN: AUTOMOTIVE LIGHTING IMPORT SHARE, BY COUNTRY (VALUE %)
  • TABLE 13 INDIA: AUTOMOTIVE LIGHTING IMPORT SHARE, BY COUNTRY (VALUE %)
  • TABLE 14 GERMANY: AUTOMOTIVE LIGHTING IMPORT SHARE, BY COUNTRY (VALUE %)
  • TABLE 15 FRANCE: AUTOMOTIVE LIGHTING IMPORT SHARE, BY COUNTRY (VALUE %)
  • TABLE 16 US: AUTOMOTIVE LIGHTING EXPORT SHARE, BY COUNTRY (VALUE %)
  • TABLE 17 CANADA: AUTOMOTIVE LIGHTING EXPORT SHARE, BY COUNTRY (VALUE %)
  • TABLE 18 CHINA: AUTOMOTIVE LIGHTING EXPORT SHARE, BY COUNTRY (VALUE %)
  • TABLE 19 JAPAN: AUTOMOTIVE LIGHTING EXPORT SHARE, BY COUNTRY (VALUE %)
  • TABLE 20 INDIA: AUTOMOTIVE LIGHTING EXPORT SHARE, BY COUNTRY (VALUE %)
  • TABLE 21 GERMANY: AUTOMOTIVE LIGHTING EXPORT SHARE, BY COUNTRY (VALUE %)
  • TABLE 22 FRANCE: AUTOMOTIVE LIGHTING EXPORT SHARE, BY COUNTRY (VALUE %)
  • TABLE 23 AVERAGE SELLING PRICE OF AUTOMOTIVE LIGHTING SYSTEMS, BY TECHNOLOGY, 2022 VS. 2023
  • TABLE 24 AVERAGE SELLING PRICE OF AUTOMOTIVE LIGHTING SYSTEMS, BY REGION, 2022 VS. 2023
  • TABLE 25 NORTH AMERICA: AUTOMOTIVE LIGHTING REGULATIONS
  • TABLE 26 EUROPE: AUTOMOTIVE LIGHTING REGULATIONS
  • TABLE 27 ASIA PACIFIC: AUTOMOTIVE LIGHTING REGULATIONS
  • TABLE 28 NORTH AMERICA: LIST OF REGULATORY BODIES, GOVERNMENT AGENCIES, AND OTHER ORGANIZATIONS
  • TABLE 29 EUROPE: LIST OF REGULATORY BODIES, GOVERNMENT AGENCIES, AND OTHER ORGANIZATIONS
  • TABLE 30 ASIA PACIFIC: LIST OF REGULATORY BODIES, GOVERNMENT AGENCIES, AND OTHER ORGANIZATIONS
  • TABLE 31 AUTOMOTIVE LIGHTING MARKET: KEY CONFERENCES AND EVENTS
  • TABLE 32 INFLUENCE OF STAKEHOLDERS ON BUYING PROCESS FOR TOP 3 AUTOMOTIVE LIGHTING TECHNOLOGIES (%)
  • TABLE 33 KEY BUYING CRITERIA FOR TOP 3 AUTOMOTIVE LIGHTING TECHNOLOGIES (OEM/CONSUMER)
  • TABLE 34 HEADLAMP SUPPLIERS TO OEMS, BY PRODUCT
  • TABLE 35 FOG LAMP SUPPLIERS TO OEMS, BY PRODUCT
  • TABLE 36 REAR LAMP SUPPLIERS TO OEMS, BY PRODUCT
  • TABLE 37 INTERIOR LIGHTING SUPPLIERS TO OEMS, BY PRODUCT
  • TABLE 38 EXTERIOR LIGHTING SUPPLIERS TO OEMS, BY PRODUCT
  • TABLE 39 MARKET, BY TECHNOLOGY, 2018–2022 (MILLION UNITS)
  • TABLE 40 MARKET, BY TECHNOLOGY, 2023–2030 (MILLION UNITS)
  • TABLE 41 MARKET, BY TECHNOLOGY, 2018–2022 (USD MILLION)
  • TABLE 42 MARKET, BY TECHNOLOGY, 2023–2030 (USD MILLION)
  • TABLE 43 HALOGEN: MARKET, BY REGION, 2018–2022 (MILLION UNITS)
  • TABLE 44 HALOGEN: MARKET, BY REGION, 2023–2030 (MILLION UNITS)
  • TABLE 45 HALOGEN: MARKET, BY REGION, 2018–2022 (USD MILLION)
  • TABLE 46 HALOGEN: MARKET, BY REGION, 2023–2030 (USD MILLION)
  • TABLE 47 LED: MARKET, BY REGION, 2018–2022 (MILLION UNITS)
  • TABLE 48 LED: MARKET, BY REGION, 2023–2030 (MILLION UNITS)
  • TABLE 49 LED: MARKET, BY REGION, 2018–2022 (USD MILLION)
  • TABLE 50 LED: MARKET, BY REGION, 2023–2030 (USD MILLION)
  • TABLE 51 OLED: MARKET, BY REGION, 2018–2022 (MILLION UNITS)
  • TABLE 52 OLED: MARKET, BY REGION, 2023–2030 (MILLION UNITS)
  • TABLE 53 MATRIX LED: MARKET, BY REGION, 2018–2022 (MILLION UNITS)
  • TABLE 54 MATRIX LED: MARKET, BY REGION, 2023–2030 (MILLION UNITS)
  • TABLE 55 XENON: MARKET, BY REGION, 2018–2022 (MILLION UNITS)
  • TABLE 56 XENON: MARKET, BY REGION, 2023–2030 (MILLION UNITS)
  • TABLE 57 XENON: MARKET, BY REGION, 2018–2022 (USD MILLION)
  • TABLE 58 XENON: MARKET, BY REGION, 2023–2030 (USD MILLION)
  • TABLE 59 FRONT LIGHTING MARKET, BY VEHICLE TYPE, 2018–2022 (MILLION UNITS)
  • TABLE 60 FRONT LIGHTING MARKET, BY VEHICLE TYPE, 2023–2030 (MILLION UNITS)
  • TABLE 61 REAR LIGHTING MARKET, BY VEHICLE TYPE, 2018–2022 (MILLION UNITS)
  • TABLE 62 REAR LIGHTING MARKET, BY VEHICLE TYPE, 2023–2030 (MILLION UNITS)
  • TABLE 63 SIDE LIGHTING MARKET, BY VEHICLE TYPE, 2018–2022 (MILLION UNITS)
  • TABLE 64 SIDE LIGHTING MARKET, BY VEHICLE TYPE, 2023–2030 (MILLION UNITS)
  • TABLE 65 INTERIOR LIGHTING MARKET, BY VEHICLE TYPE, 2018–2022 (MILLION UNITS)
  • TABLE 66 INTERIOR LIGHTING MARKET, BY VEHICLE TYPE, 2023–2030 (MILLION UNITS)
  • TABLE 67 PASSENGER CAR INTERIOR LIGHTING MARKET, BY APPLICATION, 2018–2022 (MILLION UNITS)
  • TABLE 68 PASSENGER CAR INTERIOR LIGHTING MARKET, BY APPLICATION, 2023–2030 (MILLION UNITS)
  • TABLE 69 PASSENGER CAR DASHBOARD LIGHTS MARKET, BY REGION, 2018–2022 (MILLION UNITS)
  • TABLE 70 PASSENGER CAR DASHBOARD LIGHTS MARKET, BY REGION, 2023–2030 (MILLION UNITS)
  • TABLE 71 PASSENGER CAR GLOVE BOX LIGHTS MARKET, BY REGION, 2018–2022 (MILLION UNITS)
  • TABLE 72 PASSENGER CAR GLOVE BOX LIGHTS MARKET, BY REGION, 2023–2030 (MILLION UNITS)
  • TABLE 73 PASSENGER CAR READING LIGHTS MARKET, BY REGION, 2018–2022 (MILLION UNITS)
  • TABLE 74 PASSENGER CAR READING LIGHTS MARKET, BY REGION, 2023–2030 (MILLION UNITS)
  • TABLE 75 PASSENGER CAR DOME LIGHTS MARKET, BY REGION, 2018–2022 (MILLION UNITS)
  • TABLE 76 PASSENGER CAR DOME LIGHTS MARKET, BY REGION, 2023–2030 (MILLION UNITS)
  • TABLE 77 PASSENGER CAR REAR-VIEW MIRROR INTERIOR LIGHTS MARKET, BY REGION, 2018–2022 (MILLION UNITS)
  • TABLE 78 PASSENGER CAR REAR-VIEW MIRROR INTERIOR LIGHTS MARKET, BY REGION, 2023–2030 (MILLION UNITS)
  • TABLE 79 PASSENGER CAR FRONT LIGHTING MARKET, BY APPLICATION, 2018–2022 (MILLION UNITS)
  • TABLE 80 PASSENGER CAR FRONT LIGHTING MARKET, BY APPLICATION, 2023–2030 (MILLION UNITS)
  • TABLE 81 PASSENGER CAR HEADLIGHTS MARKET, BY REGION, 2018–2022 (MILLION UNITS)
  • TABLE 82 PASSENGER CAR HEADLIGHTS MARKET, BY REGION, 2023–2030 (MILLION UNITS)
  • TABLE 83 PASSENGER CAR FOG LIGHTS MARKET, BY REGION, 2018–2022 (MILLION UNITS)
  • TABLE 84 PASSENGER CAR FOG LIGHTS MARKET, BY REGION, 2023–2030 (MILLION UNITS)
  • TABLE 85 PASSENGER CAR DAYTIME RUNNING LIGHTS MARKET, BY REGION, 2018–2022 (MILLION UNITS)
  • TABLE 86 PASSENGER CAR DAYTIME RUNNING LIGHTS MARKET, BY REGION, 2023–2030 (MILLION UNITS)
  • TABLE 87 PASSENGER CAR REAR LIGHTING MARKET, BY APPLICATION, 2018–2022 (MILLION UNITS)
  • TABLE 88 PASSENGER CAR REAR LIGHTING MARKET, BY APPLICATION, 2023–2030 (MILLION UNITS)
  • TABLE 89 PASSENGER CAR TAIL LIGHTS MARKET, BY REGION, 2018–2022 (MILLION UNITS)
  • TABLE 90 PASSENGER CAR TAIL LIGHTS MARKET, BY REGION, 2023–2030 (MILLION UNITS)
  • TABLE 91 PASSENGER CAR CENTER HIGH-MOUNT STOP LIGHTS MARKET, BY REGION, 2018–2022 (MILLION UNITS)
  • TABLE 92 PASSENGER CAR CENTER HIGH-MOUNT STOP LIGHTS MARKET, BY REGION, 2023–2030 (MILLION UNITS)
  • TABLE 93 PASSENGER CAR LICENSE PLATE LIGHTS MARKET, BY REGION, 2018–2022 (MILLION UNITS)
  • TABLE 94 PASSENGER CAR LICENSE PLATE LIGHTS MARKET, BY REGION, 2023–2030 (MILLION UNITS)
  • TABLE 95 PASSENGER CAR SIDE LIGHTING MARKET, BY REGION, 2018–2022 (MILLION UNITS)
  • TABLE 96 PASSENGER CAR SIDE LIGHTING MARKET, BY REGION, 2023–2030 (MILLION UNITS)
  • TABLE 97 PASSENGER CAR SIDELIGHTS MARKET, BY REGION, 2018–2022 (MILLION UNITS)
  • TABLE 98 PASSENGER CAR SIDELIGHTS MARKET, BY REGION, 2023–2030 (MILLION UNITS)
  • TABLE 99 PASSENGER CAR SIDE REAR-VIEW MIRROR INDICATOR LIGHTS MARKET, BY REGION, 2018–2022 (MILLION UNITS)
  • TABLE 100 PASSENGER CAR SIDE REAR-VIEW MIRROR INDICATOR LIGHTS MARKET, BY REGION, 2023–2030 (MILLION UNITS)
  • TABLE 101 LCV INTERIOR LIGHTING MARKET, BY APPLICATION, 2018–2022 (MILLION UNITS)
  • TABLE 102 LCV INTERIOR LIGHTING MARKET, BY APPLICATION, 2023–2030 (MILLION UNITS)
  • TABLE 103 LCV DASHBOARD LIGHTS MARKET, BY REGION, 2018–2022 (MILLION UNITS)
  • TABLE 104 LCV DASHBOARD LIGHTS MARKET, BY REGION, 2023–2030 (MILLION UNITS)
  • TABLE 105 LCV GLOVE BOX LIGHTS MARKET, BY REGION, 2018–2022 (MILLION UNITS)
  • TABLE 106 LCV GLOVE BOX LIGHTS MARKET, BY REGION, 2023–2030 (MILLION UNITS)
  • TABLE 107 LCV READING LIGHTS MARKET, BY REGION, 2018–2022 (MILLION UNITS)
  • TABLE 108 LCV READING LIGHTS MARKET, BY REGION, 2023–2030 (MILLION UNITS)
  • TABLE 109 LCV DOME LIGHTS MARKET, BY REGION, 2018–2022 (MILLION UNITS)
  • TABLE 110 LCV DOME LIGHTS MARKET, BY REGION, 2023–2030 (MILLION UNITS)
  • TABLE 111 LCV REAR-VIEW MIRROR INTERIOR LIGHTS MARKET, BY REGION, 2018–2022 (MILLION UNITS)
  • TABLE 112 LCV REAR-VIEW MIRROR INTERIOR LIGHTS MARKET, BY REGION, 2023–2030 (MILLION UNITS)
  • TABLE 113 LCV FRONT LIGHTING MARKET, BY APPLICATION, 2018–2022 (MILLION UNITS)
  • TABLE 114 LCV FRONT LIGHTING MARKET, BY APPLICATION, 2023–2030 (MILLION UNITS)
  • TABLE 115 LCV HEADLIGHTS MARKET, BY REGION, 2018–2022 (MILLION UNITS)
  • TABLE 116 LCV HEADLIGHTS MARKET, BY REGION, 2023–2030 (MILLION UNITS)
  • TABLE 117 LCV FOG LIGHTS MARKET, BY REGION, 2018–2022 (MILLION UNITS)
  • TABLE 118 LCV FOG LIGHTS MARKET, BY REGION, 2023–2030 (MILLION UNITS)
  • TABLE 119 LCV DAYTIME RUNNING LIGHTS MARKET, BY REGION, 2018–2022 (MILLION UNITS)
  • TABLE 120 LCV DAYTIME RUNNING LIGHTS MARKET, BY REGION, 2023–2030 (MILLION UNITS)
  • TABLE 121 LCV REAR LIGHTING MARKET, BY APPLICATION, 2018–2022 (MILLION UNITS)
  • TABLE 122 LCV REAR LIGHTING MARKET, BY APPLICATION, 2023–2030 (MILLION UNITS)
  • TABLE 123 LCV TAIL LIGHTS MARKET, BY REGION, 2018–2022 (MILLION UNITS)
  • TABLE 124 LCV TAIL LIGHTS MARKET, BY REGION, 2023–2030 (MILLION UNITS)
  • TABLE 125 LCV CENTER HIGH-MOUNT STOP LIGHTS MARKET, BY REGION, 2018–2022 (MILLION UNITS)
  • TABLE 126 LCV CENTER HIGH-MOUNT STOP LIGHTS MARKET, BY REGION, 2023–2030 (MILLION UNITS)
  • TABLE 127 LCV LICENSE PLATE LIGHTS MARKET, BY REGION, 2018–2022 (MILLION UNITS)
  • TABLE 128 LCV LICENSE PLATE LIGHTS MARKET, BY REGION, 2023–2030 (MILLION UNITS)
  • TABLE 129 LCV SIDE LIGHTING MARKET, BY APPLICATION, 2018–2022 (MILLION UNITS)
  • TABLE 130 LCV SIDE LIGHTING MARKET, BY APPLICATION, 2023–2030 (MILLION UNITS)
  • TABLE 131 LCV SIDELIGHTS MARKET, BY REGION, 2018–2022 (MILLION UNITS)
  • TABLE 132 LCV SIDELIGHTS MARKET, BY REGION, 2023–2030 (MILLION UNITS)
  • TABLE 133 TRUCK INTERIOR LIGHTING MARKET, BY APPLICATION, 2018–2022 (MILLION UNITS)
  • TABLE 134 TRUCK INTERIOR LIGHTING MARKET, BY APPLICATION, 2023–2030 (MILLION UNITS)
  • TABLE 135 TRUCK DASHBOARD LIGHTS MARKET, BY REGION, 2018–2022 (MILLION UNITS)
  • TABLE 136 TRUCK DASHBOARD LIGHTS MARKET, BY REGION, 2023–2030 (MILLION UNITS)
  • TABLE 137 TRUCK CABIN AND READING LIGHTS MARKET, BY REGION, 2018–2022 (MILLION UNITS)
  • TABLE 138 TRUCK CABIN AND READING LIGHTS MARKET, BY REGION, 2023–2030 (MILLION UNITS)
  • TABLE 139 TRUCK ENGINE COMPARTMENT LIGHTS MARKET, BY REGION, 2018–2022 (MILLION UNITS)
  • TABLE 140 TRUCK ENGINE COMPARTMENT LIGHTS MARKET, BY REGION, 2023–2030 (MILLION UNITS)
  • TABLE 141 TRUCK FRONT LIGHTING MARKET, BY APPLICATION, 2018–2022 (MILLION UNITS)
  • TABLE 142 TRUCK FRONT LIGHTING MARKET, BY APPLICATION, 2023–2030 (MILLION UNITS)
  • TABLE 143 TRUCK HEADLIGHTS MARKET, BY REGION, 2018–2022 (MILLION UNITS)
  • TABLE 144 TRUCK HEADLIGHTS MARKET, BY REGION, 2023–2030 (MILLION UNITS)
  • TABLE 145 TRUCK FOG LIGHTS MARKET, BY REGION, 2018–2022 (MILLION UNITS)
  • TABLE 146 TRUCK FOG LIGHTS MARKET, BY REGION, 2023–2030 (MILLION UNITS)
  • TABLE 147 TRUCK CLEARANCE LAMPS MARKET, BY REGION, 2018–2022 (MILLION UNITS)
  • TABLE 148 TRUCK CLEARANCE LAMPS MARKET, BY REGION, 2023–2030 (MILLION UNITS)
  • TABLE 149 TRUCK TURN SIGNAL LAMPS MARKET, BY REGION, 2018–2022 (MILLION UNITS)
  • TABLE 150 TRUCK TURN SIGNAL LAMPS MARKET, BY REGION, 2023–2030 (MILLION UNITS)
  • TABLE 151 TRUCK DAYTIME RUNNING LIGHTS MARKET, BY REGION, 2018–2022 (MILLION UNITS)
  • TABLE 152 TRUCK DAYTIME RUNNING LIGHTS MARKET, BY REGION, 2023–2030 (MILLION UNITS)
  • TABLE 153 TRUCK REAR LIGHTING MARKET, BY APPLICATION, 2018–2022 (MILLION UNITS)
  • TABLE 154 TRUCK REAR LIGHTING MARKET, BY APPLICATION, 2023–2030 (MILLION UNITS)
  • TABLE 155 TRUCK STOP LAMPS MARKET, BY REGION, 2018–2022 (MILLION UNITS)
  • TABLE 156 TRUCK STOP LAMPS MARKET, BY REGION, 2023–2030 (MILLION UNITS)
  • TABLE 157 TRUCK TAIL LAMPS MARKET, BY REGION, 2018–2022 (MILLION UNITS)
  • TABLE 158 TRUCK TAIL LAMPS MARKET, BY REGION, 2023–2030 (MILLION UNITS)
  • TABLE 159 TRUCK LICENSE PLATE LAMPS MARKET, BY REGION, 2018–2022 (MILLION UNITS)
  • TABLE 160 TRUCK LICENSE PLATE LAMPS MARKET, BY REGION, 2023–2030 (MILLION UNITS)
  • TABLE 161 TRUCK TURN SIGNAL LAMPS MARKET, BY REGION, 2018–2022 (MILLION UNITS)
  • TABLE 162 TRUCK TURN SIGNAL LAMPS MARKET, BY REGION, 2023–2030 (MILLION UNITS)
  • TABLE 163 TRUCK SIDE LIGHTING MARKET, BY APPLICATION, 2018–2022 (MILLION UNITS)
  • TABLE 164 TRUCK SIDE LIGHTING MARKET, BY APPLICATION, 2023–2030 (MILLION UNITS)
  • TABLE 165 TRUCK MARKER LAMPS MARKET, BY REGION, 2018–2022 (MILLION UNITS)
  • TABLE 166 TRUCK MARKER LAMPS MARKET, BY REGION, 2023–2030 (MILLION UNITS)
  • TABLE 167 BUS INTERIOR LIGHTING MARKET, BY APPLICATION, 2018–2022 (MILLION UNITS)
  • TABLE 168 BUS INTERIOR LIGHTING MARKET, BY APPLICATION, 2023–2030 (MILLION UNITS)
  • TABLE 169 BUS DASHBOARD LAMPS MARKET, BY REGION, 2018–2022 (MILLION UNITS)
  • TABLE 170 BUS DASHBOARD LAMPS MARKET, BY REGION, 2023–2030 (MILLION UNITS)
  • TABLE 171 BUS AREA LIGHTS MARKET, BY REGION, 2018–2022 (MILLION UNITS)
  • TABLE 172 BUS AREA LIGHTS MARKET, BY REGION, 2023–2030 (MILLION UNITS)
  • TABLE 173 BUS DRIVER AREA LIGHTS MARKET, BY REGION, 2018–2022 (MILLION UNITS)
  • TABLE 174 BUS DRIVER AREA LIGHTS MARKET, BY REGION, 2023–2030 (MILLION UNITS)
  • TABLE 175 BUS FOOTWELL LIGHTS MARKET, BY REGION, 2018–2022 (MILLION UNITS)
  • TABLE 176 BUS FOOTWELL LIGHTS MARKET, BY REGION, 2023–2030 (MILLION UNITS)
  • TABLE 177 BUS FRONT LIGHTING MARKET, BY APPLICATION, 2018–2022 (MILLION UNITS)
  • TABLE 178 BUS FRONT LIGHTING MARKET, BY APPLICATION, 2023–2030 (MILLION UNITS)
  • TABLE 179 BUS HEADLAMP UNITS MARKET, BY REGION, 2018–2022 (MILLION UNITS)
  • TABLE 180 BUS HEADLAMP UNITS MARKET, BY REGION, 2023–2030 (MILLION UNITS)
  • TABLE 181 BUS CLEARANCE LAMPS MARKET, BY REGION, 2018–2022 (MILLION UNITS)
  • TABLE 182 BUS CLEARANCE LAMPS MARKET, BY REGION, 2023–2030 (MILLION UNITS)
  • TABLE 183 BUS INDICATOR LAMPS MARKET, BY REGION, 2018–2022 (MILLION UNITS)
  • TABLE 184 BUS INDICATOR LAMPS MARKET, BY REGION, 2023–2030 (MILLION UNITS)
  • TABLE 185 BUS IDENTIFICATION LAMPS MARKET, BY REGION, 2018–2022 (MILLION UNITS)
  • TABLE 186 BUS IDENTIFICATION LAMPS MARKET, BY REGION, 2023–2030 (MILLION UNITS)
  • TABLE 187 BUS DAYTIME RUNNING LIGHTS MARKET, BY REGION, 2018–2022 (MILLION UNITS)
  • TABLE 188 BUS DAYTIME RUNNING LIGHTS MARKET, BY REGION, 2023–2030 (MILLION UNITS)
  • TABLE 189 BUS REAR LIGHTING MARKET, BY APPLICATION, 2018–2022 (MILLION UNITS)
  • TABLE 190 BUS REAR LIGHTING MARKET, BY APPLICATION, 2023–2030 (MILLION UNITS)
  • TABLE 191 BUS LICENSE PLATE LAMPS MARKET, BY REGION, 2018–2022 (MILLION UNITS)
  • TABLE 192 BUS LICENSE PLATE LAMPS MARKET, BY APPLICATION, 2023–2030 (MILLION UNITS)
  • TABLE 193 BUS TAIL LAMPS MARKET, BY REGION, 2018–2022 (MILLION UNITS)
  • TABLE 194 BUS TAIL LAMPS MARKET, BY REGION, 2023–2030 (MILLION UNITS)
  • TABLE 195 BUS REAR CLEARANCE LAMPS MARKET, BY REGION, 2018–2022 (MILLION UNITS)
  • TABLE 196 BUS REAR CLEARANCE LAMPS MARKET, BY REGION, 2023–2030 (MILLION UNITS)
  • TABLE 197 BUS REAR IDENTIFICATION LAMPS MARKET, BY REGION, 2018–2022 (MILLION UNITS)
  • TABLE 198 BUS REAR IDENTIFICATION LAMPS MARKET, BY REGION, 2023–2030 (MILLION UNITS)
  • TABLE 199 BUS STOP LAMPS MARKET, BY REGION, 2018–2022 (MILLION UNITS)
  • TABLE 200 BUS STOP LAMPS MARKET, BY REGION, 2023–2030 (MILLION UNITS)
  • TABLE 201 BUS SIDE LIGHTING MARKET, BY APPLICATION, 2018–2022 (MILLION UNITS)
  • TABLE 202 BUS SIDE LIGHTING MARKET, BY APPLICATION, 2023–2030 (MILLION UNITS)
  • TABLE 203 BUS MARKER LAMPS MARKET, BY REGION, 2018–2022 (MILLION UNITS)
  • TABLE 204 BUS MARKER LAMPS MARKET, BY REGION, 2023–2030 (MILLION UNITS)
  • TABLE 205 MARKET, BY VEHICLE TYPE, 2018–2022 (MILLION UNITS)
  • TABLE 206 MARKET, BY VEHICLE TYPE, 2023–2030 (MILLION UNITS)
  • TABLE 207 MARKET, BY VEHICLE TYPE, 2018–2022 (USD MILLION)
  • TABLE 208 MARKET, BY VEHICLE TYPE, 2023–2030 (USD MILLION)
  • TABLE 209 PASSENGER CARS LIGHTING MARKET, BY REGION, 2018–2022 (MILLION UNITS)
  • TABLE 210 PASSENGER CARS LIGHTING MARKET, BY REGION, 2023–2030 (MILLION UNITS)
  • TABLE 211 PASSENGER CARS LIGHTING MARKET, BY REGION, 2018–2022 (USD MILLION)
  • TABLE 212 PASSENGER CARS LIGHTING MARKET, BY REGION, 2023–2030 (USD MILLION)
  • TABLE 213 LIGHT COMMERCIAL VEHICLES LIGHTING MARKET, BY REGION, 2018–2022 (MILLION UNITS)
  • TABLE 214 LIGHT COMMERCIAL VEHICLES LIGHTING MARKET, BY REGION, 2023–2030 (MILLION UNITS)
  • TABLE 215 LIGHT COMMERCIAL VEHICLES LIGHTING MARKET, BY REGION, 2018–2022 (USD MILLION)
  • TABLE 216 LIGHT COMMERCIAL VEHICLES LIGHTING MARKET, BY REGION, 2023–2030 (USD MILLION)
  • TABLE 217 TRUCKS LIGHTING MARKET, BY REGION, 2018–2022 (MILLION UNITS)
  • TABLE 218 TRUCKS LIGHTING MARKET, BY REGION, 2023–2030 (MILLION UNITS)
  • TABLE 219 TRUCKS LIGHTING MARKET, BY REGION, 2018–2022 (USD MILLION)
  • TABLE 220 TRUCKS LIGHTING MARKET, BY REGION, 2023–2030 (USD MILLION)
  • TABLE 221 BUSES LIGHTING MARKET, BY REGION, 2018–2022 (MILLION UNITS)
  • TABLE 222 BUSES LIGHTING MARKET, BY REGION, 2023–2030 (MILLION UNITS)
  • TABLE 223 BUSES LIGHTING MARKET, BY REGION, (2018–2022) (USD MILLION)
  • TABLE 224 BUSES LIGHTING MARKET, BY REGION, 2023–2030 (USD MILLION)
  • TABLE 225 FRONT ADAPTIVE LIGHTING MARKET, BY REGION, 2018–2022 (MILLION UNITS)
  • TABLE 226 FRONT ADAPTIVE LIGHTING MARKET, BY REGION, 2023–2030 (MILLION UNITS)
  • TABLE 227 FRONT ADAPTIVE LIGHTING MARKET, BY REGION, 2018–2022 (USD MILLION)
  • TABLE 228 FRONT ADAPTIVE LIGHTING MARKET, BY REGION, 2023–2030 (USD MILLION)
  • TABLE 229 AUTO ON/OFF LIGHTING MARKET, BY REGION, 2018–2022 (MILLION UNITS)
  • TABLE 230 AUTO ON/OFF LIGHTING MARKET, BY REGION, 2023–2030 (MILLION UNITS)
  • TABLE 231 AUTO ON/OFF LIGHTING MARKET, BY REGION, 2018–2022 (USD MILLION)
  • TABLE 232 AUTO ON/OFF LIGHTING MARKET, BY REGION, 2023–2030 (USD MILLION)
  • TABLE 233 BENDING/CORNERING LIGHTING MARKET, BY REGION, 2018–2022 (MILLION UNITS)
  • TABLE 234 BENDING/CORNERING LIGHTING MARKET, BY REGION, 2023–2030 (MILLION UNITS)
  • TABLE 235 BENDING/CORNERING LIGHTING MARKET, BY REGION, 2018–2022 (USD MILLION)
  • TABLE 236 BENDING/CORNERING LIGHTING MARKET, BY REGION, 2023–2030 (USD MILLION)
  • TABLE 237 HIGH BEAM ASSIST LIGHTING MARKET, BY REGION, 2018–2022 (MILLION UNITS)
  • TABLE 238 HIGH BEAM ASSIST LIGHTING MARKET, BY REGION, 2023–2030 (MILLION UNITS)
  • TABLE 239 HIGH BEAM ASSIST LIGHTING MARKET, BY REGION, 2018–2022 (USD MILLION)
  • TABLE 240 HIGH BEAM ASSIST LIGHTING MARKET, BY REGION, 2023–2030 (USD MILLION)
  • TABLE 241 HEADLIGHT LEVELING LIGHTING MARKET, BY REGION, 2018–2022 (MILLION UNITS)
  • TABLE 242 HEADLIGHT LEVELING LIGHTING MARKET, BY REGION, 2023–2030 (MILLION UNITS)
  • TABLE 243 HEADLIGHT LEVELING LIGHTING MARKET, BY REGION, 2018–2022 (USD MILLION)
  • TABLE 244 HEADLIGHT LEVELING LIGHTING MARKET, BY REGION, 2023–2030 (USD MILLION)
  • TABLE 245 REAR ADAPTIVE LIGHTING MARKET, BY REGION, 2018–2022 (MILLION UNITS)
  • TABLE 246 REAR ADAPTIVE LIGHTING MARKET, BY REGION, 2023–2030 (MILLION UNITS)
  • TABLE 247 REAR ADAPTIVE LIGHTING MARKET, BY REGION, 2018–2022 (USD MILLION)
  • TABLE 248 REAR ADAPTIVE LIGHTING MARKET, BY REGION, 2023–2030 (USD MILLION)
  • TABLE 249 AUTOMOTIVE AMBIENT LIGHTING MARKET, BY REGION, 2018–2022 (MILLION UNITS)
  • TABLE 250 AUTOMOTIVE AMBIENT LIGHTING MARKET, BY REGION, 2023–2030 (MILLION UNITS)
  • TABLE 251 AUTOMOTIVE AMBIENT LIGHTING MARKET, BY REGION, 2018–2022 (USD MILLION)
  • TABLE 252 AUTOMOTIVE AMBIENT LIGHTING MARKET, BY REGION, 2023–2030 (USD MILLION)
  • TABLE 253 ELECTRIC VEHICLE LIGHTING MARKET, BY VEHICLE TYPE, 2018–2022 (MILLION UNITS)
  • TABLE 254 ELECTRIC VEHICLE LIGHTING MARKET, BY VEHICLE TYPE, 2023–2030 (MILLION UNITS)
  • TABLE 255 ELECTRIC VEHICLE LIGHTING MARKET, BY VEHICLE TYPE, 2018–2022 (USD MILLION)
  • TABLE 256 ELECTRIC VEHICLE LIGHTING MARKET, BY VEHICLE TYPE, 2023–2030 (USD MILLION)
  • TABLE 257 BEV LIGHTING MARKET, BY REGION, 2018–2022 (MILLION UNITS)
  • TABLE 258 BEV LIGHTING MARKET, BY REGION, 2023–2030 (MILLION UNITS)
  • TABLE 259 BEV LIGHTING MARKET, BY REGION, 2018–2022 (USD MILLION)
  • TABLE 260 BEV LIGHTING MARKET, BY REGION 2023–2030 (USD MILLION)
  • TABLE 261 PHEV LIGHTING MARKET, BY REGION, 2018–2022 (MILLION UNITS)
  • TABLE 262 PHEV LIGHTING MARKET, BY REGION, 2023–2030 (MILLION UNITS)
  • TABLE 263 PHEV LIGHTING MARKET, BY REGION, 2018–2022 (USD MILLION)
  • TABLE 264 PHEV LIGHTING MARKET, BY REGION, 2023–2030 (USD MILLION)
  • TABLE 265 FCEV LIGHTING MARKET, BY REGION, 2018–2022 (MILLION UNITS)
  • TABLE 266 FCEV LIGHTING MARKET, BY REGION, 2023–2030 (MILLION UNITS)
  • TABLE 267 FCEV LIGHTING MARKET, BY REGION, 2018–2022 (USD MILLION)
  • TABLE 268 FCEV LIGHTING MARKET, BY REGION, 2023–2030 (USD MILLION)
  • TABLE 269 ELECTRIC VEHICLES LIGHTING MARKET, BY TECHNOLOGY, 2018–2022 (MILLION UNITS)
  • TABLE 270 ELECTRIC VEHICLES LIGHTING MARKET, BY TECHNOLOGY, 2023–2030 (MILLION UNITS)
  • TABLE 271 ELECTRIC VEHICLES LIGHTING MARKET, BY TECHNOLOGY, 2018–2022 (USD MILLION)
  • TABLE 272 ELECTRIC VEHICLES LIGHTING MARKET, BY TECHNOLOGY, 2023–2030 (USD MILLION)
  • TABLE 273 HALOGEN: ELECTRIC VEHICLE LIGHTING MARKET, BY REGION, 2018–2022 (MILLION UNITS)
  • TABLE 274 HALOGEN: ELECTRIC VEHICLE LIGHTING MARKET, BY REGION, 2023–2030 (MILLION UNITS)
  • TABLE 275 HALOGEN: ELECTRIC VEHICLE LIGHTING MARKET, BY REGION, 2018–2022 (USD MILLION)
  • TABLE 276 HALOGEN: ELECTRIC VEHICLE LIGHTING MARKET, BY REGION, 2023–2030 (USD MILLION)
  • TABLE 277 LED: ELECTRIC VEHICLE LIGHTING MARKET, BY REGION, 2018–2022 (MILLION UNITS)
  • TABLE 278 LED: ELECTRIC VEHICLE LIGHTING MARKET, BY REGION, 2023–2030 (MILLION UNITS)
  • TABLE 279 LED: ELECTRIC VEHICLE LIGHTING MARKET, BY REGION, 2018–2022 (USD MILLION)
  • TABLE 280 LED: ELECTRIC VEHICLE LIGHTING MARKET, BY REGION, 2023–2030 (USD MILLION)
  • TABLE 281 XENON/HID: ELECTRIC VEHICLE LIGHTING MARKET, BY REGION, 2018–2022 (MILLION UNITS)
  • TABLE 282 XENON/HID: ELECTRIC VEHICLE LIGHTING MARKET, BY REGION, 2023–2030 (MILLION UNITS)
  • TABLE 283 XENON/HID: ELECTRIC VEHICLE LIGHTING MARKET, BY REGION, 2018–2022 (USD MILLION)
  • TABLE 284 XENON/HID: ELECTRIC VEHICLE LIGHTING MARKET, BY REGION, 2023–2030 (USD MILLION)
  • TABLE 285 ELECTRIC VEHICLE EXTERIOR LIGHTING MARKET, BY APPLICATION, 2018–2022 (MILLION UNITS)
  • TABLE 286 ELECTRIC VEHICLE EXTERIOR LIGHTING MARKET, BY APPLICATION, 2023–2030 (MILLION UNITS)
  • TABLE 287 ELECTRIC VEHICLE EXTERIOR LIGHTING MARKET, BY APPLICATION, 2018–2022 (USD MILLION)
  • TABLE 288 ELECTRIC VEHICLE EXTERIOR LIGHTING MARKET, BY APPLICATION, 2023–2030 (USD MILLION)
  • TABLE 289 ELECTRIC VEHICLE HEADLIGHTS MARKET, BY REGION, 2018–2022 (MILLION UNITS)
  • TABLE 290 ELECTRIC VEHICLE HEADLIGHTS MARKET, BY REGION, 2023–2030 (MILLION UNITS)
  • TABLE 291 ELECTRIC VEHICLE HEADLIGHTS MARKET, BY REGION, 2018–2022 (USD MILLION)
  • TABLE 292 ELECTRIC VEHICLE HEADLIGHTS MARKET, BY REGION, 2023–2030 (USD MILLION)
  • TABLE 293 ELECTRIC VEHICLE FOG LIGHTS MARKET, BY REGION, 2018–2022 (MILLION UNITS)
  • TABLE 294 ELECTRIC VEHICLE FOG LIGHTS MARKET, BY REGION, 2023–2030 (MILLION UNITS)
  • TABLE 295 ELECTRIC VEHICLE FOG LIGHTS MARKET, BY REGION, 2018–2022 (USD MILLION)
  • TABLE 296 ELECTRIC VEHICLE FOG LIGHTS MARKET, BY REGION, 2023–2030 (USD MILLION)
  • TABLE 297 ELECTRIC VEHICLE DAYTIME RUNNING LIGHTS MARKET, BY REGION, 2018–2022 (MILLION UNITS)
  • TABLE 298 ELECTRIC VEHICLE DAYTIME RUNNING LIGHTS MARKET, BY REGION, 2023–2030 (MILLION UNITS)
  • TABLE 299 ELECTRIC VEHICLE DAYTIME RUNNING LIGHTS MARKET, BY REGION, 2018–2022 (USD MILLION)
  • TABLE 300 ELECTRIC VEHICLE DAYTIME RUNNING LIGHTS MARKET, BY REGION, 2023–2030 (USD MILLION)
  • TABLE 301 ELECTRIC VEHICLE TAILLIGHTS MARKET, BY REGION, 2018–2022 (MILLION UNITS)
  • TABLE 302 ELECTRIC VEHICLE TAILLIGHTS MARKET, BY REGION, 2023–2030 (MILLION UNITS)
  • TABLE 303 ELECTRIC VEHICLE TAILLIGHTS MARKET, BY REGION, 2018–2022 (USD MILLION)
  • TABLE 304 ELECTRIC VEHICLE TAILLIGHTS MARKET, BY REGION, 2023–2030 (USD MILLION)
  • TABLE 305 ELECTRIC VEHICLE SIDELIGHTS MARKET, BY REGION, 2018–2022 (MILLION UNITS)
  • TABLE 306 ELECTRIC VEHICLE SIDELIGHTS MARKET, BY REGION, 2023–2030 (MILLION UNITS)
  • TABLE 307 ELECTRIC VEHICLE SIDELIGHTS MARKET, BY REGION, 2018–2022 (USD MILLION)
  • TABLE 308 ELECTRIC VEHICLE SIDELIGHTS MARKET, BY REGION, 2023–2030 (USD MILLION)
  • TABLE 309 ELECTRIC VEHICLE CENTER HIGH-MOUNT STOP LIGHTS MARKET, BY REGION, 2018–2022 (MILLION UNITS)
  • TABLE 310 ELECTRIC VEHICLE CENTER HIGH-MOUNT STOP LIGHTS MARKET, BY REGION, 2023–2030 (MILLION UNITS)
  • TABLE 311 ELECTRIC VEHICLE CENTER HIGH-MOUNT STOP LIGHTS MARKET, BY REGION, 2018–2022 (USD MILLION)
  • TABLE 312 ELECTRIC VEHICLE CENTER HIGH-MOUNT STOP LIGHTS MARKET, BY REGION, 2023–2030 (USD MILLION)
  • TABLE 313 ELECTRIC VEHICLE INTERIOR LIGHTING MARKET, BY APPLICATION, 2018–2022 (MILLION UNITS)
  • TABLE 314 ELECTRIC VEHICLE INTERIOR LIGHTING MARKET, BY APPLICATION, 2023–2030 (MILLION UNITS)
  • TABLE 315 ELECTRIC VEHICLE INTERIOR LIGHTING MARKET, BY APPLICATION, 2018–2022 (USD MILLION)
  • TABLE 316 ELECTRIC VEHICLE INTERIOR LIGHTING MARKET, BY APPLICATION, 2023–2030 (USD MILLION)
  • TABLE 317 ELECTRIC VEHICLE DASHBOARD LIGHTS MARKET, BY REGION, 2018–2022 (MILLION UNITS)
  • TABLE 318 ELECTRIC VEHICLE DASHBOARD LIGHTS MARKET, BY REGION, 2023–2030 (MILLION UNITS)
  • TABLE 319 ELECTRIC VEHICLE DASHBOARD LIGHTS MARKET, BY REGION, 2018–2022 (USD MILLION)
  • TABLE 320 ELECTRIC VEHICLE DASHBOARD LIGHTS MARKET, BY REGION, 2023–2030 (USD MILLION)
  • TABLE 321 ELECTRIC VEHICLE GLOVE BOX LIGHTS MARKET, BY REGION, 2018–2022 (MILLION UNITS)
  • TABLE 322 ELECTRIC VEHICLE GLOVE BOX LIGHTS MARKET, BY REGION, 2023–2030 (MILLION UNITS)
  • TABLE 323 ELECTRIC VEHICLE GLOVE BOX LIGHTS MARKET, BY REGION, 2018–2022 (USD MILLION)
  • TABLE 324 ELECTRIC VEHICLE GLOVE BOX LIGHTS MARKET, BY REGION, 2023–2030 (USD MILLION)
  • TABLE 325 ELECTRIC VEHICLE READING LIGHTS MARKET, BY REGION, 2018–2022 (MILLION UNITS)
  • TABLE 326 ELECTRIC VEHICLE READING LIGHTS MARKET, BY REGION, 2023–2030 (MILLION UNITS)
  • TABLE 327 ELECTRIC VEHICLE READING LIGHTS MARKET, BY REGION, 2018–2022 (USD MILLION)
  • TABLE 328 ELECTRIC VEHICLE READING LIGHTS MARKET, BY REGION, 2023–2030 (USD MILLION)
  • TABLE 329 ELECTRIC VEHICLE DOME LIGHTS MARKET, BY REGION, 2018–2022 (MILLION UNITS)
  • TABLE 330 ELECTRIC VEHICLE DOME LIGHTS MARKET, BY REGION, 2023–2030 (MILLION UNITS)
  • TABLE 331 ELECTRIC VEHICLE DOME LIGHTS MARKET, BY REGION, 2018–2022 (USD MILLION)
  • TABLE 332 ELECTRIC VEHICLE DOME LIGHTS MARKET, BY REGION, 2023–2030 (USD MILLION)
  • TABLE 333 TWO-WHEELER LIGHTING MARKET, BY POSITION, 2018–2022 (‘000 UNITS)
  • TABLE 334 TWO-WHEELER LIGHTING MARKET, BY POSITION, 2023–2030 (‘000 UNITS)
  • TABLE 335 TWO-WHEELER LIGHTING MARKET, BY POSITION, 2018–2022 (USD MILLION)
  • TABLE 336 TWO-WHEELER LIGHTING MARKET, BY POSITION, 2023–2030 (USD MILLION)
  • TABLE 337 TWO-WHEELER FRONT LIGHTING MARKET, BY REGION, 2018–2022 (‘000 UNITS)
  • TABLE 338 TWO-WHEELER FRONT LIGHTING MARKET, BY REGION, 2023–2030 (‘000 UNITS)
  • TABLE 339 TWO-WHEELER FRONT LIGHTING MARKET, BY REGION, 2018–2022 (USD MILLION)
  • TABLE 340 TWO-WHEELER FRONT LIGHTING MARKET, BY REGION, 2023–2030 (USD MILLION)
  • TABLE 341 TWO-WHEELER SIDE LIGHTING MARKET, BY REGION, 2018–2022 (‘000 UNITS)
  • TABLE 342 TWO-WHEELER SIDE LIGHTING MARKET, BY REGION, 2023–2030 (‘000 UNITS)
  • TABLE 343 TWO-WHEELER SIDE LIGHTING MARKET, BY REGION, 2018–2022 (USD MILLION)
  • TABLE 344 TWO-WHEELER SIDE LIGHTING MARKET, BY REGION, 2023–2030 (USD MILLION)
  • TABLE 345 TWO-WHEELER REAR LIGHTING MARKET, BY REGION, 2018–2022 (‘000 UNITS)
  • TABLE 346 TWO-WHEELER REAR LIGHTING MARKET, BY REGION, 2023–2030 (‘000 UNITS)
  • TABLE 347 TWO-WHEELER REAR LIGHTING MARKET, BY REGION, 2018–2022 (USD MILLION)
  • TABLE 348 TWO-WHEELER REAR LIGHTING MARKET, BY REGION, 2023–2030 (USD MILLION)
  • TABLE 349 MARKET, BY REGION, 2018–2022 (MILLION UNITS)
  • TABLE 350 MARKET, BY REGION, 2023–2030 (MILLION UNITS)
  • TABLE 351 MARKET, BY REGION, 2018–2022 (USD MILLION)
  • TABLE 352 AUTOMOTIVE LIGHTING MARKET, BY REGION, 2023–2030 (USD MILLION)
  • TABLE 353 ASIA PACIFIC: MARKET, BY COUNTRY, 2018–2022 (MILLION UNITS)
  • TABLE 354 ASIA PACIFIC: MARKET, BY COUNTRY, 2023–2030 (MILLION UNITS)
  • TABLE 355 ASIA PACIFIC: MARKET, BY COUNTRY, 2018–2022 (USD MILLION)
  • TABLE 356 ASIA PACIFIC: MARKET, BY COUNTRY, 2023–2030 (USD MILLION)
  • TABLE 357 CHINA: MARKET, BY TECHNOLOGY, 2018–2022 (MILLION UNITS)
  • TABLE 358 CHINA: MARKET, BY TECHNOLOGY, 2023–2030 (MILLION UNITS)
  • TABLE 359 CHINA: MARKET, BY TECHNOLOGY, 2018–2022 (USD MILLION)
  • TABLE 360 CHINA: MARKET, BY TECHNOLOGY, 2023–2030 (USD MILLION)
  • TABLE 361 JAPAN: MARKET, BY TECHNOLOGY, 2018–2022 (MILLION UNITS)
  • TABLE 362 JAPAN: MARKET, BY TECHNOLOGY, 2023–2030 (MILLION UNITS)
  • TABLE 363 JAPAN: MARKET, BY TECHNOLOGY, 2018–2022 (USD MILLION)
  • TABLE 364 JAPAN: MARKET, BY TECHNOLOGY, 2023–2030 (USD MILLION)
  • TABLE 365 SOUTH KOREA: MARKET, BY TECHNOLOGY, 2018–2022 (MILLION UNITS)
  • TABLE 366 SOUTH KOREA: MARKET, BY TECHNOLOGY, 2023–2030 (MILLION UNITS)
  • TABLE 367 SOUTH KOREA: MARKET, BY TECHNOLOGY, 2018–2022 (USD MILLION)
  • TABLE 368 SOUTH KOREA: MARKET, BY TECHNOLOGY, 2023–2030 (USD MILLION)
  • TABLE 369 INDIA: MARKET, BY TECHNOLOGY, 2018–2022 (MILLION UNITS)
  • TABLE 370 INDIA: MARKET, BY TECHNOLOGY, 2023–2030 (MILLION UNITS)
  • TABLE 371 INDIA: MARKET, BY TECHNOLOGY, 2018–2022 (USD MILLION)
  • TABLE 372 INDIA: MARKET, BY TECHNOLOGY, 2023–2030 (USD MILLION)
  • TABLE 373 REST OF ASIA PACIFIC: MARKET, BY TECHNOLOGY, 2018–2022 (MILLION UNITS)
  • TABLE 374 REST OF ASIA PACIFIC: MARKET, BY TECHNOLOGY, 2023–2030 (MILLION UNITS)
  • TABLE 375 REST OF ASIA PACIFIC: MARKET, BY TECHNOLOGY, 2018–2022 (USD MILLION)
  • TABLE 376 REST OF ASIA PACIFIC: MARKET, BY TECHNOLOGY, 2023–2030 (USD MILLION)
  • TABLE 377 EUROPE: MARKET, BY COUNTRY, 2018–2022 (MILLION UNITS)
  • TABLE 378 EUROPE: MARKET, BY COUNTRY, 2023–2030 (MILLION UNITS)
  • TABLE 379 EUROPE: MARKET, BY COUNTRY, 2018–2022 (USD MILLION)
  • TABLE 380 EUROPE: MARKET, BY COUNTRY, 2023–2030 (USD MILLION)
  • TABLE 381 GERMANY: MARKET, BY TECHNOLOGY, 2018–2022 (MILLION UNITS)
  • TABLE 382 GERMANY: MARKET, BY TECHNOLOGY, 2023–2030 (MILLION UNITS)
  • TABLE 383 GERMANY: MARKET, BY TECHNOLOGY, 2018–2022 (USD MILLION)
  • TABLE 384 GERMANY: MARKET, BY TECHNOLOGY, 2023–2030 (USD MILLION)
  • TABLE 385 FRANCE: MARKET, BY TECHNOLOGY, 2018–2022 (MILLION UNITS)
  • TABLE 386 FRANCE: MARKET, BY TECHNOLOGY, 2023–2030 (MILLION UNITS)
  • TABLE 387 FRANCE: MARKET, BY TECHNOLOGY, 2018–2022 (USD MILLION)
  • TABLE 388 FRANCE: MARKET, BY TECHNOLOGY, 2023–2030 (USD MILLION)
  • TABLE 389 SPAIN: MARKET, BY TECHNOLOGY, 2018–2022 (MILLION UNITS)
  • TABLE 390 SPAIN: MARKET, BY TECHNOLOGY, 2023–2030 (MILLION UNITS)
  • TABLE 391 SPAIN: MARKET, BY TECHNOLOGY, 2018–2022 (USD MILLION)
  • TABLE 392 SPAIN: MARKET, BY TECHNOLOGY, 2023–2030 (USD MILLION)
  • TABLE 393 UK: MARKET, BY TECHNOLOGY, 2018–2022 (MILLION UNITS)
  • TABLE 394 UK: MARKET, BY TECHNOLOGY, 2023–2030 (MILLION UNITS)
  • TABLE 395 UK: MARKET, BY TECHNOLOGY, 2018–2022 (USD MILLION)
  • TABLE 396 UK: MARKET, BY TECHNOLOGY, 2023–2030 (USD MILLION)
  • TABLE 397 REST OF EUROPE: AUTOMOTIVE LIGHTING MARKET, BY TECHNOLOGY, 2018–2022 (MILLION UNITS)
  • TABLE 398 REST OF EUROPE: MARKET, BY TECHNOLOGY, 2023–2030 (MILLION UNITS)
  • TABLE 399 REST OF EUROPE: MARKET, BY TECHNOLOGY, 2018–2022 (USD MILLION)
  • TABLE 400 REST OF EUROPE: MARKET, BY TECHNOLOGY, 2023–2030 (USD MILLION)
  • TABLE 401 NORTH AMERICA: MARKET, BY COUNTRY, 2018–2022 (MILLION UNITS)
  • TABLE 402 NORTH AMERICA: MARKET, BY COUNTRY, 2023–2030 (MILLION UNITS)
  • TABLE 403 NORTH AMERICA: MARKET, BY COUNTRY, 2018–2022 (USD MILLION)
  • TABLE 404 NORTH AMERICA: MARKET, BY COUNTRY, 2023–2030 (USD MILLION)
  • TABLE 405 US: MARKET, BY TECHNOLOGY, 2018–2022 (MILLION UNITS)
  • TABLE 406 US: MARKET, BY TECHNOLOGY, 2023–2030 (MILLION UNITS)
  • TABLE 407 US: MARKET, BY TECHNOLOGY, 2018–2022 (USD MILLION)
  • TABLE 408 US: MARKET, BY TECHNOLOGY, 2023–2030 (USD MILLION)
  • TABLE 409 CANADA: MARKET, BY TECHNOLOGY, 2018–2022 (MILLION UNITS)
  • TABLE 410 CANADA: MARKET, BY TECHNOLOGY, 2023–2030 (MILLION UNITS)
  • TABLE 411 CANADA: MARKET, BY TECHNOLOGY, 2018–2022 (USD MILLION)
  • TABLE 412 CANADA: MARKET, BY TECHNOLOGY, 2023–2030 (USD MILLION)
  • TABLE 413 MEXICO: MARKET, BY TECHNOLOGY, 2018–2022 (MILLION UNITS)
  • TABLE 414 MEXICO: MARKET, BY TECHNOLOGY, 2023–2030 (MILLION UNITS)
  • TABLE 415 MEXICO: MARKET, BY TECHNOLOGY, 2018–2022 (USD MILLION)
  • TABLE 416 MEXICO: MARKET, BY TECHNOLOGY, 2023–2030 (USD MILLION)
  • TABLE 417 REST OF THE WORLD: MARKET, BY COUNTRY, 2018–2022 (MILLION UNITS)
  • TABLE 418 REST OF THE WORLD: MARKET, BY COUNTRY, 2023–2030 (MILLION UNITS)
  • TABLE 419 REST OF THE WORLD: MARKET, BY COUNTRY, 2018–2022 (USD MILLION)
  • TABLE 420 REST OF THE WORLD: MARKET, BY COUNTRY, 2023–2030 (USD MILLION)
  • TABLE 421 BRAZIL: MARKET, BY TECHNOLOGY, 2018–2022 (MILLION UNITS)
  • TABLE 422 BRAZIL: MARKET, BY TECHNOLOGY, 2023–2030 (MILLION UNITS)
  • TABLE 423 BRAZIL: MARKET, BY TECHNOLOGY, 2018–2022 (USD MILLION)
  • TABLE 424 BRAZIL: MARKET, BY TECHNOLOGY, 2023–2030 (USD MILLION)
  • TABLE 425 IRAN: MARKET, BY TECHNOLOGY, 2018–2022 (MILLION UNITS)
  • TABLE 426 IRAN: MARKET, BY TECHNOLOGY, 2023–2030 (MILLION UNITS)
  • TABLE 427 IRAN: MARKET, BY TECHNOLOGY, 2018–2022 (USD MILLION)
  • TABLE 428 IRAN: MARKET, BY TECHNOLOGY, 2023–2030 (USD MILLION)
  • TABLE 429 OTHERS: MARKET, BY TECHNOLOGY, 2018–2022 (MILLION UNITS)
  • TABLE 430 OTHERS: MARKET, BY TECHNOLOGY, 2023–2030 (MILLION UNITS)
  • TABLE 431 OTHERS: MARKET, BY TECHNOLOGY, 2018–2022 (USD MILLION)
  • TABLE 432 OTHERS: MARKET, BY TECHNOLOGY, 2023–2030 (USD MILLION)
  • TABLE 433 OVERVIEW OF STRATEGIES DEPLOYED BY KEY AUTOMOTIVE LIGHTING OEMS
  • TABLE 434 MARKET SHARE ANALYSIS OF TOP 5 PLAYERS (2022–2023)
  • TABLE 435 AUTOMOTIVE LIGHTING MARKET: COMPANY FOOTPRINT
  • TABLE 436 MARKET: REGION FOOTPRINT
  • TABLE 437 MARKET: COMPETITIVE BENCHMARKING OF SMES
  • TABLE 438 MARKET: PRODUCT LAUNCHES, 2021–2023
  • TABLE 439 MARKET: DEALS, 2021−2023
  • TABLE 440 MARKET: OTHERS, 2020−2023
  • TABLE 441 KOITO MANUFACTURING CO., LTD.: COMPANY OVERVIEW
  • TABLE 442 KOITO MANUFACTURING CO., LTD.: PRODUCTS OFFERED
  • TABLE 443 KOITO MANUFACTURING CO., LTD.: PRODUCT DEVELOPMENTS
  • TABLE 444 KOITO MANUFACTURING CO., LTD.: DEALS
  • TABLE 445 KOITO MANUFACTURING CO., LTD.: OTHERS
  • TABLE 446 HELLA GMBH & CO. KGAA: COMPANY OVERVIEW
  • TABLE 447 HELLA GMBH & CO. KGAA: PRODUCTS OFFERED
  • TABLE 448 HELLA GMBH & CO. KGAA: PRODUCT DEVELOPMENTS
  • TABLE 449 HELLA GMBH & CO. KGAA: DEALS
  • TABLE 450 HELLA GMBH & CO. KGAA: OTHERS
  • TABLE 451 VALEO SA: COMPANY OVERVIEW
  • TABLE 452 VALEO SA: PRODUCTS OFFERED
  • TABLE 453 VALEO SA: PRODUCT DEVELOPMENTS
  • TABLE 454 VALEO SA: DEALS
  • TABLE 455 VALEO SA: OTHERS
  • TABLE 456 OSRAM GMBH: COMPANY OVERVIEW
  • TABLE 457 OSRAM GMBH: PRODUCTS OFFERED
  • TABLE 458 OSRAM GMBH: PRODUCT DEVELOPMENTS
  • TABLE 459 OSRAM GMBH: DEALS
  • TABLE 460 CONTINENTAL AG: COMPANY OVERVIEW
  • TABLE 461 CONTINENTAL AG: PRODUCTS OFFERED
  • TABLE 462 CONTINENTAL AG: PRODUCT DEVELOPMENTS
  • TABLE 463 CONTINENTAL AG: DEALS
  • TABLE 464 CONTINENTAL AG: OTHERS
  • TABLE 465 HYUNDAI MOBIS: COMPANY OVERVIEW
  • TABLE 466 HYUNDAI MOBIS: PRODUCTS OFFERED
  • TABLE 467 HYUNDAI MOBIS: PRODUCT DEVELOPMENTS
  • TABLE 468 HYUNDAI MOBIS: DEALS
  • TABLE 469 HYUNDAI MOBIS: OTHERS
  • TABLE 470 MAGNETI MARELLI: COMPANY OVERVIEW
  • TABLE 471 MAGNETI MARELLI: PRODUCTS OFFERED
  • TABLE 472 MAGNETI MARELLI: PRODUCT DEVELOPMENTS
  • TABLE 473 MAGNETI MARELLI: DEALS
  • TABLE 474 MAGNETI MARELLI: OTHERS
  • TABLE 475 ICHIKOH INDUSTRIES, LTD.: COMPANY OVERVIEW
  • TABLE 476 ICHIKOH INDUSTRIES, LTD.: PRODUCTS OFFERED
  • TABLE 477 ICHIKOH INDUSTRIES, LTD.: PRODUCT DEVELOPMENTS
  • TABLE 478 ICHIKOH INDUSTRIES, LTD.: DEALS
  • TABLE 479 ICHIKOH INDUSTRIES, LTD.: OTHERS
  • TABLE 480 STANLEY ELECTRIC CO., LTD.: COMPANY OVERVIEW
  • TABLE 481 STANLEY ELECTRIC CO., LTD.: PRODUCTS OFFERED
  • TABLE 482 STANLEY ELECTRIC CO., LTD.: PRODUCT DEVELOPMENTS
  • TABLE 483 STANLEY ELECTRIC CO., LTD.: DEALS
  • TABLE 484 SIGNIFY (KONINKLIJKE PHILIPS N.V.): COMPANY OVERVIEW
  • TABLE 485 SIGNIFY (KONINKLIJKE PHILIPS N.V.): PRODUCTS OFFERED
  • TABLE 486 SIGNIFY (KONINKLIJKE PHILIPS N.V.): PRODUCT DEVELOPMENTS
  • TABLE 487 SIGNIFY (KONINKLIJKE PHILIPS N.V.): DEALS
  • TABLE 488 TUNGSRAM GROUP: COMPANY OVERVIEW
  • TABLE 489 TUNGSRAM GROUP: PRODUCTS OFFERED
  • TABLE 490 TUNGSRAM GROUP: PRODUCT DEVELOPMENTS
  • TABLE 491 TUNGSRAM GROUP: DEALS
  • TABLE 492 ZIZALA LICHTSYSTEME GMBH: COMPANY OVERVIEW
  • TABLE 493 ROBERT BOSCH GMBH: COMPANY OVERVIEW
  • TABLE 494 NXP SEMICONDUCTORS NV: COMPANY OVERVIEW
  • TABLE 495 GRUPO ANTOLIN: COMPANY OVERVIEW
  • TABLE 496 FEDERAL-MOGUL: COMPANY OVERVIEW
  • TABLE 497 GENTEX CORPORATION: COMPANY OVERVIEW
  • TABLE 498 FLEX-N-GATE: COMPANY OVERVIEW
  • TABLE 499 NORTH AMERICAN LIGHTING: COMPANY OVERVIEW
  • TABLE 500 DENSO CORPORATION: COMPANY OVERVIEW
  • TABLE 501 RENESAS ELECTRONICS CORPORATION: COMPANY OVERVIEW
  • TABLE 502 KEBODA: COMPANY OVERVIEW
  • TABLE 503 VARROC: COMPANY OVERVIEW
  • TABLE 504 LUMAX INDUSTRIES: COMPANY OVERVIEW
  • TABLE 505 SEOUL SEMICONDUCTOR CO., LTD.: COMPANY OVERVIEW
  • TABLE 506 INFINEON TECHNOLOGIES: COMPANY OVERVIEW
  • TABLE 507 SAMVARDHANA MOTHERSON: COMPANY OVERVIEW
LIST OF FIGURES
 
  • FIGURE 1 MARKET SEGMENTATION
  • FIGURE 2 RESEARCH DESIGN
  • FIGURE 3 RESEARCH METHODOLOGY MODEL
  • FIGURE 4 BREAKDOWN OF PRIMARY INTERVIEWS: BY COMPANY TYPE, DESIGNATION, AND REGION
  • FIGURE 5 RESEARCH METHODOLOGY: HYPOTHESIS BUILDING
  • FIGURE 6 MARKET SIZE ESTIMATION METHODOLOGY: BOTTOM-UP APPROACH
  • FIGURE 7 MARKET SIZE ESTIMATION METHODOLOGY: TOP-DOWN APPROACH (ELECTRIC VEHICLE TECHNOLOGY)
  • FIGURE 8 DATA TRIANGULATION
  • FIGURE 9 FACTORS IMPACTING MARKET
  • FIGURE 10 AUTOMOTIVE LIGHTING MARKET OUTLOOK
  • FIGURE 11 MARKET, BY REGION, 2023 VS. 2030 (USD MILLION)
  • FIGURE 12 MARKET, BY TECHNOLOGY VS VEHICLE TYPE, 2023 VS. 2030 (USD MILLION)
  • FIGURE 13 RISE IN DEMAND FOR ELECTRIC VEHICLES TO DRIVE MARKET
  • FIGURE 14 LED SEGMENT TO DOMINATE MARKET DURING FORECAST PERIOD
  • FIGURE 15 PASSENGER CARS TO SURPASS OTHER VEHICLE TYPES DURING FORECAST PERIOD
  • FIGURE 16 FRONT LIGHTING TO HAVE LARGEST MARKET SIZE BY 2030
  • FIGURE 17 LED TO BE LARGEST TECHNOLOGY SEGMENT DURING FORECAST PERIOD
  • FIGURE 18 FRONT LIGHTING TO REGISTER HIGHEST CAGR DURING FORECAST PERIOD
  • FIGURE 19 AMBIENT LIGHTING SEGMENT TO LEAD MARKET FROM 2023 TO 2030
  • FIGURE 20 ASIA PACIFIC TO REGISTER HIGHEST CAGR DURING FORECAST PERIOD
  • FIGURE 21 MARKET: DRIVERS, RESTRAINTS, OPPORTUNITIES, AND CHALLENGES
  • FIGURE 22 COMPARATIVE GLOBAL AVERAGE PRICE OF REFLECTOR VS. PROJECTOR HEADLIGHTS, 2022
  • FIGURE 23 REVENUE SHIFT FOR MARKET
  • FIGURE 24 MARKET: ECOSYSTEM ANALYSIS
  • FIGURE 25 KEY PLAYERS IN MARKET ECOSYSTEM
  • FIGURE 26 MARKET: VALUE CHAIN ANALYSIS
  • FIGURE 27 INFLUENCE OF STAKEHOLDERS ON BUYING PROCESS FOR TOP 3 AUTOMOTIVE LIGHTING TECHNOLOGIES
  • FIGURE 28 KEY BUYING CRITERIA FOR TOP 3 AUTOMOTIVE LIGHTING TECHNOLOGIES
  • FIGURE 29 MARKET, BY TECHNOLOGY, 2023 VS. 2030 (USD MILLION)
  • FIGURE 30 PASSENGER CAR LIGHTING MARKET, BY APPLICATION, 2023 VS. 2030 (MILLION UNITS)
  • FIGURE 31 LIGHT COMMERCIAL VEHICLE LIGHTING MARKET, BY POSITION, 2023 VS. 2030 (MILLION UNITS)
  • FIGURE 32 TRUCK LIGHTING MARKET, BY POSITION, 2023 VS. 2030 (MILLION UNITS)
  • FIGURE 33 BUS LIGHTING MARKET, BY POSITION, 2023 VS. 2030 (MILLION UNITS)
  • FIGURE 34 MARKET, BY VEHICLE TYPE, 2023 VS. 2030 (USD MILLION)
  • FIGURE 35 AUTOMOTIVE ADAPTIVE LIGHTING MARKET, BY TYPE, 2023 VS. 2030 (USD MILLION)
  • FIGURE 36 ELECTRIC VEHICLE LIGHTING MARKET, BY VEHICLE TYPE, 2023 VS. 2030 (USD MILLION)
  • FIGURE 37 ELECTRIC VEHICLE LIGHTING MARKET, BY TECHNOLOGY, 2023 VS. 2030 (USD MILLION)
  • FIGURE 38 ELECTRIC VEHICLE EXTERIOR LIGHTING MARKET, BY APPLICATION, 2023 VS. 2030 (USD MILLION)
  • FIGURE 39 ELECTRIC VEHICLE INTERIOR LIGHTING MARKET, BY APPLICATION, 2023 VS. 2030 (USD MILLION)
  • FIGURE 40 TWO-WHEELER LIGHTING MARKET, BY POSITION, 2023 VS. 2030 (USD MILLION)
  • FIGURE 41 MARKET, BY REGION, 2023 VS. 2030 (USD MILLION)
  • FIGURE 42 ASIA PACIFIC: MARKET SNAPSHOT
  • FIGURE 43 EUROPE: MARKET, BY COUNTRY, 2023 VS. 2030 (USD MILLION)
  • FIGURE 44 NORTH AMERICA: MARKET SNAPSHOT
  • FIGURE 45 REST OF THE WORLD MARKET, 2023 VS. 2030 (USD MILLION)
  • FIGURE 46 REVENUE ANALYSIS OF TOP 5 PLAYERS, 2020–2022
  • FIGURE 47 MARKET SHARE, 2022
  • FIGURE 48 MARKET: COMPANY EVALUATION MATRIX, 2022
  • FIGURE 49 AUTOMOTIVE ADAPTIVE LIGHTING MARKET (START-UP/SME): COMPANY EVALUATION MATRIX, 2022
  • FIGURE 50 KOITO MANUFACTURING CO., LTD.: COMPANY SNAPSHOT
  • FIGURE 51 HELLA GMBH & CO. KGAA: COMPANY SNAPSHOT
  • FIGURE 52 VALEO SA: COMPANY SNAPSHOT
  • FIGURE 53 OSRAM GMBH: COMPANY SNAPSHOT
  • FIGURE 54 CONTINENTAL AG: COMPANY SNAPSHOT
  • FIGURE 55 HYUNDAI MOBIS: COMPANY SNAPSHOT
  • FIGURE 56 MAGNETI MARELLI: COMPANY SNAPSHOT
  • FIGURE 57 ICHIKOH INDUSTRIES, LTD.: COMPANY SNAPSHOT
  • FIGURE 58 STANLEY ELECTRIC CO., LTD.: COMPANY SNAPSHOT
  • FIGURE 59 SIGNIFY (KONINKLIJKE PHILIPS N.V.): COMPANY SNAPSHOT


Various secondary sources, directories, and databases have been used to identify and collect information for an extensive study of the Automotive Lighting Market. The study involved four main activities in estimating the current size of the Automotive Lighting Market: secondary research, validation through primary research, assumptions, and market analysis. Exhaustive secondary research was carried out to collect information on the market, such as the existing vehicle models & their light technologies, upcoming technologies, and trends. The next step was to validate these findings, assumptions, and market analysis with industry experts across the value chain through primary research. The top-down approach was employed to estimate the complete market size for different segments considered in this study.

Secondary Research

In the secondary research process, various secondary sources have been used to identify and collect information useful for an extensive commercial study of the Automotive Lighting Market. Secondary sources include company annual reports/presentations, press releases, and industry association publications such as publications of the American Lighting Association (ALA), Canadian Automobile Association (CAA), China Association of Automobile Manufacturers (CAAM), Automotive Component Manufacturers Association of India (ACMA), and European Automobile Manufacturers Association (EAMA) among others. Additionally, secondary research has been carried out to understand the average count of various lights by vehicle type, historical production, and sales of new vehicles.

Primary Research

In the primary research process, various primary sources from both the supply and demand sides were interviewed to obtain qualitative and quantitative information on the market. The primary sources from the supply side included industry experts such as CXOs, vice presidents, directors from business development, marketing, product development/innovation teams, and related key executives from various key companies. Various system integrators, industry associations, independent consultants/industry veterans, and key opinion leaders were also interviewed.

Primary interviews have been conducted to gather insights such as ICE vehicle production and electric vehicle sales forecast, Automotive Lighting Market forecast and penetration rate, future technology trends, and upcoming technologies in the Automotive Lighting industry. Data triangulation was then done with the information gathered from secondary research. Stakeholders from the demand and supply side have been interviewed to understand their views on the points mentioned above.

Primary interviews have been conducted with market experts from Automotive Lighting manufacturers and technology providers across four major regions: North America, Europe, Asia Pacific, and the Rest of the World. A similar percentage of primary interviews have been conducted with automotive lighting manufacturers, respectively. The data from primary interviews has been collected through questionnaires, emails, and telephonic interviews. In the canvassing of primaries, we have strived to cover various departments within organizations, such as sales, manufacturing, and operations, to provide a holistic viewpoint in our report.

After interacting with industry experts, we have also conducted brief sessions with highly experienced independent consultants to reinforce the findings from our primaries. This and the in-house subject matter experts’ opinions have led us to the conclusions described in the remainder of this report.
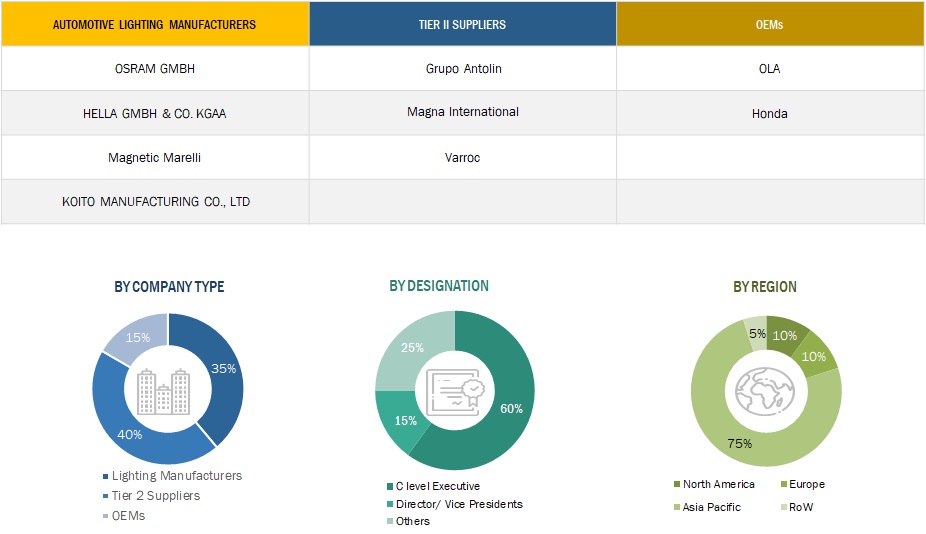
Automotive Lighting Market Size, and Share

To know about the assumptions considered for the study, download the pdf brochure

Market Size Estimation

A detailed market estimation approach was followed to estimate and validate the value of the Automotive Lighting Market and other dependent submarkets, as mentioned below:

  • Key players in the Automotive Lighting Market were identified through secondary research, and their global market shares were determined through primary and secondary research.
  • The research methodology included studying annual and quarterly financial reports, regulatory filings of major market players (public), and interviews with industry experts for detailed market insights.
  • All industry-level penetration rates, percentage shares, splits, and breakdowns for Automotive Lighting were determined using secondary sources and verified through primary sources.
  • All key macro indicators affecting the revenue growth of the market segments and sub-segments have been accounted for, viewed in extensive detail, verified through primary research, and analyzed to get the validated and verified quantitative and qualitative data.
  • The gathered market data was consolidated and added with detailed inputs, analyzed, and presented in this report.

Automotive Lighting Market: Bottom-Up Approach
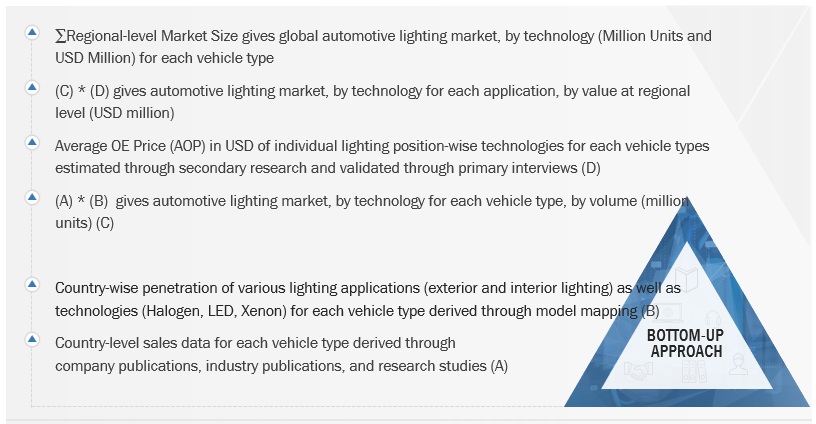
Automotive Lighting Market Size, and Share

To know about the assumptions considered for the study, Request for Free Sample Report

Data Triangulation

After arriving at the overall market size, the market was split into several segments and sub-segments—using the market size estimation processes as explained above. Data triangulation and market breakdown procedures were employed to complete the overall market engineering process and determine the exact statistics of each market segment and sub-segment. The data was triangulated by studying various factors and trends.

Market Definition

Automotive Lighting: An automotive lighting system consists of various lights and signaling devices that are fitted on the front, rear, side, and interior of the vehicle. These lights perform the primary function of providing illumination to the driver to drive safely in the dark. They may be used to enhance the visibility of an automobile, illuminate the interior, and act as a warning system for other vehicles. Automotive lighting ensures the vehicle's on-road safety and the pedestrian's by alerting the pedestrian about the vehicle's presence through exterior lighting.

Stakeholders

  • Automotive OEMs
  • Automotive lighting manufacturers and suppliers
  • Automotive components and raw material suppliers for Automotive Lighting
  • Traders and distributors of Automotive Lighting
  • Automobile organizations/associations and government bodies
  • Automotive software manufacturers and providers
  • Authorized service centers and independent aftermarket service providers
  • National and Regional Environmental Regulatory Agencies or Organizations

Report Objectives

  • To define, describe, and forecast the size of the Automotive Lighting market in terms of value (USD million) and volume (million units) as follows:
    • Vehicle type (passenger car, light commercial vehicles, trucks, and buses)
    • Technology (halogen, xenon/HID, LED, OLED, Matrix LED, LASER))
    • Application {exterior (headlights, fog lights, daytime running lights (DRL), taillights, Center high mount stop lamp (CHMSL), and sidelights) and interior (dashboard, glove box, reading lights, and dome lights)}
    • Electric & Hybrid vehicle lighting market, vehicle type (BEV, PHEV and FCEV)
    • Electric & Hybrid vehicle lighting market, technology (halogen, xenon/HID, and light emitting diode (LED))
    • Electric & Hybrid vehicle lighting market, application (Interior Lighting and Exterior Lighting)
    • Two-wheeler automotive lighting market, by position (front, rear, and side)
    • Automotive Adaptive lighting market, by type (front adaptive lighting (auto on/off, high beam assist, bending/cornering lights, and headlight leveling), rear adaptive lighting, and ambient lighting)
    • Region [Asia Pacific, Europe, North America, and Rest of the World]
  • To provide detailed information about the major factors influencing the growth of the market (drivers, restraints, opportunities, and challenges)
  • To strategically analyze the market and provide the average selling price (ASP) analysis, and patent analysis.
  • To evaluate the opportunities in the market for stakeholders and provide details of the competitive landscape for market leaders.
  • To evaluate the dynamics of competitors in the Automotive Lighting market and distinguish them into stars, emerging leaders, pervasive players, and participants. 
  • To understand the dynamics of start-ups/SMEs prevalent in the market ecosystem of the Automotive Lighting market and distinguish them into progressive companies, responsive companies, dynamic companies, and starting blocks.
  • To analyze the recent new developments, expansion strategies, collaborations, partnerships, joint ventures, mergers & acquisitions, and other activities carried out by key players in the Automotive Lighting market.

Available Customizations

Along with the market data, MarketsandMarkets offers customizations in accordance with company-specific needs.

The following customization options are available for the report:

Adaptive Module Market, By Function And Country

  • Auto On/Off Function
  • Bending/Cornering
  • High Beam Assist
  • Headlight Levelling

Two-Wheeler Automotive Lighting Market, By Vehicle Type

  • Motorcycle
  • Scooter/Moped

(Note: Countries included in the study: China, India, Japan, South Korea, Thailand, Germany, UK, France, Spain, Italy, US, Canada, Mexico, Brazil, Russia.

Custom Market Research Services

We will customize the research for you, in case the report listed above does not meet with your exact requirements. Our custom research will comprehensively cover the business information you require to help you arrive at strategic and profitable business decisions.

Request Customization

Instant Answers with GPT - Ask Now!

Ask real questions. Get complete answers !
Report Code
AT 3506
Published ON
Jan, 2024
Choose License Type
BUY NOW
  • SHARE
X
Request Customization
Speak to Analyst
Speak to Analyst
OR FACE-TO-FACE MEETING
PERSONALIZE THIS RESEARCH
  • Triangulate with your Own Data
  • Get Data as per your Format and Definition
  • Gain a Deeper Dive on a Specific Application, Geography, Customer or Competitor
  • Any level of Personalization
REQUEST A FREE CUSTOMIZATION
LET US HELP YOU!
  • What are the Known and Unknown Adjacencies Impacting the Automotive Lighting Market
  • What will your New Revenue Sources be?
  • Who will be your Top Customer; what will make them switch?
  • Defend your Market Share or Win Competitors
  • Get a Scorecard for Target Partners
CUSTOMIZED WORKSHOP REQUEST
knowledgestore logo

Want to explore hidden markets that can drive new revenue in Automotive Lighting Market?

Find Hidden Markets
  • Call Us
  • +1-888-600-6441 (Corporate office hours)
  • +1-888-600-6441 (US/Can toll free)
  • +44-800-368-9399 (UK office hours)
CONNECT WITH US
ABOUT TRUST ONLINE
©2024 MarketsandMarkets Research Private Ltd. All rights reserved
DMCA.com Protection Status
Website Feedback