Video on Demand (VoD) Market by Solutions (Pay TV, OTT Services, Internet Protocol Television (IPTV)), Monetization Model (SVoD, AVoD), Platform Type (Smartphones, Tablets/Laptop), Content Type (Movies, Educational/Fitness Programs) - Global Forecast to 2028
The Video on Demand Market worldwide was reasonably estimated at $146.6 billion in 2023. Throughout the projection period, the Video on Demand Industry is anticipated to increase at a CAGR of 13.0% in between 2023-2028 to reach around $270.3 billion in 2028. Video on demand solutions and services play a pivotal role across various industry verticals and regions, offering unparalleled opportunities for content delivery, monetization, and audience engagement. In the entertainment sector, VoD platforms have revolutionized how consumers access and consume media content, enabling on-demand viewing of movies, TV shows, and other forms of entertainment. Companies in this sector leverage VoD services to distribute their content directly to viewers, bypassing traditional broadcast channels and reaching global audiences efficiently.
Furthermore, VoD solutions empower content creators with valuable insights into viewer preferences and behavior, facilitating targeted content recommendations and personalized experiences. Beyond entertainment, VoD technology is increasingly adopted in educational institutions, facilitating flexible and convenient access to educational resources, lectures, and training materials. Additionally, VoD solutions find applications in corporate environments for internal training, onboarding, and knowledge dissemination purposes. In regions with limited access to traditional broadcasting infrastructure, such as rural areas or developing countries, VoD services offer a cost-effective and scalable means of delivering content to remote populations, bridging the digital divide, and fostering socio-economic development. VoD solutions are reshaping industries and regions by democratizing access to information and entertainment while unlocking new avenues for revenue generation and audience engagement.
To know about the assumptions considered for the study, Request for Free Sample Report
To know about the assumptions considered for the study, download the pdf brochure
Video on Demand Market Growth Dynamics
Driver: Rising Demand for video content across industries
The Video on Demand market is experiencing a significant surge in demand, primarily driven by the increasing appetite for video content across various industries. The widespread adoption of digital platforms and technological advancements have fueled this trend, making VoD services a pivotal driver in entertainment and information dissemination. The surge in demand is not only restricted to traditional media and entertainment but extends to educational, corporate, and healthcare industries.
As more industries recognize the potential of video content for communication, training, and customer engagement, the demand for VoD services continues to rise. This shift reshapes how organizations deliver information and entertainment, pushing for more accessible and convenient platforms. The COVID-19 pandemic accelerated the VoD trend, with remote work and virtual events becoming the norm, emphasizing the need for flexible and on-demand video solutions. In essence, the increased demand for video content across diverse industries drives the growth and evolution of the video on demand market, propelling it to the forefront of modern communication and content consumption.
Restraint: The growing threat of video content piracy
The Video on Demand faces a notable restraint in the form of the growing threat to video content privacy. As the consumption of on-demand video content escalates, concerns regarding the security and confidentiality of user data have become increasingly pronounced. Users entrust platforms with sensitive information, and the risk of unauthorized access, data breaches, or misuse poses a significant challenge to the industry.
Data privacy violations, unauthorized sharing of personal information, and the potential exploitation of user data for targeted advertising or other purposes have raised consumer alarms. Stricter regulations, such as GDPR and other privacy laws, highlight the need for video on demand platforms to implement robust security measures to safeguard user privacy. Compliance with these regulations poses operational challenges for service providers and adds complexity to the user experience. The growing awareness and concern surrounding video content privacy issues could hinder user trust and adoption of VoD services. Addressing these privacy challenges becomes imperative for the sustained growth of the market, necessitating a delicate balance between providing personalized content recommendations and ensuring the stringent protection of user data to mitigate the restraint posed by the escalating threat to video content privacy. Top of Form
Opportunity: Rise in online education and e-learning to improve the learning experience
The video on demand market is poised for significant opportunities with the rise of online education and e-learning, presenting fertile ground for enhancing the learning experience. As educational institutions and corporate entities increasingly embrace digital learning solutions, VoD platforms can be pivotal in delivering engaging and on-demand educational content. The flexibility offered by VoD allows students and learners to access a vast array of educational materials, lectures, and tutorials at their convenience, catering to diverse learning styles and schedules.
The dynamic capabilities of VoD, including pause, rewind, and replay options, contribute to a personalized and practical learning experience. Integrating interactive features and assessments within video content enhances student engagement and comprehension. Furthermore, the global reach of VoD platforms facilitates seamless access to educational resources from virtually anywhere, transcending geographical limitations. As the demand for online education continues to surge, VoD providers can collaborate with academic institutions, content creators, and e-learning platforms to enrich the educational landscape. This presents a win-win scenario, fostering the video on demand market's growth while revolutionizing how individuals access and consume educational content in a digital era.
Challenge: High cost of video content creation
A significant challenge facing the video on demand market is the high cost associated with video content creation. Producing high-quality and engaging video content requires substantial financial investments in talent, equipment, and post-production processes. This poses a hurdle for content creators and platforms looking to maintain a diverse and compelling content library.
The demand for original and exclusive content to attract and retain subscribers further amplifies the financial strain on VoD providers. Competing in an increasingly saturated market means platforms must consistently invest in content creation to stand out. This high production cost impacts established players and poses an entry barrier for new entrants, limiting the diversity and innovation in the VoD space. Moreover, the evolving landscape of viewer preferences and technological advancements necessitates continuous adaptation and investment in new content formats, resolutions, and interactive features, adding to the financial burden. Striking a balance between creating premium content and managing production costs becomes crucial for the sustainability of VoD platforms, requiring strategic planning and innovative solutions to address the challenge of the high cost of video content creation in an ever-competitive market.
Video on Demand Market Ecosystem
The section highlights the market's key players: input, VoD software, delivery, deployment, process, input, and end-users. The chapter describes the companies offering services and solutions in the video on demand market and the latest company developments related to MarketsandMarkets’ analysis of these vendors. It further highlights the unique differentiation points of each company and its expertise in the market.
The video on demand market operates within a dynamic and interconnected ecosystem, involving various stakeholders contributing to its growth and evolution. Content creators, from major studios to independent producers, form the foundation by generating diverse and engaging video content. These creators collaborate with production houses and distributors, ensuring a steady influx of high-quality content into the VoD ecosystem. Streaming platforms, both global giants and niche players, serve as the primary delivery channels, providing users with on-demand access to vast content. Device manufacturers and technology companies contribute by developing and optimizing hardware and software to enhance the viewing experience across different devices, from smart TVs to smartphones. Telecommunication and internet service providers are crucial in facilitating seamless content delivery by ensuring robust, high-speed internet connectivity. Additionally, advertisers leverage VoD platforms for targeted and personalized advertising, creating a revenue stream for both platforms and content creators. Viewer data analytics firms contribute by providing insights into user preferences, aiding in content curation and platform optimization. Regulatory bodies and industry associations also shape the VoD landscape through policy frameworks and standards. This interconnected ecosystem reflects the collaborative efforts of various entities, each fulfilling a unique role in driving innovation, content diversity, and accessibility within the video on demand market.
Based on verticals, the media entertainment vertical is expected to dominate the market during the forecast period.
Based on the verticals, the video on demand market is segmented into BFSI, education, healthcare and life sciences, government and public sector, media and entertainment, and other verticals. The media and entertainment vertical is expected to hold the largest market share during the forecast period. VoD solutions and services play a transformative role in the media and entertainment vertical by revolutionizing content delivery and viewer engagement. VoD solutions encompass a suite of technologies and services that enable organizations to manage, distribute, and monetize digital content efficiently. This includes CDNs for seamless streaming, DRM systems for secure content access, and analytics tools for understanding viewer behavior. These solutions empower media companies to offer personalized, on-demand content experiences across various platforms, meeting consumers' evolving preferences. Services related to VoD, such as consulting, implementation and integration, and support and maintenance, are crucial for media and entertainment businesses. Consulting services guide organizations in strategic decision-making, helping them navigate licensing agreements, market trends, and emerging technologies. Implementation services ensure the seamless integration of VoD platforms, optimizing technical infrastructure for reliable content delivery. Ongoing support services maintain platform performance, addressing issues promptly to enhance user satisfaction. In the media and entertainment sector, VoD solutions and services collectively drive innovation, improve audience engagement, and contribute to the industry's adaptation to the digital age.
Based on the content type, the educational/fitness programs segment is expected to have the highest CAGR growth rate during the forecast period.
The video on demand market is segmented into movies, music, TV shows/web series, educational/fitness programs, and other content types based on the content type. As per the content type, the academic/fitness programs segment is expected to hold the highest CAGR during the forecast period. Educational and fitness program content types play an essential role in the video on demand market by providing users with access to instructional and motivational content to support personal development and well-being. VoD platforms offer various educational programs covering language learning, academic subjects, professional development, and specialized skills training. Users can access these resources on demand, allowing them to learn at their own pace and tailor their educational experience to their interests and goals.
Similarly, fitness program content types offer users a convenient way to access workout routines, exercise classes, and wellness content from the comfort of their homes. video on demand platforms feature a variety of fitness programs catering to different fitness levels, including cardio, strength training, yoga, Pilates, and mindfulness practices. Users can choose from diverse workouts led by certified instructors, follow structured training plans, and track their progress over time, empowering them to achieve their fitness objectives and lead healthier lifestyles. Overall, educational and fitness program content types contribute to the holistic offerings of VoD platforms, supporting users' personal growth, health, and well-being through accessible and engaging digital content.
The US market is projected to contribute the largest share of the video on demand market in North America.
North America is expected to lead the video on demand (VoD) market in 2023. The US is estimated to account for the largest market share in North America in 2023, the market, and the trend is expected to continue until 2028. Video on Demand solutions and services are vital in the US region, offering diverse content delivery models catering to varied consumer preferences. Subscription-based streaming services, such as Netflix, Amazon Prime Video, and Hulu, dominate the market, providing subscribers with a vast library of on-demand content for a monthly fee. These platforms offer convenience and customization, allowing users to access many movies, TV shows, and original content without the constraints of traditional broadcast schedules. The popularity of subscription-based Video on Demand services has contributed significantly to the decline of cable TV subscriptions in the US, marking a shift in how audiences consume entertainment.
Transactional video-on-demand (TVoD) and advertising-supported (AVoD) models have also gained traction. TVoD allows users to rent or purchase individual titles on a pay-per-view basis, providing a more a-la-carte approach to content consumption. AVoD services, on the other hand, offer free content supported by ads. Platforms like YouTube and Pluto TV fall into the AVoD category, offering users a cost-free option in exchange for ad viewing. The coexistence of these various video on demand offering types in the US ensures a diverse and competitive landscape, giving consumers the flexibility to choose services that align with their viewing preferences and budget constraints.
Video on Demand Companies
The video on demand market is dominated by a few globally established players such as Netflix (US), Amazon (US), Google (US), The Walt Disney Company (US), Apple (US), Warner Bros Discovery (US), Comcast Corporation (US), Paramount Global (US), Sony (Japan), and Fox Corporation (US), among others, are the key vendors that secured video on demand contracts in last few years. Local participants only have local experience, while these vendors can add global processes and execution expertise. Customers are more likely to try new things in the video on demand market because of their higher discretionary budgets, ease of access to information, and quick adoption of technical items.
Want to explore hidden markets that can drive new revenue in Video on Demand (VoD) Market?
Scope of the Report
Want to explore hidden markets that can drive new revenue in Video on Demand (VoD) Market?
Report Metrics |
Details |
Market size value in 2023 |
USD 146.6 billion |
Revenue forecast for 2028 |
USD 270.3 billion |
Growth Rate |
13.0% CAGR |
Market size available for years |
2019–2028 |
Base year considered |
2022 |
Forecast period |
2023–2028 |
Forecast units |
Value (USD Billion) |
Segments Covered |
Offering Type, Monetization Model, Platform Type, Deployment Model, Content Type, and Vertical |
Geographies Covered |
North America, Europe, Asia Pacific, Middle East Africa, and Latin America |
Companies Covered |
Some of the significant VoD market vendors are Netflix (US), Amazon (US), Google (US)), The Walt Disney Company (US), Apple (US), Warner Bros Discovery (US), Comcast Corporation (US), Paramount Global (US), Sony (Japan), Fox Corporation (US), Lionsgate (US), Indieflix (US), Reliance Jio (India), Webnexs (US), Flicknexs (India), Kaltura (US), TargetVideo (Germany), Muvi (US), and JW Player (US) |
This research report categorizes the video on demand market based on offering type, monetization model, content type, platform type, deployment model, vertical, and region.
Based on the Offering Type:
-
Solutions
-
Pay TV
- Cable TV
- Direct to Home (DTH)
- Over the Top (OTT) Services
- Internet Protocol Television (IPTV)
-
Pay TV
-
Services
-
Professional Services
- Implementation & Integration
- Consulting
- Support & Maintenance
- Managed Services
-
Professional Services
Based on the Platform Type:
- Smartphones
- Tablets/Laptops
- Smart TVs
- Other Platform Types
Based on the Monetization Model:
- Subscription Video on Demand (SVoD)
- Transactional Video on Demand (TVoD)
- Advertising-Support Video on Demand (AVoD)
- Free Ad-Supported Streaming TV (FAST)
- Electronic-Sell-Through (EST)
Based on the Deployment Model:
- Cloud
- On-Premises
Based on the Content-Type:
- Movies
- Music
- TV Shows/Web Series
- Educational/Fitness Programs
- Other Content Types
Based on the Vertical:
- BFSI
- Education
- Government & Public Sector
- Healthcare & Life Sciences
- Media & Entertainment
- Other Verticals
Based on the Region:
-
North America
- US
- Canada
-
Europe
- UK
- Germany
- France
- Italy
- Rest of Europe
-
Asia Pacific
- China
- Japan
- India
- Australia & New Zealand
- Rest of Asia Pacific
-
Middle East & Africa
-
Gulf Cooperation Councils (GCC)
- Kingdom of Saudi Arabia
- United Arab Emirates
- Rest of GCC Countries
- South Africa
- Rest of the Middle East Africa
-
Gulf Cooperation Councils (GCC)
-
Latin America
- Brazil
- Mexico
- Rest of Latin America
Recent Developments:
- In February 2024, Netflix announced Expedia Group will be its first global advertising partner to activate a multi-market campaign on the streamer’s ad-supported plan throughout 2024. Through this partnership, Expedia Group will accelerate its international expansion while also reinforcing Netflix’s multi-country advertising offering to marketers and members.
- In January 2024, The Walt Disney Company's collaboration with Apple Vision Pro represents leaps forward into the future of entertainment and storytelling. By harnessing the capabilities of Apple's cutting-edge augmented reality (AR) technology, Disney aims to revolutionize how audiences experience their beloved stories and characters.
- In December 2023, Amazon and IPG Mediabrands entered into a significant three-year deal to assist brands in reaching audiences through Prime Video ads. This partnership underscores the increasing importance of streaming platforms in advertising strategies and the growing influence of Amazon in the digital advertising space. Through this partnership, brands will access a wealth of targeting and measurement capabilities to engage with viewers on Prime Video effectively. This includes leveraging Amazon's rich data insights to target specific audience segments and optimize ad campaigns for maximum impact.
- In December 2023, Apple introduced its Apple TV app interface to enhance the viewing experience for users. The redesigned app offers a more intuitive interface, making it easier to discover and access content across various streaming services. It features personalized recommendations, curated collections, and enhanced search capabilities, allowing users to find more efficient content tailored to their preferences.
- In November 2023, Google’s YouTube Premium recently received several noteworthy updates, enriching the user experience with cutting-edge features. One notable addition is the integration of AI-driven enhancements, which leverage advanced algorithms to personalize recommendations, improve content discovery, and enhance overall user engagement.
Frequently Asked Questions (FAQ):
What is a Video on Demand?
Video on Demand (VoD) is a digital media distribution system that allows users to conveniently access and watch video content. Unlike traditional broadcast or cable television, VoD enables viewers to select and stream movies, TV shows, and other content whenever they desire, often via the Internet.
Which country was the early adopter of VoD solutions?
The US was at the initial stage of the adoption of VoD solutions.
Which are the key vendors exploring VoD Solutions?
Some of the significant vendors offering VoD solutions across the globe include Netflix (US), Amazon (US), Google (US)), The Walt Disney Company (US), Apple (US), Warner Bros Discovery (US), Comcast Corporation (US), Paramount Global (US), Sony (Japan), Fox Corporation (US), Lionsgate (US), Indieflix (US), Reliance Jio (India), Webnexs (US), Flicknexs (India), Kaltura (US), TargetVideo (Germany), Muvi (US), and JW Player (US).
What is the total CAGR recorded for the VoD market from 2023 to 2028?
The VoD market will record a CAGR of 13.0% from 2023 to 2028
Who are vital clients adopting the VoD market?
Key clients adopting the cloud mobile BaaS market include: -
- Government Agencies
- Resellers and Distributors
- Research Organizations
- Corporates
- Administrators
- End Users
To speak to our analyst for a discussion on the above findings, click Speak to Analyst
Exclusive indicates content/data unique to MarketsandMarkets and not available with any competitors.
- 5.1 INTRODUCTION
-
5.2 MARKET DYNAMICSDRIVERS- Growing demand for video content across industries- Rising mobile video consumption through social media platforms- Growing demand for VoD streaming- Advancements in AI to foster demand for VoD softwareRESTRAINTS- Rising threat of video content piracy- Disagreement over licensed business model between producers and aggregators- Network connectivity and infrastructure issuesOPPORTUNITIES- Rise in online education and e-learning- Growing preference for online streaming services over traditional TVs- Increasing demand for real-time video servicesCHALLENGES- High cost of video content creation- Integrating VoD platforms with existing systems
-
5.3 CASE STUDY ANALYSISCASE STUDY 1: CONVEYING UNIQUE TOPGOLF EXPERIENCE THROUGH VIDEOCASE STUDY 2: ENGAGING AUDIENCE WORLDWIDECASE STUDY 3: HIGH-QUALITY VIEWING EXPERIENCECASE STUDY 4: MID-STATE TECHNICAL COLLEGE ACHIEVED HYBRID LEARNING SUCCESS THROUGH PANOPTO VIDEO SOLUTIONSCASE STUDY 5: APPLICATION WITH DIRECT ACCESS TO DIFFERENT WEB-BASED SERVICES
- 5.4 ECOSYSTEM ANALYSIS
- 5.5 SUPPLY CHAIN ANALYSIS
-
5.6 PRICING ANALYSISAVERAGE SELLING PRICE TREND OF KEY PLAYERS, BY SOLUTIONAVERAGE SELLING PRICE TREND OF KEY PLAYERS, BY ORGANIZATION SIZE
- 5.7 PATENT ANALYSIS
-
5.8 TECHNOLOGY ANALYSISKEY TECHNOLOGY- Content delivery networks (CDNs)- Digital rights management (DRM)- Streaming technology- UI & UXCOMPLEMENTARY TECHNOLOGY- 5G technology- Blockchain- Edge computingADJACENT TECHNOLOGY- AI & ML- Internet of Things
-
5.9 REGULATORY LANDSCAPEREGULATORY BODIES, GOVERNMENT AGENCIES, AND OTHER ORGANIZATIONSREGULATIONS, BY REGION- North America- Europe- Asia Pacific- Middle East & Africa- Latin AmericaREGULATORY IMPLICATIONS AND INDUSTRY STANDARDS- General Data Protection Regulation (GDPR)- SEC Rule 17a-4- ISO/IEC 27001- System and Organization Controls 2 type II compliance- Financial Industry Regulatory Authority- Freedom of Information Act- Health Insurance Portability and Accountability Act
-
5.10 PORTER’S FIVE FORCES ANALYSISTHREAT OF NEW ENTRANTSTHREAT OF SUBSTITUTESBARGAINING POWER OF SUPPLIERSBARGAINING POWER OF BUYERSINTENSITY OF COMPETITIVE RIVALRY
- 5.11 KEY CONFERENCES AND EVENTS, 2024–2025
- 5.12 TRENDS/DISRUPTIONS IMPACTING BUYERS
-
5.13 KEY STAKEHOLDERS AND BUYING CRITERIAKEY STAKEHOLDERS IN BUYING PROCESSBUYING CRITERIA
-
5.14 BUSINESS MODEL ANALYSISPERPETUAL LICENSE MODELSUBSCRIPTION-BASED MODELPAY-PER-USER MODELENTERPRISE LICENSING MODEL
-
5.15 CONTENT CONSUMPTION ANALYSIS, BY DEMOGRAPHICCHILDREN (LESS THAN 18 YEARS)YOUNG ADULTS (18-25 YEARS)ADULTS (25-50 YEARS)ABOVE 50 YEARS
-
5.16 TYPES OF VIDEO ON DEMAND CONTENT, BY QUALITY TYPEHIGH-QUALITY CONTENTVARIED QUALITY CONTENT
- 5.17 INVESTMENT AND FUNDING SCENARIO
-
6.1 INTRODUCTIONOFFERING TYPE MARKET DRIVERS
-
6.2 SOLUTIONSPAY TV- Growing integration of on-demand content to drive market- Cable TV- Direct to Home (DTH)OVER THE TOP (OTT) SERVICES- Rising emphasis on user-centric viewing experience to drive marketINTERNET PROTOCOL TELEVISION (IPTV)- Video-on-demand, time-shifted TV, and interactive applications to drive market
-
6.3 SERVICESPROFESSIONAL SERVICES- Content licensing, platform development applications to drive market- Integration & Implementation- Consulting- Support & maintenanceMANAGED SERVICES- Rising need for end-to-end management of technical infrastructure to drive market
-
7.1 INTRODUCTIONMONETIZATION MODEL MARKET DRIVERS
-
7.2 SUBSCRIPTION VIDEO ON DEMAND (SVOD)RISING FOCUS ON CUSTOMER LOYALTY TO DRIVE MARKET
-
7.3 TRANSACTIONAL VIDEO ON DEMAND (TVOD)GROWING NUMBER OF PREMIUM AND NEWLY RELEASED CONTENT TO DRIVE MARKET
-
7.4 ADVERTISING-SUPPORTED VIDEO ON DEMAND (AVOD)INCREASING REACH TO BROADER AUDIENCE TO DRIVE MARKET
-
7.5 FREE AD-SUPPORTED STREAMING TV (FAST)TARGET ADVERTISING APPLICATIONS TO DRIVE MARKET
-
7.6 ELECTRONIC-SELL-THROUGH (EST)GROWING ADOPTION OF FLEXIBLE SUBSCRIPTION MODEL TO DRIVE MARKET
-
8.1 INTRODUCTIONDEPLOYMENT MODEL MARKET DRIVERS
-
8.2 CLOUDSTORAGE, COMPUTING, AND NETWORKING APPLICATIONS TO DRIVE MARKET
-
8.3 ON-PREMISESRISING FOCUS ON SECURITY AND COMPLIANCE TO DRIVE MARKET
-
9.1 INTRODUCTIONPLATFORM TYPE MARKET DRIVERS
-
9.2 SMARTPHONESGROWING SHIFT TOWARD ON-THE-GO ENTERTAINMENT TO DRIVE MARKET
-
9.3 TABLETS/LAPTOPIMPROVED POWER AND CONNECTIVITY CAPABILITIES TO DRIVE MARKET
-
9.4 SMART TVSINCREASING INTEGRATION OF VOICE SEARCH AND PERSONALIZED RECOMMENDATIONS TO DRIVE MARKET
- 9.5 OTHER PLATFORM TYPES
-
10.1 INTRODUCTIONCONTENT TYPE MARKET DRIVERS
-
10.2 MOVIESRISING ATTENTION ON USER ENGAGEMENT AND SUBSCRIPTION RETENTION TO DRIVE MARKET
-
10.3 MUSICGROWING PARTNERSHIPS WITH RECORD LABELS, ARTISTS, AND MUSIC INDUSTRY STAKEHOLDERS TO DRIVE MARKET
-
10.4 TV SHOWS/WEB SERIESINCREASED FOCUS ON LEVERAGING DATA ANALYTICS TO DRIVE MARKET
-
10.5 EDUCATIONAL/FITNESS PROGRAMSINCREASING EMPHASIS ON HEALTHIER LIFESTYLES TO DRIVE MARKET
- 10.6 OTHER CONTENT TYPES
-
11.1 INTRODUCTIONVERTICAL MARKET DRIVERS
-
11.2 MEDIA & ENTERTAINMENTEXPANDING HIGH-SPEED INTERNET TO DRIVE MARKETAPPLICATION AREAS- Content discovery and personalization- Live streaming and events- Cross-platform accessibility- Other application areas
-
11.3 EDUCATIONE-LEARNING AND SMART EDUCATION SYSTEMS TO DRIVE MARKETAPPLICATION AREAS- Parental engagement and home-school collaboration- Educational content libraries- Research and academic collaboration- Other application areas
-
11.4 HEALTHCARE & LIFE SCIENCESPATIENT EDUCATION AND ENGAGEMENT TO DRIVE MARKETAPPLICATION AREAS- Patient data management- Telemedicine and remote consultations- Healthcare marketing and promotional content- Other application areas
-
11.5 BFSISURGE IN PERSONALIZED FINANCIAL EDUCATION AND ADVISORY CONTENT TO DRIVE MARKETAPPLICATION AREAS- Employee training and development- Marketing and customer engagement- Financial advisory services- Other application areas
-
11.6 GOVERNMENT & PUBLIC SECTORLIVE EVENTS, CONFERENCES, AND PUBLIC EDUCATION APPLICATIONS TO DRIVE MARKETAPPLICATION AREAS- Public infrastructure and project updates- Legislative proceedings and government meetings- Government initiatives and policies- Other application areas
- 11.7 OTHER VERTICALS
- 12.1 INTRODUCTION
-
12.2 NORTH AMERICAVIDEO ON DEMAND MARKET DRIVERSRECESSION IMPACTUS- Growing prevalence of subscription-based streaming services to drive marketCANADA- Rapid adoption of cost-effective cloud-based solutions to drive market
-
12.3 EUROPEVIDEO ON DEMAND MARKET DRIVERSRECESSION IMPACTUK- Changing content consumption behavior to drive marketGERMANY- Surge in digital viewers to drive marketFRANCE- Robust infrastructure and high internet penetration to drive marketITALY- Rising demand for online video content to drive marketREST OF EUROPE
-
12.4 ASIA PACIFICVIDEO ON DEMAND MARKET DRIVERSRECESSION IMPACTCHINA- Increasing adoption of 5G services by telecom operators to drive marketJAPAN- Strategic collaborations between VoD service providers and telecom companies to drive marketINDIA- Consumer preference for region-specific content to drive marketAUSTRALIA & NEW ZEALAND- Growing popularity of streaming services to drive marketREST OF ASIA PACIFIC
-
12.5 MIDDLE EAST & AFRICAVIDEO ON DEMAND MARKET DRIVERSRECESSION IMPACTGULF COOPERATION COUNCIL (GCC)- Significant growth in domestic IT sector to drive market- Kingdom of Saudi Arabia (KSA)- United Arab Emirates (UAE)- Rest of GCCSOUTH AFRICA- Increasing investments in digital infrastructure to drive marketREST OF MIDDLE EAST & AFRICA
-
12.6 LATIN AMERICAVIDEO ON DEMAND MARKET DRIVERSRECESSION IMPACTBRAZIL- Digital transformation initiatives across various verticals to drive marketMEXICO- Reduced costs of video content consumption to drive marketREST OF LATIN AMERICA
- 13.1 INTRODUCTION
- 13.2 KEY PLAYER STRATEGIES/RIGHT TO WIN
- 13.3 MARKET SHARE ANALYSIS
- 13.4 VIDEO ON DEMAND MARKET: VENDOR PRODUCTS/BRANDS COMPARISON
- 13.5 REVENUE ANALYSIS
-
13.6 COMPANY EVALUATION MATRIXSTARSEMERGING LEADERSPERVASIVE PLAYERSPARTICIPANTSCOMPANY FOOTPRINT: KEY PLAYERS
-
13.7 STARTUP/SME EVALUATION MATRIXPROGRESSIVE COMPANIESRESPONSIVE COMPANIESDYNAMIC COMPANIESSTARTING BLOCKSCOMPETITIVE BENCHMARKING: STARTUPS/SMES
- 13.8 COMPANY VALUATION AND FINANCIAL METRICS OF KEY VENDORS
-
13.9 COMPETITIVE SCENARIO AND TRENDSPRODUCT LAUNCHES/DEVELOPMENTSDEALS
- 14.1 INTRODUCTION
-
14.2 MAJOR PLAYERSNETFLIX- Business overview- Products/Solutions/Services offered- Recent developments- MnM viewAMAZON- Business overview- Products/Solutions/Services offered- Recent developments- MnM viewGOOGLE- Business overview- Products/Solutions/Services offered- Recent developments- MnM viewTHE WALT DISNEY COMPANY- Business overview- Products/Solutions/Services offered- Recent developments- MnM viewAPPLE- Business overview- Products/Solutions/Services offered- Recent developments- MnM viewWARNER BROS. DISCOVERY- Business overview- Products/Solutions/Services offered- Recent developmentsCOMCAST CORPORATION- Business overview- Products/Solutions/Services offered- Recent developmentsPARAMOUNT PICTURES CORPORATION- Business overview- Products/Solutions/Services offered- Recent developmentsSONY- Business overview- Products/Solutions/Services offered- Recent developmentsFOX CORPORATION- Business overview- Products/Solutions/Services offered- Recent developments
-
14.3 OTHER PLAYERSLIONSGATEINDIEFLIXRELIANCE JIOWEBNEXSFLICKNEXSKALTURATARGETVIDEOMUVIJW PLAYERVIMEODACASTWOWZABRIGHTCOVECONTUS TECHGUDSHOARVANCLOUDGUMLETSWITCHERVERIZON
-
15.1 INTRODUCTIONRELATED MARKETSLIMITATIONS
- 15.2 VIDEO PROCESSING PLATFORM MARKET
- 15.3 VIDEO STREAMING SOFTWARE MARKET
- 16.1 DISCUSSION GUIDE
- 16.2 KNOWLEDGESTORE: MARKETSANDMARKETS’ SUBSCRIPTION PORTAL
- 16.3 CUSTOMIZATION OPTIONS
- 16.4 RELATED REPORTS
- 16.5 AUTHOR DETAILS
- TABLE 1 USD EXCHANGE RATES, 2018–2022
- TABLE 2 PRIMARY RESPONDENTS
- TABLE 3 FACTOR ANALYSIS
- TABLE 4 INDICATIVE PRICING ANALYSIS OF VIDEO ON DEMAND MARKET, BY SOLUTION
- TABLE 5 INDICATIVE PRICING ANALYSIS OF MARKET, BY ORGANIZATION SIZE
- TABLE 6 TOP 10 PATENT OWNERS
- TABLE 7 MARKET: LIST OF MAJOR PATENTS
- TABLE 8 NORTH AMERICA: REGULATORY BODIES, GOVERNMENT AGENCIES, AND OTHER ORGANIZATIONS
- TABLE 9 EUROPE: REGULATORY BODIES, GOVERNMENT AGENCIES, AND OTHER ORGANIZATIONS
- TABLE 10 ASIA PACIFIC: REGULATORY BODIES, GOVERNMENT AGENCIES, AND OTHER ORGANIZATIONS
- TABLE 11 REST OF THE WORLD: REGULATORY BODIES, GOVERNMENT AGENCIES, AND OTHER ORGANIZATIONS
- TABLE 12 MARKET: PORTER’S FIVE FORCES ANALYSIS
- TABLE 13 MARKET: KEY CONFERENCES AND EVENTS IN 2024–2025
- TABLE 14 INFLUENCE OF STAKEHOLDERS ON BUYING PROCESS FOR TOP VERTICALS
- TABLE 15 KEY BUYING CRITERIA FOR TOP VERTICALS
- TABLE 16 MARKET, BY OFFERING TYPE, 2019–2022 (USD MILLION)
- TABLE 17 MARKET, BY OFFERING TYPE, 2023–2028 (USD MILLION)
- TABLE 18 OFFERING TYPE: MARKET, BY REGION, 2019–2022 (USD MILLION)
- TABLE 19 OFFERING TYPE: MARKET, BY REGION, 2023–2028 (USD MILLION)
- TABLE 20 MARKET, BY SOLUTIONS, 2019–2022 (USD MILLION)
- TABLE 21 MARKET, BY SOLUTIONS, 2023–2028 (USD MILLION)
- TABLE 22 SOLUTIONS: MARKET, BY REGION, 2019–2022 (USD MILLION)
- TABLE 23 SOLUTIONS: MARKET, BY REGION, 2023–2028 (USD MILLION)
- TABLE 24 PAY TV: MARKET, BY REGION, 2019–2022 (USD MILLION)
- TABLE 25 PAY TV: MARKET, BY REGION, 2023–2028 (USD MILLION)
- TABLE 26 OTT SERVICES: MARKET, BY REGION, 2019–2022 (USD MILLION)
- TABLE 27 OTT SERVICES: MARKET, BY REGION, 2023–2028 (USD MILLION)
- TABLE 28 IPTV: VIDEO ON DEMAND MARKET, BY REGION, 2019–2022 (USD MILLION)
- TABLE 29 IPTV: MARKET, BY REGION, 2023–2028 (USD MILLION)
- TABLE 30 MARKET, BY SERVICES, 2019–2022 (USD MILLION)
- TABLE 31 MARKET, BY SERVICES, 2023–2028 (USD MILLION)
- TABLE 32 SERVICES: MARKET, BY REGION, 2019–2022 (USD MILLION)
- TABLE 33 SERVICES: MARKET, BY REGION, 2023–2028 (USD MILLION)
- TABLE 34 MARKET, BY PROFESSIONAL SERVICES, 2019–2022 (USD MILLION)
- TABLE 35 MARKET, BY PROFESSIONAL SERVICES, 2023–2028 (USD MILLION)
- TABLE 36 PROFESSIONAL SERVICES: MARKET, BY REGION, 2019–2022 (USD MILLION)
- TABLE 37 PROFESSIONAL SERVICES: MARKET, BY REGION, 2023–2028 (USD MILLION)
- TABLE 38 INTEGRATION & IMPLEMENTATION: MARKET, BY REGION, 2019–2022 (USD MILLION)
- TABLE 39 INTEGRATION & IMPLEMENTATION: MARKET, BY REGION, 2023–2028 (USD MILLION)
- TABLE 40 CONSULTING: MARKET, BY REGION, 2019–2022 (USD MILLION)
- TABLE 41 CONSULTING: MARKET, BY REGION, 2023–2028 (USD MILLION)
- TABLE 42 SUPPORT & MAINTENANCE: MARKET, BY REGION, 2019–2022 (USD MILLION)
- TABLE 43 SUPPORT & MAINTENANCE: MARKET, BY REGION, 2023–2028 (USD MILLION)
- TABLE 44 MANAGED SERVICES: MARKET, BY REGION, 2019–2022 (USD MILLION)
- TABLE 45 MANAGED SERVICES: MARKET, BY REGION, 2023–2028 (USD MILLION)
- TABLE 46 MARKET, BY MONETIZATION MODEL, 2019–2022 (USD MILLION)
- TABLE 47 MARKET, BY MONETIZATION MODEL, 2023–2028 (USD MILLION)
- TABLE 48 MONETIZATION MODEL: MARKET, BY REGION, 2019–2022 (USD MILLION)
- TABLE 49 MONETIZATION MODEL: MARKET, 2023–2028 (USD MILLION)
- TABLE 50 SVOD: MARKET, BY REGION, 2019–2022 (USD MILLION)
- TABLE 51 SVOD: MARKET, BY REGION, 2023–2028 (USD MILLION)
- TABLE 52 TVOD: MARKET, BY REGION, 2019–2022 (USD MILLION)
- TABLE 53 TVOD: MARKET, BY REGION, 2023–2028 (USD MILLION)
- TABLE 54 AVOD: MARKET, BY REGION, 2019–2022 (USD MILLION)
- TABLE 55 AVOD: MARKET, BY REGION, 2023–2028 (USD MILLION)
- TABLE 56 FAST: MARKET, BY REGION, 2019–2022 (USD MILLION)
- TABLE 57 FAST: MARKET, BY REGION, 2023–2028 (USD MILLION)
- TABLE 58 EST: MARKET, BY REGION, 2019–2022 (USD MILLION)
- TABLE 59 EST: MARKET, BY REGION, 2023–2028 (USD MILLION)
- TABLE 60 MARKET, BY DEPLOYMENT MODEL, 2019–2022 (USD MILLION)
- TABLE 61 MARKET, BY DEPLOYMENT MODEL, 2023–2028 (USD MILLION)
- TABLE 62 DEPLOYMENT MODEL: MARKET, BY REGION, 2019–2022 (USD MILLION)
- TABLE 63 DEPLOYMENT MODEL: MARKET, BY REGION, 2023–2028 (USD MILLION)
- TABLE 64 CLOUD: MARKET, BY REGION, 2019–2022 (USD MILLION)
- TABLE 65 CLOUD: MARKET, BY REGION, 2023–2028 (USD MILLION)
- TABLE 66 ON-PREMISES: MARKET, BY REGION, 2019–2022 (USD MILLION)
- TABLE 67 ON-PREMISES: MARKET, BY REGION, 2023–2028 (USD MILLION)
- TABLE 68 MARKET, BY PLATFORM TYPE, 2019–2022 (USD MILLION)
- TABLE 69 VIDEO ON DEMAND MARKET, BY PLATFORM TYPE, 2023–2028 (USD MILLION)
- TABLE 70 PLATFORM TYPE: MARKET, BY REGION, 2019–2022 (USD MILLION)
- TABLE 71 PLATFORM TYPE: MARKET, BY REGION, 2023–2028 (USD MILLION)
- TABLE 72 SMARTPHONES: MARKET, BY REGION, 2019–2022 (USD MILLION)
- TABLE 73 SMARTPHONES: MARKET, BY REGION, 2023–2028 (USD MILLION)
- TABLE 74 TABLETS/LAPTOPS: MARKET, BY REGION, 2019–2022 (USD MILLION)
- TABLE 75 TABLETS/LAPTOPS: MARKET, BY REGION, 2023–2028 (USD MILLION)
- TABLE 76 SMART TVS: MARKET, BY REGION, 2019–2022 (USD MILLION)
- TABLE 77 SMART TVS: MARKET, BY REGION, 2023–2028 (USD MILLION)
- TABLE 78 OTHER PLATFORM TYPES: MARKET, BY REGION, 2019–2022 (USD MILLION)
- TABLE 79 OTHER PLATFORM TYPES: MARKET, BY REGION, 2023–2028 (USD MILLION)
- TABLE 80 MARKET, BY CONTENT TYPE, 2019–2022 (USD MILLION)
- TABLE 81 MARKET, BY CONTENT TYPE, 2023–2028 (USD MILLION)
- TABLE 82 CONTENT TYPE: MARKET, BY REGION, 2019–2022 (USD MILLION)
- TABLE 83 CONTENT TYPE: MARKET, BY REGION, 2023–2028 (USD MILLION)
- TABLE 84 MOVIES: MARKET, BY REGION, 2019–2022 (USD MILLION)
- TABLE 85 MOVIES: MARKET, BY REGION, 2023–2028 (USD MILLION)
- TABLE 86 MUSIC: MARKET, BY REGION, 2019–2022 (USD MILLION)
- TABLE 87 MUSIC: MARKET, BY REGION, 2023–2028 (USD MILLION)
- TABLE 88 TV SHOWS/WEB SERIES: MARKET, BY REGION, 2019–2022 (USD MILLION)
- TABLE 89 TV SHOWS/WEB SERIES: MARKET, BY REGION, 2023–2028 (USD MILLION)
- TABLE 90 EDUCATIONAL/FITNESS PROGRAMS: MARKET, BY REGION, 2019–2022 (USD MILLION)
- TABLE 91 EDUCATIONAL/FITNESS PROGRAMS: MARKET, BY REGION, 2023–2028 (USD MILLION)
- TABLE 92 OTHER CONTENT TYPES: MARKET, BY REGION, 2019–2022 (USD MILLION)
- TABLE 93 OTHER CONTENT TYPES: MARKET, BY REGION, 2023–2028 (USD MILLION)
- TABLE 94 MARKET, BY VERTICAL, 2019–2022 (USD MILLION)
- TABLE 95 MARKET, BY VERTICAL, 2023–2028 (USD MILLION)
- TABLE 96 VERTICAL: MARKET, BY REGION, 2019–2022 (USD MILLION)
- TABLE 97 VERTICAL: MARKET, BY REGION, 2023–2028 (USD MILLION)
- TABLE 98 MEDIA & ENTERTAINMENT: MARKET, BY REGION, 2019–2022 (USD MILLION)
- TABLE 99 MEDIA & ENTERTAINMENT: MARKET, BY REGION, 2023–2028 (USD MILLION)
- TABLE 100 EDUCATION: MARKET, BY REGION, 2019–2022 (USD MILLION)
- TABLE 101 EDUCATION: MARKET, BY REGION, 2023–2028 (USD MILLION)
- TABLE 102 HEALTHCARE & LIFE SCIENCES: MARKET, BY REGION, 2019–2022 (USD MILLION)
- TABLE 103 HEALTHCARE & LIFE SCIENCES: MARKET, BY REGION, 2023–2028 (USD MILLION)
- TABLE 104 BFSI: MARKET, BY REGION, 2019–2022 (USD MILLION)
- TABLE 105 BFSI: MARKET, BY REGION, 2023–2028 (USD MILLION)
- TABLE 106 GOVERNMENT & PUBLIC SECTOR: MARKET, BY REGION, 2019–2022 (USD MILLION)
- TABLE 107 GOVERNMENT & PUBLIC SECTOR: MARKET, BY REGION, 2023–2028 (USD MILLION)
- TABLE 108 OTHER VERTICALS: MARKET, BY REGION, 2019–2022 (USD MILLION)
- TABLE 109 OTHER VERTICALS: MARKET, BY REGION, 2023–2028 (USD MILLION)
- TABLE 110 MARKET, BY REGION, 2019–2022 (USD MILLION)
- TABLE 111 MARKET, BY REGION, 2023–2028 (USD MILLION)
- TABLE 112 NORTH AMERICA: MARKET, BY OFFERING TYPE, 2019–2022 (USD MILLION)
- TABLE 113 NORTH AMERICA: MARKET, BY OFFERING TYPE, 2023–2028 (USD MILLION)
- TABLE 114 NORTH AMERICA: VIDEO ON DEMAND MARKET, BY SOLUTION, 2019–2022 (USD MILLION)
- TABLE 115 NORTH AMERICA: MARKET, BY SOLUTION, 2023–2028 (USD MILLION)
- TABLE 116 NORTH AMERICA: MARKET, BY SERVICE, 2019–2022 (USD MILLION)
- TABLE 117 NORTH AMERICA: MARKET, BY SERVICE, 2023–2028 (USD MILLION)
- TABLE 118 NORTH AMERICA: MARKET, BY PROFESSIONAL SERVICE, 2019–2022 (USD MILLION)
- TABLE 119 NORTH AMERICA: MARKET, BY PROFESSIONAL SERVICE, 2023–2028 (USD MILLION)
- TABLE 120 NORTH AMERICA: MARKET, BY PLATFORM TYPE, 2019–2022 (USD MILLION)
- TABLE 121 NORTH AMERICA: MARKET, BY PLATFORM TYPE, 2023–2028 (USD MILLION)
- TABLE 122 NORTH AMERICA: MARKET, BY CONTENT TYPE, 2019–2022 (USD MILLION)
- TABLE 123 NORTH AMERICA: MARKET, BY CONTENT TYPE, 2023–2028 (USD MILLION)
- TABLE 124 NORTH AMERICA: MARKET, BY DEPLOYMENT MODEL, 2019–2022 (USD MILLION)
- TABLE 125 NORTH AMERICA: MARKET, BY DEPLOYMENT MODEL, 2023–2028 (USD MILLION)
- TABLE 126 NORTH AMERICA: MARKET, BY MONETIZATION MODEL, 2019–2022 (USD MILLION)
- TABLE 127 NORTH AMERICA: MARKET, BY MONETIZATION MODEL, 2023–2028 (USD MILLION)
- TABLE 128 NORTH AMERICA: MARKET, BY VERTICAL, 2019–2022 (USD MILLION)
- TABLE 129 NORTH AMERICA: MARKET, BY VERTICAL, 2023–2028 (USD MILLION)
- TABLE 130 NORTH AMERICA: MARKET, BY COUNTRY, 2019–2022 (USD MILLION)
- TABLE 131 NORTH AMERICA: MARKET, BY COUNTRY, 2023–2028 (USD MILLION)
- TABLE 132 US: MARKET, BY OFFERING TYPE, 2019–2022 (USD MILLION)
- TABLE 133 US: MARKET, BY OFFERING TYPE, 2023–2028 (USD MILLION)
- TABLE 134 US: MARKET, BY DEPLOYMENT MODEL, 2019–2022 (USD MILLION)
- TABLE 135 US: MARKET, BY DEPLOYMENT MODEL, 2023–2028 (USD MILLION)
- TABLE 136 CANADA: MARKET, BY OFFERING TYPE, 2019–2022 (USD MILLION)
- TABLE 137 CANADA: MARKET, BY OFFERING TYPE, 2023–2028 (USD MILLION)
- TABLE 138 CANADA: MARKET, BY DEPLOYMENT MODEL, 2019–2022 (USD MILLION)
- TABLE 139 CANADA: MARKET, BY DEPLOYMENT MODEL, 2023–2028 (USD MILLION)
- TABLE 140 EUROPE: MARKET, BY OFFERING TYPE, 2019–2022 (USD MILLION)
- TABLE 141 EUROPE: MARKET, BY OFFERING TYPE, 2023–2028 (USD MILLION)
- TABLE 142 EUROPE: MARKET, BY SOLUTION, 2019–2022 (USD MILLION)
- TABLE 143 EUROPE: MARKET, BY SOLUTION, 2023–2028 (USD MILLION)
- TABLE 144 EUROPE: MARKET, BY SERVICE, 2019–2022 (USD MILLION)
- TABLE 145 EUROPE: VIDEO ON DEMAND MARKET, BY SERVICE, 2023–2028 (USD MILLION)
- TABLE 146 EUROPE: MARKET, BY PROFESSIONAL SERVICE, 2019–2022 (USD MILLION)
- TABLE 147 EUROPE: MARKET, BY PROFESSIONAL SERVICE, 2023–2028 (USD MILLION)
- TABLE 148 EUROPE: MARKET, BY PLATFORM TYPE, 2019–2022 (USD MILLION)
- TABLE 149 EUROPE: MARKET, BY PLATFORM TYPE, 2023–2028 (USD MILLION)
- TABLE 150 EUROPE: MARKET, BY CONTENT TYPE, 2019–2022 (USD MILLION)
- TABLE 151 EUROPE: MARKET, BY CONTENT TYPE, 2023–2028 (USD MILLION)
- TABLE 152 EUROPE: MARKET, BY DEPLOYMENT MODEL, 2019–2022 (USD MILLION)
- TABLE 153 EUROPE: MARKET, BY DEPLOYMENT MODEL, 2023–2028 (USD MILLION)
- TABLE 154 EUROPE: MARKET, BY MONETIZATION MODEL, 2019–2022 (USD MILLION)
- TABLE 155 EUROPE: MARKET, BY MONETIZATION MODEL, 2023–2028 (USD MILLION)
- TABLE 156 EUROPE: MARKET, BY VERTICAL, 2019–2022 (USD MILLION)
- TABLE 157 EUROPE: MARKET, BY VERTICAL, 2023–2028 (USD MILLION)
- TABLE 158 EUROPE: MARKET, BY COUNTRY, 2019–2022 (USD MILLION)
- TABLE 159 EUROPE: MARKET, BY COUNTRY, 2023–2028 (USD MILLION)
- TABLE 160 UK: MARKET, BY OFFERING TYPE, 2019–2022 (USD MILLION)
- TABLE 161 UK: MARKET, BY OFFERING TYPE, 2023–2028 (USD MILLION)
- TABLE 162 UK: MARKET, BY DEPLOYMENT MODEL, 2019–2022 (USD MILLION)
- TABLE 163 UK: MARKET, BY DEPLOYMENT MODEL, 2023–2028 (USD MILLION)
- TABLE 164 GERMANY: MARKET, BY OFFERING TYPE, 2019–2022 (USD MILLION)
- TABLE 165 GERMANY: MARKET, BY OFFERING TYPE, 2023–2028 (USD MILLION)
- TABLE 166 GERMANY: MARKET, BY DEPLOYMENT MODEL, 2019–2022 (USD MILLION)
- TABLE 167 GERMANY: MARKET, BY DEPLOYMENT MODEL, 2023–2028 (USD MILLION)
- TABLE 168 FRANCE: MARKET, BY OFFERING TYPE, 2019–2022 (USD MILLION)
- TABLE 169 FRANCE: MARKET, BY OFFERING TYPE, 2023–2028 (USD MILLION)
- TABLE 170 FRANCE: MARKET, BY DEPLOYMENT MODEL, 2019–2022 (USD MILLION)
- TABLE 171 FRANCE: MARKET, BY DEPLOYMENT MODEL, 2023–2028 (USD MILLION)
- TABLE 172 ITALY: MARKET, BY OFFERING TYPE, 2019–2022 (USD MILLION)
- TABLE 173 ITALY: MARKET, BY OFFERING TYPE, 2023–2028 (USD MILLION)
- TABLE 174 ITALY: MARKET, BY DEPLOYMENT MODEL, 2019–2022 (USD MILLION)
- TABLE 175 ITALY: MARKET, BY DEPLOYMENT MODEL, 2023–2028 (USD MILLION)
- TABLE 176 REST OF EUROPE: VIDEO ON DEMAND MARKET, BY OFFERING TYPE, 2019–2022 (USD MILLION)
- TABLE 177 REST OF EUROPE: MARKET, BY OFFERING TYPE, 2023–2028 (USD MILLION)
- TABLE 178 REST OF EUROPE: MARKET, BY DEPLOYMENT MODEL, 2019–2022 (USD MILLION)
- TABLE 179 REST OF EUROPE: MARKET, BY DEPLOYMENT MODEL, 2023–2028 (USD MILLION)
- TABLE 180 ASIA PACIFIC: MARKET, BY OFFERING TYPE, 2019–2022 (USD MILLION)
- TABLE 181 ASIA PACIFIC: MARKET, BY OFFERING TYPE, 2023–2028 (USD MILLION)
- TABLE 182 ASIA PACIFIC: MARKET, BY SOLUTION, 2019–2022 (USD MILLION)
- TABLE 183 ASIA PACIFIC: MARKET, BY SOLUTION, 2023–2028 (USD MILLION)
- TABLE 184 ASIA PACIFIC: MARKET, BY SERVICE, 2019–2022 (USD MILLION)
- TABLE 185 ASIA PACIFIC: MARKET, BY SERVICE, 2023–2028 (USD MILLION)
- TABLE 186 ASIA PACIFIC: MARKET, BY PROFESSIONAL SERVICE, 2019–2022 (USD MILLION)
- TABLE 187 ASIA PACIFIC: MARKET, BY PROFESSIONAL SERVICE, 2023–2028 (USD MILLION)
- TABLE 188 ASIA PACIFIC: MARKET, BY PLATFORM TYPE, 2019–2022 (USD MILLION)
- TABLE 189 ASIA PACIFIC: MARKET, BY PLATFORM TYPE, 2023–2028 (USD MILLION)
- TABLE 190 ASIA PACIFIC: MARKET, BY CONTENT TYPE, 2019–2022 (USD MILLION)
- TABLE 191 ASIA PACIFIC: MARKET, BY CONTENT TYPE, 2023–2028 (USD MILLION)
- TABLE 192 ASIA PACIFIC: MARKET, BY DEPLOYMENT MODEL, 2019–2022 (USD MILLION)
- TABLE 193 ASIA PACIFIC: MARKET, BY DEPLOYMENT MODEL, 2023–2028 (USD MILLION)
- TABLE 194 ASIA PACIFIC: MARKET, BY MONETIZATION MODEL, 2019–2022 (USD MILLION)
- TABLE 195 ASIA PACIFIC: MARKET, BY MONETIZATION MODEL, 2023–2028 (USD MILLION)
- TABLE 196 ASIA PACIFIC: MARKET, BY VERTICAL, 2019–2022 (USD MILLION)
- TABLE 197 ASIA PACIFIC: MARKET, BY VERTICAL, 2023–2028 (USD MILLION)
- TABLE 198 ASIA PACIFIC: MARKET, BY COUNTRY, 2019–2022 (USD MILLION)
- TABLE 199 ASIA PACIFIC: MARKET, BY COUNTRY, 2023–2028 (USD MILLION)
- TABLE 200 CHINA: MARKET, BY OFFERING TYPE, 2019–2022 (USD MILLION)
- TABLE 201 CHINA: MARKET, BY OFFERING TYPE, 2023–2028 (USD MILLION)
- TABLE 202 CHINA: MARKET, BY DEPLOYMENT MODEL, 2019–2022 (USD MILLION)
- TABLE 203 CHINA: MARKET, BY DEPLOYMENT MODEL, 2023–2028 (USD MILLION)
- TABLE 204 JAPAN: MARKET, BY OFFERING TYPE, 2019–2022 (USD MILLION)
- TABLE 205 JAPAN: MARKET, BY OFFERING TYPE, 2023–2028 (USD MILLION)
- TABLE 206 JAPAN: MARKET, BY DEPLOYMENT MODEL, 2019–2022 (USD MILLION)
- TABLE 207 JAPAN: MARKET, BY DEPLOYMENT MODEL, 2023–2028 (USD MILLION)
- TABLE 208 INDIA: MARKET, BY OFFERING TYPE, 2019–2022 (USD MILLION)
- TABLE 209 INDIA: MARKET, BY OFFERING TYPE, 2023–2028 (USD MILLION)
- TABLE 210 INDIA: MARKET, BY DEPLOYMENT MODEL, 2019–2022 (USD MILLION)
- TABLE 211 INDIA: MARKET, BY DEPLOYMENT MODEL, 2023–2028 (USD MILLION)
- TABLE 212 AUSTRALIA & NEW ZEALAND: MARKET, BY OFFERING TYPE, 2019–2022 (USD MILLION)
- TABLE 213 AUSTRALIA & NEW ZEALAND: MARKET, BY OFFERING TYPE, 2023–2028 (USD MILLION)
- TABLE 214 AUSTRALIA & NEW ZEALAND: MARKET, BY DEPLOYMENT MODEL, 2019–2022 (USD MILLION)
- TABLE 215 AUSTRALIA & NEW ZEALAND: MARKET, BY DEPLOYMENT MODEL, 2023–2028 (USD MILLION)
- TABLE 216 REST OF ASIA PACIFIC: MARKET, BY OFFERING TYPE, 2019–2022 (USD MILLION)
- TABLE 217 REST OF ASIA PACIFIC: MARKET, BY OFFERING TYPE, 2023–2028 (USD MILLION)
- TABLE 218 REST OF ASIA PACIFIC: MARKET, BY DEPLOYMENT MODEL, 2019–2022 (USD MILLION)
- TABLE 219 REST OF ASIA PACIFIC: VIDEO ON DEMAND MARKET, BY DEPLOYMENT MODEL, 2023–2028 (USD MILLION)
- TABLE 220 MIDDLE EAST & AFRICA: MARKET, BY OFFERING TYPE, 2019–2022 (USD MILLION)
- TABLE 221 MIDDLE EAST & AFRICA: MARKET, BY OFFERING TYPE, 2023–2028 (USD MILLION)
- TABLE 222 MIDDLE EAST & AFRICA: MARKET, BY SOLUTION, 2019–2022 (USD MILLION)
- TABLE 223 MIDDLE EAST & AFRICA: MARKET, BY SOLUTION, 2023–2028 (USD MILLION)
- TABLE 224 MIDDLE EAST & AFRICA: MARKET, BY SERVICE, 2019–2022 (USD MILLION)
- TABLE 225 MIDDLE EAST & AFRICA: MARKET, BY SERVICE, 2023–2028 (USD MILLION)
- TABLE 226 MIDDLE EAST & AFRICA: MARKET, BY PROFESSIONAL SERVICE, 2019–2022 (USD MILLION)
- TABLE 227 MIDDLE EAST & AFRICA: MARKET, BY PROFESSIONAL SERVICE, 2023–2028 (USD MILLION)
- TABLE 228 MIDDLE EAST & AFRICA: MARKET, BY PLATFORM TYPE, 2019–2022 (USD MILLION)
- TABLE 229 MIDDLE EAST & AFRICA: MARKET, BY PLATFORM TYPE, 2023–2028 (USD MILLION)
- TABLE 230 MIDDLE EAST & AFRICA: MARKET, BY CONTENT TYPE, 2019–2022 (USD MILLION)
- TABLE 231 MIDDLE EAST & AFRICA: MARKET, BY CONTENT TYPE, 2023–2028 (USD MILLION)
- TABLE 232 MIDDLE EAST & AFRICA: MARKET, BY DEPLOYMENT MODEL, 2019–2022 (USD MILLION)
- TABLE 233 MIDDLE EAST & AFRICA: MARKET, BY DEPLOYMENT MODEL, 2023–2028 (USD MILLION)
- TABLE 234 MIDDLE EAST & AFRICA: MARKET, BY MONETIZATION MODEL, 2019–2022 (USD MILLION)
- TABLE 235 MIDDLE EAST & AFRICA: MARKET, BY MONETIZATION MODEL, 2023–2028 (USD MILLION)
- TABLE 236 MIDDLE EAST & AFRICA: MARKET, BY VERTICAL, 2019–2022 (USD MILLION)
- TABLE 237 MIDDLE EAST & AFRICA: MARKET, BY VERTICAL, 2023–2028 (USD MILLION)
- TABLE 238 MIDDLE EAST & AFRICA: MARKET, BY COUNTRY, 2019–2022 (USD MILLION)
- TABLE 239 MIDDLE EAST & AFRICA: MARKET, BY COUNTRY, 2023–2028 (USD MILLION)
- TABLE 240 GULF COOPERATION COUNCIL: MARKET, BY COUNTRY, 2019–2022 (USD MILLION)
- TABLE 241 GULF COOPERATION COUNCIL: MARKET, BY COUNTRY, 2023–2028 (USD MILLION)
- TABLE 242 GULF COOPERATION COUNCIL: MARKET, BY OFFERING TYPE, 2019–2022 (USD MILLION)
- TABLE 243 GULF COOPERATION COUNCIL: MARKET, BY OFFERING TYPE, 2023–2028 (USD MILLION)
- TABLE 244 GULF COOPERATION COUNCIL: MARKET, BY DEPLOYMENT MODEL, 2019–2022 (USD MILLION)
- TABLE 245 GULF COOPERATION COUNCIL: MARKET, BY DEPLOYMENT MODEL, 2023–2028 (USD MILLION)
- TABLE 246 SOUTH AFRICA: MARKET, BY OFFERING TYPE, 2019–2022 (USD MILLION)
- TABLE 247 SOUTH AFRICA: MARKET, BY OFFERING TYPE, 2023–2028 (USD MILLION)
- TABLE 248 SOUTH AFRICA: MARKET, BY DEPLOYMENT MODEL, 2019–2022 (USD MILLION)
- TABLE 249 SOUTH AFRICA: MARKET, BY DEPLOYMENT MODEL, 2023–2028 (USD MILLION)
- TABLE 250 REST OF MIDDLE EAST & AFRICA: MARKET, BY OFFERING TYPE, 2019–2022 (USD MILLION)
- TABLE 251 REST OF MIDDLE EAST & AFRICA: VIDEO ON DEMAND MARKET, BY OFFERING TYPE, 2023–2028 (USD MILLION)
- TABLE 252 REST OF MIDDLE EAST & AFRICA: MARKET, BY DEPLOYMENT MODEL, 2019–2022 (USD MILLION)
- TABLE 253 REST OF MIDDLE EAST & AFRICA: MARKET, BY DEPLOYMENT MODEL, 2023–2028 (USD MILLION)
- TABLE 254 LATIN AMERICA: MARKET, BY OFFERING TYPE, 2019–2022 (USD MILLION)
- TABLE 255 LATIN AMERICA: MARKET, BY OFFERING TYPE, 2023–2028 (USD MILLION)
- TABLE 256 LATIN AMERICA: MARKET, BY SOLUTION, 2019–2022 (USD MILLION)
- TABLE 257 LATIN AMERICA: MARKET, BY SOLUTION, 2023–2028 (USD MILLION)
- TABLE 258 LATIN AMERICA: MARKET, BY SERVICE, 2019–2022 (USD MILLION)
- TABLE 259 LATIN AMERICA: MARKET, BY SERVICE, 2023–2028 (USD MILLION)
- TABLE 260 LATIN AMERICA: MARKET, BY PROFESSIONAL SERVICE, 2019–2022 (USD MILLION)
- TABLE 261 LATIN AMERICA: MARKET, BY PROFESSIONAL SERVICE, 2023–2028 (USD MILLION)
- TABLE 262 LATIN AMERICA: MARKET, BY PLATFORM TYPE, 2019–2022 (USD MILLION)
- TABLE 263 LATIN AMERICA: MARKET, BY PLATFORM TYPE, 2023–2028 (USD MILLION)
- TABLE 264 LATIN AMERICA: MARKET, BY CONTENT TYPE, 2019–2022 (USD MILLION)
- TABLE 265 LATIN AMERICA: MARKET, BY CONTENT TYPE, 2023–2028 (USD MILLION)
- TABLE 266 LATIN AMERICA: MARKET, BY DEPLOYMENT MODEL, 2019–2022 (USD MILLION)
- TABLE 267 LATIN AMERICA: MARKET, BY DEPLOYMENT MODEL, 2023–2028 (USD MILLION)
- TABLE 268 LATIN AMERICA: MARKET, BY MONETIZATION MODEL, 2019–2022 (USD MILLION)
- TABLE 269 LATIN AMERICA: MARKET, BY MONETIZATION MODEL, 2023–2028 (USD MILLION)
- TABLE 270 LATIN AMERICA: MARKET, BY VERTICAL, 2019–2022 (USD MILLION)
- TABLE 271 LATIN AMERICA: MARKET, BY VERTICAL, 2023–2028 (USD MILLION)
- TABLE 272 LATIN AMERICA: MARKET, BY COUNTRY, 2019–2022 (USD MILLION)
- TABLE 273 LATIN AMERICA: MARKET, BY COUNTRY, 2023–2028 (USD MILLION)
- TABLE 274 BRAZIL: VIDEO ON DEMAND MARKET, BY OFFERING TYPE, 2019–2022 (USD MILLION)
- TABLE 275 BRAZIL: VIDEO ON DEMAND MARKET, BY OFFERING TYPE, 2023–2028 (USD MILLION)
- TABLE 276 BRAZIL: VIDEO ON DEMAND MARKET, BY DEPLOYMENT MODEL, 2019–2022 (USD MILLION)
- TABLE 277 BRAZIL: VIDEO ON DEMAND MARKET, BY DEPLOYMENT MODEL, 2023–2028 (USD MILLION)
- TABLE 278 MEXICO: VIDEO ON DEMAND MARKET, BY OFFERING TYPE, 2019–2022 (USD MILLION)
- TABLE 279 MEXICO: VIDEO ON DEMAND MARKET, BY OFFERING TYPE, 2023–2028 (USD MILLION)
- TABLE 280 MEXICO: VIDEO ON DEMAND MARKET, BY DEPLOYMENT MODEL, 2019–2022 (USD MILLION)
- TABLE 281 MEXICO: VIDEO ON DEMAND MARKET, BY DEPLOYMENT MODEL, 2023–2028 (USD MILLION)
- TABLE 282 REST OF LATIN AMERICA: MARKET, BY OFFERING TYPE, 2019–2022 (USD MILLION)
- TABLE 283 REST OF LATIN AMERICA: MARKET, BY OFFERING TYPE, 2023–2028 (USD MILLION)
- TABLE 284 REST OF LATIN AMERICA: MARKET, BY DEPLOYMENT MODEL, 2019–2022 (USD MILLION)
- TABLE 285 REST OF LATIN AMERICA: MARKET, BY DEPLOYMENT MODEL, 2023–2028 (USD MILLION)
- TABLE 286 OVERVIEW OF STRATEGIES ADOPTED BY KEY VENDORS
- TABLE 287 MARKET SHARE OF KEY VENDORS IN 2022
- TABLE 288 VENDOR PRODUCTS/BRANDS COMPARISON
- TABLE 289 VIDEO ON DEMAND MARKET: COMPANY REGION FOOTPRINT
- TABLE 290 VIDEO ON DEMAND MARKET: COMPANY OFFERING TYPE FOOTPRINT
- TABLE 291 VIDEO ON DEMAND MARKET: COMPANY VERTICAL FOOTPRINT
- TABLE 292 VIDEO ON DEMAND MARKET: COMPANY PLATFORM TYPE FOOTPRINT
- TABLE 293 VIDEO ON DEMAND MARKET: COMPETITIVE BENCHMARKING OF KEY STARTUPS/SMES
- TABLE 294 VIDEO ON DEMAND MARKET: DETAILED LIST OF KEY STARTUPS/SMES
- TABLE 295 VIDEO ON DEMAND MARKET: PRODUCT LAUNCHES/DEVELOPMENTS, MARCH 2021–JANUARY 2024
- TABLE 296 VIDEO ON DEMAND MARKET: DEALS, AUGUST 2021–JANUARY 2024
- TABLE 297 NETFLIX: COMPANY OVERVIEW
- TABLE 298 NETFLIX: PRODUCTS/SOLUTIONS/SERVICES OFFERED
- TABLE 299 NETFLIX: PRODUCT LAUNCHES
- TABLE 300 NETFLIX: DEALS
- TABLE 301 AMAZON: COMPANY OVERVIEW
- TABLE 302 AMAZON: PRODUCTS/SOLUTIONS/SERVICES OFFERED
- TABLE 303 AMAZON: PRODUCT LAUNCHES
- TABLE 304 AMAZON: DEALS
- TABLE 305 GOOGLE: COMPANY OVERVIEW
- TABLE 306 GOOGLE: PRODUCTS/SOLUTIONS/SERVICES OFFERED
- TABLE 307 GOOGLE: PRODUCT LAUNCHES
- TABLE 308 GOOGLE: DEALS
- TABLE 309 THE WALT DISNEY COMPANY: COMPANY OVERVIEW
- TABLE 310 THE WALT DISNEY COMPANY: PRODUCTS/SOLUTIONS/SERVICES OFFERED
- TABLE 311 THE WALT DISNEY COMPANY: PRODUCT LAUNCHES
- TABLE 312 THE WALT DISNEY COMPANY: DEALS
- TABLE 313 APPLE: COMPANY OVERVIEW
- TABLE 314 APPLE: PRODUCTS/SOLUTIONS/SERVICES OFFERED
- TABLE 315 APPLE: PRODUCT LAUNCHES
- TABLE 316 APPLE: DEALS
- TABLE 317 WARNER BROS. DISCOVERY: COMPANY OVERVIEW
- TABLE 318 WARNER BROS. DISCOVERY: PRODUCTS/SOLUTIONS/SERVICES OFFERED
- TABLE 319 WARNER BROS. DISCOVERY: PRODUCT LAUNCHES
- TABLE 320 WARNER BROS. DISCOVERY: DEALS
- TABLE 321 COMCAST CORPORATION: COMPANY OVERVIEW
- TABLE 322 COMCAST CORPORATION: PRODUCTS/SOLUTIONS/SERVICES OFFERED
- TABLE 323 COMCAST CORPORATION: PRODUCT LAUNCHES
- TABLE 324 COMCAST CORPORATION: DEALS
- TABLE 325 PARAMOUNT PICTURES CORPORATION: COMPANY OVERVIEW
- TABLE 326 PARAMOUNT PICTURES CORPORATION: PRODUCTS/SOLUTIONS/SERVICES OFFERED
- TABLE 327 PARAMOUNT PICTURES CORPORATION: PRODUCT LAUNCHES
- TABLE 328 PARAMOUNT PICTURES CORPORATION: DEALS
- TABLE 329 SONY: COMPANY OVERVIEW
- TABLE 330 SONY: PRODUCTS/SOLUTIONS/SERVICES OFFERED
- TABLE 331 SONY: PRODUCT LAUNCHES
- TABLE 332 SONY: DEALS
- TABLE 333 FOX CORPORATION: COMPANY OVERVIEW
- TABLE 334 FOX CORPORATION: PRODUCTS/SOLUTIONS/SERVICES OFFERED
- TABLE 335 FOX CORPORATION: DEALS
- TABLE 336 VIDEO PROCESSING PLATFORM MARKET, BY CONTENT TYPE, 2019–2022 (USD MILLION)
- TABLE 337 VIDEO PROCESSING PLATFORM MARKET, BY CONTENT TYPE, 2023–2028 (USD MILLION)
- TABLE 338 REAL-TIME/LIVE: VIDEO PROCESSING PLATFORM MARKET, BY REGION, 2019–2022 (USD MILLION)
- TABLE 339 REAL-TIME/LIVE: VIDEO PROCESSING PLATFORM MARKET, BY REGION, 2023–2028 (USD MILLION)
- TABLE 340 ON-DEMAND: VIDEO PROCESSING PLATFORM MARKET, BY REGION, 2019–2022 (USD MILLION)
- TABLE 341 ON-DEMAND: VIDEO PROCESSING PLATFORM MARKET, BY REGION, 2023–2028 (USD MILLION)
- TABLE 342 VIDEO STREAMING SOFTWARE MARKET, BY DELIVERY CHANNEL, 2019–2022 (USD MILLION)
- TABLE 343 VIDEO STREAMING SOFTWARE MARKET, BY DELIVERY CHANNEL, 2023–2028 (USD MILLION)
- TABLE 344 DELIVERY CHANNEL: VIDEO STREAMING SOFTWARE MARKET, BY REGION, 2019–2022 (USD MILLION)
- TABLE 345 DELIVERY CHANNEL: VIDEO STREAMING SOFTWARE MARKET, BY REGION, 2023–2028 (USD MILLION)
- TABLE 346 PAY-TV: VIDEO STREAMING SOFTWARE MARKET, BY REGION, 2019–2022 (USD MILLION)
- TABLE 347 PAY-TV: VIDEO STREAMING SOFTWARE MARKET, 2023–2028 (USD MILLION)
- TABLE 348 IPTV: VIDEO STREAMING SOFTWARE MARKET, BY REGION, 2019–2022 (USD MILLION)
- TABLE 349 IPTV: VIDEO STREAMING SOFTWARE MARKET, BY REGION, 2023–2028 (USD MILLION)
- TABLE 350 OTT: VIDEO STREAMING SOFTWARE MARKET, BY REGION, 2019–2022 (USD MILLION)
- TABLE 351 OTT: VIDEO STREAMING SOFTWARE MARKET, BY REGION, 2023–2028 (USD MILLION)
- FIGURE 1 RESEARCH DESIGN
- FIGURE 2 BREAKUP OF PRIMARY INTERVIEWS: BY COMPANY TYPE, DESIGNATION, AND REGION
- FIGURE 3 MARKET: TOP-DOWN AND BOTTOM-UP APPROACHES
- FIGURE 4 MARKET SIZE ESTIMATION METHODOLOGY – APPROACH 1 (SUPPLY SIDE): REVENUE OF SOLUTIONS AND SERVICES FROM VOD VENDORS
- FIGURE 5 MARKET SIZE ESTIMATION METHODOLOGY – BOTTOM-UP APPROACH (SUPPLY SIDE): COLLECTIVE REVENUE OF VOD VENDORS
- FIGURE 6 MARKET SIZE ESTIMATION METHODOLOGY – (SUPPLY SIDE): CAGR PROJECTIONS FROM SUPPLY SIDE
- FIGURE 7 MARKET SIZE ESTIMATION METHODOLOGY – BOTTOM-UP: REVENUE GENERATED BY VOD VENDORS FROM EACH COMPONENT
- FIGURE 8 MARKET SIZE ESTIMATION METHODOLOGY – APPROACH 2 (DEMAND SIDE): REVENUE GENERATED FROM DIFFERENT VOD SOLUTIONS
- FIGURE 9 VIDEO ON DEMAND MARKET SNAPSHOT, 2020–2028
- FIGURE 10 TOP MARKET SEGMENTS IN TERMS OF GROWTH RATE
- FIGURE 11 ASIA PACIFIC TO REGISTER HIGHEST CAGR DURING FORECAST PERIOD
- FIGURE 12 INCREASING DEMAND FOR VIDEO ON DEMAND SERVICES TO DRIVE MARKET
- FIGURE 13 SOLUTIONS SEGMENT ACCOUNTED FOR LARGER MARKET SHARE IN 2023
- FIGURE 14 OTT SERVICES SEGMENT ACCOUNTED FOR LARGEST MARKET SHARE IN 2023
- FIGURE 15 PROFESSIONAL SERVICES SEGMENT ACCOUNTED FOR LARGER MARKET SHARE IN 2023
- FIGURE 16 SUPPORT & MAINTENANCE SEGMENT ACCOUNTED FOR LARGEST MARKET SHARE IN 2023
- FIGURE 17 SMARTPHONES SEGMENT ACCOUNTED FOR LARGEST MARKET SHARE IN 2023
- FIGURE 18 MOVIES SEGMENT ACCOUNTED FOR LARGEST MARKET SHARE IN 2023
- FIGURE 19 SVOD SEGMENT TO LEAD MARKET FROM 2023 TO 2028
- FIGURE 20 MEDIA & ENTERTAINMENT SEGMENT ACCOUNTED FOR LARGEST MARKET SHARE IN 2023
- FIGURE 21 ASIA PACIFIC TO EMERGE AS LUCRATIVE MARKET FOR INVESTMENTS IN NEXT FIVE YEARS
- FIGURE 22 VIDEO ON DEMAND MARKET: DRIVERS, RESTRAINTS, OPPORTUNITIES, AND CHALLENGES
- FIGURE 23 LIKELIHOOD OF NON-VIDEO MARKETERS USING ONLINE VIDEO IN 2024
- FIGURE 24 PERCENTAGE OF USERS ENGAGED IN SOCIAL MEDIA ACROSS COUNTRIES IN 2022
- FIGURE 25 STREAMING VIEWERSHIP SURPASSES CABLE TV IN US (2021)
- FIGURE 26 GAMING DRIVES LIVE STREAMING
- FIGURE 27 VIDEO ON DEMAND MARKET: ECOSYSTEM ANALYSIS
- FIGURE 28 VIDEO ON DEMAND MARKET: SUPPLY CHAIN ANALYSIS
- FIGURE 29 NUMBER OF PATENTS PUBLISHED, 2013–2023
- FIGURE 30 TOP 10 PATENT APPLICANTS (GLOBAL) IN 2023
- FIGURE 31 VIDEO ON DEMAND MARKET: PORTER’S FIVE FORCES ANALYSIS
- FIGURE 32 VIDEO ON DEMAND MARKET: TRENDS/DISRUPTIONS IMPACTING BUYERS
- FIGURE 33 INFLUENCE OF STAKEHOLDERS ON BUYING PROCESS FOR TOP VERTICALS
- FIGURE 34 KEY BUYING CRITERIA FOR TOP VERTICALS
- FIGURE 35 LEADING GLOBAL VIDEO ON DEMAND MARKET VENDORS, BY NUMBER OF INVESTORS AND FUNDING ROUNDS (2023)
- FIGURE 36 SERVICES SEGMENT TO GROW AT HIGHEST CAGR DURING FORECAST PERIOD
- FIGURE 37 OTT SERVICES SEGMENT TO HAVE LARGEST MARKET SHARE DURING FORECAST PERIOD
- FIGURE 38 PROFESSIONAL SERVICES SEGMENT TO HAVE LARGEST MARKET SHARE DURING FORECAST PERIOD
- FIGURE 39 SUPPORT & MAINTENANCE SEGMENT TO ACCOUNT FOR HIGHEST CAGR DURING FORECAST PERIOD
- FIGURE 40 SUBSCRIPTION VIDEO ON DEMAND SEGMENT TO DISPLAY LARGEST MARKET SHARE DURING FORECAST PERIOD
- FIGURE 41 CLOUD SEGMENT TO REGISTER HIGHEST CAGR DURING FORECAST PERIOD
- FIGURE 42 SMART TVS TO BE DOMINANT SEGMENT DURING FORECAST PERIOD
- FIGURE 43 MOVIES SEGMENT TO SHOWCASE LARGEST MARKET SHARE DURING FORECAST PERIOD
- FIGURE 44 MEDIA & ENTERTAINMENT SEGMENT ACCOUNTED FOR LARGEST MARKET SHARE IN 2023
- FIGURE 45 VIDEO ON DEMAND MARKET, BY REGION, 2023–2028
- FIGURE 46 NORTH AMERICA: VIDEO ON DEMAND MARKET SNAPSHOT
- FIGURE 47 ASIA PACIFIC: VIDEO ON DEMAND MARKET SNAPSHOT
- FIGURE 48 VIDEO ON DEMAND MARKET: MARKET SHARE ANALYSIS, 2022
- FIGURE 49 VIDEO ON DEMAND MARKET: REVENUE ANALYSIS, 2019–2023 (USD MILLION)
- FIGURE 50 COMPANY EVALUATION MATRIX FOR KEY PLAYERS: CRITERIA WEIGHTAGE
- FIGURE 51 VIDEO ON DEMAND MARKET: COMPANY EVALUATION MATRIX FOR KEY PLAYERS, 2023
- FIGURE 52 VIDEO ON DEMAND MARKET: COMPANY OVERALL FOOTPRINT
- FIGURE 53 EVALUATION MATRIX FOR STARTUPS/SMES: CRITERIA WEIGHTAGE
- FIGURE 54 VIDEO ON DEMAND MARKET: COMPANY EVALUATION MATRIX FOR KEY STARTUPS/SMES, 2023
- FIGURE 55 COMPANY VALUATION AND FINANCIAL METRICS OF KEY VENDORS
- FIGURE 56 YEAR-TO-DATE (YTD) PRICE TOTAL RETURN AND 5-YEAR STOCK BETA OF KEY VENDORS
- FIGURE 57 NETFLIX: COMPANY SNAPSHOT
- FIGURE 58 AMAZON: COMPANY SNAPSHOT
- FIGURE 59 GOOGLE: COMPANY SNAPSHOT
- FIGURE 60 THE WALT DISNEY COMPANY: COMPANY SNAPSHOT
- FIGURE 61 APPLE: COMPANY SNAPSHOT
- FIGURE 62 WARNER BROS. DISCOVERY: COMPANY SNAPSHOT
- FIGURE 63 COMCAST CORPORATION: COMPANY SNAPSHOT
- FIGURE 64 PARAMOUNT PICTURES CORPORATION: COMPANY SNAPSHOT
- FIGURE 65 SONY: COMPANY SNAPSHOT
- FIGURE 66 FOX CORPORATION: COMPANY SNAPSHOT
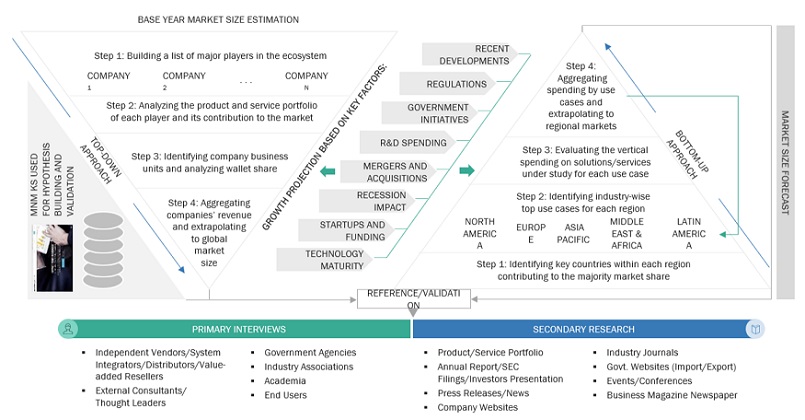
The study comprised four main activities to estimate the size of the VoD market. We conducted significant secondary research to gather data on the market, the competing market, and the parent market. The following stage involved conducting primary research to confirm these conclusions and hypotheses and sizing with industry experts throughout the value chain. The overall market size was evaluated using a blend of top-down and bottom-up approach methodologies. After that, we estimated the market sizes of the various VoD market segments using the market breakup and data triangulation techniques.
Secondary Research
Multiple secondary sources were consulted throughout the secondary research process to identify and gather information for this study. These included annual reports, white papers, certified publications, press releases, investor presentations of companies, and articles from recognized associations and government publishing sources. Other sources include journals such as the Information Technology and Security (IJCSITS) and The Journal of Network and Computer Applications and associations such as the International Journal of Computer Science, Journal of Information Security and Applications, and the Technology Services Industry Association (TSIA) and The World Information Technology and Services Alliance (WITSA).
Secondary research was mainly used to obtain critical information about the industry insights, the market’s monetary chain, the extensive collection of key stakeholders, market segmentation, industry trend-based categorization down to the regional level, and notable developments in market and technology.
Primary Research
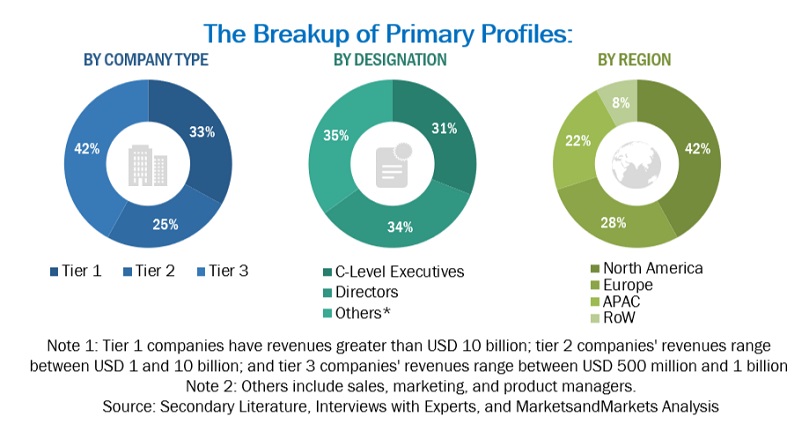
In the initial research stage, we interviewed multiple primary resources from both the supply and demand sides of the VoD market to collect qualitative and quantitative data to enhance the study. The primary sources from the supply side included industry experts, such as technology and innovation directors, Chief Executive Officers (CEOs), marketing directors, Vice Presidents (VPs), related vital executives from vendors providing VoD offerings, associated service providers, and SIs operating in the targeted countries. All possible parameters that affect the market covered in this research study have been accounted for, viewed in extensive detail, verified through primary research, and analyzed to arrive at the final quantitative and qualitative data.
After the complete market engineering process (including calculations for market statistics, market breakup, market size estimations, market forecasting, and data triangulation), extensive primary research was conducted to gather information and verify and validate the critical numbers arrived at. The primary research also helped identify and validate the segmentation, industry trends, key players, competitive landscape, and market dynamics, such as drivers, restraints, opportunities, challenges, and key strategies. In the complete market engineering process, the bottom-up approach and several data triangulation methods were extensively used to perform market estimation and market forecasting for the overall market segments and subsegments listed in this report. An extensive qualitative and quantitative analysis of the complete market engineering process was performed to document the key information/insights throughout the report.
To know about the assumptions considered for the study, download the pdf brochure
Video on Demand Market Size Estimation
The VoD market and related submarkets were estimated and forecasted using top-down and bottom-up methodologies. Using the revenues and product offerings of the major market players, the bottom-up method was used to determine the size of the market overall. This research ascertained and validated the precise value of the total parent market size through data triangulation techniques and primary interview validation. Next, using percentage splits of the market segments, the overall market size was utilized in the top-down approach to estimate the size of other individual markets.
Top Down and Bottom Up Approach of VoD market.
To know about the assumptions considered for the study, Request for Free Sample Report
The research methodology used to estimate the market size included the following:
- Primary and secondary research was utilized to determine the revenue contributions of the major market participants in each country after secondary research helped identify them.
- Throughout the process, critical insights were obtained by conducting in-depth interviews with industry professionals, including directors, CEOs, VPs, and marketing executives, and by reading the annual and financial reports of the top firms in the market.
- Primary sources were used to verify all percentage splits and breakups, which were calculated using secondary sources.
Data Triangulation
The market was divided into several segments and subsegments using the previously described market size estimation procedures once the overall market size was determined. When required, market breakdown and data triangulation procedures were employed to complete the market engineering process and specify the exact figures for every market segment and subsegment. The data was triangulated by examining several variables and patterns from government entities' supply and demand sides.
Video on Demand Market Definition
MarketsandMarkets defines Video on Demand as the infrastructure and systems to deliver video content to end-users online. This typically involves streaming technology, content delivery networks (CDNs), digital rights management (DRM), and other components to ensure reliable and secure delivery of video content. VoD systems utilize streaming protocols to deliver video content to users in real-time or near-real-time. These protocols, such as Dynamic Adaptive Streaming over HTTP (DASH), HTTP Live Streaming (HLS), or MPEG-DASH, facilitate the transmission of video data in a format that can be decoded and played back by the user's device as it is received. VoD systems may implement user authentication mechanisms to verify the identity of users and grant appropriate access permissions to content. This can involve user accounts, passwords, access tokens, or other authentication methods to control who can view specific videos and under what conditions.
Key Stakeholders
- VoD Services Providers (VSPs)
- VoD platform providers
- Technology services providers
- Government organizations
- Consultants/consultancies/advisory firms
- Support and maintenance services providers
- Information Technology (IT) infrastructure providers
- System Integrators (SIs)
- Regional associations
- Independent software vendors
- Value-added resellers and distributors
Report Objectives
- To define, describe, and forecast the global VoD market based on offering type, monetization model, deployment model, platform type, content type, vertical, and region
- To provide detailed information about the major factors (drivers, opportunities, restraints, and challenges) influencing the growth of the VoD market
- To analyze the opportunities in the market for stakeholders by identifying the high-growth segments of the VoD market
- To forecast the market size concerning five central regions - North America, Europe, Asia Pacific, the Middle East, Africa, and Latin America
- To analyze the subsegments of the market concerning individual growth trends, prospects, and contributions to the overall market
- To profile the key players of the VoD market and comprehensively analyze their market size and core competencies
- To track and analyze the competitive developments, such as product enhancements and product launches, acquisitions, and partnerships and collaborations, in the VoD market globally
Available Customizations
MarketsandMarkets provides customizations based on the company's unique requirements using market data. The following customization options are available for the report:
Product Analysis
- The product matrix provides a detailed comparison of the product portfolio of each company.
Geographic Analysis
- Further breakup of the VoD market
Company Information
- Detailed analysis and profiling of five additional market players
Growth opportunities and latent adjacency in Video on Demand (VoD) Market