Taste Modulators Market by Type (Sweet Modulators, Salt Modulators, Fat Modulators), Application (Food, Beverages, Pharmaceutical), and Region (North America, Europe, Asia-Pacific, South America, RoW) - Global Forecast to 2028
[291 Pagees Report] According to MarketsandMarkets, the global taste modulators market size is estimated to be valued at USD 1.4 billion in 2023 and is projected to reach USD 2.0 billion by 2028, recording a CAGR of 7.4%. This growth is primarily attributed to the increasing demand for processed and convenience foods. As consumers seek longer shelf life, enhanced taste, and appealing visual attributes, the food industry relies on additives. Their multifunctional roles in improving texture, flavor, and preservation contribute significantly to this expansion.
The expanding business has offered lucrative business opportunities to the players who are operating in the market segments. For instance, in November 2022, Tate & Lyle launched ERYTESSE Erythritol, its range of sugar substitutes with the introduction of ERYTESSE Erythritol. This expansion of its sweet modulators portfolio demonstrates Tate & Lyle’s commitment to meeting the diverse needs of consumers and food manufacturers. Other key players like Cargill, Incorporated have capitalized on this by making strategic partnerships. For instance, Cargill's collaboration with Barcelona-based food tech company Cubiq Foods focuses on co-developing plant-based fat ingredients. This strategic partnership accelerates the commercialization of novel fat technologies, enhancing flavor, reducing total fat, and meeting consumer expectations in the plant-based meat and alternative dairy sectors. Cargill's investment and global application knowledge position them to drive the development of next-gen plant-based products. This reinforces its commitment to sustainable ingredient innovation in the Taste modulators market.
The overall taste modulators market is classified as a competitive market, with the key players, namely DSM (Netherlands), IFF (US), Givaudan (Switzerland), Kerry Group PLC (Ireland), Ingredion (US) occupying 35-40% of the market share.
To know about the assumptions considered for the study, Request for Free Sample Report
To know about the assumptions considered for the study, download the pdf brochure
Taste Modulators Market Dynamics
Drivers: Increase in consumer demand for reduced-calorie products retaining the taste of sugar
In developed countries, the demand for healthier, low-caloric foods and sweeteners has been on the rise to tackle the adverse health effects of predominantly sedentary lifestyles. As consumer demand for healthy food products increases to reduce their calorie intake, they prefer low-calorie foods. Most health-conscious consumers prefer sugar substitutes because they contain fewer calories than regular sugar. Consumption of sugar substitutes is an easy way to reduce calorie intake and stay healthy, which makes consumers search for alternatives to regular sugar.
Sugar substitutes such as high-intensity sweeteners reduce the concentration of sucralose while maintaining the intensity of sweetness. However, they exhibit off-tastes in the final product. Sweet modulators help eliminate these off-tastes while maintaining the low-calorie content of food and beverages.
Restraints: Stringent regulations and international standards for sweet- and salt-reducing ingredients
International bodies such as the World Health Organization (WHO); Food and Drug Administration (FDA); National Food Safety and Quality Service (SENASA), Argentina; Canadian Food Inspection Agency (CFIA), US; and Committee on the Environment; Public Health and Food Safety (EU) are associated with food safety regulations. These organizations have control over the use of different chemicals and materials used in food processing, directly or indirectly.
Sweetener products are subjected to rigorous safety and health checks. Regulatory bodies have conducted various studies in order to measure and assess the impact of these products on humans. Based on the results, products are classified, and the daily intake allowance (DIA) has been set. Standards established by agencies for classification and usage levels differ from respective authoritative bodies and pose a serious challenge to companies for streamlining product developments. Typically, European laws are stringent with artificial sweeteners, whereas US regulations favor the introduction of novel sweeteners irrespective of the origin.
Opportunities: Extensive research on Positive Allosteric Modulators (PAMs)
Positive allosteric modulators (PAMs) for sweet taste receptors are unique and represent a significant breakthrough in the effort to control caloric intake. PAMs do not exhibit any sweet taste on their own, simplifying the interpretation of enhancement properties. PAMs can enhance the sweetness using a low concentration of a modulator cost-effectively, maintaining the original taste of sugar without any increase in caloric value. Therefore, the continuous search for additional selective enhancers for other commercially relevant sweeteners acting within the Venus flytrap domain (VFT) of the sweet taste receptor could revolutionize the field of flavor development and sweetened products.
Challenges: Ambiguity regarding the health effects of sugar substitutes
Sweet taste modulators dominated the market as they are widely used in sugar substitutes to eliminate the metallic and bitter taste in the final product. However, the benefits and adverse effects of sugar substitutes are an ongoing subject of research and discussion. No regulatory body has declared sugar substitutes to be completely harmless for consumption as they do not have substantial evidence that they lead to health problems.
There are no standard regulations implemented on sweet modulators, and they vary with countries across the globe. For instance, The American Heart Association (AHA) and American Diabetes Association (ADA) have given cautious indications regarding the use of artificial sweeteners as a substitute for sugar. On the other hand, the FDA has approved some artificial sweeteners, including saccharin, aspartame, acesulfame potassium (Ace-K), sucralose, neotame, and Advantage. Research linking the use of sugar substitutes to various health problems is the biggest restraint to the sugar substitute market, which in turn impacts the growth of the taste modulators market.
The Taste Modulators Market Ecosystem
By type, the Sweet Modulators segment accounts highest market share Taste Modulators market during the forecast period.
The global shift towards healthier eating habits has led consumers to seek reduced sugar options without compromising on taste. Sweet modulators offer an effective solution by enhancing sweetness perception while allowing for sugar reduction in various food and beverage products. Secondly, the rising prevalence of health issues like obesity and diabetes has intensified the demand for sugar substitutes, propelling the dominance of sweet modulators. Additionally, ongoing advancements in sweet modulation technologies ensure the development of high-quality products, addressing consumer preferences for natural and clean-label sweeteners. The versatility of sweet modulators across diverse applications, from confectionery to beverages, further solidifies their market leadership, offering a comprehensive solution to manufacturers seeking to meet both taste and health-conscious consumer demands.
By application, the food segment accounts for a significant market share in the Taste modulators market.
Consumers increasingly prioritize healthier dietary choices; food manufacturers are compelled to reformulate their products by reducing salt, sugar, and fat content. Taste modulators play a crucial role in achieving this without compromising the overall flavor profile, thus addressing the growing demand for healthier food options. The versatile application of taste modulators across a wide range of food categories, including snacks, dairy, and processed foods, contributes to their prominence in the food segment. Furthermore, the emphasis on clean-label and natural ingredients in food products aligns with taste modulators, which can provide an improved sensory experience without resorting to artificial additives. The intersection of health-conscious consumer preferences, regulatory pressures, and the need for product innovation solidifies the food segment's substantial market share in the taste modulators landscape.
Asia Pacific is poised to experience the highest CAGR in the Taste modulators market during the forecast period.
The region's remarkable economic growth has led to increased consumer purchasing power, which, in turn, has boosted demand for processed foods and beverages. The escalating urbanization and evolving dietary preferences in the region play a pivotal role in propelling the adoption of taste modulators. Consumers' heightened preference for healthier food options, coupled with the proactive response from regional food manufacturers, propels the demand for taste modulation technologies. The robust food processing industry and the emergence of innovative culinary concepts further fuel the widespread incorporation of taste modulators across diverse food and beverage categories. As Asia Pacific aligns with global health trends, emphasizing reduced sugar, salt, and fat content, the demand for taste modulators is set to witness a substantial upswing. These factors collectively position Asia Pacific as a pivotal driver for the anticipated robust growth in the taste modulators market during the forecast period.
Asia Pacific: Taste Modulators Market Snapshot
Key Market Players
Key players in this market include DSM (Netherlands), IFF (US), Givaudan (Switzerland), Kerry Group PLC (Ireland), Ingredion (US), Symrise (Germany), Sensient Technologies Corporation (US), Tate & Lyle PLC (UK), Corbion (Netherlands), Takasago International Corporation (Japan), Icon Foods (US), Carmi Flavor & Fragrance Co., Inc. (US), Cargill Incorporated (US), MANE (France), and ADM (US)
Want to explore hidden markets that can drive new revenue in Taste Modulators Market?
Scope of the Report
Want to explore hidden markets that can drive new revenue in Taste Modulators Market?
Report Metric |
Details |
Market size estimation |
2023–2028 |
Base year considered |
2022 |
Forecast period considered |
2023–2028 |
Units considered |
Value (USD), Volume (Million Ton) |
Segments Covered |
Type, Application, and Region |
Regions covered |
North America, Europe, Asia Pacific, South America, and Rest of the World |
Companies studied |
|
Recent Developments
- In October 2023, Cargill experienced double-digit growth 2023 and concentrated on expanding in South India by investing USD 35 million in a Nellore manufacturing facility. During this period, Cargill prioritized supply chain resilience and quality to navigate inflationary pressures, aiming for long-term sustainable growth in India's evolving food market.
- In September 2023, Tate & Lyle (UK) partnered with IMCD (Belgium) in Finland and the Baltic region, expanding their ingredient distribution. This collaboration would help Tate & Lyle (UK) to expand the geographical reach of its sweeteners business to Finland and the Baltic region, thereby expanding its market share.
- In March 2023, ADM announced the signing of a joint venture agreement with Marel, a prominent provider of advanced food processing solutions. The purpose of this collaboration is to establish an innovation center at the esteemed Wageningen Campus in the Netherlands, which is known as the heart of the country's food valley. Its opening is subject to regulatory approvals and is expected to take place in the latter half of 2024. It is specifically designed to facilitate the partnership between food manufacturers, food scientists, extrusion experts, and culinary professionals.
Frequently Asked Questions (FAQ):
What are the key applications considered in the study for major Taste modulators, and which segments within North America's food application are projected to experience promising growth?
The study focuses on three major applications: food, beverages and pharmaceuticals. Within North America's food application, the subsegment of Confectionery Products emerges as the dominant category, showcasing promising growth potential in the projected market trends.
Is there customizable information available specific to the European beverage market within the Taste modulators study, and if so, what details are provided?
Yes, Certainly, customization options are available for the European market across different segments, encompassing market size, dynamics, forecasts, competitive landscape, and company profiles. Exclusive insights will be offered for the specified European countries below:
- Germany
- France
- UK
- Italy
- Spain
- Netherlands
- Poland
- Rest of Europe (Belgium, Austria, Denmark, and other EU and non-EU countries.)
Could you highlight the opportunities identified in the study that are expected to fuel the future growth of the Taste modulators market?
The global Taste modulators market is characterized by the following opportunities:
Customization Solutions for Small and Medium Enterprises (SMEs): Tailoring taste modulators to meet the specific needs of SMEs in the food and beverage industry offers a lucrative opportunity. Providing cost-effective and versatile solutions for smaller-scale producers enhances market accessibility and fosters industry growth.
Integration of Artificial Intelligence (AI) in Taste Design: The incorporation of AI technologies for taste profiling and design represents an opportunity for taste modulator developers. Utilizing machine learning algorithms to predict and create flavor profiles aligns with the industry's quest for precision and innovation, fostering a competitive edge in the market.
Among the regions studied, which one is anticipated to exhibit the CAGR for the Taste modulators market?
Asia Pacific is anticipated to exhibit the highest CAGR for the Taste modulators market at 9.1%. This projection is attributed to factors such as evolving consumer preferences, urbanization, proactive industry response, and the embrace of global health trends.
What is the expected CAGR range projected for the Taste modulators market during the period 2023-2028, as outlined in the study?
The Taste modulators market is expected to record a CAGR of 7.4 % during the period 2023-2028. .
To speak to our analyst for a discussion on the above findings, click Speak to Analyst
Exclusive indicates content/data unique to MarketsandMarkets and not available with any competitors.
- 5.1 INTRODUCTION
-
5.2 MACROECONOMIC INDICATORSINCREASE IN RETAIL SALESGROWTH IN OPPORTUNITIES IN DEVELOPING REGIONS SUCH AS ASIA PACIFIC AND SOUTH AMERICA
-
5.3 MARKET DYNAMICSDRIVERS- Increase in consumer demand for low-calorie sugar products- Consumer inclination toward clean-label and organic products- Growing awareness regarding ill-effects of excessive salt intake- High consumption of monosodium glutamate (MSG) for umami taste modulationRESTRAINTS- Stringent regulations and international standards- Rise in consumer awareness regarding food additivesOPPORTUNITIES- Extensive research on Positive Allosteric Modulators (PAMs)- Increase in demand for innovative beveragesCHALLENGES- Ambiguity regarding health effects of sugar substitutes- Consumer awareness regarding ill-effects of taste modulators and growing demand for clean-label products
- 6.1 INTRODUCTION
-
6.2 VALUE CHAIN ANALYSISRAW MATERIAL PROVIDERSPRODUCT DEVELOPMENT STAKEHOLDERSMANUFACTURERSDISTRIBUTORSEND USERS
-
6.3 TECHNOLOGY ANALYSISFLAVOR EXTRACTIONULTRASONIC PRODUCTION OF FLAVOR INGREDIENTS3D FOOD PRINTING
- 6.4 PATENT ANALYSIS
-
6.5 ECOSYSTEM/MARKET MAPDEMAND SIDESUPPLY SIDE
- 6.6 TRADE ANALYSIS
-
6.7 PRICING ANALYSISAVERAGE SELLING PRICE TREND, BY APPLICATION
- 6.8 TRENDS/DISRUPTIONS IMPACTING CUSTOMERS’ BUSINESSES
- 6.9 KEY CONFERENCES & EVENTS
-
6.10 TARIFF AND REGULATORY LANDSCAPENORTH AMERICA- US- Mexico- CanadaEUROPE- France- UK- Rest of EuropeASIA PACIFIC- India- China- Japan- AustraliaSOUTH AMERICA- Brazil- ArgentinaMIDDLE EASTREST OF THE WORLD (ROW)
-
6.11 PORTER’S FIVE FORCES ANALYSISINTENSITY OF COMPETITIVE RIVALRYBARGAINING POWER OF SUPPLIERSBARGAINING POWER OF BUYERSTHREAT OF SUBSTITUTESTHREAT OF NEW ENTRANTS
-
6.12 KEY STAKEHOLDERS AND BUYING CRITERIAKEY STAKEHOLDERS IN BUYING PROCESS
-
6.13 CASE STUDIESINTEGRATED EXTRACTION SYSTEM HELPED MULTIPLE MANUFACTURERS OVERCOME PROCESSING INCONSISTENCIES
- 7.1 INTRODUCTION
-
7.2 SWEET MODULATORSVARIED MECHANISMS OF SWEET MODULATORS TO BOOST THEIR APPLICATION IN DIFFERENT SEGMENTS
-
7.3 SALT MODULATORSRISING DEMAND FOR NUTRITIONAL, SAVORY PRODUCTS TO FUEL DEMAND
-
7.4 FAT MODULATORSGROWING CONCERNS REGARDING RISKS ASSOCIATED WITH HIGH-FAT FOOD PRODUCTS TO BOOST DEMAND
- 8.1 INTRODUCTION
-
8.2 FOODCONFECTIONERY PRODUCTS- Trend of preferring healthy and tasty confectionery in developing regions to fuel marketBAKERY PRODUCTS- Shift in consumer preference for low-calorie bakery products to drive marketDAIRY PRODUCTS- Rising demand for dairy products to optimize nutritional content via taste modulatorsSNACKS & SAVORY PRODUCTS- Rising demand for umami flavor in snack and savory products to fuel popularity of taste modulatorsMEAT PRODUCTS- Increasing demand for processed meat with low sodium content to boost demandOTHER FOOD APPLICATIONS
-
8.3 BEVERAGESNON-ALCOHOLIC BEVERAGES- Growing demand for healthy, ready-to-drink beverages to fuel market- Dairy-based beverages- Fruit- and vegetable-based beverages- Carbonated soft drinks- Functional drinks- OthersALCOHOLIC BEVERAGES- High demand for alcoholic beverages in developed countries to drive market
-
8.4 PHARMACEUTICALSGROWING REQUIREMENT FOR TASTE-MASKING IN PHARMACEUTICAL INDUSTRY TO FUEL DEMAND
- 9.1 INTRODUCTION
-
9.2 NORTH AMERICANORTH AMERICA: RECESSION IMPACT ANALYSISUS- Government awareness programs regarding effects of excess salt and sugar intake to promote use of taste modulatorsCANADA- Rising health concerns associated with high-caloric processed food products to drive marketMEXICO- Growing consumer inclination toward processed food and meat products to fuel demand for taste modulators
-
9.3 EUROPEEUROPE: RECESSION IMPACT ANALYSISGERMANY- Increasing demand for healthy and clean-label processed products to present lucrative market opportunitiesFRANCE- Surging end-user application of taste modulators to increase demandUK- Growing health concerns due to lifestyle changes to drive need for taste modulatorsITALY- Government initiatives to reduce salt levels in processed food to support growth of taste modulatorsSPAIN- Growing popularity of low-sugar beverage products to increase demand for taste modulatorsNETHERLANDS- Strong customer base and presence of key players to strengthen market for taste modulatorsPOLAND- Flourishing food & beverage industry to drive need for taste modulatorsREST OF EUROPE
-
9.4 ASIA PACIFICASIA PACIFIC: RECESSION IMPACT ANALYSISCHINA- Adoption of Westernized lifestyle to fuel market for taste modulatorsINDIA- Growing health-conscious population to increase consumption of low-calorie, low-fat productsJAPAN- Rising focus of people on consuming food products with low salt and calories to drive marketAUSTRALIA & NEW ZEALAND- Growing consumer focus on healthy and nutritional food and beverages to drive marketREST OF ASIA PACIFIC
-
9.5 SOUTH AMERICASOUTH AMERICA: RECESSION IMPACT ANALYSISBRAZIL- Increased demand for premium consumer products to boost marketARGENTINA- Growing affinity toward functional food and beverage products to drive demand for taste modulatorsREST OF SOUTH AMERICA
-
9.6 REST OF THE WORLD (ROW)ROW: RECESSION IMPACT ANALYSISSAUDI ARABIA- Rising demand for healthy products to boost need for taste modulatorsIRAN- Increasing adoption of processed food and meat to fuel demand for taste modulatorsSOUTH AFRICA- Rising health concerns to impact demand for taste modulators and low-calorie productsOTHERS IN ROW
- 10.1 OVERVIEW
- 10.2 MARKET SHARE ANALYSIS
- 10.3 KEY PLAYERS STRATEGIES/RIGHT TO WIN
- 10.4 REVENUE ANALYSIS
- 10.5 GLOBAL SNAPSHOT OF KEY MARKET PARTICIPANTS
-
10.6 COMPANY EVALUATION MATRIXSTARSEMERGING LEADERSPERVASIVE PLAYERSPARTICIPANTSCOMPANY FOOTPRINT
-
10.7 START-UP/SME EVALUATION MATRIXPROGRESSIVE COMPANIESRESPONSIVE COMPANIESDYNAMIC COMPANIESSTARTING BLOCKSCOMPETITIVE BENCHMARKING
-
10.8 COMPETITIVE SCENARIO AND TRENDSPRODUCT LAUNCHESDEALSOTHERS
-
11.1 KEY PLAYERSDSM- Business overview- Products/Services/Solutions offered- Recent developments- MnM viewINTERNATIONAL FLAVORS & FRAGRANCES INC.- Business overview- Products/Services/Solutions offered- Recent developments- MnM viewGIVAUDAN- Business overview- Products/Services/Solutions offered- Recent developments- MnM viewKERRY GROUP PLC- Business overview- Products/Services/Solutions offered- Recent developments- MnM viewINGREDION- Business overview- Products/Services/Solutions offered- Recent developments- MnM viewSYMRISE- Business overview- Products/Services/Solutions offered- Recent developments- MnM viewSENSIENT TECHNOLOGIES CORPORATION- Business overview- Products/Services/Solutions offered- Recent developments- MnM viewTATE & LYLE- Business overview- Products/Services/Solutions offered- Recent developments- MnM viewCORBION- Business overview- Products/Services/Solutions offered- Recent developments- MnM viewTAKASAGO INTERNATIONAL CORPORATION- Business overview- Products/Services/Solutions offered- Recent developments- MnM view
-
11.2 OTHER PLAYERSICON FOODS- Business overview- Products/Services/Solutions offered- Recent developments- MnM viewCARMI FLAVOR & FRAGRANCE CO., INC.- Business overview- Products/Services/Solutions offered- Recent developments- MnM viewCARGILL, INCORPORATED- Business overview- Products/Services/Solutions offered- Recent developments- MnM viewMANE- Business overview- Products/Services/Solutions offered- Recent developments- MnM viewADM- Business overview- Products/Services/Solutions offered- Recent developments- MnM viewANGELYEAST CO., LTD.- Business overview- Products/Services/Solutions offered- Recent developments- MnM viewFLAVORCHEM & ORCHIDIA FRAGRANCES- Business overview- Products/Services/Solutions offered- Recent developments- MnM viewSYNERGY FLAVORS- Business overview- Products/Services/Solutions offered- Recent developments- MnM viewINNOPHOS- Business overview- Products/Services/Solutions offered- Recent developments- MnM viewAPURA INGREDIENTS- Business overview- Products/Services/Solutions offered- Recent developments- MnM viewSWEEGENIXORA SCIENTIFIC INC.TASTES NATURALDÖHLER GMBHFLAVORSUM, LLC
- 12.1 INTRODUCTION
- 12.2 LIMITATIONS
-
12.3 FOOD FLAVORS MARKETMARKET DEFINITIONMARKET OVERVIEW
-
12.4 FLAVORS & FRAGRANCES MARKETMARKET DEFINITIONMARKET OVERVIEW
- 13.1 DISCUSSION GUIDE
- 13.2 KNOWLEDGESTORE: MARKETSANDMARKETS’ SUBSCRIPTION PORTAL
- 13.3 CUSTOMIZATION OPTIONS
- 13.4 RELATED REPORTS
- 13.5 AUTHOR DETAILS
- TABLE 1 USD EXCHANGE RATES, 2019–2022
- TABLE 2 LIST OF KEY PRIMARY INTERVIEW PARTICIPANTS
- TABLE 3 PATENTS PERTAINING TO TASTE MODULATORS, 2020–2023
- TABLE 4 ROLE OF PLAYERS IN MARKET ECOSYSTEM
- TABLE 5 TOP 10 IMPORTERS AND EXPORTERS OF TASTE MODULATORS, 2022 (USD THOUSAND)
- TABLE 6 AVERAGE SELLING PRICE TREND, BY APPLICATION, 2019–2022 (USD/TON)
- TABLE 7 AVERAGE SELLING PRICE TREND, BY TYPE, 2019–2022 (USD/TON)
- TABLE 8 AVERAGE SELLING PRICE TREND, BY REGION, 2019–2022 (USD/TON)
- TABLE 9 KEY CONFERENCES & EVENTS, 2023–2024
- TABLE 10 NORTH AMERICA: LIST OF REGULATORY BODIES, GOVERNMENT AGENCIES, AND OTHER ORGANIZATIONS
- TABLE 11 EUROPE: LIST OF REGULATORY BODIES, GOVERNMENT AGENCIES, AND OTHER ORGANIZATIONS
- TABLE 12 ASIA PACIFIC: LIST OF REGULATORY BODIES, GOVERNMENT AGENCIES, AND OTHER ORGANIZATIONS
- TABLE 13 IMPACT OF PORTER’S FIVE FORCES ON TASTE MODULATORS MARKET
- TABLE 14 INFLUENCE OF STAKEHOLDERS ON BUYING PROCESS FOR KEY APPLICATIONS
- TABLE 15 TASTE MODULATORS MARKET, BY TYPE, 2019–2022 (USD MILLION)
- TABLE 16 TASTE MODULATORS MARKET, BY TYPE, 2023–2028 (USD MILLION)
- TABLE 17 TASTE MODULATORS MARKET, BY TYPE, 2019–2022 (MILLION TONS)
- TABLE 18 TASTE MODULATORS MARKET, BY TYPE, 2023–2028 (MILLION TONS)
- TABLE 19 SWEET MODULATORS MARKET, BY REGION, 2019–2022 (USD MILLION)
- TABLE 20 SWEET MODULATORS MARKET, BY REGION, 2023–2028 (USD MILLION)
- TABLE 21 SWEET MODULATORS MARKET, BY REGION, 2019–2022 (MILLION TONS)
- TABLE 22 SWEET MODULATORS MARKET, BY REGION, 2023–2028 (MILLION TONS)
- TABLE 23 SALT MODULATORS MARKET, BY REGION, 2019–2022 (USD MILLION)
- TABLE 24 SALT MODULATORS MARKET, BY REGION, 2023–2028 (USD MILLION)
- TABLE 25 SALT MODULATORS MARKET, BY REGION, 2019–2022 (MILLION TONS)
- TABLE 26 SALT MODULATORS MARKET, BY REGION, 2023–2028 (MILLION TONS)
- TABLE 27 FAT MODULATORS MARKET, BY REGION, 2019–2022 (USD MILLION)
- TABLE 28 FAT MODULATORS MARKET, BY REGION, 2023–2028 (USD MILLION)
- TABLE 29 FAT MODULATORS MARKET, BY REGION, 2019–2022 (MILLION TONS)
- TABLE 30 FAT MODULATORS MARKET, BY REGION, 2023–2028 (MILLION TONS)
- TABLE 31 TASTE MODULATORS MARKET, BY APPLICATION, 2019–2022 (USD MILLION)
- TABLE 32 TASTE MODULATORS MARKET, BY APPLICATION, 2023–2028 (USD MILLION)
- TABLE 33 TASTE MODULATORS MARKET, BY APPLICATION, 2019–2022 (MILLION TONS)
- TABLE 34 TASTE MODULATORS MARKET, BY APPLICATION, 2023–2028 (MILLION TONS)
- TABLE 35 TASTE MODULATORS MARKET, BY FOOD APPLICATION, 2019–2022 (USD MILLION)
- TABLE 36 TASTE MODULATORS MARKET, BY FOOD APPLICATION, 2023–2028 (USD MILLION)
- TABLE 37 TASTE MODULATORS MARKET, BY BEVERAGE APPLICATION, 2019–2022 (USD MILLION)
- TABLE 38 TASTE MODULATORS MARKET, BY BEVERAGE APPLICATION, 2023–2028 (USD MILLION)
- TABLE 39 FOOD: TASTE MODULATORS MARKET, BY REGION, 2019–2022 (USD MILLION)
- TABLE 40 FOOD: TASTE MODULATORS MARKET, BY REGION, 2023–2028 (USD MILLION)
- TABLE 41 FOOD: TASTE MODULATORS MARKET, BY REGION, 2019–2022 (MILLION TONS)
- TABLE 42 FOOD: TASTE MODULATORS MARKET, BY REGION, 2023–2028 (MILLION TONS)
- TABLE 43 CONFECTIONERY PRODUCTS: TASTE MODULATORS MARKET, BY REGION, 2019–2022 (USD MILLION)
- TABLE 44 CONFECTIONERY PRODUCTS: TASTE MODULATORS MARKET, BY REGION, 2023–2028 (USD MILLION)
- TABLE 45 BAKERY PRODUCTS: TASTE MODULATORS MARKET, BY REGION, 2019–2022 (USD MILLION)
- TABLE 46 BAKERY PRODUCTS: TASTE MODULATORS MARKET, BY REGION, 2023–2028 (USD MILLION)
- TABLE 47 DAIRY PRODUCTS: TASTE MODULATORS MARKET, BY REGION, 2019–2022 (USD MILLION)
- TABLE 48 DAIRY PRODUCTS: TASTE MODULATORS MARKET, BY REGION, 2023–2028 (USD MILLION)
- TABLE 49 SNACKS & SAVORY PRODUCTS: TASTE MODULATORS MARKET, BY REGION, 2019–2022 (USD MILLION)
- TABLE 50 SNACKS & SAVORY PRODUCTS: TASTE MODULATORS MARKET, BY REGION, 2023–2028 (USD MILLION)
- TABLE 51 MEAT PRODUCTS: TASTE MODULATORS MARKET, BY REGION, 2019–2022 (USD MILLION)
- TABLE 52 MEAT PRODUCTS: TASTE MODULATORS MARKET, BY REGION, 2023–2028 (USD MILLION)
- TABLE 53 OTHER FOOD APPLICATIONS: TASTE MODULATORS MARKET, BY REGION, 2019–2022 (USD MILLION)
- TABLE 54 OTHER FOOD APPLICATIONS: TASTE MODULATORS MARKET, BY REGION, 2023–2028 (USD MILLION)
- TABLE 55 BEVERAGES: TASTE MODULATORS MARKET, BY REGION, 2019–2022 (USD MILLION)
- TABLE 56 BEVERAGES: TASTE MODULATORS MARKET, BY REGION, 2023–2028 (USD MILLION)
- TABLE 57 BEVERAGES: TASTE MODULATORS MARKET, BY REGION, 2019–2022 (MILLION TONS)
- TABLE 58 BEVERAGES: TASTE MODULATORS MARKET, BY REGION, 2023–2028 (MILLION TONS)
- TABLE 59 NON-ALCOHOLIC BEVERAGES: TASTE MODULATORS MARKET, BY REGION, 2019–2022 (USD MILLION)
- TABLE 60 NON-ALCOHOLIC BEVERAGES: TASTE MODULATORS MARKET, BY REGION, 2023–2028 (USD MILLION)
- TABLE 61 ALCOHOLIC BEVERAGES: TASTE MODULATORS MARKET, BY REGION, 2019–2022 (USD MILLION)
- TABLE 62 ALCOHOLIC BEVERAGES: TASTE MODULATORS MARKET, BY REGION, 2023–2028 (USD MILLION)
- TABLE 63 PHARMACEUTICALS: TASTE MODULATORS MARKET, BY REGION, 2019–2022 (USD MILLION)
- TABLE 64 PHARMACEUTICALS: TASTE MODULATORS MARKET, BY REGION, 2023–2028 (USD MILLION)
- TABLE 65 PHARMACEUTICALS: TASTE MODULATORS MARKET, BY REGION, 2019–2022 (MILLION TONS)
- TABLE 66 PHARMACEUTICALS: TASTE MODULATORS MARKET, BY REGION, 2023–2028 (MILLION TONS)
- TABLE 67 TASTE MODULATORS MARKET, BY REGION, 2019–2022 (USD MILLION)
- TABLE 68 TASTE MODULATORS MARKET, BY REGION, 2023–2028 (USD MILLION)
- TABLE 69 TASTE MODULATORS MARKET, BY REGION, 2019–2022 (MILLION TONS)
- TABLE 70 TASTE MODULATORS MARKET, BY REGION, 2023–2028 (MILLION TONS)
- TABLE 71 NORTH AMERICA: TASTE MODULATORS MARKET, BY COUNTRY, 2019–2022 (USD MILLION)
- TABLE 72 NORTH AMERICA: TASTE MODULATORS MARKET, BY COUNTRY, 2023–2028 (USD MILLION)
- TABLE 73 NORTH AMERICA: TASTE MODULATORS MARKET, BY COUNTRY, 2019–2022 (MILLION TONS)
- TABLE 74 NORTH AMERICA: TASTE MODULATORS MARKET, BY COUNTRY, 2023–2028 (MILLION TONS)
- TABLE 75 NORTH AMERICA: TASTE MODULATORS MARKET, BY TYPE, 2019–2022 (USD MILLION)
- TABLE 76 NORTH AMERICA: TASTE MODULATORS MARKET, BY TYPE, 2023–2028 (USD MILLION)
- TABLE 77 NORTH AMERICA: TASTE MODULATORS MARKET, BY TYPE, 2019–2022 (MILLION TONS)
- TABLE 78 NORTH AMERICA: TASTE MODULATORS MARKET, BY TYPE, 2023–2028 (MILLION TONS)
- TABLE 79 NORTH AMERICA: TASTE MODULATORS MARKET, BY APPLICATION, 2019–2022 (USD MILLION)
- TABLE 80 NORTH AMERICA: TASTE MODULATORS MARKET, BY APPLICATION, 2023–2028 (USD MILLION)
- TABLE 81 NORTH AMERICA: TASTE MODULATORS MARKET, BY APPLICATION, 2019–2022 (MILLION TONS)
- TABLE 82 NORTH AMERICA: TASTE MODULATORS MARKET, BY APPLICATION, 2023–2028 (MILLION TONS)
- TABLE 83 NORTH AMERICA: TASTE MODULATORS MARKET, BY FOOD APPLICATION, 2019–2022 (USD MILLION)
- TABLE 84 NORTH AMERICA: TASTE MODULATORS MARKET, BY FOOD APPLICATION, 2023–2028 (USD MILLION)
- TABLE 85 NORTH AMERICA: TASTE MODULATORS MARKET, BY BEVERAGE APPLICATION, 2019–2022 (USD MILLION)
- TABLE 86 NORTH AMERICA: TASTE MODULATORS MARKET, BY BEVERAGE APPLICATION, 2023–2028 (USD MILLION)
- TABLE 87 US: TASTE MODULATORS MARKET, BY TYPE, 2019–2022 (USD MILLION)
- TABLE 88 US: TASTE MODULATORS MARKET, BY TYPE, 2023–2028 (USD MILLION)
- TABLE 89 US: TASTE MODULATORS MARKET, BY APPLICATION, 2019–2022 (USD MILLION)
- TABLE 90 US: TASTE MODULATORS MARKET, BY APPLICATION, 2023–2028 (USD MILLION)
- TABLE 91 CANADA: TASTE MODULATORS MARKET, BY TYPE, 2019–2022 (USD MILLION)
- TABLE 92 CANADA: TASTE MODULATORS MARKET, BY TYPE, 2023–2028 (USD MILLION)
- TABLE 93 CANADA: TASTE MODULATORS MARKET, BY APPLICATION, 2019–2022 (USD MILLION)
- TABLE 94 CANADA: TASTE MODULATORS MARKET, BY APPLICATION, 2023–2028 (USD MILLION)
- TABLE 95 MEXICO: TASTE MODULATORS MARKET, BY TYPE, 2019–2022 (USD MILLION)
- TABLE 96 MEXICO: TASTE MODULATORS MARKET, BY TYPE, 2023–2028 (USD MILLION)
- TABLE 97 MEXICO: TASTE MODULATORS MARKET, BY APPLICATION, 2019–2022 (USD MILLION)
- TABLE 98 MEXICO: TASTE MODULATORS MARKET, BY APPLICATION, 2023–2028 (USD MILLION)
- TABLE 99 EUROPE: TASTE MODULATORS MARKET, BY COUNTRY, 2019–2022 (USD MILLION)
- TABLE 100 EUROPE: TASTE MODULATORS MARKET, BY COUNTRY, 2023–2028 (USD MILLION)
- TABLE 101 EUROPE: TASTE MODULATORS MARKET, BY COUNTRY, 2019–2022 (MILLION TONS)
- TABLE 102 EUROPE: TASTE MODULATORS MARKET, BY COUNTRY, 2023–2028 (MILLION TONS)
- TABLE 103 EUROPE: TASTE MODULATORS MARKET, BY TYPE, 2019–2022 (USD MILLION)
- TABLE 104 EUROPE: TASTE MODULATORS MARKET, BY TYPE, 2023–2028 (USD MILLION)
- TABLE 105 EUROPE: TASTE MODULATORS MARKET, BY TYPE, 2019–2022 (MILLION TONS)
- TABLE 106 EUROPE: TASTE MODULATORS MARKET, BY TYPE, 2023–2028 (MILLION TONS)
- TABLE 107 EUROPE: TASTE MODULATORS MARKET, BY APPLICATION, 2019–2022 (USD MILLION)
- TABLE 108 EUROPE: TASTE MODULATORS MARKET, BY APPLICATION, 2023–2028 (USD MILLION)
- TABLE 109 EUROPE: TASTE MODULATORS MARKET, BY APPLICATION, 2019–2022 (MILLION TONS)
- TABLE 110 EUROPE: TASTE MODULATORS MARKET, BY APPLICATION, 2023–2028 (MILLION TONS)
- TABLE 111 EUROPE: TASTE MODULATORS MARKET, BY FOOD APPLICATION, 2019–2022 (USD MILLION)
- TABLE 112 EUROPE: TASTE MODULATORS MARKET, BY FOOD APPLICATION, 2023–2028 (USD MILLION)
- TABLE 113 EUROPE: TASTE MODULATORS MARKET, BY BEVERAGE APPLICATION, 2019–2022 (USD MILLION)
- TABLE 114 EUROPE: TASTE MODULATORS MARKET, BY BEVERAGE APPLICATION, 2023–2028 (USD MILLION)
- TABLE 115 GERMANY: TASTE MODULATORS MARKET, BY TYPE, 2019–2022 (USD MILLION)
- TABLE 116 GERMANY: TASTE MODULATORS MARKET, BY TYPE, 2023–2028 (USD MILLION)
- TABLE 117 GERMANY: TASTE MODULATORS MARKET, BY APPLICATION, 2019–2022 (USD MILLION)
- TABLE 118 GERMANY: TASTE MODULATORS MARKET, BY APPLICATION, 2023–2028 (USD MILLION)
- TABLE 119 FRANCE: TASTE MODULATORS MARKET, BY TYPE, 2019–2022 (USD MILLION)
- TABLE 120 FRANCE: TASTE MODULATORS MARKET, BY TYPE, 2023–2028 (USD MILLION)
- TABLE 121 FRANCE: TASTE MODULATORS MARKET, BY APPLICATION, 2019–2022 (USD MILLION)
- TABLE 122 FRANCE: TASTE MODULATORS MARKET, BY APPLICATION, 2023–2028 (USD MILLION)
- TABLE 123 UK: TASTE MODULATORS MARKET, BY TYPE, 2019–2022 (USD MILLION)
- TABLE 124 UK: TASTE MODULATORS MARKET, BY TYPE, 2023–2028 (USD MILLION)
- TABLE 125 UK: TASTE MODULATORS MARKET, BY APPLICATION, 2019–2022 (USD MILLION)
- TABLE 126 UK: TASTE MODULATORS MARKET, BY APPLICATION, 2023–2028 (USD MILLION)
- TABLE 127 ITALY: TASTE MODULATORS MARKET, BY TYPE, 2019–2022 (USD MILLION)
- TABLE 128 ITALY: TASTE MODULATORS MARKET, BY TYPE, 2023–2028 (USD MILLION)
- TABLE 129 ITALY: TASTE MODULATORS MARKET, BY APPLICATION, 2019–2022 (USD MILLION)
- TABLE 130 ITALY: TASTE MODULATORS MARKET, BY APPLICATION, 2023–2028 (USD MILLION)
- TABLE 131 SPAIN: TASTE MODULATORS MARKET, BY TYPE, 2019–2022 (USD MILLION)
- TABLE 132 SPAIN: TASTE MODULATORS MARKET, BY TYPE, 2023–2028 (USD MILLION)
- TABLE 133 SPAIN: TASTE MODULATORS MARKET, BY APPLICATION, 2019–2022 (USD MILLION)
- TABLE 134 SPAIN: TASTE MODULATORS MARKET, BY APPLICATION, 2023–2028 (USD MILLION)
- TABLE 135 NETHERLANDS: TASTE MODULATORS MARKET, BY TYPE, 2019–2022 (USD MILLION)
- TABLE 136 NETHERLANDS: TASTE MODULATORS MARKET, BY TYPE, 2023–2028 (USD MILLION)
- TABLE 137 NETHERLANDS: TASTE MODULATORS MARKET, BY APPLICATION, 2019–2022 (USD MILLION)
- TABLE 138 NETHERLANDS: TASTE MODULATORS MARKET, BY APPLICATION, 2023–2028 (USD MILLION)
- TABLE 139 POLAND: TASTE MODULATORS MARKET, BY TYPE, 2019–2022 (USD MILLION)
- TABLE 140 POLAND: TASTE MODULATORS MARKET, BY TYPE, 2023–2028 (USD MILLION)
- TABLE 141 POLAND: TASTE MODULATORS MARKET, BY APPLICATION, 2019–2022 (USD MILLION)
- TABLE 142 POLAND: TASTE MODULATORS MARKET, BY APPLICATION, 2023–2028 (USD MILLION)
- TABLE 143 REST OF EUROPE: TASTE MODULATORS MARKET, BY TYPE, 2019–2022 (USD MILLION)
- TABLE 144 REST OF EUROPE: TASTE MODULATORS MARKET, BY TYPE, 2023–2028 (USD MILLION)
- TABLE 145 REST OF EUROPE: TASTE MODULATORS MARKET, BY APPLICATION, 2019–2022 (USD MILLION)
- TABLE 146 REST OF EUROPE: TASTE MODULATORS MARKET, BY APPLICATION, 2023–2028 (USD MILLION)
- TABLE 147 ASIA PACIFIC: TASTE MODULATORS MARKET, BY COUNTRY, 2019–2022 (USD MILLION)
- TABLE 148 ASIA PACIFIC: TASTE MODULATORS MARKET, BY COUNTRY, 2023–2028 (USD MILLION)
- TABLE 149 ASIA PACIFIC: TASTE MODULATORS MARKET, BY COUNTRY, 2019–2022 (MILLION TONS)
- TABLE 150 ASIA PACIFIC: TASTE MODULATORS MARKET, BY COUNTRY, 2023–2028 (MILLION TONS)
- TABLE 151 ASIA PACIFIC: TASTE MODULATORS MARKET, BY TYPE, 2019–2022 (USD MILLION)
- TABLE 152 ASIA PACIFIC: TASTE MODULATORS MARKET, BY TYPE, 2023–2028 (USD MILLION)
- TABLE 153 ASIA PACIFIC: TASTE MODULATORS MARKET, BY TYPE, 2019–2022 (MILLION TONS)
- TABLE 154 ASIA PACIFIC: TASTE MODULATORS MARKET, BY TYPE, 2023–2028 (MILLION TONS)
- TABLE 155 ASIA PACIFIC: TASTE MODULATORS MARKET, BY APPLICATION, 2019–2022 (USD MILLION)
- TABLE 156 ASIA PACIFIC: TASTE MODULATORS MARKET, BY APPLICATION, 2023–2028 (USD MILLION)
- TABLE 157 ASIA PACIFIC: TASTE MODULATORS MARKET, BY APPLICATION, 2019–2022 (MILLION TONS)
- TABLE 158 ASIA PACIFIC: TASTE MODULATORS MARKET, BY APPLICATION, 2023–2028 (MILLION TONS)
- TABLE 159 ASIA PACIFIC: TASTE MODULATORS MARKET, BY FOOD APPLICATION, 2019–2022 (USD MILLION)
- TABLE 160 ASIA PACIFIC: TASTE MODULATORS MARKET, BY FOOD APPLICATION, 2023–2028 (USD MILLION)
- TABLE 161 ASIA PACIFIC: TASTE MODULATORS MARKET, BY BEVERAGE APPLICATION, 2019–2022 (USD MILLION)
- TABLE 162 ASIA PACIFIC: TASTE MODULATORS MARKET, BY BEVERAGE APPLICATION, 2023–2028 (USD MILLION)
- TABLE 163 CHINA: TASTE MODULATORS MARKET, BY TYPE, 2019–2022 (USD MILLION)
- TABLE 164 CHINA: TASTE MODULATORS MARKET, BY TYPE, 2023–2028 (USD MILLION)
- TABLE 165 CHINA: TASTE MODULATORS MARKET, BY APPLICATION, 2019–2022 (USD MILLION)
- TABLE 166 CHINA: TASTE MODULATORS MARKET, BY APPLICATION, 2023–2028 (USD MILLION)
- TABLE 167 INDIA: TASTE MODULATORS MARKET, BY TYPE, 2019–2022 (USD MILLION)
- TABLE 168 INDIA: TASTE MODULATORS MARKET, BY TYPE, 2023–2028 (USD MILLION)
- TABLE 169 INDIA: TASTE MODULATORS MARKET, BY APPLICATION, 2019–2022 (USD MILLION)
- TABLE 170 INDIA: TASTE MODULATORS MARKET, BY APPLICATION, 2023–2028 (USD MILLION)
- TABLE 171 JAPAN: TASTE MODULATORS MARKET, BY TYPE, 2019–2022 (USD MILLION)
- TABLE 172 JAPAN: TASTE MODULATORS MARKET, BY TYPE, 2023–2028 (USD MILLION)
- TABLE 173 JAPAN: TASTE MODULATORS MARKET, BY APPLICATION, 2019–2022 (USD MILLION)
- TABLE 174 JAPAN: TASTE MODULATORS MARKET, BY APPLICATION, 2023–2028 (USD MILLION)
- TABLE 175 AUSTRALIA & NEW ZEALAND: TASTE MODULATORS MARKET, BY TYPE, 2019–2022 (USD MILLION)
- TABLE 176 AUSTRALIA & NEW ZEALAND: TASTE MODULATORS MARKET, BY TYPE, 2023–2028 (USD MILLION)
- TABLE 177 AUSTRALIA & NEW ZEALAND: TASTE MODULATORS MARKET, BY APPLICATION, 2019–2022 (USD MILLION)
- TABLE 178 AUSTRALIA & NEW ZEALAND: TASTE MODULATORS MARKET, BY APPLICATION, 2023–2028 (USD MILLION)
- TABLE 179 REST OF ASIA PACIFIC: TASTE MODULATORS MARKET, BY TYPE, 2019–2022 (USD MILLION)
- TABLE 180 REST OF ASIA PACIFIC: TASTE MODULATORS MARKET, BY TYPE, 2023–2028 (USD MILLION)
- TABLE 181 REST OF ASIA PACIFIC: TASTE MODULATORS MARKET, BY APPLICATION, 2019–2022 (USD MILLION)
- TABLE 182 REST OF ASIA PACIFIC: TASTE MODULATORS MARKET, BY APPLICATION, 2023–2028 (USD MILLION)
- TABLE 183 SOUTH AMERICA: TASTE MODULATORS MARKET, BY COUNTRY, 2019–2022 (USD MILLION)
- TABLE 184 SOUTH AMERICA: TASTE MODULATORS MARKET, BY COUNTRY, 2023–2028 (USD MILLION)
- TABLE 185 SOUTH AMERICA: TASTE MODULATORS MARKET, BY COUNTRY, 2019–2022 (MILLION TONS)
- TABLE 186 SOUTH AMERICA: TASTE MODULATORS MARKET, BY COUNTRY, 2023–2028 (MILLION TONS)
- TABLE 187 SOUTH AMERICA: TASTE MODULATORS MARKET, BY TYPE, 2019–2022 (USD MILLION)
- TABLE 188 SOUTH AMERICA: TASTE MODULATORS MARKET, BY TYPE, 2023–2028 (USD MILLION)
- TABLE 189 SOUTH AMERICA: TASTE MODULATORS MARKET, BY TYPE, 2019–2022 (MILLION TONS)
- TABLE 190 SOUTH AMERICA: TASTE MODULATORS MARKET, BY TYPE, 2023–2028 (MILLION TONS)
- TABLE 191 SOUTH AMERICA: TASTE MODULATORS MARKET, BY APPLICATION, 2019–2022 (USD MILLION)
- TABLE 192 SOUTH AMERICA: TASTE MODULATORS MARKET, BY APPLICATION, 2023–2028 (USD MILLION)
- TABLE 193 SOUTH AMERICA: TASTE MODULATORS MARKET, BY APPLICATION, 2019–2022 (MILLION TONS)
- TABLE 194 SOUTH AMERICA: TASTE MODULATORS MARKET, BY APPLICATION, 2023–2028 (MILLION TONS)
- TABLE 195 SOUTH AMERICA: TASTE MODULATORS MARKET, BY FOOD APPLICATION, 2019–2022 (USD MILLION)
- TABLE 196 SOUTH AMERICA: TASTE MODULATORS MARKET, BY FOOD APPLICATION, 2023–2028 (USD MILLION)
- TABLE 197 SOUTH AMERICA: TASTE MODULATORS MARKET, BY BEVERAGE APPLICATION, 2019–2022 (USD MILLION)
- TABLE 198 SOUTH AMERICA: TASTE MODULATORS MARKET, BY BEVERAGE APPLICATION, 2023–2028 (USD MILLION)
- TABLE 199 BRAZIL: TASTE MODULATORS MARKET, BY TYPE, 2019–2022 (USD MILLION)
- TABLE 200 BRAZIL: TASTE MODULATORS MARKET, BY TYPE, 2023–2028 (USD MILLION)
- TABLE 201 BRAZIL: TASTE MODULATORS MARKET, BY APPLICATION, 2019–2022 (USD MILLION)
- TABLE 202 BRAZIL: TASTE MODULATORS MARKET, BY APPLICATION, 2023–2028 (USD MILLION)
- TABLE 203 ARGENTINA: TASTE MODULATORS MARKET, BY TYPE, 2019–2022 (USD MILLION)
- TABLE 204 ARGENTINA: TASTE MODULATORS MARKET, BY TYPE, 2023–2028 (USD MILLION)
- TABLE 205 ARGENTINA: TASTE MODULATORS MARKET, BY APPLICATION, 2019–2022 (USD MILLION)
- TABLE 206 ARGENTINA: TASTE MODULATORS MARKET, BY APPLICATION, 2023–2028 (USD MILLION)
- TABLE 207 REST OF SOUTH AMERICA: TASTE MODULATORS MARKET, BY TYPE, 2019–2022 (USD MILLION)
- TABLE 208 REST OF SOUTH AMERICA: TASTE MODULATORS MARKET, BY TYPE, 2023–2028 (USD MILLION)
- TABLE 209 REST OF SOUTH AMERICA: TASTE MODULATORS MARKET, BY APPLICATION, 2019–2022 (USD MILLION)
- TABLE 210 REST OF SOUTH AMERICA: TASTE MODULATORS MARKET, BY APPLICATION, 2023–2028 (USD MILLION)
- TABLE 211 ROW: TASTE MODULATORS MARKET, BY COUNTRY, 2019–2022 (USD MILLION)
- TABLE 212 ROW: TASTE MODULATORS MARKET, BY COUNTRY, 2023–2028 (USD MILLION)
- TABLE 213 ROW: TASTE MODULATORS MARKET, BY COUNTRY, 2019–2022 (MILLION TONS)
- TABLE 214 ROW: TASTE MODULATORS MARKET, BY COUNTRY, 2023–2028 (MILLION TONS)
- TABLE 215 ROW: TASTE MODULATORS MARKET, BY TYPE, 2019–2022 (USD MILLION)
- TABLE 216 ROW: TASTE MODULATORS MARKET, BY TYPE, 2023–2028 (USD MILLION)
- TABLE 217 ROW: TASTE MODULATORS MARKET, BY TYPE, 2019–2022 (MILLION TONS)
- TABLE 218 ROW: TASTE MODULATORS MARKET, BY TYPE, 2023–2028 (MILLION TONS)
- TABLE 219 ROW: TASTE MODULATORS MARKET, BY APPLICATION, 2019–2022 (USD MILLION)
- TABLE 220 ROW: TASTE MODULATORS MARKET, BY APPLICATION, 2023–2028 (USD MILLION)
- TABLE 221 ROW: TASTE MODULATORS MARKET, BY APPLICATION, 2019–2022 (MILLION TONS)
- TABLE 222 ROW: TASTE MODULATORS MARKET, BY APPLICATION, 2023–2028 (MILLION TONS)
- TABLE 223 ROW: TASTE MODULATORS MARKET, BY FOOD APPLICATION, 2019–2022 (USD MILLION)
- TABLE 224 ROW: TASTE MODULATORS MARKET, BY FOOD APPLICATION, 2023–2028 (USD MILLION)
- TABLE 225 ROW: TASTE MODULATORS MARKET, BY BEVERAGE APPLICATION, 2019–2022 (USD MILLION)
- TABLE 226 ROW: TASTE MODULATORS MARKET, BY BEVERAGE APPLICATION, 2023–2028 (USD MILLION)
- TABLE 227 SAUDI ARABIA: TASTE MODULATORS MARKET, BY TYPE, 2019–2022 (USD MILLION)
- TABLE 228 SAUDI ARABIA: TASTE MODULATORS MARKET, BY TYPE, 2023–2028 (USD MILLION)
- TABLE 229 SAUDI ARABIA: TASTE MODULATORS MARKET, BY APPLICATION, 2019–2022 (USD MILLION)
- TABLE 230 SAUDI ARABIA: TASTE MODULATORS MARKET, BY APPLICATION, 2023–2028 (USD MILLION)
- TABLE 231 IRAN: TASTE MODULATORS MARKET, BY TYPE, 2019–2022 (USD MILLION)
- TABLE 232 IRAN: TASTE MODULATORS MARKET, BY TYPE, 2023–2028 (USD MILLION)
- TABLE 233 IRAN: TASTE MODULATORS MARKET, BY APPLICATION, 2019–2022 (USD MILLION)
- TABLE 234 IRAN: TASTE MODULATORS MARKET, BY APPLICATION, 2023–2028 (USD MILLION)
- TABLE 235 SOUTH AFRICA: TASTE MODULATORS MARKET, BY TYPE, 2019–2022 (USD MILLION)
- TABLE 236 SOUTH AFRICA: TASTE MODULATORS MARKET, BY TYPE, 2023–2028 (USD MILLION)
- TABLE 237 SOUTH AFRICA: TASTE MODULATORS MARKET, BY APPLICATION, 2019–2022 (USD MILLION)
- TABLE 238 SOUTH AFRICA: TASTE MODULATORS MARKET, BY APPLICATION, 2023–2028 (USD MILLION)
- TABLE 239 OTHERS IN ROW: TASTE MODULATORS MARKET, BY TYPE, 2019–2022 (USD MILLION)
- TABLE 240 OTHERS IN ROW: TASTE MODULATORS MARKET, BY TYPE, 2023–2028 (USD MILLION)
- TABLE 241 OTHERS IN ROW: TASTE MODULATORS MARKET, BY APPLICATION, 2019–2022 (USD MILLION)
- TABLE 242 OTHERS IN ROW: TASTE MODULATORS MARKET, BY APPLICATION, 2023–2028 (USD MILLION)
- TABLE 243 GLOBAL TASTE MODULATORS MARKET: INTENSITY OF COMPETITIVE RIVALRY
- TABLE 244 STRATEGIES ADOPTED BY KEY TASTE MODULATOR MANUFACTURERS
- TABLE 245 COMPANY FOOTPRINT, BY TYPE
- TABLE 246 COMPANY FOOTPRINT, BY APPLICATION
- TABLE 247 COMPANY FOOTPRINT, BY REGION
- TABLE 248 COMPETITIVE BENCHMARKING OF KEY PLAYERS
- TABLE 249 DETAILED LIST OF KEY START-UPS/SMES
- TABLE 250 COMPETITIVE BENCHMARKING OF KEY START-UPS/SMES
- TABLE 251 TASTE MODULATORS MARKET: PRODUCT LAUNCHES, NOVEMBER 2019– NOVEMBER 2022
- TABLE 252 TASTE MODULATORS MARKET: DEALS, MARCH 2023–SEPTEMBER 2023
- TABLE 253 TASTE MODULATORS MARKET: OTHERS, JANUARY 2022–OCTOBER 2023
- TABLE 254 DSM: BUSINESS OVERVIEW
- TABLE 255 DSM: PRODUCTS/SERVICES/SOLUTIONS OFFERED
- TABLE 256 DSM: PRODUCT LAUNCHES
- TABLE 257 DSM: DEALS
- TABLE 258 DSM: OTHERS
- TABLE 259 INTERNATIONAL FLAVORS & FRAGRANCES INC.: BUSINESS OVERVIEW
- TABLE 260 INTERNATIONAL FLAVORS & FRAGRANCES INC.: PRODUCTS/SERVICES/SOLUTIONS OFFERED
- TABLE 261 INTERNATIONAL FLAVORS & FRAGRANCES INC.: DEALS
- TABLE 262 INTERNATIONAL FLAVORS & FRAGRANCES INC.: OTHERS
- TABLE 263 GIVAUDAN: BUSINESS OVERVIEW
- TABLE 264 GIVAUDAN: PRODUCTS/SERVICES/SOLUTIONS OFFERED
- TABLE 265 GIVAUDAN: DEALS
- TABLE 266 GIVAUDAN: OTHERS
- TABLE 267 KERRY GROUP PLC: BUSINESS OVERVIEW
- TABLE 268 KERRY GROUP PLC: PRODUCTS/SERVICES/SOLUTIONS OFFERED
- TABLE 269 KERRY GROUP PLC: DEALS
- TABLE 270 KERRY GROUP PLC: OTHERS
- TABLE 271 INGREDION: BUSINESS OVERVIEW
- TABLE 272 INGREDION: PRODUCTS/SERVICES/SOLUTIONS OFFERED
- TABLE 273 INGREDION: PRODUCT LAUNCHES
- TABLE 274 INGREDION: DEALS
- TABLE 275 SYMRISE: BUSINESS OVERVIEW
- TABLE 276 SYMRISE: PRODUCTS/SERVICES/SOLUTIONS OFFERED
- TABLE 277 SYMRISE: OTHERS
- TABLE 278 SENSIENT TECHNOLOGIES CORPORATION: BUSINESS OVERVIEW
- TABLE 279 SENSIENT TECHNOLOGIES CORPORATION: PRODUCTS/SERVICES/ SOLUTIONS OFFERED
- TABLE 280 TATE & LYLE: BUSINESS OVERVIEW
- TABLE 281 TATE & LYLE: PRODUCTS/SERVICES/SOLUTIONS OFFERED
- TABLE 282 TATE & LYLE: PRODUCT LAUNCHES
- TABLE 283 TATE & LYLE: DEALS
- TABLE 284 TATE & LYLE: OTHERS
- TABLE 285 CORBION: BUSINESS OVERVIEW
- TABLE 286 CORBION: PRODUCTS/SERVICES/SOLUTIONS OFFERED
- TABLE 287 CORBION: PRODUCT LAUNCHES
- TABLE 288 TAKASAGO INTERNATIONAL CORPORATION: BUSINESS OVERVIEW
- TABLE 289 TAKASAGO INTERNATIONAL CORPORATION: PRODUCTS/SERVICES/ SOLUTIONS OFFERED
- TABLE 290 TAKASAGO INTERNATIONAL CORPORATION: OTHERS
- TABLE 291 ICON FOODS: BUSINESS OVERVIEW
- TABLE 292 ICON FOODS: PRODUCTS/SERVICES/SOLUTIONS OFFERED
- TABLE 293 CARMI FLAVOR & FRAGRANCE CO, INC.: BUSINESS OVERVIEW
- TABLE 294 CARMI FLAVOR & FRAGRANCE C0, INC.: PRODUCTS/SERVICES/ SOLUTIONS OFFERED
- TABLE 295 CARGILL, INCORPORATED: BUSINESS OVERVIEW
- TABLE 296 CARGILL, INCORPORATED: PRODUCTS/SERVICES/SOLUTIONS OFFERED
- TABLE 297 CARGILL, INCORPORATED: PRODUCT LAUNCHES
- TABLE 298 CARGILL, INCORPORATED: DEALS
- TABLE 299 CARGILL, INCORPORATED: OTHERS
- TABLE 300 MANE: BUSINESS OVERVIEW
- TABLE 301 MANE: PRODUCTS/SERVICES/SOLUTIONS OFFERED
- TABLE 302 ADM: BUSINESS OVERVIEW
- TABLE 303 ADM: PRODUCTS/SERVICES/SOLUTIONS OFFERED
- TABLE 304 ADM: DEALS
- TABLE 305 ANGELYEAST CO., LTD.: BUSINESS OVERVIEW
- TABLE 306 ANGELYEAST CO., LTD.: PRODUCTS/SERVICES/SOLUTIONS OFFERED
- TABLE 307 FLAVORCHEM & ORCHIDIA FRAGRANCES: BUSINESS OVERVIEW
- TABLE 308 FLAVORCHEM & ORCHIDIA FRAGRANCES: PRODUCTS/SOLUTIONS/ SERVICES OFFERED
- TABLE 309 SYNERGY FLAVORS: BUSINESS OVERVIEW
- TABLE 310 SYNERGY FLAVORS: PRODUCTS/SERVICES/SOLUTIONS OFFERED
- TABLE 311 SYNERGY FLAVORS: DEALS
- TABLE 312 INNOPHOS: BUSINESS OVERVIEW
- TABLE 313 INNOPHOS: PRODUCTS/SERVICES/SOLUTIONS OFFERED
- TABLE 314 APURA INGREDIENTS: BUSINESS OVERVIEW
- TABLE 315 APURA INGREDIENTS: PRODUCTS/SERVICES/SOLUTIONS OFFERED
- TABLE 316 MARKETS ADJACENT TO TASTE MODULATORS MARKET
- TABLE 317 FOOD FLAVORS MARKET, BY TYPE, 2019–2021 (USD MILLION)
- TABLE 318 FOOD FLAVORS MARKET, BY TYPE, 2022–2027 (USD MILLION)
- TABLE 319 FLAVORS & FRAGRANCES MARKET, BY INGREDIENT, 2016–2019 (USD MILLION)
- TABLE 320 FLAVORS & FRAGRANCES MARKET, BY INGREDIENT, 2020–2026 (USD MILLION)
- FIGURE 1 TASTE MODULATORS MARKET: RESEARCH DESIGN
- FIGURE 2 TASTE MODULATORS MARKET: KEY DATA FROM PRIMARY SOURCES
- FIGURE 3 BREAKDOWN OF PRIMARY INTERVIEWS
- FIGURE 4 TASTE MODULATORS MARKET: BOTTOM-UP APPROACH
- FIGURE 5 TASTE MODULATORS MARKET: TOP-DOWN APPROACH
- FIGURE 6 DATA TRIANGULATION
- FIGURE 7 MACRO-INDICATORS OF RECESSION
- FIGURE 8 GLOBAL INFLATION RATES, 2011–2022
- FIGURE 9 GLOBAL GDP, 2011–2022 (USD TRILLION)
- FIGURE 10 RECESSION INDICATORS AND THEIR IMPACT ON TASTE MODULATORS MARKET
- FIGURE 11 TASTE MODULATORS MARKET: EARLIER FORECAST VS. RECESSION FORECAST
- FIGURE 12 TASTE MODULATORS MARKET, BY APPLICATION, 2023 VS. 2028 (USD MILLION)
- FIGURE 13 TASTE MODULATORS MARKET, BY TYPE, 2023 VS. 2028 (USD MILLION)
- FIGURE 14 TASTE MODULATORS MARKET: REGIONAL ANALYSIS
- FIGURE 15 HIGH ADOPTION OF TASTE MODULATORS IN DEVELOPING MARKETS TO BOOST GROWTH
- FIGURE 16 BEVERAGES SEGMENT AND US ACCOUNTED FOR SIGNIFICANT SHARE IN 2022
- FIGURE 17 BEVERAGES SEGMENT TO DOMINATE MARKET DURING FORECAST PERIOD
- FIGURE 18 SWEET MODULATORS SEGMENT TO DOMINATE MARKET DURING FORECAST PERIOD
- FIGURE 19 NORTH AMERICA TO DOMINATE TASTE MODULATOR APPLICATIONS MARKET DURING FORECAST PERIOD
- FIGURE 20 RETAIL AND FOOD SERVICE SALES IN US, 2016–2021 (USD BILLION)
- FIGURE 21 ANNUAL GDP GROWTH RATE IN ASIAN COUNTRIES, 2022
- FIGURE 22 TASTE MODULATORS MARKET: DRIVERS, RESTRAINTS, OPPORTUNITIES, AND CHALLENGES
- FIGURE 23 CONSUMER PERCEPTION AND EXPECTATION OF NATURAL LABELS ON PROCESSED AND PACKAGED FOOD, 2020
- FIGURE 24 VALUE CHAIN ANALYSIS
- FIGURE 25 NUMBER OF PATENTS GRANTED, 2013–2023
- FIGURE 26 TOP 10 INVENTORS WITH HIGHEST NUMBER OF PATENT DOCUMENTS
- FIGURE 27 LEADING APPLICANTS WITH HIGHEST NUMBER OF PATENT DOCUMENTS
- FIGURE 28 ECOSYSTEM MAP
- FIGURE 29 AVERAGE SELLING PRICE TREND, BY APPLICATION, 2019–2022 (USD/TON)
- FIGURE 30 TRENDS/DISRUPTIONS IMPACTING CUSTOMERS’ BUSINESSES
- FIGURE 31 INFLUENCE OF STAKEHOLDERS ON BUYING PROCESS FOR KEY APPLICATIONS
- FIGURE 32 KEY BUYING CRITERIA FOR KEY APPLICATIONS
- FIGURE 33 TASTE MODULATORS MARKET, BY TYPE, 2023 VS. 2028 (USD MILLION)
- FIGURE 34 TASTE MODULATORS MARKET, BY APPLICATION, 2023 VS. 2028 (USD MILLION)
- FIGURE 35 INDIA TO BE FASTEST-GROWING MARKET DURING FORECAST PERIOD
- FIGURE 36 NORTH AMERICA: INFLATION RATES, BY COUNTRY, 2018–2021
- FIGURE 37 NORTH AMERICAN TASTE MODULATORS MARKET: RECESSION IMPACT ANALYSIS
- FIGURE 38 NORTH AMERICA: TASTE MODULATORS MARKET SNAPSHOT
- FIGURE 39 EUROPE: COUNTRY-WISE BEVERAGE CONSUMPTION, 2016–2021 (MILLION LITERS)
- FIGURE 40 EUROPE: INFLATION RATES, BY COUNTRY, 2018–2021
- FIGURE 41 EUROPEAN TASTE MODULATORS MARKET: RECESSION IMPACT ANALYSIS
- FIGURE 42 ASIA PACIFIC: INFLATION RATES, BY COUNTRY, 2018–2021
- FIGURE 43 ASIA PACIFIC TASTE MODULATORS MARKET: RECESSION IMPACT ANALYSIS
- FIGURE 44 ASIA PACIFIC: TASTE MODULATORS MARKET SNAPSHOT
- FIGURE 45 SOUTH AMERICA: INFLATION RATES, BY COUNTRY, 2018–2021
- FIGURE 46 SOUTH AMERICAN TASTE MODULATORS MARKET: RECESSION IMPACT ANALYSIS
- FIGURE 47 ROW: INFLATION RATES, BY COUNTRY, 2018–2021
- FIGURE 48 ROW TASTE MODULATORS MARKET: RECESSION IMPACT ANALYSIS
- FIGURE 49 REVENUE ANALYSIS OF KEY PLAYERS, 2018–2022 (USD BILLION)
- FIGURE 50 GLOBAL SNAPSHOT OF KEY MARKET PARTICIPANTS, 2022
- FIGURE 51 COMPANY EVALUATION MATRIX, 2022
- FIGURE 52 START-UP/SME EVALUATION MATRIX, 2022
- FIGURE 53 DSM: COMPANY SNAPSHOT
- FIGURE 54 INTERNATIONAL FLAVORS & FRAGRANCES INC.: COMPANY SNAPSHOT
- FIGURE 55 GIVAUDAN: COMPANY SNAPSHOT
- FIGURE 56 KERRY GROUP PLC: COMPANY SNAPSHOT
- FIGURE 57 INGREDION: COMPANY SNAPSHOT
- FIGURE 58 SYMRISE: COMPANY SNAPSHOT
- FIGURE 59 SENSIENT TECHNOLOGIES CORPORATION: COMPANY SNAPSHOT
- FIGURE 60 TATE & LYLE: COMPANY SNAPSHOT
- FIGURE 61 CORBION: COMPANY SNAPSHOT
- FIGURE 62 TAKASAGO INTERNATIONAL CORPORATION: COMPANY SNAPSHOT
- FIGURE 63 CARGILL, INCORPORATED: COMPANY SNAPSHOT
- FIGURE 64 ADM: COMPANY SNAPSHOT
- FIGURE 65 ANGELYEAST CO., LTD.: COMPANY SNAPSHOT
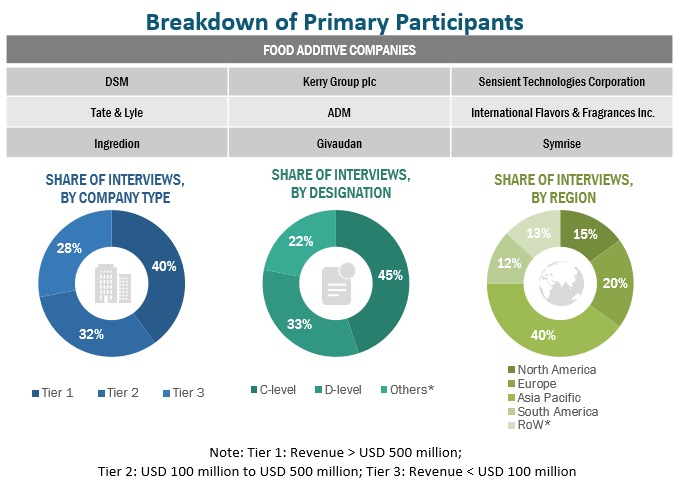
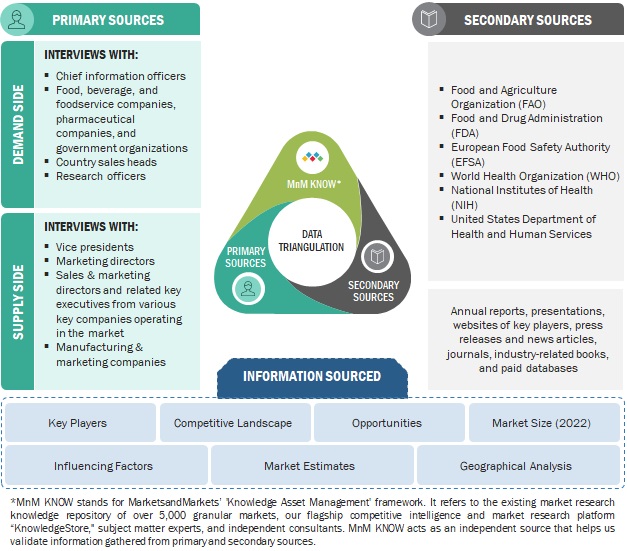
This research involves the extensive use of secondary sources; directories; and databases (Bloomberg and Factiva) to identify and collect information useful for a technical, market-oriented, and commercial study of the Taste Modulators market. In-depth interviews were conducted with various primary respondents, such as key industry participants, Subject Matter Experts (SMEs), C-level executives of key market players, and industry consultants, to obtain and verify critical qualitative and quantitative information and to assess prospects.
Secondary Research
In the secondary research process, various sources, such as the Food and Agricultural Organization (FAO), United States Department of Agriculture (USDA), U.S. Food and Drug Administration (FDA) U.S. Food and Drug Administration (FDA), European Food Safety Authority (EFSA), World Health Organization (WHO), Consumer Healthcare Products Association (CHPA), European Federation of Associations of Health Product Manufacturers (EHPM), Canadian Health Food Association (CHFA), and Health Food Manufacturers' Association (HFMA), associations were referred to identify and collect information for this study. The secondary sources also include journals, press releases, investor presentations of companies, whitepapers, certified publications, articles by recognized authors and regulatory bodies, trade directories, and paid databases.
Primary Research
The Taste Modulators market encompasses various stakeholders involved in the supply chain, raw material manufacturers, raw material suppliers, regulatory organizations, and research institutions. To gather comprehensive information, primary sources from both the supply and demand sides were engaged. Primary interviewees from the supply side consisted of manufacturers, distributors, importers, and technology providers involved in the production and distribution of Taste Modulators. On the demand side, key opinion leaders, executives, and CEOs of companies in the Taste Modulators industry were approached through questionnaires, emails, and telephonic interviews. This approach ensured a comprehensive and well-rounded understanding of the Taste Modulators market from various perspectives.
To know about the assumptions considered for the study, download the pdf brochure
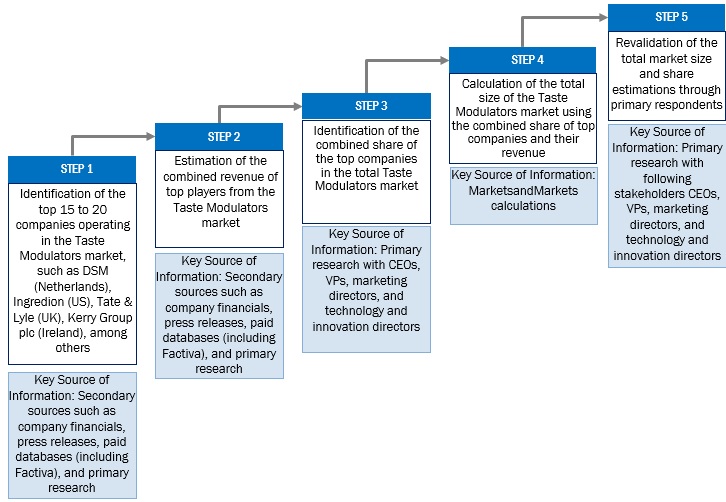
The top-down and bottom-up approaches were used to estimate and validate the market’s and various dependent submarkets’ size. The research methodology used to estimate the market size includes extensive secondary research of key players, reports, reviews, and newsletters of top market players, along with extensive interviews from leaders, such as CEOs, directors, and marketing executives.
Global Taste Modulators Market Size: Bottom-Up Approach
To know about the assumptions considered for the study, Request for Free Sample Report
Global Taste Modulators market Size: Top-Down Approach
Global Taste Modulators market size estimation: SUPPLY SIDE
Data Triangulation
The data triangulation and market breakdown procedures explained above were implemented, wherever applicable, to complete the overall market engineering process and arrive at the exact statistics for various market segments and subsegments. The data was triangulated by studying various factors and trends from the demand and supply sides. Along with this, the market size was validated using both the top-down and bottom-up approaches.
Market Definition
Taste modulators are substances used to restore any change in taste caused by using alternative food ingredients, providing the desired taste perception to a product. Sweet, salt, and fat modulators are available to compensate for the changes in taste that occur because of the use of low-calorie sugar substitutes, low-sodium salts, and fat reducers, respectively. These substances mask and modulate the taste of the respective substitutes, ensuring that the primary tastes of un-modified sugar, salt, and fat are emulated, in the absence of their presence.
Though the primary role of taste modulators involves the quality of taste, they also play a role in modulating the texture and mouthfeel of the food & beverage products that they are used in. Even though these substances play a role in changing more features than just the taste of a food or beverage product, it is important to note that these substances are not the same as flavor modulators.
Key Stakeholders
- Taste modulator manufacturers and processors
- Taste modulators traders, distributors, and suppliers
- Food product manufacturers, processors, and traders
- Food ingredient manufacturers, processors, and traders
- Organizations such as the Food and Drug Administration (FDA), the US Department of Agriculture (USDA), the European Food Safety Agency (EFSA), and The International Food Additives Council (IFAC)
- Government and research organization
- Associations. regulatory bodies, and other industry-related bodies:
- Food Processing Suppliers Association (FPSA)
- Center for Innovative Food Technology (CIFT)
- Food and Drug Administration (FDA)
- European Food Safety Agency (EFSA)
- The National Association of Flavors and Food-Ingredient Systems (NAFFS)
Report Objectives
- To define, segment, and project the global market for Taste Modulators on the basis of type, application, and region
- To provide detailed information regarding the key factors influencing the growth of the market (drivers, restraints, opportunities, and industry-specific challenges)
- To strategically analyze the micro markets with respect to individual growth trends, future prospects, and their contribution to the total market
- To analyze the opportunities in the market for stakeholders and provide a competitive landscape of the market leaders
- To project the size of the market and its submarkets, in terms of value with respect to the regions (along with the key countries)
- To strategically profile the key players and comprehensively analyze their market position and core competencies
- To analyze competitive developments in the Taste Modulators market, including joint ventures, mergers & acquisitions, new product developments, and research & development activities
Report Scope:
Taste Modulators market:
By Type
- Sweet Modulators
- Salt Modulators
- Fat Modulators
By Application
-
Food
- Confectionery Products
- Bakery Products
- Dairy Products
- Snacks & Savory Products
- Meat Products
- Other Food Applications
-
Beverages
- Non-Alcoholic Beverages
- Alcoholic Beverages
- Pharmaceutical
By Region
- North America
- Europe
- Asia Pacific
- South America
- Rest of the World
Available Customizations
With the given market data, MarketsandMarkets offers customizations according to company-specific scientific needs.
The following customization options are available for the report:
Product Analysis
- Product Matrix, which gives a detailed comparison of the product portfolio of each company
Geographic Analysis
With the given market data, MarketsandMarkets offers customizations according to company-specific scientific needs.
- Further breakdown of the Rest of the European Taste Modulators market, by key country
- Further breakdown of the Rest of the Asia Pacific Taste Modulators market, by key country
- Further breakdown of the Rest of South America Taste Modulators market, by key country
Company Information
- Detailed analyses and profiling of additional market players
Growth opportunities and latent adjacency in Taste Modulators Market