Flavors & Fragrances Market

Report Code CH 6073
Published in Aug, 2024, By MarketsandMarkets™
Download PDF

Choose License Type

Buy Report Now Inquire Before Buying

Flavors & Fragrances Market by Ingredient Type (Synthetic, Natural), End-use Industry (Beverages, Bakery, Savory & Snacks, Dairy Products, Confectionery, Consumer Products, Fine Fragrances), and Region - Global Forecast to 2029

Overview

In terms of value, the flavors & fragrances market is estimated to grow from USD 35.3 billion in 2024 to USD 42.3 billion by 2029, at a CAGR of 3.7%. The market for flavors & fragrances is expected to grow due to the increasing demand for convenient, ready-to-eat foods, changing customer preferences, and organic goods free of artificial ingredients. Urbanization and rising disposable incomes also play a role in driving the growth of the flavors & fragrances market in regions such as Asia Pacific, South America and Africa. The increasing demand for a range of consumer products, like food, beverages, personal care items, and household goods is driven by the migration of people to urban areas and their changing lifestyle and consumption patterns.

Attractive Opportunities in the Flavors and Fragrances Market

Asia Pacific

Market growth can be attributed to growing demand for convenience and ready-to-eat foods

Rising demand from various end-use industries is driving the flavors & fragrances market globally.

Shifting consumer preferences in emerging economies would offer lucrative opportunities for market players in the next 5 years.

Asia Pacific is the fastest growing market for mold flavors & fragrances market.

The market growth in Asia Pacific can be attributed to the rapid industrialization and growing population in emerging countries of the region.

Global Flavors and Fragrances Market Dynamics

DRIVER: Growing demand for natural products

The growing demand for natural products is boosting the flavors & fragrances market due to several factors. The interest has shifted to natural products in the light of growing awareness towards environmental sustainability, and consumers are becoming more aware of the environmental implications associated with their choices. Natural flavors & fragrances are also believed to be more ecological since they undergo fewer chemical transformations than their synthetic analogue in most cases. Furthermore, companies are investing their resources in researching and developing natural products to replace synthetic flavors and fragrances. These are the driving factors of this flavors market.

RESTRAINTS: Fluctuating raw material prices

The market for flavors & fragrances is restricted by the fluctuating raw material prices. The volatility in raw material prices affects more than short-term oriented financial implications for manufacturers. This may decrease the demand from end-customers, especially in price-sensitive markets where they may switch to cheaper alternatives or cut back their use of discretionary products. This second sales decline may further deteriorate the manufacturers' financial problems by creating a vicious circle of falling revenues and growing costs.


OPPORTUNITIES: Innovation in end-use industries

The huge potential for the market of flavors & fragrances does exist because of the constant innovation in the end-use industries since the companies are always on the lookout for new methods to set them apart from the competition, catering to the changing taste of the customers, and adherence to legal requirements. The growing popularity of functional foods that have additional health benefits beyond simple nutrition has further accelerated the need for new flavors. In a bid to cater to these consumers and help themselves stand out in an increasingly competitive market, manufacturers are coming up with new innovative flavors from natural and plant-based sources.

CHALLENGES: Limited progression in value chain among developing economies

Limited progression in value chain among developing economies present a significant hurdle for the flavors & fragrances market. The raw materials suppliers are from emerging countries like India, Bangladesh, Vietnam, and other South American countries. Many players are involved in the production of synthetic aroma ingredients due to lack of research and development facilities. Thus, these players are not able to create product differentiation and hence end up facing stiff price competition. Apart from this, the increasing competition from established players from China is further increasing the price competition and has forced the emerging players to work on low-profit margins. This has limited their capacity to invest in product development activities, which in turn hampers their growth and progression in the value chain.

Global Flavors and Fragrances Market Ecosystem Analysis

Prominent companies in this market include well-established, financially stable manufacturers of flavors & fragrances. These companies have been in business for a while and have a broad range of products, cutting-edge technologies, and robust international sales and marketing networks. Prominent companies in this market include Givaudan SA (Switzerland), International Flavors & Fragrances Inc. (US), DSM-Firmenich AG (Switzerland), Symrise AG (Germany), ADM (US), Takasago International Corporation (Japan), Sensient Technologies Corporation (US), MANE (France), Robertet Group (France), T. Hasegawa Co., Ltd. (Japan), and Bell Flavors & Fragrances (US).


Based on ingredient type, natural segment is projected to register highest CAGR in flavors & fragrances market, in terms of value, during forecast period.

Natural segment is projected to witness the highest CAGR in flavors & fragrances, during the forecast period. The usage of artificial ingredients and chemicals in consumer goods is subjected to stricter regulations and laws from governments and regulatory agencies across the globe. As an outcome, the manufacturers are required to reformulate them to comply with these rules, leading to the growing usage of natural ingredients.

Based on end-use industry, bakery segment was the second-largest segment of flavors market, in terms of value, in 2023.

The bakery segment holds the position as the second-largest end-use industry in the flavors market. With increasing busy lives, customers are getting more and more attracted to products that are convenient to purchase and consume on the move. Canned or packaged bakery products, especially ready-to-eat ones, fully meet these needs. This has resulted in the innovation of a wide variety of bakery products addressing diet needs, such as whole-grain, low-sugar, and gluten-free, among others. A boost in the capability of flavors to improve the palatability of healthy baked products is reinforcing the bakery segment in the flavors market.Based on end-use industry, consumer products segment was the largest segment of fragrances market, in terms of value, in 2023.The consumer products segment was the largest end-use industry in the fragrances market in terms of value, in 2023. The dominance of consumer products is due to the incorporation of fragrances with the objective to provide consumers with enhanced experiences and to establish an emotional connection with the consumer. Through its fragrance, a product can establish and create emotions of purity, freshness, thus differentiating the product in a highly crowded segment. The large consumer base has also spurred this market segment into larger demand for fragrances.

Asia Pacific region holds the largest share of the Flavors and Fragrances Market.

Asia Pacific holds the position as the largest consumer region for flavors & fragrances market due to its cultural diversity. Different cultural traditions are prevalent in this region, with their spice and flavor blends differing and unique to each tradition. The complexity of the culture creates the need for a correspondingly wide range of flavors to suit regional preferences. This encourages creativity in the development of new flavor combinations, driving the flavors & fragrances market.


Recent Developments of Flavors and Fragrances Market industry

  • In March 2024, DSM-Firmenich AG opened two modern production facilities for the manufacture of ingredients for perfumes in Castets, Southwest of France.
  • In March 2023, International Flavors & Fragrances Inc. announced the addition of two new flavor labs at its Europe Innovation Hub in Braband, Denmark. The laboratories will focus on creating gourmet and sweet flavors.

Key Market Players

KEY PLAYERS IN THE Flavors and Fragrances Market INCLUDE

Want to explore hidden markets that can drive new revenue in Flavors & Fragrances Market?

Scope of the Report

Report Attribute Details
Years considered for the study 2018–2029
Base year considered 2023
Forecast period 2024–2029
Units considered Value (USD Million)
Segments Covered Ingredient Type, End-use Industry, and Region
Regions covered Asia Pacific, North America, Europe, Middle East & Africa, and South America
Companies profiled The key players profiled in the report include Givaudan SA (Switzerland), International Flavors & Fragrances Inc. (US), DSM-Firmenich AG (Switzerland), Symrise AG (Germany), ADM (US), Takasago International Corporation (Japan), Sensient Technologies Corporation (US), MANE (France), Robertet Group (France), T. Hasegawa Co., Ltd. (Japan), and Bell Flavors & Fragrances (US). 


Key Questions Addressed by the Report

Which are the major players in the flavors & fragrances market?
The key players profiled in the report include Givaudan SA (Switzerland), International Flavors & Fragrances Inc. (US), DSM-Firmenich AG (Switzerland), Symrise AG (Germany), ADM (US), Takasago International Corporation (Japan), Sensient Technologies Corporation (US), MANE (France), Robertet Group (France), T. Hasegawa Co., Ltd. (Japan), and Bell Flavors & Fragrances (US).
What are the drivers and opportunities for the flavors & fragrances market?
Increasing demand for natural flavors & fragrances, increasing consumer preference towards convenience foods, rising demand for natural products, rising demand for consumer products, digitalization of the retail industry, and innovation in end-use industries are the major drivers and opportunities for this market.
What are the various strategies key players are focusing within the flavors & fragrances market?
New product launches, expansions, and joint ventures are some of the strategies adopted by key players to expand their global presence.
What is the CAGR of the flavors & fragrances market?
The market is projected to grow at a CAGR of 3.7% in terms of value during the forecast period.
What are the major factors restraining flavors & fragrances market growth during the forecast period?
Compliance with quality and regulatory standards, fluctuating raw material prices are expected to restrict the market demand.


Personalize This Research

  • Triangulate with your Own Data
  • Get Data as per your Format and Definition
  • Gain a Deeper Dive on a Specific Application, Geography, Customer or Competitor
  • Any level of Personalization
Request A Free Customisation

Let Us Help You

  • What are the Known and Unknown Adjacencies Impacting the Flavors & Fragrances Market
  • What will your New Revenue Sources be?
  • Who will be your Top Customer; what will make them switch?
  • Defend your Market Share or Win Competitors
  • Get a Scorecard for Target Partners
Customized Workshop Request

Table of Contents

Exclusive indicates content/data unique to MarketsandMarkets and not available with any competitors.

TITLE
PAGE NO
INTRODUCTION
24
RESEARCH METHODOLOGY
30
EXECUTIVE SUMMARY
40
PREMIUM INSIGHTS
43
MARKET OVERVIEW
46
  • 5.1 INTRODUCTION
  • 5.2 MARKET DYNAMICS
    DRIVERS
    - Increasing demand for natural flavors and fragrances
    - Increasing consumer preference for convenience food
    - Rising demand for natural products
    - Rising demand for consumer products
    RESTRAINTS
    - Compliance with quality and regulatory standards
    - Fluctuating raw material prices
    OPPORTUNITIES
    - Digitalization of retail industry
    - Innovation in end-use industries
    CHALLENGES
    - Limited progression in value chain among developing economies
    - Lack of cold chain infrastructure in developing economies
  • 5.3 PORTER’S FIVE FORCES ANALYSIS
    THREAT OF NEW ENTRANTS
    THREAT OF SUBSTITUTES
    BARGAINING POWER OF SUPPLIERS
    BARGAINING POWER OF BUYERS
    INTENSITY OF COMPETITIVE RIVALRY
  • 5.4 MACROECONOMIC INDICATORS
    GDP TRENDS AND FORECAST OF MAJOR ECONOMIES
INDUSTRY TRENDS
53
  • 6.1 SUPPLY CHAIN ANALYSIS
    RAW MATERIALS
    MANUFACTURING
    DISTRIBUTION NETWORK
    END-USE INDUSTRIES
  • 6.2 KEY STAKEHOLDERS AND BUYING CRITERIA
    KEY STAKEHOLDERS IN BUYING PROCESS
    BUYING CRITERIA
  • 6.3 PRICING ANALYSIS
    INDICATIVE AVERAGE SELLING PRICE TREND OF FLAVORS & FRAGRANCES, BY REGION
  • 6.4 TRENDS/DISRUPTIONS IMPACTING CUSTOMERS’ BUSINESSES
  • 6.5 ECOSYSTEM ANALYSIS/MARKET MAP
  • 6.6 CASE STUDIES
    GIVAUDAN’S STRATEGIC MOVE: CAPTURING NATURAL INGREDIENT TREND THROUGH NATUREX ACQUISITION
    INNOVATING WITH MICROBES: IFF’S JOURNEY INTO PROBIOTIC FLAVORS & FRAGRANCES
    SENSIENT TECHNOLOGIES CORPORATION: SAFEGUARDING CONSUMER TRUST THROUGH CRISIS MANAGEMENT AND CONTINUOUS IMPROVEMENT
  • 6.7 TECHNOLOGY ANALYSIS
    KEY TECHNOLOGIES
    - Supercritical fluid extraction
    - Ultrasonic extraction
    COMPLEMENTARY TECHNOLOGIES
    - Artificial intelligence-powered fragrance creation
  • 6.8 TRADE ANALYSIS
    IMPORT SCENARIO
    - Flavors
    - Fragrances
    EXPORT SCENARIO
    - Flavors
    - Fragrances
  • 6.9 REGULATORY LANDSCAPE
    REGULATORY BODIES, GOVERNMENT AGENCIES, AND OTHER ORGANIZATIONS
  • 6.10 KEY CONFERENCES AND EVENTS IN 2024–2025
  • 6.11 INVESTMENT AND FUNDING SCENARIO
  • 6.12 PATENT ANALYSIS
    APPROACH
    DOCUMENT TYPES
    TOP APPLICANTS
    JURISDICTION ANALYSIS
FLAVORS & FRAGRANCES MARKET, BY INGREDIENT TYPE
76
  • 7.1 INTRODUCTION
  • 7.2 SYNTHETIC
    COST-EFFECTIVENESS OF SYNTHETIC INGREDIENTS TO DRIVE ADOPTION
  • 7.3 NATURAL
    CONSUMER PREFERENCES AND INCREASED HEALTH CONSCIOUSNESS TO DRIVE MARKET
FLAVORS & FRAGRANCES MARKET, BY END-USE INDUSTRY
80
  • 8.1 INTRODUCTION
  • 8.2 FLAVORS
    BEVERAGES
    - Consumer preferences to drive demand
    BAKERY
    - Extensive product range to drive market
    SAVORY & SNACKS
    - Rising demand for plant-based products to support market growth
    DAIRY PRODUCTS
    - Health & wellness trends to boost market
    CONFECTIONERY
    - Continuous innovation and fast-changing consumer demand to drive market
    OTHER END-USE INDUSTRIES
  • 8.3 FRAGRANCES
    CONSUMER PRODUCTS
    - Economic factors to influence market
    FINE FRAGRANCES
    - Artistry and creativity in perfumes to drive market
FLAVORS & FRAGRANCES MARKET, BY REGION
93
  • 9.1 INTRODUCTION
  • 9.2 ASIA PACIFIC
    RECESSION IMPACT
    CHINA
    - Rapid industrialization to drive market
    JAPAN
    - Growing beverages industry to drive demand
    INDIA
    - Rising demand from end-use industries to propel market
    SOUTH KOREA
    - Changing consumer lifestyle to drive demand for flavors & fragrances
    INDONESIA
    - Expanding urban population to support market growth
    THAILAND
    - Rich culinary heritage to support market growth
    AUSTRALIA
    - Increasing health consciousness to drive demand
    VIETNAM
    - Growing food processing sector to drive market
    PHILIPPINES
    - Rising demand for Western food products to drive market
    BANGLADESH
    - Growth in food processing sector to drive market
    PAKISTAN
    - Rising middle-class population and preference for higher quality and safer food to drive market
    TAIWAN
    - Rise in brand consciousness to drive demand
    MALAYSIA
    - Growing demand for convenience foods to drive market
    SINGAPORE
    - Increasing demand for natural and organic ingredients to drive market
    MYANMAR
    - Increasing urbanization to drive demand
  • 9.3 EUROPE
    RECESSION IMPACT
    GERMANY
    - Robust economy to drive market
    FRANCE
    - Increasing production concentration and exports to boost market
    UK
    - Adoption of healthier lifestyles to support market
    RUSSIA
    - Natural resources to support market
    ITALY
    - Marketing initiatives by government to drive market
    SPAIN
    - Demand for healthy and natural ingredients-based foods to drive market
  • 9.4 NORTH AMERICA
    RECESSION IMPACT
    US
    - Largest consumer of flavors & fragrances in North America
    CANADA
    - Increasing health awareness and demand for natural-based flavors and fragrances to drive market
    MEXICO
    - Growing food & beverage industry to drive market
  • 9.5 MIDDLE EAST & AFRICA
    RECESSION IMPACT
    GCC COUNTRIES
    - Saudi Arabia
    IRAN
    - Growing urban middle-class population and changing lifestyles to positively impact market growth
    TURKEY
    - Rising disposable income to support growth
    SOUTH AFRICA
    - Beverages segment to boost growth
  • 9.6 SOUTH AMERICA
    RECESSION IMPACT
    BRAZIL
    - Rising demand for dairy products and premium fragrances to drive market
    ARGENTINA
    - Growing consumer demand for personal care and household products to drive market
COMPETITIVE LANDSCAPE
169
  • 10.1 INTRODUCTION
  • 10.2 STRATEGIES ADOPTED BY KEY PLAYERS/RIGHT TO WIN
    OVERVIEW OF STRATEGIES ADOPTED BY KEY FLAVOR & FRAGRANCE MANUFACTURERS
  • 10.3 MARKET SHARE ANALYSIS
    RANKING OF KEY MARKET PLAYERS, 2023
  • 10.4 REVENUE ANALYSIS
  • 10.5 COMPANY EVALUATION MATRIX: KEY PLAYERS, 2023
    STARS
    EMERGING LEADERS
    PERVASIVE PLAYERS
    PARTICIPANTS
    COMPANY FOOTPRINT: KEY PLAYERS, 2023
    - Company footprint
    - Region footprint
    - Ingredient type footprint
    - End-use industry footprint
  • 10.6 COMPANY EVALUATION MATRIX: STARTUPS/SMES, 2023
    PROGRESSIVE COMPANIES
    RESPONSIVE COMPANIES
    DYNAMIC COMPANIES
    STARTING BLOCKS
    COMPETITIVE BENCHMARKING: STARTUPS/SMES, 2023
    - Detailed list of key startups/SMEs
    - Competitive benchmarking of key startups/SMEs
  • 10.7 BRAND/PRODUCT COMPARISON ANALYSIS
  • 10.8 COMPANY VALUATION AND FINANCIAL METRICS
  • 10.9 COMPETITIVE SCENARIO
    PRODUCT LAUNCHES
    DEALS
    EXPANSIONS
COMPANY PROFILES
190
  • 11.1 KEY PLAYERS
    GIVAUDAN SA
    - Business overview
    - Products offered
    - Recent developments
    - MnM view
    INTERNATIONAL FLAVORS & FRAGRANCES INC.
    - Business overview
    - Products offered
    - Recent developments
    - MnM view
    DSM-FIRMENICH AG
    - Business overview
    - Products offered
    - Recent developments
    - MnM View
    SYMRISE AG
    - Business overview
    - Products offered
    - Recent developments
    - MnM view
    TAKASAGO INTERNATIONAL CORPORATION
    - Business overview
    - Products offered
    - Recent developments
    - MnM View
    SENSIENT TECHNOLOGIES CORPORATION
    - Business overview
    - Products offered
    - Recent developments
    ADM
    - Business overview
    - Products offered
    MANE
    - Business overview
    - Products offered
    ROBERTET GROUP
    - Business overview
    - Products offered
    T. HASEGAWA CO., LTD.
    - Business overview
    - Products offered
    - Recent developments
    BELL FLAVORS & FRAGRANCES
    - Business overview
    - Products offered
    - Recent developments
  • 11.2 OTHER PLAYERS
    KERRY GROUP
    OGAWA & CO., LTD.
    HUABAO INTERNATIONAL HOLDINGS LTD.
    BIOLANDES SAS
    FLAVEX NATUREXTRAKTE GMBH
    SYNTHITE INDUSTRIES LTD.
    UNGERER & COMPANY
    AKAY NATURAL INGREDIENTS PRIVATE LIMITED
    SOLVAY SA
    OZONE NATURALS
    BASF SE
    AROMATECH SAS
    BEDOUKIAN RESEARCH INC.
    ALPHA AROMATICS
ADJACENT & RELATED MARKETS
234
  • 12.1 INTRODUCTION
  • 12.2 LIMITATIONS
  • 12.3 AROMA INGREDIENTS MARKET
    MARKET DEFINITION
    MARKET OVERVIEW
  • 12.4 AROMA INGREDIENTS MARKET, BY REGION
    EUROPE
    ASIA PACIFIC
    NORTH AMERICA
    MIDDLE EAST & AFRICA
    SOUTH AMERICA
APPENDIX
239
  • 13.1 DISCUSSION GUIDE
  • 13.2 KNOWLEDGESTORE: MARKETSANDMARKETS’ SUBSCRIPTION PORTAL
  • 13.3 CUSTOMIZATION OPTIONS
  • 13.4 RELATED REPORTS
  • 13.5 AUTHOR DETAILS
LIST OF TABLES
 
  • TABLE 1 FLAVORS & FRAGRANCES MARKET: PORTER’S FIVE FORCES ANALYSIS
  • TABLE 2 GDP TRENDS AND FORECAST, BY MAJOR ECONOMY, 2021–2029 (USD BILLION)
  • TABLE 3 INFLUENCE OF STAKEHOLDERS ON BUYING PROCESS IN TOP-THREE END-USE INDUSTRIES OF FLAVORS & FRAGRANCES (%)
  • TABLE 4 KEY BUYING CRITERIA FOR TOP THREE END-USE INDUSTRIES OF FLAVORS & FRAGRANCES
  • TABLE 5 INDICATIVE AVERAGE SELLING PRICE TREND OF FLAVORS & FRAGRANCES, BY REGION (USD/KG)
  • TABLE 6 FLAVORS & FRAGRANCES MARKET: ROLE IN ECOSYSTEM
  • TABLE 7 IMPORT OF FLAVORS, BY REGION, 2017–2022 (USD MILLION)
  • TABLE 8 IMPORT OF FRAGRANCES, BY REGION, 2017–2022 (USD MILLION)
  • TABLE 9 EXPORT OF FLAVORS, BY REGION, 2017–2022 (USD MILLION)
  • TABLE 10 EXPORT OF FRAGRANCES, BY REGION, 2017–2022 (USD MILLION)
  • TABLE 11 NORTH AMERICA: REGULATIONS RELATED TO FLAVORS & FRAGRANCES
  • TABLE 12 EUROPE: REGULATIONS RELATED TO FLAVORS & FRAGRANCES
  • TABLE 13 ASIA PACIFIC: REGULATIONS RELATED TO FLAVORS & FRAGRANCES
  • TABLE 14 FLAVORS & FRAGRANCES: REGULATORY BODIES, GOVERNMENT AGENCIES, AND OTHER ORGANIZATIONS
  • TABLE 15 FLAVORS & FRAGRANCES MARKET: KEY CONFERENCES AND EVENTS
  • TABLE 16 PATENT STATUS: PATENT APPLICATIONS, LIMITED PATENTS, AND GRANTED PATENTS
  • TABLE 17 LIST OF MAJOR PATENTS OF FLAVORS & FRAGRANCES
  • TABLE 18 PATENTS BY NESTEC, INC.
  • TABLE 19 FLAVORS & FRAGRANCES MARKET, BY INGREDIENT TYPE, 2018–2022 (USD MILLION)
  • TABLE 20 FLAVORS & FRAGRANCES MARKET, BY INGREDIENT TYPE, 2023–2029 (USD MILLION)
  • TABLE 21 SYNTHETIC INGREDIENTS: FLAVORS & FRAGRANCES MARKET, BY TYPE, 2018–2022 (USD MILLION)
  • TABLE 22 SYNTHETIC INGREDIENTS: FLAVORS & FRAGRANCES MARKET, BY TYPE, 2023–2029 (USD MILLION)
  • TABLE 23 NATURAL INGREDIENTS: FLAVORS & FRAGRANCES MARKET, BY TYPE, 2018–2022 (USD MILLION)
  • TABLE 24 NATURAL INGREDIENTS: FLAVORS & FRAGRANCES MARKET, BY TYPE, 2023–2029 (USD MILLION)
  • TABLE 25 FLAVORS MARKET, BY END-USE INDUSTRY, 2018–2022 (USD MILLION)
  • TABLE 26 FLAVORS MARKET, BY END-USE INDUSTRY, 2023–2029 (USD MILLION)
  • TABLE 27 FLAVORS MARKET IN BEVERAGES, BY REGION, 2018–2022 (USD MILLION)
  • TABLE 28 FLAVORS MARKET IN BEVERAGES, BY REGION, 2023–2029 (USD MILLION)
  • TABLE 29 FLAVORS MARKET IN BAKERY, BY REGION, 2018–2022 (USD MILLION)
  • TABLE 30 FLAVORS MARKET IN BAKERY, BY REGION, 2023–2029 (USD MILLION)
  • TABLE 31 FLAVORS MARKET IN SAVORY & SNACKS, BY REGION, 2018–2022 (USD MILLION)
  • TABLE 32 FLAVORS MARKET IN SAVORY & SNACKS, BY REGION, 2023–2029 (USD MILLION)
  • TABLE 33 FLAVORS MARKET IN DAIRY PRODUCTS, BY REGION, 2018–2022 (USD MILLION)
  • TABLE 34 FLAVORS MARKET IN DAIRY PRODUCTS, BY REGION, 2023–2029 (USD MILLION)
  • TABLE 35 FLAVORS MARKET IN CONFECTIONERY, BY REGION, 2018–2022 (USD MILLION)
  • TABLE 36 FLAVORS MARKET IN CONFECTIONERY, BY REGION, 2023–2029 (USD MILLION)
  • TABLE 37 FLAVORS MARKET IN OTHER END-USE INDUSTRIES, BY REGION, 2018–2022 (USD MILLION)
  • TABLE 38 FLAVORS MARKET IN OTHER END-USE INDUSTRIES, BY REGION, 2023–2029 (USD MILLION)
  • TABLE 39 FRAGRANCES MARKET, BY END-USE INDUSTRY, 2018–2022 (USD MILLION)
  • TABLE 40 FRAGRANCES MARKET, BY END-USE INDUSTRY, 2023–2029 (USD MILLION)
  • TABLE 41 FRAGRANCES MARKET IN CONSUMER PRODUCTS, BY REGION, 2018–2022 (USD MILLION)
  • TABLE 42 FRAGRANCES MARKET IN CONSUMER PRODUCTS, BY REGION, 2023–2029 (USD MILLION)
  • TABLE 43 FRAGRANCES MARKET IN FINE FRAGRANCES, BY REGION, 2018–2022 (USD MILLION)
  • TABLE 44 FRAGRANCES MARKET IN FINE FRAGRANCES, BY REGION, 2023–2029 (USD MILLION)
  • TABLE 45 FLAVORS & FRAGRANCES MARKET, BY REGION, 2018–2022 (USD MILLION)
  • TABLE 46 FLAVORS & FRAGRANCES MARKET, BY REGION, 2023–2029 (USD MILLION)
  • TABLE 47 FLAVORS MARKET, BY REGION, 2018–2022 (USD MILLION)
  • TABLE 48 FLAVORS MARKET, BY REGION, 2023–2029 (USD MILLION)
  • TABLE 49 FRAGRANCES MARKET, BY REGION, 2018–2022 (USD MILLION)
  • TABLE 50 FRAGRANCES MARKET, BY REGION, 2023–2029 (USD MILLION)
  • TABLE 51 ASIA PACIFIC: FLAVORS MARKET, BY END-USE INDUSTRY, 2018–2022 (USD MILLION)
  • TABLE 52 ASIA PACIFIC: FLAVORS MARKET, BY END-USE INDUSTRY, 2023–2029 (USD MILLION)
  • TABLE 53 ASIA PACIFIC: FRAGRANCES MARKET, BY END-USE INDUSTRY, 2018–2022 (USD MILLION)
  • TABLE 54 ASIA PACIFIC: FRAGRANCES MARKET, BY END-USE INDUSTRY, 2023–2029 (USD MILLION)
  • TABLE 55 ASIA PACIFIC: FLAVORS MARKET, BY COUNTRY, 2018–2022 (USD MILLION)
  • TABLE 56 ASIA PACIFIC: FLAVORS MARKET, BY COUNTRY, 2023–2029 (USD MILLION)
  • TABLE 57 ASIA PACIFIC: FRAGRANCES MARKET, BY COUNTRY, 2018–2022 (USD MILLION)
  • TABLE 58 ASIA PACIFIC: FRAGRANCES MARKET, BY COUNTRY, 2023–2029 (USD MILLION)
  • TABLE 59 CHINA: FLAVORS MARKET, BY END-USE INDUSTRY, 2018–2022 (USD MILLION)
  • TABLE 60 CHINA: FLAVORS MARKET, BY END-USE INDUSTRY, 2023–2029 (USD MILLION)
  • TABLE 61 CHINA: FRAGRANCES MARKET, BY END-USE INDUSTRY, 2018–2022 (USD MILLION)
  • TABLE 62 CHINA: FRAGRANCES MARKET, BY END-USE INDUSTRY, 2023–2029 (USD MILLION)
  • TABLE 63 JAPAN: FLAVORS MARKET, BY END-USE INDUSTRY, 2018–2022 (USD MILLION)
  • TABLE 64 JAPAN: FLAVORS MARKET, BY END-USE INDUSTRY, 2023–2029 (USD MILLION)
  • TABLE 65 JAPAN: FRAGRANCES MARKET, BY END-USE INDUSTRY, 2018–2022 (USD MILLION)
  • TABLE 66 JAPAN: FRAGRANCES MARKET, BY END-USE INDUSTRY, 2023–2029 (USD MILLION)
  • TABLE 67 INDIA: FLAVORS MARKET, BY END-USE INDUSTRY, 2018–2022 (USD MILLION)
  • TABLE 68 INDIA: FLAVORS MARKET, BY END-USE INDUSTRY, 2023–2029 (USD MILLION)
  • TABLE 69 INDIA: FRAGRANCES MARKET, BY END-USE INDUSTRY, 2018–2022 (USD MILLION)
  • TABLE 70 INDIA: FRAGRANCES MARKET, BY END-USE INDUSTRY, 2023–2029 (USD MILLION)
  • TABLE 71 SOUTH KOREA: FLAVORS MARKET, BY END-USE INDUSTRY, 2018–2022 (USD MILLION)
  • TABLE 72 SOUTH KOREA: FLAVORS MARKET, BY END-USE INDUSTRY, 2023–2029 (USD MILLION)
  • TABLE 73 SOUTH KOREA: FRAGRANCES MARKET, BY END-USE INDUSTRY, 2018–2022 (USD MILLION)
  • TABLE 74 SOUTH KOREA: FRAGRANCES MARKET, BY END-USE INDUSTRY, 2023–2029 (USD MILLION)
  • TABLE 75 INDONESIA: FLAVORS MARKET, BY END-USE INDUSTRY, 2018–2022 (USD MILLION)
  • TABLE 76 INDONESIA: FLAVORS MARKET, BY END-USE INDUSTRY, 2023–2029 (USD MILLION)
  • TABLE 77 INDONESIA: FRAGRANCES MARKET, BY END-USE INDUSTRY, 2018–2022 (USD MILLION)
  • TABLE 78 INDONESIA: FRAGRANCES MARKET, BY END-USE INDUSTRY, 2023–2029 (USD MILLION)
  • TABLE 79 THAILAND: FLAVORS MARKET, BY END-USE INDUSTRY, 2018–2022 (USD MILLION)
  • TABLE 80 THAILAND: FLAVORS MARKET, BY END-USE INDUSTRY, 2023–2029 (USD MILLION)
  • TABLE 81 THAILAND: FRAGRANCES MARKET, BY END-USE INDUSTRY, 2018–2022 (USD MILLION)
  • TABLE 82 THAILAND: FRAGRANCES MARKET, BY END-USE INDUSTRY, 2023–2029 (USD MILLION)
  • TABLE 83 AUSTRALIA: FLAVORS MARKET, BY END-USE INDUSTRY, 2018–2022 (USD MILLION)
  • TABLE 84 AUSTRALIA: FLAVORS MARKET, BY END-USE INDUSTRY, 2023–2029 (USD MILLION)
  • TABLE 85 AUSTRALIA: FRAGRANCES MARKET, BY END-USE INDUSTRY, 2018–2022 (USD MILLION)
  • TABLE 86 AUSTRALIA: FRAGRANCES MARKET, BY END-USE INDUSTRY, 2023–2029 (USD MILLION)
  • TABLE 87 VIETNAM: FLAVORS MARKET, BY END-USE INDUSTRY, 2018–2022 (USD MILLION)
  • TABLE 88 VIETNAM: FLAVORS MARKET, BY END-USE INDUSTRY, 2023–2029 (USD MILLION)
  • TABLE 89 VIETNAM: FRAGRANCES MARKET, BY END-USE INDUSTRY, 2018–2022 (USD MILLION)
  • TABLE 90 VIETNAM: FRAGRANCES MARKET, BY END-USE INDUSTRY, 2023–2029 (USD MILLION)
  • TABLE 91 PHILIPPINES: FLAVORS MARKET, BY END-USE INDUSTRY, 2018–2022 (USD MILLION)
  • TABLE 92 PHILIPPINES: FLAVORS MARKET, BY END-USE INDUSTRY, 2023–2029 (USD MILLION)
  • TABLE 93 PHILIPPINES: FRAGRANCES MARKET, BY END-USE INDUSTRY, 2018–2022 (USD MILLION)
  • TABLE 94 PHILIPPINES: FRAGRANCES MARKET, BY END-USE INDUSTRY, 2023–2029 (USD MILLION)
  • TABLE 95 BANGLADESH: FLAVORS MARKET, BY END-USE INDUSTRY, 2018–2022 (USD MILLION)
  • TABLE 96 BANGLADESH: FLAVORS MARKET, BY END-USE INDUSTRY, 2023–2029 (USD MILLION)
  • TABLE 97 BANGLADESH: FRAGRANCES MARKET, BY END-USE INDUSTRY, 2018–2022 (USD MILLION)
  • TABLE 98 BANGLADESH: FRAGRANCES MARKET, BY END-USE INDUSTRY, 2023–2029 (USD MILLION)
  • TABLE 99 PAKISTAN: FLAVORS MARKET, BY END-USE INDUSTRY, 2018–2022 (USD MILLION)
  • TABLE 100 PAKISTAN: FLAVORS MARKET, BY END-USE INDUSTRY, 2023–2029 (USD MILLION)
  • TABLE 101 PAKISTAN: FRAGRANCES MARKET, BY END-USE INDUSTRY, 2018–2022 (USD MILLION)
  • TABLE 102 PAKISTAN: FRAGRANCES MARKET, BY END-USE INDUSTRY, 2023–2029 (USD MILLION)
  • TABLE 103 TAIWAN: FLAVORS MARKET, BY END-USE INDUSTRY, 2018–2022 (USD MILLION)
  • TABLE 104 TAIWAN: FLAVORS MARKET, BY END-USE INDUSTRY, 2023–2029 (USD MILLION)
  • TABLE 105 TAIWAN: FRAGRANCES MARKET, BY END-USE INDUSTRY, 2018–2022 (USD MILLION)
  • TABLE 106 TAIWAN: FRAGRANCES MARKET, BY END-USE INDUSTRY, 2023–2029 (USD MILLION)
  • TABLE 107 MALAYSIA: FLAVORS MARKET, BY END-USE INDUSTRY, 2018–2022 (USD MILLION)
  • TABLE 108 MALAYSIA: FLAVORS MARKET, BY END-USE INDUSTRY, 2023–2029 (USD MILLION)
  • TABLE 109 MALAYSIA: FRAGRANCES MARKET, BY END-USE INDUSTRY, 2018–2022 (USD MILLION)
  • TABLE 110 MALAYSIA: FRAGRANCES MARKET, BY END-USE INDUSTRY, 2023–2029 (USD MILLION)
  • TABLE 111 SINGAPORE: FLAVORS MARKET, BY END-USE INDUSTRY, 2018–2022 (USD MILLION)
  • TABLE 112 SINGAPORE: FLAVORS MARKET, BY END-USE INDUSTRY, 2023–2029 (USD MILLION)
  • TABLE 113 SINGAPORE: FRAGRANCES MARKET, BY END-USE INDUSTRY, 2018–2022 (USD MILLION)
  • TABLE 114 SINGAPORE: FRAGRANCES MARKET, BY END-USE INDUSTRY, 2023–2029 (USD MILLION)
  • TABLE 115 MYANMAR: FLAVORS MARKET, BY END-USE INDUSTRY, 2018–2022 (USD MILLION)
  • TABLE 116 MYANMAR: FLAVORS MARKET, BY END-USE INDUSTRY, 2023–2029 (USD MILLION)
  • TABLE 117 MYANMAR: FRAGRANCES MARKET, BY END-USE INDUSTRY, 2018–2022 (USD MILLION)
  • TABLE 118 MYANMAR: FRAGRANCES MARKET, BY END-USE INDUSTRY, 2023–2029 (USD MILLION)
  • TABLE 119 EUROPE: FLAVORS MARKET, BY END-USE INDUSTRY, 2018–2022 (USD MILLION)
  • TABLE 120 EUROPE: FLAVORS MARKET, BY END-USE INDUSTRY, 2023–2029 (USD MILLION)
  • TABLE 121 EUROPE: FRAGRANCES MARKET, BY END-USE INDUSTRY, 2018–2022 (USD MILLION)
  • TABLE 122 EUROPE: FRAGRANCES MARKET, BY END-USE INDUSTRY, 2023–2029 (USD MILLION)
  • TABLE 123 EUROPE: FLAVORS MARKET, BY COUNTRY, 2018–2022 (USD MILLION)
  • TABLE 124 EUROPE: FLAVORS MARKET, BY COUNTRY, 2023–2029 (USD MILLION)
  • TABLE 125 EUROPE: FRAGRANCES MARKET, BY COUNTRY, 2018–2022 (USD MILLION)
  • TABLE 126 EUROPE: FRAGRANCES MARKET, BY COUNTRY, 2023–2029 (USD MILLION)
  • TABLE 127 GERMANY: FLAVORS MARKET, BY END-USE INDUSTRY, 2018–2022 (USD MILLION)
  • TABLE 128 GERMANY: FLAVORS MARKET, BY END-USE INDUSTRY, 2023–2029 (USD MILLION)
  • TABLE 129 GERMANY: FRAGRANCES MARKET, BY END-USE INDUSTRY, 2018–2022 (USD MILLION)
  • TABLE 130 GERMANY: FRAGRANCES MARKET, BY END-USE INDUSTRY, 2023–2029 (USD MILLION)
  • TABLE 131 FRANCE: FLAVORS MARKET, BY END-USE INDUSTRY, 2018–2022 (USD MILLION)
  • TABLE 132 FRANCE: FLAVORS MARKET, BY END-USE INDUSTRY, 2023–2029 (USD MILLION)
  • TABLE 133 FRANCE: FRAGRANCES MARKET, BY END-USE INDUSTRY, 2018–2022 (USD MILLION)
  • TABLE 134 FRANCE: FRAGRANCES MARKET, BY END-USE INDUSTRY, 2023–2029 (USD MILLION)
  • TABLE 135 UK: FLAVORS MARKET, BY END-USE INDUSTRY, 2018–2022 (USD MILLION)
  • TABLE 136 UK: FLAVORS MARKET, BY END-USE INDUSTRY, 2023–2029 (USD MILLION)
  • TABLE 137 UK: FRAGRANCES MARKET, BY END-USE INDUSTRY, 2018–2022 (USD MILLION)
  • TABLE 138 UK: FRAGRANCES MARKET, BY END-USE INDUSTRY, 2023–2029 (USD MILLION)
  • TABLE 139 RUSSIA: FLAVORS MARKET, BY END-USE INDUSTRY, 2018–2022 (USD MILLION)
  • TABLE 140 RUSSIA: FLAVORS MARKET, BY END-USE INDUSTRY, 2023–2029 (USD MILLION)
  • TABLE 141 RUSSIA: FRAGRANCES MARKET, BY END-USE INDUSTRY, 2018–2022 (USD MILLION)
  • TABLE 142 RUSSIA: FRAGRANCES MARKET, BY END-USE INDUSTRY, 2023–2029 (USD MILLION)
  • TABLE 143 ITALY: FLAVORS MARKET, BY END-USE INDUSTRY, 2018–2022 (USD MILLION)
  • TABLE 144 ITALY: FLAVORS MARKET, BY END-USE INDUSTRY, 2023–2029 (USD MILLION)
  • TABLE 145 ITALY: FRAGRANCES MARKET, BY END-USE INDUSTRY, 2018–2022 (USD MILLION)
  • TABLE 146 ITALY: FRAGRANCES MARKET, BY END-USE INDUSTRY, 2023–2029 (USD MILLION)
  • TABLE 147 SPAIN: FLAVORS MARKET, BY END-USE INDUSTRY, 2018–2022 (USD MILLION)
  • TABLE 148 SPAIN: FLAVORS MARKET, BY END-USE INDUSTRY, 2023–2029 (USD MILLION)
  • TABLE 149 SPAIN: FRAGRANCES MARKET, BY END-USE INDUSTRY, 2018–2022 (USD MILLION)
  • TABLE 150 SPAIN: FRAGRANCES MARKET, BY END-USE INDUSTRY, 2023–2029 (USD MILLION)
  • TABLE 151 NORTH AMERICA: FLAVORS MARKET, BY END-USE INDUSTRY, 2018–2022 (USD MILLION)
  • TABLE 152 NORTH AMERICA: FLAVORS MARKET, BY END-USE INDUSTRY, 2023–2029 (USD MILLION)
  • TABLE 153 NORTH AMERICA: FRAGRANCES MARKET, BY END-USE INDUSTRY, 2018–2022 (USD MILLION)
  • TABLE 154 NORTH AMERICA: FRAGRANCES MARKET, BY END-USE INDUSTRY, 2023–2029 (USD MILLION)
  • TABLE 155 NORTH AMERICA: FLAVORS MARKET, BY COUNTRY, 2018–2022 (USD MILLION)
  • TABLE 156 NORTH AMERICA: FLAVORS MARKET, BY COUNTRY, 2023–2029 (USD MILLION)
  • TABLE 157 NORTH AMERICA: FRAGRANCES MARKET, BY COUNTRY, 2018–2022 (USD MILLION)
  • TABLE 158 NORTH AMERICA: FRAGRANCES MARKET, BY COUNTRY, 2023–2029 (USD MILLION)
  • TABLE 159 US: FLAVORS MARKET, BY END-USE INDUSTRY, 2018–2022 (USD MILLION)
  • TABLE 160 US: FLAVORS MARKET, BY END-USE INDUSTRY, 2023–2029 (USD MILLION)
  • TABLE 161 US: FRAGRANCES MARKET, BY END-USE INDUSTRY, 2018–2022 (USD MILLION)
  • TABLE 162 US: FRAGRANCES MARKET, BY END-USE INDUSTRY, 2023–2029 (USD MILLION)
  • TABLE 163 CANADA: FLAVORS MARKET, BY END-USE INDUSTRY, 2018–2022 (USD MILLION)
  • TABLE 164 CANADA: FLAVORS MARKET, BY END-USE INDUSTRY, 2023–2029 (USD MILLION)
  • TABLE 165 CANADA: FRAGRANCES MARKET, BY END-USE INDUSTRY, 2018–2022 (USD MILLION)
  • TABLE 166 CANADA: FRAGRANCES MARKET, BY END-USE INDUSTRY, 2023–2029 (USD MILLION)
  • TABLE 167 MEXICO: FLAVORS MARKET, BY END-USE INDUSTRY, 2018–2022 (USD MILLION)
  • TABLE 168 MEXICO: FLAVORS MARKET, BY END-USE INDUSTRY, 2023–2029 (USD MILLION)
  • TABLE 169 MEXICO: FRAGRANCES MARKET, BY END-USE INDUSTRY, 2018–2022 (USD MILLION)
  • TABLE 170 MEXICO: FRAGRANCES MARKET, BY END-USE INDUSTRY, 2023–2029 (USD MILLION)
  • TABLE 171 MIDDLE EAST & AFRICA: FLAVORS MARKET, BY END-USE INDUSTRY, 2018–2022 (USD MILLION)
  • TABLE 172 MIDDLE EAST & AFRICA: FLAVORS MARKET, BY END-USE INDUSTRY, 2023–2029 (USD MILLION)
  • TABLE 173 MIDDLE EAST & AFRICA: FRAGRANCES MARKET, BY END-USE INDUSTRY, 2018–2022 (USD MILLION)
  • TABLE 174 MIDDLE EAST & AFRICA: FRAGRANCES MARKET, BY END-USE INDUSTRY, 2023–2029 (USD MILLION)
  • TABLE 175 MIDDLE EAST & AFRICA: FLAVORS MARKET, BY COUNTRY, 2018–2022 (USD MILLION)
  • TABLE 176 MIDDLE EAST & AFRICA: FLAVORS MARKET, BY COUNTRY, 2023–2029 (USD MILLION)
  • TABLE 177 MIDDLE EAST & AFRICA: FRAGRANCES MARKET, BY COUNTRY, 2018–2022 (USD MILLION)
  • TABLE 178 MIDDLE EAST & AFRICA: FRAGRANCES MARKET, BY COUNTRY, 2023–2029 (USD MILLION)
  • TABLE 179 SAUDI ARABIA: FLAVORS MARKET, BY END-USE INDUSTRY, 2018–2022 (USD MILLION)
  • TABLE 180 SAUDI ARABIA: FLAVORS MARKET, BY END-USE INDUSTRY, 2023–2029 (USD MILLION)
  • TABLE 181 SAUDI ARABIA: FRAGRANCES MARKET, BY END-USE INDUSTRY, 2018–2022 (USD MILLION)
  • TABLE 182 SAUDI ARABIA: FRAGRANCES MARKET, BY END-USE INDUSTRY, 2023–2029 (USD MILLION)
  • TABLE 183 IRAN: FLAVORS MARKET, BY END-USE INDUSTRY, 2018–2022 (USD MILLION)
  • TABLE 184 IRAN: FLAVORS MARKET, BY END-USE INDUSTRY, 2023–2029 (USD MILLION)
  • TABLE 185 IRAN: FRAGRANCES MARKET, BY END-USE INDUSTRY, 2018–2022 (USD MILLION)
  • TABLE 186 IRAN: FRAGRANCES MARKET, BY END-USE INDUSTRY, 2023–2029 (USD MILLION)
  • TABLE 187 TURKEY: FLAVORS MARKET, BY END-USE INDUSTRY, 2018–2022 (USD MILLION)
  • TABLE 188 TURKEY: FLAVORS MARKET, BY END-USE INDUSTRY, 2023–2029 (USD MILLION)
  • TABLE 189 TURKEY: FRAGRANCES MARKET, BY END-USE INDUSTRY, 2018–2022 (USD MILLION)
  • TABLE 190 TURKEY: FRAGRANCES MARKET, BY END-USE INDUSTRY, 2023–2029 (USD MILLION)
  • TABLE 191 SOUTH AFRICA: FLAVORS MARKET, BY END-USE INDUSTRY, 2018–2022 (USD MILLION)
  • TABLE 192 SOUTH AFRICA: FLAVORS MARKET, BY END-USE INDUSTRY, 2023–2029 (USD MILLION)
  • TABLE 193 SOUTH AFRICA: FRAGRANCES MARKET, BY END-USE INDUSTRY, 2018–2022 (USD MILLION)
  • TABLE 194 SOUTH AFRICA: FRAGRANCES MARKET, BY END-USE INDUSTRY, 2023–2029 (USD MILLION)
  • TABLE 195 SOUTH AMERICA: FLAVORS MARKET, BY END-USE INDUSTRY, 2018–2022 (USD MILLION)
  • TABLE 196 SOUTH AMERICA: FLAVORS MARKET, BY END-USE INDUSTRY, 2023–2029 (USD MILLION)
  • TABLE 197 SOUTH AMERICA: FRAGRANCES MARKET, BY END-USE INDUSTRY, 2018–2022 (USD MILLION)
  • TABLE 198 SOUTH AMERICA: FRAGRANCES MARKET, BY END-USE INDUSTRY, 2023–2029 (USD MILLION)
  • TABLE 199 SOUTH AMERICA: FLAVORS MARKET, BY COUNTRY, 2018–2022 (USD MILLION)
  • TABLE 200 SOUTH AMERICA: FLAVORS MARKET, BY COUNTRY, 2023–2029 (USD MILLION)
  • TABLE 201 SOUTH AMERICA: FRAGRANCES MARKET, BY COUNTRY, 2018–2022 (USD MILLION)
  • TABLE 202 SOUTH AMERICA: FRAGRANCES MARKET, BY COUNTRY, 2023–2029 (USD MILLION)
  • TABLE 203 BRAZIL: FLAVORS MARKET, BY END-USE INDUSTRY, 2018–2022 (USD MILLION)
  • TABLE 204 BRAZIL: FLAVORS MARKET, BY END-USE INDUSTRY, 2023–2029 (USD MILLION)
  • TABLE 205 BRAZIL: FRAGRANCES MARKET, BY END-USE INDUSTRY, 2018–2022 (USD MILLION)
  • TABLE 206 BRAZIL: FRAGRANCES MARKET, BY END-USE INDUSTRY, 2023–2029 (USD MILLION)
  • TABLE 207 ARGENTINA: FLAVORS MARKET, BY END-USE INDUSTRY, 2018–2022 (USD MILLION)
  • TABLE 208 ARGENTINA: FLAVORS MARKET, BY END-USE INDUSTRY, 2023–2029 (USD MILLION)
  • TABLE 209 ARGENTINA: FRAGRANCES MARKET, BY END-USE INDUSTRY, 2018–2022 (USD MILLION)
  • TABLE 210 ARGENTINA: FRAGRANCES MARKET, BY END-USE INDUSTRY, 2023–2029 (USD MILLION)
  • TABLE 211 FLAVORS & FRAGRANCES MARKET: DEGREE OF COMPETITION
  • TABLE 212 FLAVORS & FRAGRANCES MARKET: REGION FOOTPRINT
  • TABLE 213 FLAVORS & FRAGRANCES MARKET: INGREDIENT TYPE FOOTPRINT
  • TABLE 214 FLAVORS & FRAGRANCES MARKET: END-USE INDUSTRY FOOTPRINT
  • TABLE 215 FLAVORS & FRAGRANCES MARKET: DETAILED LIST OF KEY STARTUPS/SMES
  • TABLE 216 FLAVORS & FRAGRANCES MARKET: COMPETITIVE BENCHMARKING OF KEY STARTUPS/SMES
  • TABLE 217 FLAVORS & FRAGRANCES MARKET: PRODUCT LAUNCHES, JANUARY 2021–JUNE 2024
  • TABLE 218 FLAVORS & FRAGRANCES MARKET: DEALS, JANUARY 2021–JUNE 2024
  • TABLE 219 FLAVORS & FRAGRANCES MARKET: EXPANSIONS, JANUARY 2021–JUNE 2024
  • TABLE 220 GIVAUDAN SA: COMPANY OVERVIEW
  • TABLE 221 GIVAUDAN SA: PRODUCTS OFFERED
  • TABLE 222 GIVAUDAN SA: PRODUCT LAUNCHES, JANUARY 2021–JUNE 2024
  • TABLE 223 GIVAUDAN SA: DEALS, JANUARY 2021–JUNE 2024
  • TABLE 224 INTERNATIONAL FLAVORS & FRAGRANCES INC.: COMPANY OVERVIEW
  • TABLE 225 INTERNATIONAL FLAVORS & FRAGRANCES INC.: PRODUCTS OFFERED
  • TABLE 226 INTERNATIONAL FLAVORS & FRAGRANCES INC.: DEALS, JANUARY 2021–JUNE 2024
  • TABLE 227 INTERNATIONAL FLAVORS & FRAGRANCES INC.: EXPANSIONS, JANUARY 2021–JUNE 2024
  • TABLE 228 DSM-FIRMENICH AG: COMPANY OVERVIEW
  • TABLE 229 DSM-FIRMENICH AG: PRODUCTS OFFERED
  • TABLE 230 DSM-FIRMENICH AG: PRODUCT LAUNCHES, JANUARY 2021–JUNE 2024
  • TABLE 231 DSM-FIRMENICH AG: DEALS, JANUARY 2021–JUNE 2024
  • TABLE 232 DSM-FIRMENICH AG: EXPANSIONS, JANUARY 2021–JUNE 2024
  • TABLE 233 SYMRISE AG: COMPANY OVERVIEW
  • TABLE 234 SYMRISE AG: PRODUCTS OFFERED
  • TABLE 235 SYMRISE AG: PRODUCT LAUNCHES, JANUARY 2021–JUNE 2024
  • TABLE 236 TAKASAGO INTERNATIONAL CORPORATION: COMPANY OVERVIEW
  • TABLE 237 TAKASAGO INTERNATIONAL CORPORATION: PRODUCTS OFFERED
  • TABLE 238 TAKASAGO INTERNATIONAL CORPORATION: EXPANSIONS
  • TABLE 239 SENSIENT TECHNOLOGIES CORPORATION: COMPANY OVERVIEW
  • TABLE 240 SENSIENT TECHNOLOGIES CORPORATION: PRODUCTS OFFERED
  • TABLE 241 SENSIENT TECHNOLOGIES CORPORATION: DEALS, JANUARY 2021–JUNE 2024
  • TABLE 242 ADM: COMPANY OVERVIEW
  • TABLE 243 ADM: PRODUCTS OFFERED
  • TABLE 244 MANE: COMPANY OVERVIEW
  • TABLE 245 MANE: PRODUCTS OFFERED
  • TABLE 246 ROBERTET GROUP: COMPANY OVERVIEW
  • TABLE 247 ROBERTET GROUP: PRODUCTS OFFERED
  • TABLE 248 T. HASEGAWA CO., LTD.: COMPANY OVERVIEW
  • TABLE 249 T. HASEGAWA CO., LTD.: PRODUCTS OFFERED
  • TABLE 250 T. HASEGAWA CO., LTD.: PRODUCT LAUNCHES, JANUARY 2021–JUNE 2024
  • TABLE 251 BELL FLAVORS & FRAGRANCES: COMPANY OVERVIEW
  • TABLE 252 BELL FLAVORS & FRAGRANCES: PRODUCTS OFFERED
  • TABLE 253 BELL FLAVORS & FRAGRANCES: PRODUCT LAUNCHES, JANUARY 2021–JUNE 2024
  • TABLE 254 KERRY GROUP: COMPANY OVERVIEW
  • TABLE 255 OGAWA & CO., LTD.: COMPANY OVERVIEW
  • TABLE 256 HUABAO INTERNATIONAL HOLDINGS LTD.: COMPANY OVERVIEW
  • TABLE 257 BIOLANDES SAS: COMPANY OVERVIEW
  • TABLE 258 FLAVEX NATUREXTRAKTE GMBH: COMPANY OVERVIEW
  • TABLE 259 SYNTHITE INDUSTRIES LTD.: COMPANY OVERVIEW
  • TABLE 260 UNGERER & COMPANY: COMPANY OVERVIEW
  • TABLE 261 AKAY NATURAL INGREDIENTS PRIVATE LIMITED: COMPANY OVERVIEW
  • TABLE 262 SOLVAY SA: COMPANY OVERVIEW
  • TABLE 263 OZONE NATURALS: COMPANY OVERVIEW
  • TABLE 264 BASF SE: COMPANY OVERVIEW
  • TABLE 265 AROMATECH SAS: COMPANY OVERVIEW
  • TABLE 266 BEDOUKIAN RESEARCH INC.: COMPANY OVERVIEW
  • TABLE 267 ALPHA AROMATICS: COMPANY OVERVIEW
  • TABLE 268 AROMA INGREDIENTS MARKET, BY REGION, 2016–2023 (USD MILLION)
  • TABLE 269 EUROPE: AROMA INGREDIENTS MARKET, BY COUNTRY, 2016–2023 (USD MILLION)
  • TABLE 270 ASIA PACIFIC: AROMA INGREDIENTS MARKET, BY COUNTRY, 2016–2023 (USD MILLION)
  • TABLE 271 NORTH AMERICA: AROMA INGREDIENTS MARKET, BY COUNTRY, 2016–2023 (USD MILLION)
  • TABLE 272 MIDDLE EAST & AFRICA: AROMA INGREDIENTS MARKET, BY COUNTRY, 2016–2023 (USD MILLION)
  • TABLE 273 SOUTH AMERICA: AROMA INGREDIENTS MARKET, BY COUNTRY, 2016–2023 (USD MILLION)
LIST OF FIGURES
 
  • FIGURE 1 FLAVORS & FRAGRANCES MARKET: RESEARCH DESIGN
  • FIGURE 2 MARKET SIZE ESTIMATION METHODOLOGY: APPROACH 1 (SUPPLY SIDE)—COLLECTIVE SHARE OF KEY PLAYERS
  • FIGURE 3 MARKET SIZE ESTIMATION METHODOLOGY: APPROACH 2 (SUPPLY SIDE)—COLLECTIVE REVENUE OF ALL PRODUCTS
  • FIGURE 4 MARKET SIZE ESTIMATION METHODOLOGY: APPROACH 3 (DEMAND SIDE)—PRODUCTS SOLD
  • FIGURE 5 MARKET SIZE ESTIMATION METHODOLOGY: APPROACH 4–TOP-DOWN APPROACH
  • FIGURE 6 FLAVORS & FRAGRANCES MARKET: DATA TRIANGULATION
  • FIGURE 7 CAGR PROJECTIONS FROM SUPPLY SIDE
  • FIGURE 8 MARKET GROWTH PROJECTIONS FROM DEMAND-SIDE DRIVERS AND OPPORTUNITIES
  • FIGURE 9 SYNTHETIC INGREDIENTS TO ACCOUNT FOR LARGER MARKET SHARE
  • FIGURE 10 BEVERAGES SEGMENT TO CONTINUE TO DOMINATE MARKET IN 2029
  • FIGURE 11 CONSUMER PRODUCTS SEGMENT TO DOMINATE MARKET DURING FORECAST PERIOD
  • FIGURE 12 SOUTH AMERICA TO REGISTER HIGHEST CAGR IN FLAVORS & FRAGRANCES MARKET DURING FORECAST PERIOD
  • FIGURE 13 INCREASING DEMAND FOR NATURAL FLAVORS & FRAGRANCES TO DRIVE MARKET
  • FIGURE 14 SOUTH AMERICA TO WITNESS FASTEST GROWTH DURING FORECAST PERIOD
  • FIGURE 15 BEVERAGES SEGMENT ACCOUNTED FOR LARGEST MARKET SHARE IN 2023
  • FIGURE 16 CONSUMER PRODUCTS SEGMENT DOMINATED FRAGRANCES MARKET ACROSS ALL REGIONS
  • FIGURE 17 IRAN TO REGISTER HIGHEST CAGR DURING FORECAST PERIOD
  • FIGURE 18 FLAVORS & FRAGRANCES MARKET: DRIVERS, RESTRAINTS, OPPORTUNITIES, AND CHALLENGES
  • FIGURE 19 FLAVORS & FRAGRANCES MARKET: PORTER’S FIVE FORCES ANALYSIS
  • FIGURE 20 FLAVORS & FRAGRANCES MARKET: SUPPLY CHAIN
  • FIGURE 21 INFLUENCE OF STAKEHOLDERS ON BUYING PROCESS IN TOP-THREE END-USE INDUSTRIES OF FLAVORS & FRAGRANCES
  • FIGURE 22 KEY BUYING CRITERIA FOR TOP THREE END-USE INDUSTRIES OF FLAVORS & FRAGRANCES
  • FIGURE 23 INDICATIVE AVERAGE SELLING PRICE TREND OF FLAVORS & FRAGRANCES, BY REGION (USD/KG)
  • FIGURE 24 TRENDS/DISRUPTIONS IMPACTING CUSTOMERS’ BUSINESSES
  • FIGURE 25 ECOSYSTEM OF FLAVORS & FRAGRANCES MARKET
  • FIGURE 26 IMPORT OF FLAVORS, BY KEY COUNTRY, 2017–2022 (USD MILLION)
  • FIGURE 27 IMPORT OF FRAGRANCES, BY KEY COUNTRY, 2017–2022 (USD MILLION)
  • FIGURE 28 EXPORT OF FLAVORS, BY KEY COUNTRY, 2017–2022 (USD MILLION)
  • FIGURE 29 EXPORT OF FRAGRANCES, BY KEY COUNTRY, 2017–2022 (USD MILLION)
  • FIGURE 30 PATENTS REGISTERED FOR FLAVORS & FRAGRANCES, 2013–2023
  • FIGURE 31 LIST OF MAJOR PATENTS FOR FLAVORS & FRAGRANCES
  • FIGURE 32 LEGAL STATUS OF PATENTS FILED IN FLAVORS & FRAGRANCES
  • FIGURE 33 MAXIMUM PATENTS FILED IN JURISDICTION OF CHINA
  • FIGURE 34 SYNTHETIC INGREDIENTS WILL CONTINUE TO DOMINATE MARKET DURING FORECAST PERIOD
  • FIGURE 35 BEVERAGES SEGMENT TO DOMINATE MARKET IN 2024
  • FIGURE 36 CONSUMER PRODUCTS TO DOMINATE FRAGRANCES MARKET DURING FORECAST PERIOD
  • FIGURE 37 ASIA PACIFIC WILL CONTINUE TO DOMINATE MARKET DURING FORECAST PERIOD
  • FIGURE 38 ASIA PACIFIC: FLAVORS & FRAGRANCES MARKET SNAPSHOT
  • FIGURE 39 EUROPE: FLAVORS & FRAGRANCES MARKET SNAPSHOT
  • FIGURE 40 NORTH AMERICA: FLAVORS & FRAGRANCES MARKET SNAPSHOT
  • FIGURE 41 MARKET SHARE OF KEY PLAYERS IN FLAVORS & FRAGRANCES MARKET, 2023
  • FIGURE 42 RANKING OF PLAYERS IN FLAVORS & FRAGRANCES MARKET, 2023
  • FIGURE 43 REVENUE ANALYSIS OF KEY PLAYERS IN FLAVORS & FRAGRANCES MARKET, 2019–2023 (USD MILLION)
  • FIGURE 44 FLAVORS & FRAGRANCES MARKET: COMPANY EVALUATION MATRIX (KEY PLAYERS), 2023
  • FIGURE 45 FLAVORS & FRAGRANCES MARKET: COMPANY FOOTPRINT
  • FIGURE 46 FLAVORS & FRAGRANCES MARKET: COMPANY EVALUATION MATRIX (STARTUP/SMES), 2023
  • FIGURE 47 FLAVORS & FRAGRANCES MARKET: BRAND/PRODUCT COMPARISON
  • FIGURE 48 EV/EBITDA OF KEY MANUFACTURERS OF FLAVORS & FRAGRANCES
  • FIGURE 49 ENTERPRISE VALUATION (EV) OF KEY PLAYERS IN FLAVORS & FRAGRANCES MARKET
  • FIGURE 50 GIVAUDAN SA: COMPANY SNAPSHOT (2023)
  • FIGURE 51 INTERNATIONAL FLAVORS & FRAGRANCES INC.: COMPANY SNAPSHOT (2023)
  • FIGURE 52 DSM-FIRMENICH AG: COMPANY SNAPSHOT (2023)
  • FIGURE 53 SYMRISE AG: COMPANY SNAPSHOT (2023)
  • FIGURE 54 TAKASAGO INTERNATIONAL CORPORATION: COMPANY SNAPSHOT (2023)
  • FIGURE 55 SENSIENT TECHNOLOGIES CORPORATION: COMPANY SNAPSHOT (2023)
  • FIGURE 56 ADM: COMPANY SNAPSHOT (2023)
  • FIGURE 57 MANE: COMPANY SNAPSHOT (2023)
  • FIGURE 58 ROBERTET GROUP: COMPANY SNAPSHOT (2023)
  • FIGURE 59 T. HASEGAWA CO., LTD.: COMPANY SNAPSHOT

The study involved four major activities in estimating the market size for flavors & fragrances market. Exhaustive secondary research was done to collect information on the market, the peer market, and the parent market. The next step was to validate these findings, assumptions, and sizing with industry experts across the value chain through primary research. Both top-down and bottom-up approaches were employed to estimate the complete market size. After that, the market breakdown and data triangulation procedures were used to estimate the market size of the segments and subsegments.

Secondary Research

Secondary sources used in this study included annual reports, press releases, and investor presentations of companies; white papers; certified publications; articles from recognized authors; and gold standard & silver standard websites such as Factiva, ICIS, Bloomberg, and others. The findings of this study were verified through primary research by conducting extensive interviews with key officials such as CEOs, VPs, directors, and other executives. The breakdown of profiles of the primary interviewees is illustrated in the figure below:

Primary Research

The flavors & fragrances market comprises several stakeholders, such as raw material suppliers, end-product manufacturers, and regulatory organizations in the supply chain. The demand side of this market is characterized from key opinion leaders in various applications for the flavors & fragrances market. The supply side is characterized by advancements in technology and diverse application industries. Various primary sources from both the supply and demand sides of the market were interviewed to obtain qualitative and quantitative information.
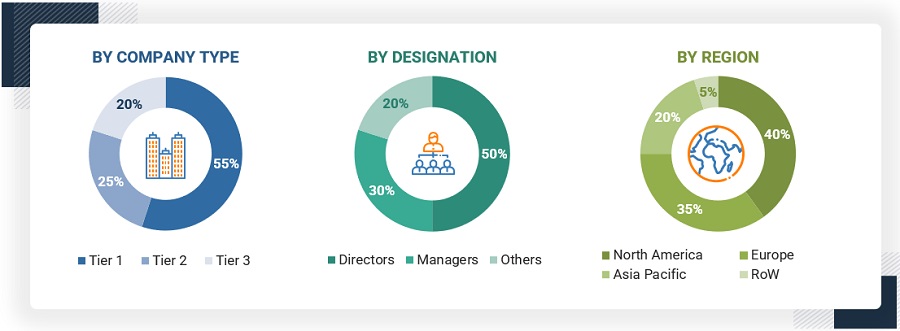
Flavors & Fragrances Market Size, and Share

Note: Tier 1, Tier 2, and Tier 3 companies are classified based on their market revenue in 2022/ 2023, available in the public domain, product portfolios, and geographical presence.

Other designations include consultants and sales, marketing, and procurement managers.

To know about the assumptions considered for the study, download the pdf brochure

COMPANY NAME

DESIGNATION

Givaudan SA

Senior Manager

International Flavors & Fragrances Inc.

Innovation Manager

DSM-Firmenich AG

Vice-President

Symrise AG

Production Supervisor

ADM

Sales Manager

Market Size Estimation

Both top-down and bottom-up approaches were used to estimate and validate the total size of the flavors & fragrances market. These methods were also used extensively to estimate the size of various subsegments in the market. The research methodology used to estimate the market size includes the following:

  • The key players in the industry have been identified through extensive secondary research.
  • The supply chain of the industry has been determined through primary and secondary research.
  • All percentage shares, splits, and breakdowns have been determined using secondary sources and verified through primary sources.
  • All possible parameters that affect the markets covered in this research study have been accounted for, viewed in extensive detail, verified through primary research, and analyzed to obtain the final quantitative and qualitative data.

Flavors & Fragrances Market: Bottom-Up Approach

Flavors & Fragrances Market Size, and Share

To know about the assumptions considered for the study, Request for Free Sample Report

Flavors & Fragrances Market: Top-Down Approach

Flavors & Fragrances Market Size, and Share

Data Triangulation

After arriving at the overall market size—using the market size estimation processes as explained above—the market was split into several segments and subsegments. To complete the overall market engineering process and arrive at the exact statistics of each market segment and subsegment, data triangulation, and market breakdown procedures were employed, wherever applicable. The data was triangulated by studying various factors and trends from both the demand and supply sides in the flavors & fragrances industry.

Market Definition

The sensations that are detected by the tongue's taste buds and the nose's olfactory receptors when consuming food or beverages are referred to as flavors. They have a significant impact on the dietary choices and preferences as well as the way food is perceived and appreciated. Fragrances, often known as perfumes, are aromatic compounds intended to be applied to the body, products, or interior spaces for the purpose of creating a pleasing aroma.

Key Stakeholders

  • Flavors & fragrances manufacturers
  • Flavors & fragrances suppliers
  • Raw material suppliers
  • Service providers
  • Application sector companies
  • Government bodies

Report Objectives

  • To define, describe, and forecast the flavors & fragrances market in terms of value 
  • To provide detailed information regarding the drivers, opportunities, restraints, and challenges influencing market growth
  • To estimate and forecast the market size by ingredient type, end-use industry, and region
  • To forecast the size of the market for five main regions: Asia Pacific, Europe, North America, South America, and the Middle East & Africa, along with their key countries
  • To strategically analyze micromarkets1 with respect to their growth trends, prospects, and contribution to the overall market
  • To analyze opportunities in the market for stakeholders and provide a competitive landscape for market leaders
  • To analyze competitive developments, such as deals and expansions, in the market
  • To analyze the impact of the recession on the market
  • To analyze the impact of COVID-19 on the market and end-use industries
  • To strategically profile key players and comprehensively analyze their growth strategies

Available Customizations

Along with the given market data, MarketsandMarkets offers customizations according to the company’s specific needs. The following customization options are available for the report:

Regional Analysis

  • Further breakdown of a region with respect to a particular country or additional end-use industry

Company Information

  • Detailed analysis and profiles of additional market players (up to five)

Previous Versions of this Report

Flavors & Fragrances Market by Ingredients (Natural, Synthetic), End use (Beverage, Savory & Snacks, Bakery, Dairy Products, Confectionery, Consumer Products, Fine Fragrances), and Region (Asia Pacific, North America, Europe) - Global Forecast to 2026

Report Code CH 6073
Published in Sep, 2021, By MarketsandMarkets™

Flavors & Fragrances Market by Ingredients (Natural, Synthetic), End use (Beverage, Savory & Snacks, Bakery, Dairy Products, Confectionery, Consumer Products, Fine Fragrances), and Region (Asia Pacific, North America, Europe) - Global Forecast to 2026

Report Code CH 6073
Published in Mar, 2018, By MarketsandMarkets™
"Our USP is "providing game-changing business opportunities reports with free customization" - so please feel free to provide us with your specific areas of interest / business challenges in much greater detail !!"

We appreciate your interest in this report. Once you fill out the form, you'll be immediately directed to an exclusive solution tailored to your needs. This high-value offering can help boost your revenue by 30% - a must-see opportunity for anyone looking to maximize growth.


By clicking the "Submit" button, you are agreeing to the Terms of Use and Privacy Policy.

Custom Market Research Services

We Will Customise The Research For You, In Case The Report Listed Above Does Not Meet With Your Requirements

Get 10% Free Customisation

Growth opportunities and latent adjacency in Flavors & Fragrances Market

DMCA.com Protection Status