
Sustainable Aviation Fuel (Biofuel) Market Size, Share & Analysis, 2025 To 2030

Sustainable Aviation Fuel (Biofuel) Market by Fuel type(Biofuel, Hydrogen, PtL, GtL), by Biofuel Conversion Pathways (HEFA, FT, ATJ, Co-processing), by biofuel blending capacity (below 30%, 30% to 50%, Above 50%), Aircraft type and Region - Global Forecast to 2030


OVERVIEW
Source: Secondary Research, Interviews with Experts, MarketsandMarkets Analysis
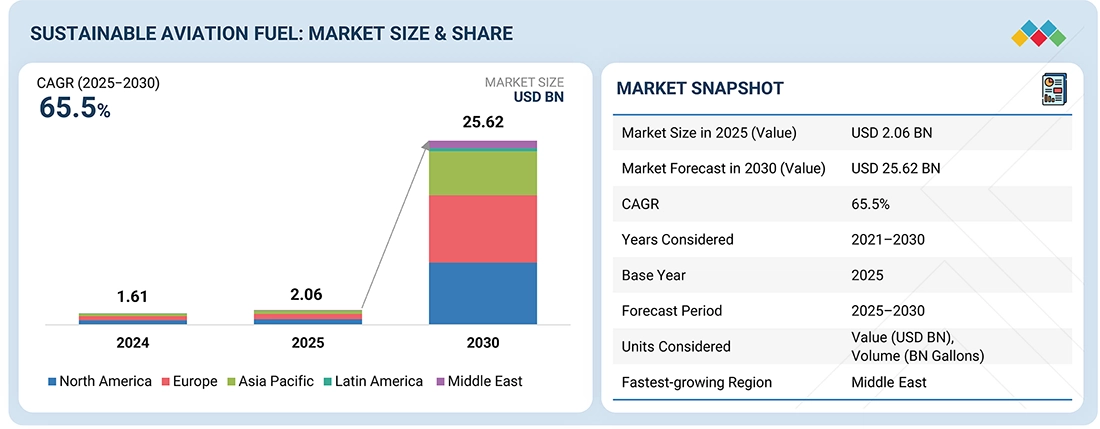
The sustainable aviation fuel market is projected to reach USD 2.06 billion by 2025. It is projected to reach USD 25.62 billion by 2030, growing at a CAGR of 65.5%. In terms of volume, the market is projected to grow from 0.30 billion gallons in 2025 to 3.68 billion gallons by 2030. The growing environmental concerns, feedstock processing and refining technologies advancements, and increasing aircraft production & fleet expansion propel the market’s growth.
KEY TAKEAWAYS
- Europe is expected to account for a 36.4% share of the sustainable aviation fuel market in 2025.
- By fuel type, the biofuel segment is expected to dominate the market from 2025 to 2030.
- By end user, the non-scheduled operator segment is projected to grow at the fastest rate from 2025 to 2030.
- By aircraft type, the unmanned aerial vehicle segment is projected to grow at the fastest rate from 2025 to 2030.
- Neste, TotalEnergies, and World Energy, LLC were identified as some of the star players in the sustainable aviation fuel market, given their strong market share and product footprint.
- Atmosfair, Wastefuel, and Red Rock Biofuels have distinguished themselves among startups and SMEs by securing strong footholds in specialized niche areas, underscoring their potential as emerging market leaders.
The future growth of the SAF market will be fueled by increasing global decarbonization targets, expanding airline commitments toward net-zero operations, and supportive government policies mandating SAF blending. Technological advancements in feedstock conversion pathways are enabling cost competitiveness and large-scale production.
TRENDS & DISRUPTIONS IMPACTING CUSTOMERS' CUSTOMERS
The impact on consumers’ business emerges from customer trends or disruptions. Trends and disruptions impacting customer business often stem from the increasing demand for air transportation is expected to fuel the market, leading to new revenue opportunities.
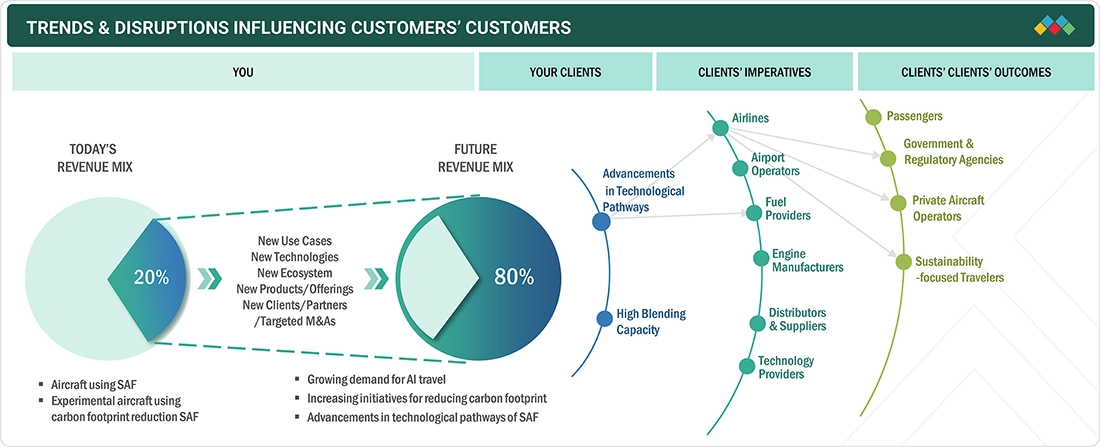
Source: Secondary Research, Interviews with Experts, MarketsandMarkets Analysis
MARKET DYNAMICS
Level
-
Advancements in feedstock processing and refining technologies

-
Stringent environmental regulatory mandates

Level
-
High production costs

-
Limited feedstock availability

Level
-
Rising depletion of fossil fuels

-
Growing focus on reducing greenhouse gas emissions

Level
-
Lack of sufficient funding for demonstration of SAF technologies

-
Lack of adequate infrastructure

Source: Secondary Research, Interviews with Experts, MarketsandMarkets Analysis
Driver: Advancements in feedstock processing and refining technologies
Modern innovations have significantly improved the efficiency and scalability of converting various feedstocks, such as used cooking oil, animal fats, agricultural residues, municipal solid waste, and even algae, into high-quality SAF. These technological developments have expanded the range of usable raw materials, reduced production costs, and enhanced the overall yield of sustainable fuels, making SAF a more commercially viable alternative to conventional jet fuel.
Restraint: High production costs
The high production costs associated with SAF represent a significant restraint to its widespread adoption and commercial viability. Unlike conventional jet fuel, which is derived from well-established and cost-efficient petroleum refining processes, SAF is produced through emerging technologies that often involve complex biochemical or thermochemical conversions. These processes are not yet optimized at scale and rely on expensive feedstocks, such as biomass, used cooking oil, or captured carbon, which further drive up production expenses.
Opportunity: Growing focus on reducing greenhouse gas emissions
The growing focus on reducing greenhouse gas emissions presents a significant opportunity for the SAF market as governments, industries, and consumers demand more environmentally friendly solutions. As governments introduce stricter emission regulations and set carbon reduction targets, airlines are under pressure to adopt SAF to comply with these evolving standards, driving up demand and creating an attractive market for SAF production.
Challenge: Lack of adequate infrastructure
The lack of adequate infrastructure is one of the big challenges hindering the growth and scalability of the SAF market. Unlike conventional jet fuel, which benefits from an extensive, mature, and highly integrated global infrastructure network, SAF production and distribution systems are still in their early stages of development. The absence of sufficient production facilities, dedicated blending sites, and compatible storage and fueling systems significantly limits the ability to supply SAF on a large scale.
Sustainable Aviation Fuel (Biofuel): COMMERCIAL USE CASES ACROSS INDUSTRIES
| COMPANY | USE CASE DESCRIPTION | BENEFITS |
|---|---|---|
 |
Supplies HEFA-based SAF to major airlines and airports globally for commercial flight operations | Reduces lifecycle carbon emissions by up to 80% while offering drop-in compatibility with existing jet engines |
|
|
Produces SAF through biorefinery conversions utilizing waste oils and fats | Supports circular economy initiatives and strengthens Europe’s renewable fuel supply chain |
|
|
Manufactures SAF from renewable waste and residues at dedicated refineries across France | Enhances compliance with EU ReFuelEU Aviation mandates and accelerates decarbonization of air transport |
|
|
Partners with airlines to supply SAF blends derived from co-processing technologies | Enables cost-effective SAF production using existing refinery infrastructure |
|
|
Operates large-scale SAF facilities in collaboration with global carriers and logistics operators | Provides reliable low-carbon jet fuel supply to meet growing demand for sustainable flight operations |
Logos and trademarks shown above are the property of their respective owners. Their use here is for informational and illustrative purposes only.
MARKET ECOSYSTEM
The sustainable aviation fuel market ecosystem includes prominent companies, private and small enterprises, and end users. Prominent companies and private and small enterprises include fuel producers/refiners, distributors/suppliers/traders, technology providers, and raw material providers.
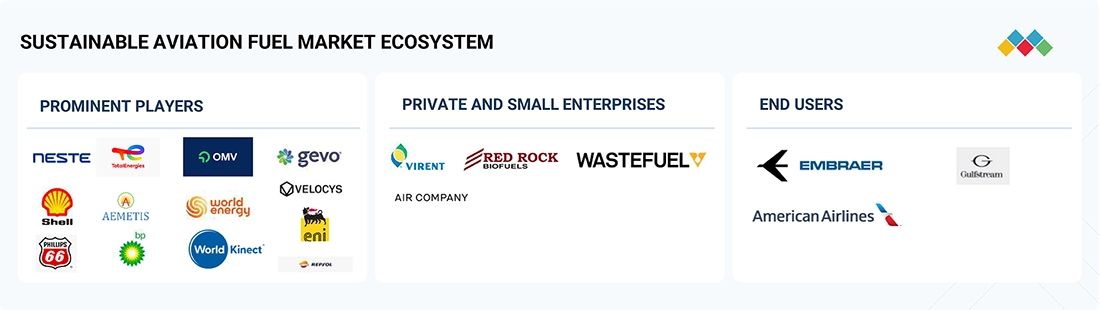
Logos and trademarks shown above are the property of their respective owners. Their use here is for informational and illustrative purposes only.
MARKET SEGMENTS
Source: Secondary Research, Interviews with Experts, MarketsandMarkets Analysis
Sustainable Aviation Fuel Market, By Fuel Type
Based on the fuel type, the biofuel segment is projected to contribute the largest market share in the sustainable aviation fuel market during the forecast period due to its scalability, maturity, and general acceptance within the aviation sector. Biofuels are made from renewable biological materials like used cooking oil, animal fat, agricultural waste, and energy crops.
Sustainable Aviation Fuel Market, By Aircraft Type
Based on aircraft type, the commercial aviation segment is projected to account for the largest market share in the sustainable aviation fuel market during the forecast period due to the growing global aviation travel and growing environmental concerns. As the aviation industry operates many flights each year, especially in emerging markets, the transition to SAF presents an accessible route by which airlines can lower carbon emissions without altering existing fleets or infrastructure.
Sustainable Aviation Fuel Market, By Biofuel Conversion Pathway
Based on the Biofuel Conversion Pathway, the hydroprocessed esters and fatty acids (HEFA) segment is projected to hold the largest market share owing to its commercial maturity, reliable feedstock availability, and ASTM certification for blending up to 50%. Its established production infrastructure and lower capital requirements compared to emerging pathways make it the preferred choice among SAF producers.
Sustainable Aviation Fuel Market, By Biofuel Blending Capacity
Based on Biofuel Blending Capacity, the below 30% blending capacity segment is expected to dominate the market as airlines and fuel suppliers prioritize gradual integration of SAF to ensure compatibility with existing engines and fuel systems. Early-stage adoption programs and limited global blending mandates further reinforce the segment’s current market leadership.
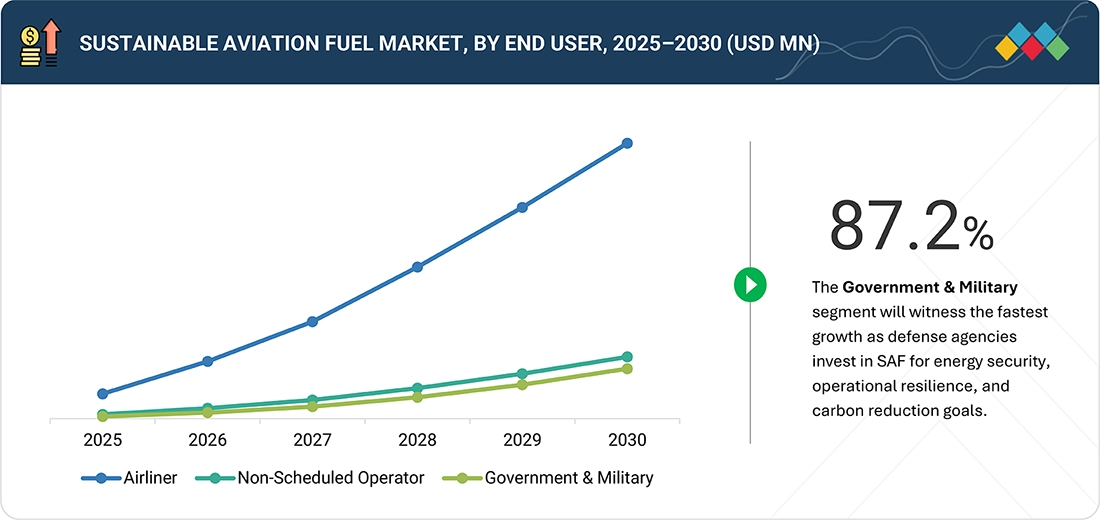
Sustainable Aviation Fuel Market, By End User
Based on End User, the airliner segment is projected to account for the largest market share in the sustainable aviation fuel market during the forecast period, driven by the ongoing expansion of air travel for tourism and business purposes. Airlines are expanding their fleets and replacing older aircraft with more efficient and technologically superior models to meet increasing passenger volumes and environmental requirements.
REGION
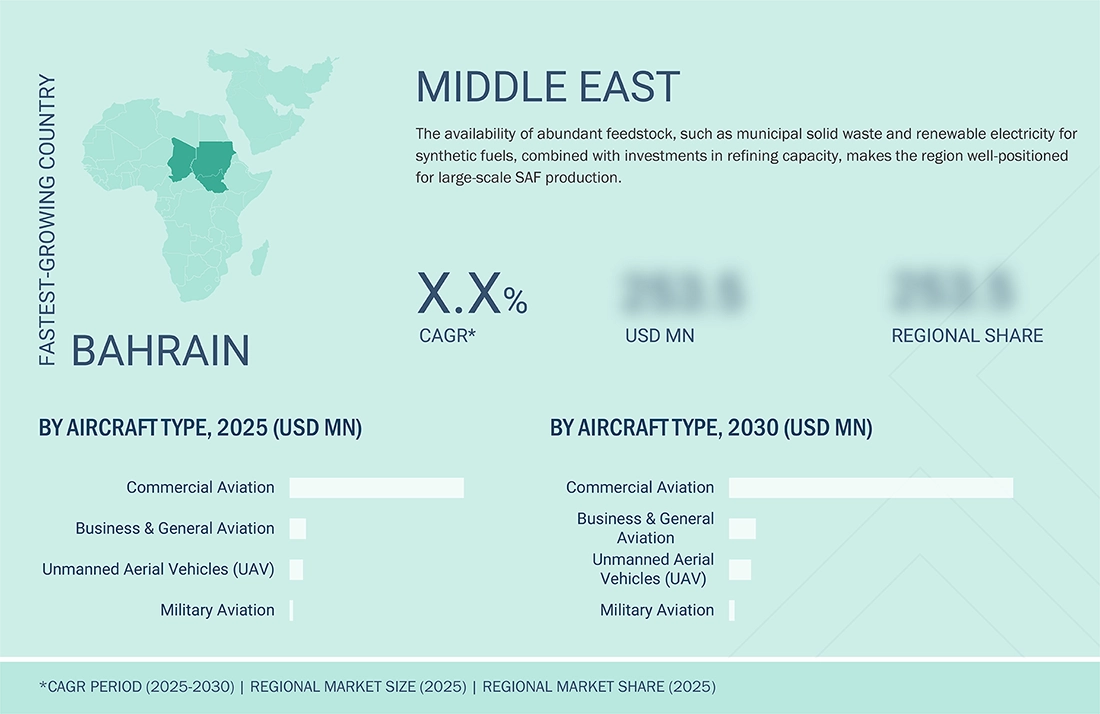
Middle East to be the fastest-growing region in global Sustainable Aviation Fuel market during forecast period
The Middle East is projected to be the fastest-growing region in the market due to the increasing demand for air travel, fast economic development, and increasing regional environmental issues. Additionally, the region is heavily investing in sustainable aviation options to reduce carbon emissions and meet international climate targets. Countries in the region are developing supportive policies, investing in research and development, and promoting public-private partnerships to create a strong SAF ecosystem. Moreover, the Middle East’s high availability of diversified biomass resources and the emphasis on renewable energy development make it a robust SAF production market.
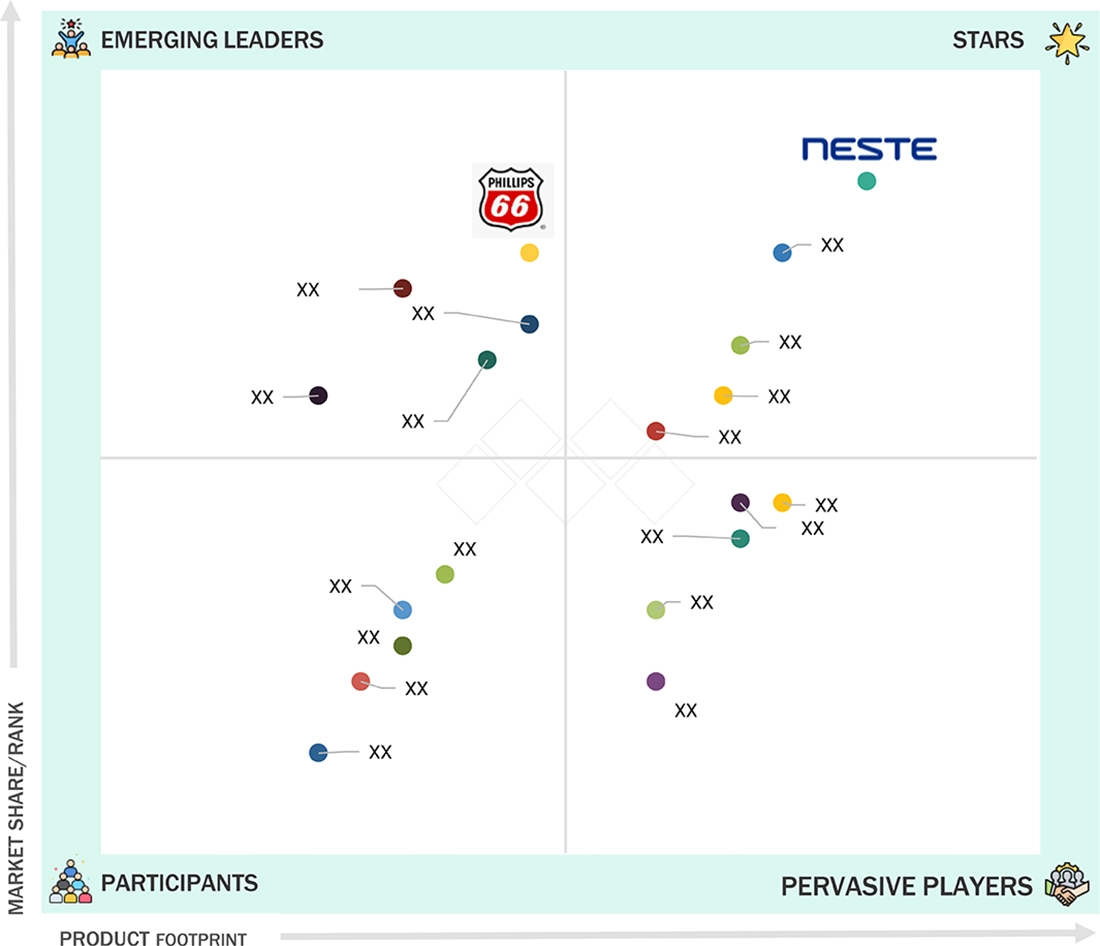
Sustainable Aviation Fuel (Biofuel): COMPANY EVALUATION MATRIX
The company evaluation matrix for the SAF market evaluates players based on product footprint and market share. Neste (Star) leads the Sustainable Aviation Fuel market with a strong product portfolio, advanced SAF processing technologies, and a broad customer base, while Philips66 Company (Emerging Leader) is recognized for its innovation and high growth potential.
Source: Secondary Research, Interviews with Experts, MarketsandMarkets Analysis
KEY MARKET PLAYERS
MARKET SCOPE
| REPORT METRIC | DETAILS |
|---|---|
| Market Size in 2024 (Value) | USD 2.06 BN |
| Market Forecast in 2030 (Value) | USD 25.62 BN |
| Growth Rate | CAGR of 65.5% from 2025–2030 |
| Years Considered | 2021–2030 |
| Base Year | 2024 |
| Forecast Period | 2025–2030 |
| Units Considered | Value (USD BN), Volume (BN Gallons) |
| Report Coverage | Revenue forecast, company ranking, competitive landscape, growth factors, and trends |
| Segments Covered |
|
| Regions Covered | North America, Europe, Asia Pacific, Latin America and Middle East |
WHAT IS IN IT FOR YOU: Sustainable Aviation Fuel (Biofuel) REPORT CONTENT GUIDE
DELIVERED CUSTOMIZATIONS
We have successfully delivered the following deep-dive customizations:
| CLIENT REQUEST | CUSTOMIZATION DELIVERED | VALUE ADDS |
|---|---|---|
| Leading Manufacturer | Additional segment breakdown for countries | Additional country-level market sizing tables for segments/sub-segments covered at the regional/global level to gain an understanding of the market potential of each country |
| Emerging Leader | Additional company profiles | Competitive information on targeted players to gain granular insights on direct competition |
| Regional Market Leader | Additional country market estimates | Additional country-level deep dive for a more targeted understanding on the TAM |
RECENT DEVELOPMENTS
- February 2025 : Neste and DHL Group collaborated to evaluate Neste’s renewable solutions, including renewable diesel (HVO100) and sustainable aviation fuel (SAF), which can support DHL’s goal of achieving net-zero greenhouse gas emissions by 2050. This development aimed to develop a commercial model for DHL to procure approximately 300,000 tons of unblended SAF annually by 2030.
- February 2025 : Gevo and Axens expanded their partnership to accelerate the development and commercialization of sustainable aviation fuel (SAF) via the ethanol-to-jet (ETJ) pathway, leveraging Axens Jetanol technology and Gevo’s ethanol-to-olefins (ETO) technology.
- January 2025 : Shell and Yilkins collaborated to integrate their technologies for enhanced sustainable aviation fuel production.
- January 2025 : Topsoe signed an agreement with Chuangui New Energy Company to provide technology and services for producing sustainable aviation fuel (SAF) and renewable diesel.
- December 2024 : Neste and Air New Zealand agreed to supply 30 million liters of unblended Neste MY Sustainable Aviation Fuel, marking Air New Zealand’s largest SAF purchase. The fuel will be used at the Los Angeles (LAX) and San Francisco (SFO) international airports until February 2026.
Table of Contents
 Exclusive indicates content/data unique to MarketsandMarkets and not available with any competitors.
Methodology
The research study on the sustainable aviation fuel market involved the extensive use of secondary sources, directories, and databases, such as D&B Hoovers, Bloomberg, and Factiva, to identify and collect relevant information. Primary sources included industry experts from the market, suppliers, manufacturers, solution providers, technology developers, alliances, and organizations related to all segments of this industry’s value chain. In-depth interviews of various primary respondents, including key industry participants, subject matter experts (SMEs), industry consultants, and C-level executives, were conducted to obtain and verify critical qualitative and quantitative information pertaining to the market and assess the market’s growth prospects. A deductive approach, also known as the bottom-up approach combined with the top-down approach, was used to forecast the market size of different market segments.
Secondary Research
The share of companies in the sustainable aviation fuel market was determined based on secondary data made available through paid and unpaid sources and an analysis of the product portfolios of major companies. These companies were rated based on their performance and quality. Primary sources further validated these data points. Secondary sources for this research study included corporate filings, such as annual reports, investor presentations, and financial statements from trade, business, and professional associations. The secondary data was collected and analyzed to determine the overall market size, which primary respondents further validated.
Primary Research
Extensive primary research was conducted after obtaining information about the current scenario of the sustainable aviation fuel market through secondary research. Several primary interviews were conducted with market experts across different regions from the demand and supply sides. This primary data was collected through questionnaires, emails, and telephonic interviews.

Note 1: The tiers of the companies above are based on their revenue numbers in 2024.
Note 2: Tier 1: Revenue > USD 1 Billion; Tier 2: Revenue Between USD 100 Million and USD 1 Billion; Tier 3: Revenue < USD 100 Million
To know about the assumptions considered for the study, download the pdf brochure
Market Size Estimation
The top-down and bottom-up approaches were used to estimate and validate the size of the sustainable aviation fuel market. The research methodology used to estimate the market size included the following details:
- Key players in the market were identified through secondary research, and their market share was determined through primary and secondary research. This included a study of top market players’ annual and financial reports and extensive interviews with industry stakeholders such as CEOs, technical advisors, military experts, and SMEs of leading companies operating in the sustainable aviation fuel market.
- All percentage shares, splits, and breakdowns were determined using secondary sources and verified through primary sources.
- All possible parameters that affect the markets covered in this research study were accounted for, viewed in extensive detail, verified through primary research, and analyzed to obtain the final quantitative and qualitative data on the sustainable aviation fuel market. This data was consolidated, enhanced with detailed inputs, analyzed by MarketsandMarkets, and presented in this report.
Sustainable Aviation Fuel Market : Top-Down and Bottom-Up Approach

Data Triangulation
After arriving at the overall size of the sustainable aviation fuel market from the estimation process explained above, the total market was split into several segments and subsegments. Where applicable, the data triangulation and market breakdown procedures described below were implemented to complete the overall market engineering process and arrive at the exact statistics for various market segments and subsegments. The data was triangulated by studying different factors and trends from the demand and supply sides. The sustainable aviation fuel market size was also validated using the top-down and bottom-up approaches.
Market Definition
Sustainable aviation fuel is an alternative fuel developed with sustainable processes. It reduces the aviation industry’s carbon footprint caused by conventional fossil fuels. SAF is produced from sustainable feedstocks, such as municipal wastes, waste oils, industrial exhaust gases, and biomass residues. It can reduce up to 80% of carbon emissions compared to conventional fossil fuels, depending upon feedstocks, production methods, and supply chains utilized. SAF is currently approved to be used with a 50% blend in aircraft by the American Society for Testing and Materials International (ASTMI) D7566.
Key Stakeholders
- Raw Material Suppliers
- Technology Support Providers
- Distributors & Suppliers
- Airlines
- Fuel Manufacturers/Producers
- Technology Providers
- Airport Operators
- Government Bodies/Regulators
- Investors and Financial Institutions
- Research and Development (R&D) Organizations
- Environmental Organizations
Report Objectives
- To define, describe, segment, and forecast the sustainable aviation fuel market size based on fuel type, biofuel conversion pathway, biofuel blending capacity, aircraft type, end user, and region
- To forecast the size of various segments of the market with respect to five major regions, namely, North America, Europe, Asia Pacific, Middle East, and Latin America
- To identify and analyze key drivers, restraints, opportunities, and challenges influencing the growth of the market across the globe
- To identify industry trends, market trends, and technology trends currently prevailing
- To provide an overview of the regulatory landscape with respect to sustainable aviation fuel regulations across regions
- To analyze micro markets with respect to individual growth trends, prospects, and their contribution to the overall market
- To analyze opportunities in the market for stakeholders by identifying key market trends
- To profile key market players and comprehensively analyze their market shares and core competencies
- To analyze the degree of competition in the market by identifying key growth strategies adopted by leading market players, such as acquisitions, product launches, contracts, and partnerships
- To identify detailed financial positions, key products, and unique selling points of leading companies in the market
- To provide a detailed competitive landscape of the market, along with market ranking analysis, market share analysis, and revenue analysis of key players
Available Customizations
Along with the market data, MarketsandMarkets offers customizations to meet the specific needs of companies. The following customization options are available for the report:
Product Analysis
- Product matrix, which gives a detailed comparison of the product portfolio of each company
Regional Analysis
- Further breakdown of the market segments at the country level
Company Information
- Detailed analysis and profiling of additional market players (up to 5)
Key Questions Addressed by the Report
- Ethanol-to-Jet (EtJ)
- Advanced Gasification
- Hydrocracking
- Unicracking combined with the Fischer-Tropsch (FT) process
- The Fischer-Tropsch (FT) synthesis
- SAF-compatible Turbine Generator
- Advancements in feedstock processing and refining technologies
- Increasing adoption of fuel-efficient aircraft engines
- Stringent environmental regulatory mandates
Need a Tailored Report?
Customize this report to your needs
Get 10% FREE Customization
Customize This ReportPersonalize This Research
- Triangulate with your Own Data
- Get Data as per your Format and Definition
- Gain a Deeper Dive on a Specific Application, Geography, Customer or Competitor
- Any level of Personalization
Let Us Help You
- What are the Known and Unknown Adjacencies Impacting the Sustainable Aviation Fuel (Biofuel) Market
- What will your New Revenue Sources be?
- Who will be your Top Customer; what will make them switch?
- Defend your Market Share or Win Competitors
- Get a Scorecard for Target Partners

Custom Market Research Services
We Will Customise The Research For You, In Case The Report Listed Above Does Not Meet With Your Requirements
Get 10% Free CustomisationGrowth opportunities and latent adjacency in Sustainable Aviation Fuel (Biofuel) Market


ANDREY
Aug, 2022
Can you provide details of companies which buy and sell Aviation Fuel along with their specific preferences? .