Pharmaceutical Manufacturing Equipment Market Size, Share and Trends

Report Code SE 8645
Published in Dec, 2024, By MarketsandMarkets™
Download PDF

Choose License Type

Buy Report Now Inquire Before Buying

Pharmaceutical Manufacturing Equipment Market by Machine (Mixing & Blending, Milling, Spray Drying, Granulation, Extrusion, Tablet Compression, Sterilization, and Inspection), Process (Encapsulation, Formulation, Aseptic) – Global Forecast to 2029


Pharmaceutical Manufacturing Equipment Market Size, Share & Trends

The global pharmaceutical manufacturing equipment market size is projected to grow from USD 19.41 billion in 2024 to USD 26.94 billion in 2029, recording a CAGR of 6.8% during the forecast period. The growth of the pharmaceutical manufacturing equipment market is driven by the increasing demand for generic drugs across the globe. Moreover, the rise of contract development and manufacturing organizations (CDMOs) has significantly contributed to the growth of the pharmaceutical manufacturing equipment market. CDMOs play a crucial role in providing outsourced drug development and manufacturing services, enabling pharmaceutical companies to focus on research and commercialization.

Pharmaceutical Manufacturing Equipment Market

Attractive Opportunities in the Pharmaceutical Manufacturing Equipment Market

ASIA PACIFIC

The market growth in Asia Pacific is driven by cost-effective benefits for pharmaceutical companies such as reduced labor and manufacturing expenses, a skilled workforce, and enhanced infrastructure.

Government incentives and foreign investments have driven the expansion of the Contract Development and Manufacturing Organization (CDMO) market in the Asia Pacific region.

The cost-effectiveness of generic drugs is a key factor driving pharmaceutical manufacturing equipment market expansion in the Asia Pacific region, providing affordable alternatives to branded medications.

With Asia Pacific being a major global pharmaceuticals manufacturing hub, the growth of the pharmaceutical manufacturing equipment market has intensified.

The Asia Pacific region, characterized by its expanding population, increasing healthcare demands, and cost-reduction efforts, plays a significant role in the market growth.

IMPACT OF AI/GENERATIVE AI ON PHARMACEUTICAL MANUFACTURING EQUIPMENT MARKET

AI offers significant potential use cases in pharmaceutical manufacturing, which in turn also impacts the pharmaceutical manufacturing equipment market. To keep up with the increasing demands of the industry, equipment is evolving to be more advanced and adaptable. AI can enhance equipment performance by optimizing processes, enabling predictive maintenance, and automating operations. As a result, manufacturing equipment will be incorporated with AI capabilities, including machine learning algorithms, sensors, and real-time data analytics, to achieve higher accuracy, speed, and consistency in production.

Pharmaceutical Manufacturing Equipment Market

Global Pharmaceutical Manufacturing Equipment Market Dynamics

Driver: Growing rate of chronic diseases

The pharmaceutical manufacturing equipment market is reporting a significant growth rate driven by rising demands for pharmaceuticals. This growth is mainly associated with the aging population of the world coupled with the growing rate of chronic diseases such as diabetes, cardiovascular disorders, and cancer. According to the World Health Organization (WHO), by 2030, one in six people will be aged 60 years and above globally, and this population will increase from 1 billion as of the year 2020 to 1.4 billion. The population aged 60 years and above is projected to double to 2.1 billion by 2050. The gradual shift in demographics has amplified the demand for pharmaceuticals on account of age-related and chronic health issues. At the same time, advancements in pharma research and new-age formulations drive the industry's demand for high-tech production machinery, ensuring accuracy, quality, and productivity. According to IQVIA Institute, global spending on pharmaceuticals is likely to touch USD 1.9 trillion by 2027, which only goes on to symbolize the growth level in this industry. This highlights the critical role of advanced manufacturing equipment in meeting the increasing production demands.

Restraint: Rising demand for refurbished equipment

Many upfront costs are involved in purchasing and installing new manufacturing equipment for manufacturers. Additionally, manufacturing equipment can rapidly become outdated in a dynamic industry such as pharmaceuticals. Hence, there is an increasing demand for refurbished pharmaceutical manufacturing equipment globally. Refurbishment could be described as re-building or renewing the used equipment using new materials, technology, parts, or components to rebuild the equipment to its condition as it was originally supposed to operate and look. Refurbishment generally also happens at about half the price of purchasing the equipment from the start. Hence, refurbished manufacturing equipment saves the manufacturer on costs upfront, keeps them flexible regarding upgrades, and saves costs with increased equipment lifespan to get maximum returns on the investment. The biggest reason behind the increased demand for refurbished pharmaceutical manufacturing equipment is that developing economies have a gap in demand and supply, resulting in reduced access to new equipment. Besides, with a very limited purchasing budget, it is difficult for smaller and medium-sized pharmaceutical manufacturing plants to accept and upgrade their equipment with new ones. Hence, the demand for the refurbished pharmaceutical manufacturing equipment is rising internationally.


Opportunity: Increasing demand for personalized medicines

The growing demand for personalized medicines provides opportunities to the pharmaceutical manufacturing equipment industry, driven by advancements in genomics, proteomics, and artificial intelligence. Those technologies allow tailoring therapies at the level of individual patients who require specialty manufacturing processes. As such, the small batch size and complex formulation of personalized medicine also create a challenge in adaptability in manufacturing. Specialized equipment that promises precision, scalability, and flexibility in manufacturing is highly important. Long prototyping cycles also characterize personalized medicines requiring agile, modular systems that are scalable without compromising on quality. High-throughput screening, modular production systems, and continuous manufacturing support the efficiency of production, lead times, and regulatory compliance. Integration with digital tools such as digital twins and data analytics provides real-time monitoring, predictive maintenance, and quality assurance in terms of providing reliable patient-specific treatments. Investments in advanced technologies and sustainable practices are likely to enable the pharmaceutical manufacturing equipment industry to respond to rising demand while reducing time-to-market for high-quality personalized medicines with excellent outcomes for patients and sustaining support for sector growth.

Challenge: High capital expenditures related to regulatory compliances

Pharmaceutical manufacturing equipment must meet stringent regulations and guidelines from government bodies, such as the EMA in Europe and the FDA in the US. The high capital expenditures related to regulatory compliance, supplemented with operational and maintenance expenses, are enormous financial costs. Such costs can delay the entire research and development process, as a company might invest heavily to achieve conformity to regulatory standards rather than on the new technology. Additionally, the high investment involved in purchasing and running such equipment raises a barrier against the entry of smaller or emerging companies into the market, which has the potential to limit competition and diversity in the market. The fast-paced nature of the pharmaceutical industry adds an extra dimension to it. Therefore, the constant need for updates and changes to pharmaceutical manufacturing equipment must match the market's ever-changing needs. This adds an element of ongoing investment in upgrades, further increasing operational costs. For many producers, this high regulatory compliance cost, operational expense, and the need for continued equipment evolution have made it challenging to employ and maintain the pharmaceutical manufacturing equipment necessary to grow, innovate, and introduce new solutions.

Pharmaceutical Manufacturing Equipment Market Ecosystem

Major companies offering pharmaceutical manufacturing equipment market include GEA Group Aktiengesellschaft (Germany), I.M.A. INDUSTRIA MACCHINE AUTOMATICHE S.P.A. (Italy), Syntegon Technology GmbH (Germany), Romaco Group (Germany), ACG (India), Körber AG (Germany), Thermo Fisher Scientific Inc. (US), Marchesini Group S.p.A (Italy), MG2 s.r.l (Italy), Glatt GmbH (Germany).

Top Companies in Pharmaceutical Manufacturing Equipment Market
 

By equipment type, packaging machines to secure largest market share during the forecast period.

Packaging machines dominate the pharmaceutical manufacturing equipment sector due to many key factors. Packaging allows conformity to stringent regulatory requirements, such as safety and tamper evidence labeling set by global regulatory authorities like the FDA and EMA. The increased demand for pharmaceuticals in the developing world increases pressure for efficient and automated packaging solutions. In the last manufacturing stage, drug products are packed into different containers, including bottles, blister packs, and sachets, through pharmaceutical packaging machines. The different types include labeling machines, capping machines, and cartoning machines, which use various techniques for accurately and efficiently packaging drugs. Such packaging machines would protect the final product from contaminants, damage, or degradation and ensure the label, dosage, and storage requirements are within the appropriate specifications. They also play a critical role in ensuring pharmaceutical products' integrity and shelf life by preventing contamination and other environmental factors. The versatility of packaging machines- from tablets to injectables- gives manufacturers an opportunity to meet the market's diverse needs and save production costs with optimized speed and consistency to pack products.

By end-product type, solid segment projected to account for largest market share during forecast period.

The solid segment, by end-product type, is projected to secure a larger market share during the forecast period. Oral solid dosage forms, such as tablets and capsules, are the most commercially popular dosage forms of any medication. One of the main reasons for such prevalence is their economic nature. Compared with a liquid formulation, oral solid doses are cheaper to make and hence appeal to pharmaceutical companies looking to maximize cost-effectiveness in producing a product. Even more simplifying manufacturing processes, solid dosage forms allow for greater efficiency in scaling production and distribution, further contributing to their marketplace dominance. Another key advantage of dosage forms is their stability. They are likely to be more chemically and physically stable than liquids, resulting in a longer shelf life. This stability ensures that the drug lasts longer without degrading, as it is less susceptible to degradation. Moreover, solid dosage forms are easy to store and transport, which is important for globalization. With these features that encompass extended shelf life, making it convenient to handle, both manufacturers and consumers in the pharmaceutical industry prefer oral solid dosage forms.

In 2029, Asia Pacific to dominate pharmaceutical manufacturing equipment market

In 2029, Asia Pacific is projected to account for the largest market share in the global pharmaceutical manufacturing equipment sector, driven primarily by China, Japan, and India. The region has seen significant growth in pharmaceutical exports, fuelling demand for advanced manufacturing equipment that meets international standards. In countries like India, governments have invested significantly in the health sector by providing incentives, subsidies, and other aid, promoting the infrastructure of the pharmaceutical industry. This has led to the majority of the healthcare sector using more updated technologies so that quality medicines are produced continuously. Further, the region offers relatively lower production costs, such as labor and raw materials, making it a more favorable location for pharmaceutical companies to establish their production units. Thus, a company can expand its operations and, at the same time, remain profitable because the cost of production is low. This, in turn, has promoted higher demand for pharmaceutical manufacturing equipment. More pharmaceutical companies are establishing or increasing their operations in the region. This has made Asia Pacific the dominant regional power in the global pharmaceutical manufacturing equipment market, fuelled by government support, cost efficiency, and the increasing prospect of export opportunities.

LARGEST MARKET SHARE IN 2024
INDIA FASTER-GROWING MARKET IN REGION
Pharmaceutical Manufacturing Equipment Market Size and Share

Recent Developments of Pharmaceutical Manufacturing Equipment Market

  • In October 2024, Thermo Fisher Scientific (US) acquired Olink (Sweden), enhancing its proteomics capabilities and strengthening its market position in the life sciences sector, enabling advanced drug discovery and personalized medicine solutions.
  • In October 2024, ACG (India) announced the expansion of its Croatian facility with a USD 54.89 million investment to enhance capsule shell manufacturing and add new warehouse and slitting capabilities, boosting its European presence and supply chain efficiency.
  • In August 2024, I.M.A. INDUSTRIA MACCHINE AUTOMATICHE S.P.A. (Italy) acquired the Packaging Machinery and Packaging Materials divisions of Sarong S.p.A. (Italy). Sarong's Packaging Machinery division specializes in designing, manufacturing, and selling automatic thermoforming Form, Fill & Seal (FFS), and Fill & Seal (FS) packaging machines, primarily serving the pharmaceutical industry with applications also extending to the home and personal care sectors. This acquisition enhances IMA’s capabilities and market reach within these industries, further strengthening its position in automated packaging solutions.
  • In July 2024, GEA Group Aktiengesellschaft (Germany) launched tablet presses with a maximum output capacity exceeding 500,000 tablets per hour; this high-speed, large-scale machine is a noteworthy enhancement to the portfolio. It integrates the benefits of the existing rotary table press lines, offering advanced performance in tablet production.
  • In June 2024, Syntegon Technology GmbH (Germany) introduced a new Settle Plate Changer for automated viable monitoring, which advances environmental monitoring in pharmaceutical settings. This new product and additional flexible liquid-processing solutions aim to meet the pharmaceutical sector's growing demand for advanced, efficient, and automated systems.

Key Market Players

List of Top Pharmaceutical Manufacturing Equipment Market

Want to explore hidden markets that can drive new revenue in Pharmaceutical Manufacturing Equipment Market?

Scope of the Report

Report Attribute Details
Market size available for years 2020–2029
Base year considered 2023
Forecast period 2024–2030
Forecast units Value (USD Million/Billion)
Segments Covered By equipment type, end-product type, process, end user, supplier type, and region
Regions covered North America, Europe, Asia Pacific, and RoW

Key Questions Addressed by the Report

Which are the major companies in the pharmaceutical manufacturing equipment market?
The major players in the pharmaceutical manufacturing equipment market are GEA Group Aktiengesellschaft (Germany), I.M.A. INDUSTRIA MACCHINE AUTOMATICHE S.P.A. (Italy), Thermo Fisher Scientific, Inc. (US), Syntegon Technology GmbH (Germany), and ACG (India).
Which equipment type holds the largest market share in pharmaceutical manufacturing equipment in the forecasted period?
The packaging machines segment holds the largest market share in pharmaceutical manufacturing equipment in the forecast period, which can be attributed to the versatility of packaging machines- from tablets to injectables- allowing manufacturers to meet the market's diverse needs.
What is the current size of the global pharmaceutical manufacturing equipment market?
The global pharmaceutical manufacturing equipment market is estimated to be around USD 19.41 billion in 2024 and is projected to reach USD 26.94 billion by 2029 at a CAGR of 6.8%.
What are the drivers and opportunities for the pharmaceutical manufacturing equipment market?
The rising demand for pharmaceuticals and technological advancements in equipment is a significant driver. The growing implementation & adoption of regulatory guidelines is creating an opportunity for the pharmaceutical manufacturing equipment market.
What are the restraints and challenges for the pharmaceutical manufacturing equipment market?
The demand for refurbished equipment and rising costs and expenditures related to the usage of pharmaceutical manufacturing equipment are the restraints and challenges in the pharmaceutical manufacturing equipment market.


Personalize This Research

  • Triangulate with your Own Data
  • Get Data as per your Format and Definition
  • Gain a Deeper Dive on a Specific Application, Geography, Customer or Competitor
  • Any level of Personalization
Request A Free Customisation

Let Us Help You

  • What are the Known and Unknown Adjacencies Impacting the Pharmaceutical Manufacturing Equipment Market
  • What will your New Revenue Sources be?
  • Who will be your Top Customer; what will make them switch?
  • Defend your Market Share or Win Competitors
  • Get a Scorecard for Target Partners
Customized Workshop Request

Table of Contents

Exclusive indicates content/data unique to MarketsandMarkets and not available with any competitors.

TITLE
PAGE NO
INTRODUCTION
26
RESEARCH METHODOLOGY
30
EXECUTIVE SUMMARY
41
PREMIUM INSIGHTS
44
MARKET OVERVIEW
47
  • 5.1 INTRODUCTION
  • 5.2 MARKET DYNAMICS
    DRIVERS
    - Growing rate of chronic diseases
    - Adoption of modular manufacturing setups
    - Increasing implementation and adoption of regulatory guidelines
    RESTRAINTS
    - Rising adoption of refurbished equipment
    OPPORTUNITIES
    - Growing demand for personalized medicines
    - Rising demand for biopharmaceuticals
    CHALLENGES
    - Adherence to multiple regulations and standards
  • 5.3 TRENDS/DISRUPTIONS IMPACTING CUSTOMER BUSINESS
  • 5.4 PRICING ANALYSIS
    INDICATIVE PRICING OF KEY PLAYERS, BY EQUIPMENT TYPE, 2023
    AVERAGE SELLING PRICE TREND OF PHARMACEUTICAL PACKAGING MACHINES, 2019–2023
    AVERAGE SELLING PRICE TREND, BY REGION, 2019–2023
  • 5.5 VALUE CHAIN ANALYSIS
  • 5.6 ECOSYSTEM ANALYSIS
  • 5.7 IMPACT OF AI/GENERATIVE AI ON PHARMACEUTICAL MANUFACTURING EQUIPMENT MARKET
  • 5.8 TECHNOLOGY ANALYSIS
    KEY TECHNOLOGIES
    - Digital twin
    - Automation and robotics
    - IoT
    COMPLEMENTARY TECHNOLOGIES
    - 3D printing
    ADJACENT TECHNOLOGIES
    - CAD and CAM
  • 5.9 PATENT ANALYSIS
  • 5.10 TRADE ANALYSIS
    IMPORT DATA (HS CODE 842230)
    EXPORT DATA (HS CODE 842230)
  • 5.11 KEY CONFERENCES AND EVENTS, 2025–2026
  • 5.12 CASE STUDIES
    ZAMBON COMPANY S.P.A. AND IMA ACTIVE COLLABORATED ON PROCESS OPTIMIZATION PROJECT TO ENHANCE BATCH CONSISTENCY AND QUALITY
    ACG HELPED INDIAN PHARMACEUTICAL COMPANY RETROFIT B MAX MACHINE WITH NITROGEN-ENHANCED PURGING SYSTEM
    SYNTEGON PROVIDED JIANGSU WITH AIM 5022S PLATFORM TO ENHANCE INSPECTION EFFICIENCY AND ACCURACY
  • 5.13 REGULATIONS LANDSCAPE
    REGULATORY BODIES, GOVERNMENT AGENCIES, AND OTHER ORGANIZATIONS
    STANDARDS
  • 5.14 PORTER'S FIVE FORCES ANALYSIS
    BARGAINING POWER OF SUPPLIERS
    BARGAINING POWER OF BUYERS
    THREAT OF NEW ENTRANTS
    THREAT OF SUBSTITUTES
    INTENSITY OF COMPETITIVE RIVALRY
  • 5.15 KEY STAKEHOLDERS AND BUYING CRITERIA
    KEY STAKEHOLDERS IN BUYING PROCESS
    BUYING CRITERIA
PHARMACEUTICAL MANUFACTURING EQUIPMENT SUPPLIERS AND AFTERMARKET SUPPLIERS
76
  • 6.1 INTRODUCTION
  • 6.2 ORIGINAL EQUIPMENT MANUFACTURERS
  • 6.3 AFTERMARKET SUPPLIERS
MAJOR PHARMACEUTICAL EQUIPMENT MANUFACTURING PROCESSES
78
  • 7.1 INTRODUCTION
  • 7.2 FORMULATION PROCESS
  • 7.3 TABLETING AND ENCAPSULATION PROCESS
  • 7.4 ASEPTIC PROCESS
  • 7.5 PACKAGING PROCESS
  • 7.6 QUALITY CONTROL PROCESS
END USERS OF PHARMACEUTICAL MANUFACTURING EQUIPMENT
82
  • 8.1 INTRODUCTION
  • 8.2 PHARMACEUTICAL MANUFACTURING COMPANIES
  • 8.3 CONTRACT MANUFACTURING ORGANIZATIONS
PHARMACEUTICAL MANUFACTURING EQUIPMENT MARKET, BY END-PRODUCT TYPE
84
  • 9.1 INTRODUCTION
  • 9.2 SOLID
    ONGOING TECHNOLOGICAL INNOVATIONS TO DRIVE MARKET
  • 9.3 LIQUID
    RISING APPLICATION FOR UNSTABLE DRUGS IN SOLID FORM TO BOOST DEMAND
    PHARMACEUTICAL MANUFACTURING EQUIPMENT MARKET, BY EQUIPMENT TYPE
PHARMACEUTICAL MANUFACTURING EQUIPMENT MARKET, BY EQUIPMENT TYPE
90
  • 10.1 INTRODUCTION
  • 10.2 PACKAGING MACHINES
    RISING NEED TO ENSURE PROTECTION AGAINST DAMAGE AND CONTAMINATION TO FUEL MARKET GROWTH
  • 10.3 FILLING MACHINES
    GROWING NEED FOR COMPLIANCE WITH STRINGENT REGULATORY STANDARDS TO FOSTER MARKET GROWTH
  • 10.4 SPRAY DRYING EQUIPMENT
    PRESSING NEED TO PRODUCE HIGH-QUALITY DRUG PRODUCTS TO FUEL MARKET GROWTH
  • 10.5 MIXING AND BLENDING MACHINES
    ABILITY TO PROVIDE CONTROLLED AND CONSISTENT AGITATION AND SHEAR FORCES TO ENSURE HOMOGENEITY OF DRUG FORMULATION TO BOOST DEMAND
  • 10.6 MILLING EQUIPMENT
    RISING NEED TO REDUCE PARTICLE SIZE OF DRUG FORMULATIONS TO FOSTER MARKET GROWTH
  • 10.7 EXTRUSION EQUIPMENT
    ELEVATING USE TO PRODUCE VARIOUS DOSAGE FORMS TO FUEL MARKET GROWTH
  • 10.8 TABLET COMPRESSION PRESSES
    INCREASING PREFERENCE FOR SOLID DOSAGE FORMS TO DRIVE MARKET
  • 10.9 INSPECTION EQUIPMENT
    SURGING NEED TO ENSURE QUALITY AND INTEGRITY OF DRUG PRODUCTS TO FOSTER MARKET GROWTH
  • 10.10 GRANULATION EQUIPMENT
    ABILITY TO IMPROVE OVERALL STABILITY AND BIOAVAILABILITY OF DRUGS TO BOOST DEMAND
  • 10.11 STERILIZATION EQUIPMENT
    GROWING DEMAND FOR CONTAMINATION-FREE DRUGS AND PRODUCTS TO DRIVE MARKET
PHARMACEUTICAL MANUFACTURING EQUIPMENT MARKET, BY REGION
130
  • 11.1 INTRODUCTION
  • 11.2 NORTH AMERICA
    MACROECONOMIC OUTLOOK FOR NORTH AMERICA
    US
    - Government-led initiatives to advance pharmaceutical manufacturing capacity to drive market
    CANADA
    - Rising emphasis on strengthening domestic manufacturing capabilities to foster market growth
    MEXICO
    - Increasing focus on streamlining pharmaceutical regulatory processes to fuel market growth
  • 11.3 EUROPE
    MACROECONOMIC OUTLOOK FOR EUROPE
    UK
    - Rising emphasis on developing advanced manufacturing equipment to offer lucrative growth opportunities
    GERMANY
    - Escalating demand for branded and generic drugs to foster market growth
    FRANCE
    - Government-led policies to encourage investment and innovation in pharmaceutical manufacturing industry to accelerate demand
    ITALY
    - Growing focus on establishing pharmaceutical manufacturing facilities to create significant growth opportunities
    REST OF EUROPE
  • 11.4 ASIA PACIFIC
    MACROECONOMIC OUTLOOK FOR ASIA PACIFIC
    CHINA
    - Surging FDIs and regulatory reforms to streamline drug approvals to offer lucrative growth opportunities
    JAPAN
    - Increasing demand for innovative pharmaceutical manufacturing solutions to fuel market growth
    INDIA
    - Government-led initiatives to strengthen domestic manufacturing to boost demand
    SOUTH KOREA
    - Low import tariffs and enhanced regulatory transparency to attract foreign investments to foster market growth
    REST OF ASIA PACIFIC
  • 11.5 ROW
    MACROECONOMIC OUTLOOK FOR ROW
    MIDDLE EAST
    - Expanding pharmaceutical manufacturing infrastructure to offer growth opportunities
    - GCC
    - Rest of Middle East
    AFRICA
    - Rising investment in local pharmaceutical manufacturing to fuel market growth
    SOUTH AMERICA
    - Introduction of tax incentives to strengthen pharmaceutical manufacturing to support market growth
COMPETITIVE LANDSCAPE
167
  • 12.1 OVERVIEW
  • 12.2 KEY PLAYER STRATEGIES/RIGHT TO WIN, 2022–2024
  • 12.3 REVENUE ANALYSIS, 2019–2023
  • 12.4 MARKET SHARE ANALYSIS, 2023
  • 12.5 COMPANY VALUATION AND FINANCIAL METRICS, 2024
  • 12.6 BRAND/PRODUCT COMPARISON
  • 12.7 COMPANY EVALUATION MATRIX: KEY PLAYERS, 2023
    STARS
    EMERGING LEADERS
    PERVASIVE PLAYERS
    PARTICIPANTS
    COMPANY FOOTPRINT: KEY PLAYERS, 2023
    - Company footprint
    - Region footprint
    - Primary packaging equipment footprint
    - Secondary packaging equipment footprint
    - Type footprint
  • 12.8 COMPANY EVALUATION MATRIX: STARTUPS/SMES, 2023
    PROGRESSIVE COMPANIES
    RESPONSIVE COMPANIES
    DYNAMIC COMPANIES
    STARTING BLOCKS
    COMPETITIVE BENCHMARKING: STARTUPS/SMES, 2023
    - Detailed list of key startups/SMEs
    - Competitive benchmarking of key startups/SMEs
  • 12.9 COMPETITIVE SCENARIO
    PRODUCT LAUNCHES
    DEALS
COMPANY PROFILES
187
  • 13.1 KEY PLAYERS
    GEA GROUP AKTIENGESELLSCHAFT
    - Business overview
    - Products/Solutions/Services offered
    - Recent developments
    - MnM view
    I.M.A INDUSTRIA MACCHINE AUTOMATICHE S.P.A.
    - Business overview
    - Products/Solutions/Services offered
    - Recent developments
    - MnM view
    SYNTEGON TECHNOLOGY GMBH
    - Business overview
    - Products/Solutions/Services offered
    - Recent developments
    - MnM view
    ACG
    - Business overview
    - Products/Solutions/Services offered
    - Recent developments
    - MnM view
    THERMO FISHER SCIENTIFIC INC.
    - Business overview
    - Products/Solutions/Services offered
    - Recent developments
    - MnM view
    ROMACO GROUP
    - Business overview
    - Products/Solutions/Services offered
    - Recent developments
    KÖRBER AG
    - Business overview
    - Products/Solutions/Services offered
    - Recent developments
    MARCHESINI GROUP S.P.A.
    - Business overview
    - Products/Solutions/Services offered
    - Recent developments
    MG2 S.R.L.
    - Business overview
    - Products/Solutions/Services offered
    - Recent developments
    GLATT GMBH
    - Business overview
    - Products/Solutions/Services offered
  • 13.2 OTHER PLAYERS
    BAUSCH+STRÖBEL SE + CO. KG
    COPERION GMBH
    ELIZABETH COMPANIES
    FETTE COMPACTING
    FREUND
    KORSCH AG
    L.B. BOHLE MASCHINEN UND VERFAHREN GMBH
    LFA MACHINES
    CVC TECHNOLOGIES, INC.
    OHARA TECHNOLOGIES
    PRISM PHARMA MACHINERY
    SAINTYCO
    SILVERSON
    YENCHEN MACHINERY CO., LTD
    QUALICAPS
    COESIA S.P.A.
    UHLMANN
    AUTOMATED SYSTEMS OF TACOMA, LLC
APPENDIX
239
  • 14.1 INSIGHTS FROM INDUSTRY EXPERTS
  • 14.2 DISCUSSION GUIDE
  • 14.3 KNOWLEDGESTORE: MARKETSANDMARKETS’ SUBSCRIPTION PORTAL
  • 14.4 CUSTOMIZATION OPTIONS
  • 14.5 RELATED REPORTS
  • 14.6 AUTHOR DETAILS
LIST OF TABLES
 
  • TABLE 1 PHARMACEUTICAL MANUFACTURING EQUIPMENT MARKET: RISK ANALYSIS
  • TABLE 2 INDICATIVE PRICING OF PHARMACEUTICAL MANUFACTURING EQUIPMENT OFFERED BY KEY PLAYERS, BY EQUIPMENT TYPE, 2023 (USD)
  • TABLE 3 AVERAGE SELLING PRICE TREND OF PHARMACEUTICAL PACKAGING MACHINES, 2019–2023 (USD)
  • TABLE 4 AVERAGE SELLING PRICE TREND OF PHARMACEUTICAL PACKAGING MACHINES, BY REGION, 2019–2023 (USD)
  • TABLE 5 ROLES OF COMPANIES IN PHARMACEUTICAL MANUFACTURING EQUIPMENT ECOSYSTEM
  • TABLE 6 LIST OF MAJOR PATENTS
  • TABLE 7 IMPORT DATA FOR HS CODE 842230-COMPLIANT PRODUCTS, BY COUNTRY, 2019–2023 (USD MILLION)
  • TABLE 8 EXPORT DATA FOR HS CODE 842230-COMPLIANT PRODUCTS, BY COUNTRY, 2019–2023 (USD MILLION)
  • TABLE 9 LIST OF KEY CONFERENCES AND EVENTS, 2025–2026
  • TABLE 10 NORTH AMERICA: LIST OF REGULATORY BODIES, GOVERNMENT AGENCIES, AND OTHER ORGANIZATIONS
  • TABLE 11 EUROPE: LIST OF REGULATORY BODIES, GOVERNMENT AGENCIES, AND OTHER ORGANIZATIONS
  • TABLE 12 ASIA PACIFIC: LIST OF REGULATORY BODIES, GOVERNMENT AGENCIES, AND OTHER ORGANIZATIONS
  • TABLE 13 ROW: LIST OF REGULATORY BODIES, GOVERNMENT AGENCIES, AND OTHER ORGANIZATIONS
  • TABLE 14 STANDARDS PERTAINING TO PHARMACEUTICAL MANUFACTURING EQUIPMENT
  • TABLE 15 PHARMACEUTICAL MANUFACTURING EQUIPMENT MARKET: PORTER'S FIVE FORCES ANALYSIS
  • TABLE 16 INFLUENCE OF STAKEHOLDERS ON BUYING PROCESS FOR END-PRODUCT TYPES
  • TABLE 17 KEY BUYING CRITERIA FOR END-PRODUCT TYPES
  • TABLE 18 PHARMACEUTICAL MANUFACTURING EQUIPMENT MARKET, BY END-PRODUCT TYPE, 2020–2023 (USD MILLION)
  • TABLE 19 PHARMACEUTICAL MANUFACTURING EQUIPMENT MARKET, BY END-PRODUCT TYPE, 2024–2029 (USD MILLION)
  • TABLE 20 SOLID: PHARMACEUTICAL MANUFACTURING EQUIPMENT MARKET, BY EQUIPMENT TYPE, 2020–2023 (USD MILLION)
  • TABLE 21 SOLID: PHARMACEUTICAL MANUFACTURING EQUIPMENT MARKET, BY EQUIPMENT TYPE, 2024–2029 (USD MILLION)
  • TABLE 22 LIQUID: PHARMACEUTICAL MANUFACTURING EQUIPMENT MARKET, BY EQUIPMENT TYPE, 2020–2023 (USD MILLION)
  • TABLE 23 LIQUID: PHARMACEUTICAL MANUFACTURING EQUIPMENT MARKET, BY EQUIPMENT TYPE, 2024–2029 (USD MILLION)
  • TABLE 24 PHARMACEUTICAL MANUFACTURING EQUIPMENT MARKET, BY EQUIPMENT TYPE, 2020–2023 (THOUSAND UNITS)
  • TABLE 25 PHARMACEUTICAL MANUFACTURING EQUIPMENT MARKET, BY EQUIPMENT TYPE, 2024–2029 (THOUSAND UNITS)
  • TABLE 26 PHARMACEUTICAL MANUFACTURING EQUIPMENT MARKET, BY EQUIPMENT TYPE, 2020–2023 (USD MILLION)
  • TABLE 27 PHARMACEUTICAL MANUFACTURING EQUIPMENT MARKET, BY EQUIPMENT TYPE, 2024–2029 (USD MILLION)
  • TABLE 28 PACKAGING MACHINES: PHARMACEUTICAL MANUFACTURING EQUIPMENT MARKET, BY END-PRODUCT TYPE, 2020–2023 (USD MILLION)
  • TABLE 29 PACKAGING MACHINES: PHARMACEUTICAL MANUFACTURING EQUIPMENT MARKET, BY END-PRODUCT TYPE, 2024–2029 (USD MILLION)
  • TABLE 30 PACKAGING MACHINES: PHARMACEUTICAL MANUFACTURING EQUIPMENT MARKET, BY REGION, 2020–2023 (USD MILLION)
  • TABLE 31 PACKAGING MACHINES: PHARMACEUTICAL MANUFACTURING EQUIPMENT MARKET, BY REGION, 2024–2029 (USD MILLION)
  • TABLE 32 PACKAGING MACHINES: PHARMACEUTICAL MANUFACTURING EQUIPMENT MARKET IN NORTH AMERICA, BY COUNTRY, 2020–2023 (USD MILLION)
  • TABLE 33 PACKAGING MACHINES: PHARMACEUTICAL MANUFACTURING EQUIPMENT MARKET IN NORTH AMERICA, BY COUNTRY, 2024–2029 (USD MILLION)
  • TABLE 34 PACKAGING MACHINES: PHARMACEUTICAL MANUFACTURING EQUIPMENT MARKET IN EUROPE, BY COUNTRY, 2020–2023 (USD MILLION)
  • TABLE 35 PACKAGING MACHINES: PHARMACEUTICAL MANUFACTURING EQUIPMENT MARKET IN EUROPE, BY COUNTRY, 2024–2029 (USD MILLION)
  • TABLE 36 PACKAGING MACHINES: PHARMACEUTICAL MANUFACTURING EQUIPMENT MARKET IN ASIA PACIFIC, BY COUNTRY, 2020–2023 (USD MILLION)
  • TABLE 37 PACKAGING MACHINES: PHARMACEUTICAL MANUFACTURING EQUIPMENT MARKET IN ASIA PACIFIC, BY COUNTRY, 2024–2029 (USD MILLION)
  • TABLE 38 FILLING MACHINES: PHARMACEUTICAL MANUFACTURING EQUIPMENT MARKET, BY END-PRODUCT TYPE, 2020–2023 (USD MILLION)
  • TABLE 39 FILLING MACHINES: PHARMACEUTICAL MANUFACTURING EQUIPMENT MARKET, BY END-PRODUCT TYPE, 2024–2029 (USD MILLION)
  • TABLE 40 FILLING MACHINES: PHARMACEUTICAL MANUFACTURING EQUIPMENT MARKET, BY REGION, 2020–2023 (USD MILLION)
  • TABLE 41 FILLING MACHINES: PHARMACEUTICAL MANUFACTURING EQUIPMENT MARKET, BY REGION, 2024–2029 (USD MILLION)
  • TABLE 42 FILLING MACHINES: PHARMACEUTICAL MANUFACTURING EQUIPMENT MARKET IN NORTH AMERICA, BY COUNTRY, 2020–2023 (USD MILLION)
  • TABLE 43 FILLING MACHINES: PHARMACEUTICAL MANUFACTURING EQUIPMENT MARKET IN NORTH AMERICA, BY COUNTRY, 2024–2029 (USD MILLION)
  • TABLE 44 FILLING MACHINES: PHARMACEUTICAL MANUFACTURING EQUIPMENT MARKET IN EUROPE, BY COUNTRY, 2020–2023 (USD MILLION)
  • TABLE 45 FILLING MACHINES: PHARMACEUTICAL MANUFACTURING EQUIPMENT MARKET IN EUROPE, BY COUNTRY, 2024–2029 (USD MILLION)
  • TABLE 46 FILLING MACHINES: PHARMACEUTICAL MANUFACTURING EQUIPMENT MARKET IN ASIA PACIFIC, BY COUNTRY, 2020–2023 (USD MILLION)
  • TABLE 47 FILLING MACHINES: PHARMACEUTICAL MANUFACTURING EQUIPMENT MARKET IN ASIA PACIFIC, BY COUNTRY, 2024–2029 (USD MILLION)
  • TABLE 48 SPRAY DRYING EQUIPMENT: PHARMACEUTICAL MANUFACTURING EQUIPMENT MARKET, BY END-PRODUCT TYPE, 2020–2023 (USD MILLION)
  • TABLE 49 SPRAY DRYING EQUIPMENT: PHARMACEUTICAL MANUFACTURING EQUIPMENT MARKET, BY END-PRODUCT TYPE, 2024–2029 (USD MILLION)
  • TABLE 50 SPRAY DRYING EQUIPMENT: PHARMACEUTICAL MANUFACTURING EQUIPMENT MARKET, BY REGION, 2020–2023 (USD MILLION)
  • TABLE 51 SPRAY DRYING EQUIPMENT: PHARMACEUTICAL MANUFACTURING EQUIPMENT MARKET, BY REGION, 2024–2029 (USD MILLION)
  • TABLE 52 SPRAY DRYING EQUIPMENT: PHARMACEUTICAL MANUFACTURING EQUIPMENT MARKET IN NORTH AMERICA, BY COUNTRY, 2020–2023 (USD MILLION)
  • TABLE 53 SPRAY DRYING EQUIPMENT: PHARMACEUTICAL MANUFACTURING EQUIPMENT MARKET IN NORTH AMERICA, BY COUNTRY, 2024–2029 (USD MILLION)
  • TABLE 54 SPRAY DRYING EQUIPMENT: PHARMACEUTICAL MANUFACTURING EQUIPMENT MARKET IN EUROPE, BY COUNTRY, 2020–2023 (USD MILLION)
  • TABLE 55 SPRAY DRYING EQUIPMENT: PHARMACEUTICAL MANUFACTURING EQUIPMENT MARKET IN EUROPE, BY COUNTRY, 2024–2029 (USD MILLION)
  • TABLE 56 SPRAY DRYING EQUIPMENT: PHARMACEUTICAL MANUFACTURING EQUIPMENT MARKET IN ASIA PACIFIC, BY COUNTRY, 2020–2023 (USD MILLION)
  • TABLE 57 SPRAY DRYING EQUIPMENT: PHARMACEUTICAL MANUFACTURING EQUIPMENT MARKET IN ASIA PACIFIC, BY COUNTRY, 2024–2029 (USD MILLION)
  • TABLE 58 MIXING AND BLENDING MACHINES: PHARMACEUTICAL MANUFACTURING EQUIPMENT MARKET, BY END-PRODUCT TYPE, 2020–2023 (USD MILLION)
  • TABLE 59 MIXING AND BLENDING MACHINES: PHARMACEUTICAL MANUFACTURING EQUIPMENT MARKET, BY END-PRODUCT TYPE, 2024–2029 (USD MILLION)
  • TABLE 60 MIXING AND BLENDING MACHINES: PHARMACEUTICAL MANUFACTURING EQUIPMENT MARKET, BY REGION, 2020–2023 (USD MILLION)
  • TABLE 61 MIXING AND BLENDING MACHINES: PHARMACEUTICAL MANUFACTURING EQUIPMENT MARKET, BY REGION, 2024–2029 (USD MILLION)
  • TABLE 62 MIXING AND BLENDING MACHINES: PHARMACEUTICAL MANUFACTURING EQUIPMENT MARKET IN NORTH AMERICA, BY COUNTRY, 2020–2023 (USD MILLION)
  • TABLE 63 MIXING AND BLENDING MACHINES: PHARMACEUTICAL MANUFACTURING EQUIPMENT MARKET IN NORTH AMERICA, BY COUNTRY, 2024–2029 (USD MILLION)
  • TABLE 64 MIXING AND BLENDING MACHINES: PHARMACEUTICAL MANUFACTURING EQUIPMENT MARKET IN EUROPE, BY COUNTRY, 2020–2023 (USD MILLION)
  • TABLE 65 MIXING AND BLENDING MACHINES: PHARMACEUTICAL MANUFACTURING EQUIPMENT MARKET IN EUROPE, BY COUNTRY, 2024–2029 (USD MILLION)
  • TABLE 66 MIXING AND BLENDING MACHINES: PHARMACEUTICAL MANUFACTURING EQUIPMENT MARKET IN ASIA PACIFIC, BY COUNTRY, 2020–2023 (USD MILLION)
  • TABLE 67 MIXING AND BLENDING MACHINES: PHARMACEUTICAL MANUFACTURING EQUIPMENT MARKET IN ASIA PACIFIC, BY COUNTRY, 2024–2029 (USD MILLION)
  • TABLE 68 MILLING EQUIPMENT: PHARMACEUTICAL MANUFACTURING EQUIPMENT MARKET, BY END-PRODUCT TYPE, 2020–2023 (USD MILLION)
  • TABLE 69 MILLING EQUIPMENT: PHARMACEUTICAL MANUFACTURING EQUIPMENT MARKET, BY END-PRODUCT TYPE, 2024–2029 (USD MILLION)
  • TABLE 70 MILLING EQUIPMENT: PHARMACEUTICAL MANUFACTURING EQUIPMENT MARKET, BY REGION, 2020–2023 (USD MILLION)
  • TABLE 71 MILLING EQUIPMENT: PHARMACEUTICAL MANUFACTURING EQUIPMENT MARKET, BY REGION, 2024–2029 (USD MILLION)
  • TABLE 72 MILLING EQUIPMENT: PHARMACEUTICAL MANUFACTURING EQUIPMENT MARKET IN NORTH AMERICA, BY COUNTRY, 2020–2023 (USD MILLION)
  • TABLE 73 MILLING EQUIPMENT: PHARMACEUTICAL MANUFACTURING EQUIPMENT MARKET IN NORTH AMERICA, BY COUNTRY, 2024–2029 (USD MILLION)
  • TABLE 74 MILLING EQUIPMENT: PHARMACEUTICAL MANUFACTURING EQUIPMENT MARKET IN EUROPE, BY COUNTRY, 2020–2023 (USD MILLION)
  • TABLE 75 MILLING EQUIPMENT: PHARMACEUTICAL MANUFACTURING EQUIPMENT MARKET IN EUROPE, BY COUNTRY, 2024–2029 (USD MILLION)
  • TABLE 76 MILLING EQUIPMENT: PHARMACEUTICAL MANUFACTURING EQUIPMENT MARKET IN ASIA PACIFIC, BY COUNTRY, 2020–2023 (USD MILLION)
  • TABLE 77 MILLING EQUIPMENT: PHARMACEUTICAL MANUFACTURING EQUIPMENT MARKET IN ASIA PACIFIC, BY COUNTRY, 2024–2029 (USD MILLION)
  • TABLE 78 EXTRUSION EQUIPMENT: PHARMACEUTICAL MANUFACTURING EQUIPMENT MARKET, BY END-PRODUCT TYPE, 2020–2023 (USD MILLION)
  • TABLE 79 EXTRUSION EQUIPMENT: PHARMACEUTICAL MANUFACTURING EQUIPMENT MARKET, BY END-PRODUCT TYPE, 2024–2029 (USD MILLION)
  • TABLE 80 EXTRUSION EQUIPMENT: PHARMACEUTICAL MANUFACTURING EQUIPMENT MARKET, BY REGION, 2020–2023 (USD MILLION)
  • TABLE 81 EXTRUSION EQUIPMENT: PHARMACEUTICAL MANUFACTURING EQUIPMENT MARKET, BY REGION, 2024–2029 (USD MILLION)
  • TABLE 82 EXTRUSION EQUIPMENT: PHARMACEUTICAL MANUFACTURING EQUIPMENT MARKET IN NORTH AMERICA, BY COUNTRY, 2020–2023 (USD MILLION)
  • TABLE 83 EXTRUSION EQUIPMENT: PHARMACEUTICAL MANUFACTURING EQUIPMENT MARKET IN NORTH AMERICA, BY COUNTRY, 2024–2029 (USD MILLION)
  • TABLE 84 EXTRUSION EQUIPMENT: PHARMACEUTICAL MANUFACTURING EQUIPMENT MARKET IN EUROPE, BY COUNTRY, 2020–2023 (USD MILLION)
  • TABLE 85 EXTRUSION EQUIPMENT: PHARMACEUTICAL MANUFACTURING EQUIPMENT MARKET IN EUROPE, BY COUNTRY, 2024–2029 (USD MILLION)
  • TABLE 86 EXTRUSION EQUIPMENT: PHARMACEUTICAL MANUFACTURING EQUIPMENT MARKET IN ASIA PACIFIC, BY COUNTRY, 2020–2023 (USD MILLION)
  • TABLE 87 EXTRUSION EQUIPMENT: PHARMACEUTICAL MANUFACTURING EQUIPMENT MARKET IN ASIA PACIFIC, BY COUNTRY, 2024–2029 (USD MILLION)
  • TABLE 88 TABLET COMPRESSION PRESSES: PHARMACEUTICAL MANUFACTURING EQUIPMENT MARKET, BY END-PRODUCT TYPE, 2020–2023 (USD MILLION)
  • TABLE 89 TABLET COMPRESSION PRESSES: PHARMACEUTICAL MANUFACTURING EQUIPMENT MARKET, BY END-PRODUCT TYPE, 2024–2029 (USD MILLION)
  • TABLE 90 TABLET COMPRESSION PRESSES: PHARMACEUTICAL MANUFACTURING EQUIPMENT MARKET, BY REGION, 2020–2023 (USD MILLION)
  • TABLE 91 TABLET COMPRESSION PRESSES: PHARMACEUTICAL MANUFACTURING EQUIPMENT MARKET, BY REGION, 2024–2029 (USD MILLION)
  • TABLE 92 TABLET COMPRESSION PRESSES: PHARMACEUTICAL MANUFACTURING EQUIPMENT MARKET IN NORTH AMERICA, BY COUNTRY, 2020–2023 (USD MILLION)
  • TABLE 93 TABLET COMPRESSION PRESSES: PHARMACEUTICAL MANUFACTURING EQUIPMENT MARKET IN NORTH AMERICA, BY COUNTRY, 2024–2029 (USD MILLION)
  • TABLE 94 TABLET COMPRESSION PRESSES: PHARMACEUTICAL MANUFACTURING EQUIPMENT MARKET IN EUROPE, BY COUNTRY, 2020–2023 (USD MILLION)
  • TABLE 95 TABLET COMPRESSION PRESSES: PHARMACEUTICAL MANUFACTURING EQUIPMENT MARKET IN EUROPE, BY COUNTRY, 2024–2029 (USD MILLION)
  • TABLE 96 TABLET COMPRESSION PRESSES: PHARMACEUTICAL MANUFACTURING EQUIPMENT MARKET IN ASIA PACIFIC, BY COUNTRY, 2020–2023 (USD MILLION)
  • TABLE 97 TABLET COMPRESSION PRESSES: PHARMACEUTICAL MANUFACTURING EQUIPMENT MARKET IN ASIA PACIFIC, BY COUNTRY, 2024–2029 (USD MILLION)
  • TABLE 98 INSPECTION EQUIPMENT: PHARMACEUTICAL MANUFACTURING EQUIPMENT MARKET, BY END-PRODUCT TYPE, 2020–2023 (USD MILLION)
  • TABLE 99 INSPECTION EQUIPMENT: PHARMACEUTICAL MANUFACTURING EQUIPMENT MARKET, BY END-PRODUCT TYPE, 2024–2029 (USD MILLION)
  • TABLE 100 INSPECTION EQUIPMENT: PHARMACEUTICAL MANUFACTURING EQUIPMENT MARKET, BY REGION, 2020–2023 (USD MILLION)
  • TABLE 101 INSPECTION EQUIPMENT: PHARMACEUTICAL MANUFACTURING EQUIPMENT MARKET, BY REGION, 2024–2029 (USD MILLION)
  • TABLE 102 INSPECTION EQUIPMENT: PHARMACEUTICAL MANUFACTURING EQUIPMENT MARKET IN NORTH AMERICA, BY COUNTRY, 2020–2023 (USD MILLION)
  • TABLE 103 INSPECTION EQUIPMENT: PHARMACEUTICAL MANUFACTURING EQUIPMENT MARKET IN NORTH AMERICA, BY COUNTRY, 2024–2029 (USD MILLION)
  • TABLE 104 INSPECTION EQUIPMENT: PHARMACEUTICAL MANUFACTURING EQUIPMENT MARKET IN EUROPE, BY COUNTRY, 2020–2023 (USD MILLION)
  • TABLE 105 INSPECTION EQUIPMENT: PHARMACEUTICAL MANUFACTURING EQUIPMENT MARKET IN EUROPE, BY COUNTRY, 2024–2029 (USD MILLION)
  • TABLE 106 INSPECTION EQUIPMENT: PHARMACEUTICAL MANUFACTURING EQUIPMENT MARKET IN ASIA PACIFIC, BY COUNTRY, 2020–2023 (USD MILLION)
  • TABLE 107 INSPECTION EQUIPMENT: PHARMACEUTICAL MANUFACTURING EQUIPMENT MARKET IN ASIA PACIFIC, BY COUNTRY, 2024–2029 (USD MILLION)
  • TABLE 108 GRANULATION EQUIPMENT: PHARMACEUTICAL MANUFACTURING EQUIPMENT MARKET, BY END-PRODUCT TYPE, 2020–2023 (USD MILLION)
  • TABLE 109 GRANULATION EQUIPMENT: PHARMACEUTICAL MANUFACTURING EQUIPMENT MARKET, BY END-PRODUCT TYPE, 2024–2029 (USD MILLION)
  • TABLE 110 GRANULATION EQUIPMENT: PHARMACEUTICAL MANUFACTURING EQUIPMENT MARKET, BY REGION, 2020–2023 (USD MILLION)
  • TABLE 111 GRANULATION EQUIPMENT: PHARMACEUTICAL MANUFACTURING EQUIPMENT MARKET, BY REGION, 2024–2029 (USD MILLION)
  • TABLE 112 GRANULATION EQUIPMENT: PHARMACEUTICAL MANUFACTURING EQUIPMENT MARKET IN NORTH AMERICA, BY COUNTRY, 2020–2023 (USD MILLION)
  • TABLE 113 GRANULATION EQUIPMENT: PHARMACEUTICAL MANUFACTURING EQUIPMENT MARKET IN NORTH AMERICA, BY COUNTRY, 2024–2029 (USD MILLION)
  • TABLE 114 GRANULATION EQUIPMENT: PHARMACEUTICAL MANUFACTURING EQUIPMENT MARKET IN EUROPE, BY COUNTRY, 2020–2023 (USD MILLION)
  • TABLE 115 GRANULATION EQUIPMENT: PHARMACEUTICAL MANUFACTURING EQUIPMENT MARKET IN EUROPE, BY COUNTRY, 2024–2029 (USD MILLION)
  • TABLE 116 GRANULATION EQUIPMENT: PHARMACEUTICAL MANUFACTURING EQUIPMENT MARKET IN ASIA PACIFIC, BY COUNTRY, 2020–2023 (USD MILLION)
  • TABLE 117 GRANULATION EQUIPMENT: PHARMACEUTICAL MANUFACTURING EQUIPMENT MARKET IN ASIA PACIFIC, BY COUNTRY, 2024–2029 (USD MILLION)
  • TABLE 118 STERILIZATION EQUIPMENT: PHARMACEUTICAL MANUFACTURING EQUIPMENT MARKET, BY END-PRODUCT TYPE, 2020–2023 (USD MILLION)
  • TABLE 119 STERILIZATION EQUIPMENT: PHARMACEUTICAL MANUFACTURING EQUIPMENT MARKET, BY END-PRODUCT TYPE, 2024–2029 (USD MILLION)
  • TABLE 120 STERILIZATION EQUIPMENT: PHARMACEUTICAL MANUFACTURING EQUIPMENT MARKET, BY REGION, 2020–2023 (USD MILLION)
  • TABLE 121 STERILIZATION EQUIPMENT: PHARMACEUTICAL MANUFACTURING EQUIPMENT MARKET, BY REGION, 2024–2029 (USD MILLION)
  • TABLE 122 STERILIZATION EQUIPMENT: PHARMACEUTICAL MANUFACTURING EQUIPMENT MARKET IN NORTH AMERICA, BY COUNTRY, 2020–2023 (USD MILLION)
  • TABLE 123 STERILIZATION EQUIPMENT: PHARMACEUTICAL MANUFACTURING EQUIPMENT MARKET IN NORTH AMERICA, BY COUNTRY, 2024–2029 (USD MILLION)
  • TABLE 124 STERILIZATION EQUIPMENT: PHARMACEUTICAL MANUFACTURING EQUIPMENT MARKET IN EUROPE, BY COUNTRY, 2020–2023 (USD MILLION)
  • TABLE 125 STERILIZATION EQUIPMENT: PHARMACEUTICAL MANUFACTURING EQUIPMENT MARKET IN EUROPE, BY COUNTRY, 2024–2029 (USD MILLION)
  • TABLE 126 STERILIZATION EQUIPMENT: PHARMACEUTICAL MANUFACTURING EQUIPMENT MARKET IN ASIA PACIFIC, BY COUNTRY, 2020–2023 (USD MILLION)
  • TABLE 127 STERILIZATION EQUIPMENT: PHARMACEUTICAL MANUFACTURING EQUIPMENT MARKET IN ASIA PACIFIC, BY COUNTRY, 2024–2029 (USD MILLION)
  • TABLE 128 PHARMACEUTICAL MANUFACTURING EQUIPMENT MARKET, BY REGION, 2020–2023 (USD MILLION)
  • TABLE 129 PHARMACEUTICAL MANUFACTURING EQUIPMENT MARKET, BY REGION, 2024–2029 (USD MILLION)
  • TABLE 130 NORTH AMERICA: PHARMACEUTICAL MANUFACTURING EQUIPMENT MARKET, BY COUNTRY, 2020–2023 (USD MILLION)
  • TABLE 131 NORTH AMERICA: PHARMACEUTICAL MANUFACTURING EQUIPMENT MARKET, BY COUNTRY, 2024–2029 (USD MILLION)
  • TABLE 132 NORTH AMERICA: PHARMACEUTICAL MANUFACTURING EQUIPMENT MARKET, BY EQUIPMENT TYPE, 2020–2023 (USD MILLION)
  • TABLE 133 NORTH AMERICA: PHARMACEUTICAL MANUFACTURING EQUIPMENT MARKET, BY EQUIPMENT TYPE, 2024–2029 (USD MILLION)
  • TABLE 134 US: PHARMACEUTICAL MANUFACTURING EQUIPMENT MARKET, BY EQUIPMENT TYPE, 2020–2023 (USD MILLION)
  • TABLE 135 US: PHARMACEUTICAL MANUFACTURING EQUIPMENT MARKET, BY EQUIPMENT TYPE, 2024–2029 (USD MILLION)
  • TABLE 136 CANADA: PHARMACEUTICAL MANUFACTURING EQUIPMENT MARKET, BY EQUIPMENT TYPE, 2020–2023 (USD MILLION)
  • TABLE 137 CANADA: PHARMACEUTICAL MANUFACTURING EQUIPMENT MARKET, BY EQUIPMENT TYPE, 2024–2029 (USD MILLION)
  • TABLE 138 MEXICO: PHARMACEUTICAL MANUFACTURING EQUIPMENT MARKET, BY EQUIPMENT TYPE, 2020–2023 (USD MILLION)
  • TABLE 139 MEXICO: PHARMACEUTICAL MANUFACTURING EQUIPMENT MARKET, BY EQUIPMENT TYPE, 2024–2029 (USD MILLION)
  • TABLE 140 EUROPE: PHARMACEUTICAL MANUFACTURING EQUIPMENT MARKET, BY COUNTRY, 2020–2023 (USD MILLION)
  • TABLE 141 EUROPE: PHARMACEUTICAL MANUFACTURING EQUIPMENT MARKET, BY COUNTRY, 2024–2029 (USD MILLION)
  • TABLE 142 UK: PHARMACEUTICAL MANUFACTURING EQUIPMENT MARKET, BY EQUIPMENT TYPE, 2020–2023 (USD MILLION)
  • TABLE 143 UK: PHARMACEUTICAL MANUFACTURING EQUIPMENT MARKET, BY EQUIPMENT TYPE, 2024–2029 (USD MILLION)
  • TABLE 144 GERMANY: PHARMACEUTICAL MANUFACTURING EQUIPMENT MARKET, BY EQUIPMENT TYPE, 2020–2023 (USD MILLION)
  • TABLE 145 GERMANY: PHARMACEUTICAL MANUFACTURING EQUIPMENT MARKET, BY EQUIPMENT TYPE, 2024–2029 (USD MILLION)
  • TABLE 146 FRANCE: PHARMACEUTICAL MANUFACTURING EQUIPMENT MARKET, BY EQUIPMENT TYPE, 2020–2023 (USD MILLION)
  • TABLE 147 FRANCE: PHARMACEUTICAL MANUFACTURING EQUIPMENT MARKET, BY EQUIPMENT TYPE, 2024–2029 (USD MILLION)
  • TABLE 148 ITALY: PHARMACEUTICAL MANUFACTURING EQUIPMENT MARKET, BY EQUIPMENT TYPE, 2020–2023 (USD MILLION)
  • TABLE 149 ITALY: PHARMACEUTICAL MANUFACTURING EQUIPMENT MARKET, BY EQUIPMENT TYPE, 2024–2029 (USD MILLION)
  • TABLE 150 REST OF EUROPE: PHARMACEUTICAL MANUFACTURING EQUIPMENT MARKET, BY EQUIPMENT TYPE, 2020–2023 (USD MILLION)
  • TABLE 151 REST OF EUROPE: PHARMACEUTICAL MANUFACTURING EQUIPMENT MARKET, BY EQUIPMENT TYPE, 2024–2029 (USD MILLION)
  • TABLE 152 ASIA PACIFIC: PHARMACEUTICAL MANUFACTURING EQUIPMENT MARKET, BY COUNTRY, 2020–2023 (USD MILLION)
  • TABLE 153 ASIA PACIFIC: PHARMACEUTICAL MANUFACTURING EQUIPMENT MARKET, BY COUNTRY, 2024–2029 (USD MILLION)
  • TABLE 154 ASIA PACIFIC: PHARMACEUTICAL MANUFACTURING EQUIPMENT MARKET, BY EQUIPMENT TYPE, 2020–2023 (USD MILLION)
  • TABLE 155 ASIA PACIFIC: PHARMACEUTICAL MANUFACTURING EQUIPMENT MARKET, BY EQUIPMENT TYPE, 2024–2029 (USD MILLION)
  • TABLE 156 CHINA: PHARMACEUTICAL MANUFACTURING EQUIPMENT MARKET, BY EQUIPMENT TYPE, 2020–2023 (USD MILLION)
  • TABLE 157 CHINA: PHARMACEUTICAL MANUFACTURING EQUIPMENT MARKET, BY EQUIPMENT TYPE, 2024–2029 (USD MILLION)
  • TABLE 158 JAPAN: PHARMACEUTICAL MANUFACTURING EQUIPMENT MARKET, BY EQUIPMENT TYPE, 2020–2023 (USD MILLION)
  • TABLE 159 JAPAN: PHARMACEUTICAL MANUFACTURING EQUIPMENT MARKET, BY EQUIPMENT TYPE, 2024–2029 (USD MILLION)
  • TABLE 160 INDIA: PHARMACEUTICAL MANUFACTURING EQUIPMENT MARKET, BY EQUIPMENT TYPE, 2020–2023 (USD MILLION)
  • TABLE 161 INDIA: PHARMACEUTICAL MANUFACTURING EQUIPMENT MARKET, BY EQUIPMENT TYPE, 2024–2029 (USD MILLION)
  • TABLE 162 SOUTH KOREA: PHARMACEUTICAL MANUFACTURING EQUIPMENT MARKET, BY EQUIPMENT TYPE, 2020–2023 (USD MILLION)
  • TABLE 163 SOUTH KOREA: PHARMACEUTICAL MANUFACTURING EQUIPMENT MARKET, BY EQUIPMENT TYPE, 2024–2029 (USD MILLION)
  • TABLE 164 REST OF ASIA PACIFIC: PHARMACEUTICAL MANUFACTURING EQUIPMENT MARKET, BY EQUIPMENT TYPE, 2020–2023 (USD MILLION)
  • TABLE 165 REST OF ASIA PACIFIC: PHARMACEUTICAL MANUFACTURING EQUIPMENT MARKET, BY EQUIPMENT TYPE, 2024–2029 (USD MILLION)
  • TABLE 166 ROW: PHARMACEUTICAL MANUFACTURING EQUIPMENT MARKET, BY REGION, 2020–2023 (USD MILLION)
  • TABLE 167 ROW: PHARMACEUTICAL MANUFACTURING EQUIPMENT MARKET, BY REGION, 2024–2029 (USD MILLION)
  • TABLE 168 ROW: PHARMACEUTICAL MANUFACTURING EQUIPMENT MARKET, BY EQUIPMENT TYPE, 2020–2023 (USD MILLION)
  • TABLE 169 ROW: PHARMACEUTICAL MANUFACTURING EQUIPMENT MARKET, BY EQUIPMENT TYPE, 2024–2029 (USD MILLION)
  • TABLE 170 MIDDLE EAST: PHARMACEUTICAL MANUFACTURING EQUIPMENT MARKET, BY COUNTRY, 2020–2023 (USD MILLION)
  • TABLE 171 MIDDLE EAST: PHARMACEUTICAL MANUFACTURING EQUIPMENT MARKET, BY COUNTRY, 2024–2029 (USD MILLION)
  • TABLE 172 OVERVIEW OF STRATEGIES ADOPTED BY KEY PLAYERS, 2022–2024
  • TABLE 173 PHARMACEUTICAL PACKAGING MACHINES MARKET: DEGREE OF COMPETITION, 2023
  • TABLE 174 PHARMACEUTICAL PACKAGING MACHINES MARKET: REGION FOOTPRINT
  • TABLE 175 PHARMACEUTICAL PACKAGING MACHINES MARKET: PRIMARY PACKAGING EQUIPMENT FOOTPRINT
  • TABLE 176 PHARMACEUTICAL PACKAGING MACHINES MARKET: SECONDARY PACKAGING EQUIPMENT FOOTPRINT
  • TABLE 177 PHARMACEUTICAL PACKAGING MACHINES MARKET: TYPE FOOTPRINT
  • TABLE 178 PHARMACEUTICAL PACKAGING MACHINES MARKET: DETAILED LIST OF KEY STARTUPS/SMES
  • TABLE 179 PHARMACEUTICAL PACKAGING MACHINES MARKET: COMPETITIVE BENCHMARKING OF KEY STARTUPS/SMES
  • TABLE 180 PHARMACEUTICAL MANUFACTURING EQUIPMENT MARKET: PRODUCT LAUNCHES, JANUARY 2022–OCTOBER 2024
  • TABLE 181 PHARMACEUTICAL MANUFACTURING EQUIPMENT MARKET: DEALS, JANUARY 2022–OCTOBER 2024
  • TABLE 182 GEA GROUP AKTIENGESELLSCHAFT: COMPANY OVERVIEW
  • TABLE 183 GEA GROUP AKTIENGESELLSCHAFT: PRODUCTS/SOLUTIONS/SERVICES OFFERED
  • TABLE 184 GEA GROUP AKTIENGESELLSCHAFT: PRODUCT LAUNCHES
  • TABLE 185 GEA GROUP AKTIENGESELLSCHAFT: DEALS
  • TABLE 186 I.M.A INDUSTRIA MACCHINE AUTOMATICHE S.P.A.: COMPANY OVERVIEW
  • TABLE 187 I.M.A INDUSTRIA MACCHINE AUTOMATICHE S.P.A.: PRODUCT/SOLUTIONS/SERVICES OFFERED
  • TABLE 188 I.M.A. INDUSTRIA MACCHINE AUTOMATICHE S.P.A.: DEALS
  • TABLE 189 SYNTEGON TECHNOLOGY GMBH: COMPANY OVERVIEW
  • TABLE 190 SYNTEGON TECHNOLOGY GMBH: PRODUCTS/SOLUTIONS/SERVICES OFFERED
  • TABLE 191 SYNTEGON TECHNOLOGY GMBH: PRODUCT LAUNCHES
  • TABLE 192 SYNTEGON TECHNOLOGY GMBH: DEALS
  • TABLE 193 SYNTEGON TECHNOLOGY GMBH: EXPANSIONS
  • TABLE 194 ACG: COMPANY OVERVIEW
  • TABLE 195 ACG: PRODUCTS/SOLUTIONS/SERVICES OFFERED
  • TABLE 196 ACG: DEALS
  • TABLE 197 ACG: EXPANSIONS
  • TABLE 198 THERMO FISHER SCIENTIFIC INC.: COMPANY OVERVIEW
  • TABLE 199 THERMO FISHER SCIENTIFIC INC.: PRODUCTS/SOLUTIONS/SERVICES OFFERED
  • TABLE 200 THERMO FISHER SCIENTIFIC INC.: DEALS
  • TABLE 201 THERMO FISHER SCIENTIFIC INC.: EXPANSIONS
  • TABLE 202 ROMACO GROUP: COMPANY OVERVIEW
  • TABLE 203 ROMACO GROUP: PRODUCTS/SOLUTIONS/SERVICES OFFERED
  • TABLE 204 ROMACO GROUP: PRODUCT LAUNCHES
  • TABLE 205 ROMACO GROUP: DEALS
  • TABLE 206 KÖRBER AG: COMPANY OVERVIEW
  • TABLE 207 KÖRBER AG: PRODUCTS/SOLUTIONS/SERVICES OFFERED
  • TABLE 208 KÖRBER AG: DEALS
  • TABLE 209 KÖRBER AG: EXPANSIONS
  • TABLE 210 MARCHESINI GROUP S.P.A.: COMPANY OVERVIEW
  • TABLE 211 MARCHESINI GROUP S.P.A.: PRODUCTS/SOLUTIONS/SERVICES OFFERED
  • TABLE 212 MARCHESINI GROUP S.P.A.: PRODUCT LAUNCHES
  • TABLE 213 MARCHESINI GROUP S.P.A.: DEALS
  • TABLE 214 MG2 S.R.L.: COMPANY OVERVIEW
  • TABLE 215 MG2 S.R.L.: PRODUCTS/SOLUTIONS/SERVICES OFFERED
  • TABLE 216 MG2 S.R.L.: PRODUCT LAUNCHES
  • TABLE 217 GLATT GMBH: COMPANY OVERVIEW
  • TABLE 218 GLATT GMBH: PRODUCTS/SOLUTIONS/SERVICES OFFERED
  • TABLE 219 BAUSCH+STRÖBEL SE + CO. KG: COMPANY OVERVIEW
  • TABLE 220 COPERION GMBH: COMPANY OVERVIEW
  • TABLE 221 ELIZABETH COMPANIES: COMPANY OVERVIEW
  • TABLE 222 FETTE COMPACTING: COMPANY OVERVIEW
  • TABLE 223 FREUND: COMPANY OVERVIEW
  • TABLE 224 KORSCH AG: COMPANY OVERVIEW
  • TABLE 225 L.B. BOHLE MASCHINEN UND VERFAHREN GMBH: COMPANY OVERVIEW
  • TABLE 226 LFA MACHINES: COMPANY OVERVIEW
  • TABLE 227 CVC TECHNOLOGIES, INC.: COMPANY OVERVIEW
  • TABLE 228 OHARA TECHNOLOGIES: COMPANY OVERVIEW
  • TABLE 229 PRISM PHARMA MACHINERY: COMPANY OVERVIEW
  • TABLE 230 SAINTYCO: COMPANY OVERVIEW
  • TABLE 231 SILVERSON: COMPANY OVERVIEW
  • TABLE 232 YENCHEN MACHINERY CO., LTD: COMPANY OVERVIEW
  • TABLE 233 QUALICAPS: COMPANY OVERVIEW
  • TABLE 234 COESIA S.P.A.: COMPANY OVERVIEW
  • TABLE 235 UHLMANN: COMPANY OVERVIEW
  • TABLE 236 AUTOMATED SYSTEMS OF TACOMA, LLC: COMPANY OVERVIEW
LIST OF FIGURES
 
  • FIGURE 1 PHARMACEUTICAL MANUFACTURING EQUIPMENT MARKET SEGMENTATION
  • FIGURE 2 PHARMACEUTICAL MANUFACTURING EQUIPMENT MARKET: RESEARCH DESIGN
  • FIGURE 3 MARKET SIZE ESTIMATION METHODOLOGY (SUPPLY SIDE): REVENUE GENERATED FROM PHARMACEUTICAL PACKAGING MACHINES
  • FIGURE 4 PHARMACEUTICAL MANUFACTURING EQUIPMENT MARKET: BOTTOM-UP APPROACH
  • FIGURE 5 PHARMACEUTICAL MANUFACTURING EQUIPMENT MARKET: TOP-DOWN APPROACH
  • FIGURE 6 PHARMACEUTICAL MANUFACTURING EQUIPMENT MARKET: DATA TRIANGULATION
  • FIGURE 7 PHARMACEUTICAL MANUFACTURING EQUIPMENT MARKET: RESEARCH ASSUMPTIONS
  • FIGURE 8 PACKAGING MACHINES TO HOLD DOMINANT MARKET SHARE IN 2029
  • FIGURE 9 SOLID SEGMENT TO CLAIM LARGEST MARKET SHARE IN 2024
  • FIGURE 10 ASIA PACIFIC DOMINATED MARKET IN 2023
  • FIGURE 11 GROWING DEMAND FOR FLEXIBLE PHARMACEUTICAL MANUFACTURING TO OFFER LUCRATIVE GROWTH OPPORTUNITIES
  • FIGURE 12 PACKAGING MACHINES TO REGISTER HIGHEST CAGR DURING FORECAST PERIOD
  • FIGURE 13 LIQUID SEGMENT TO EXHIBIT HIGHER CAGR DURING FORECAST PERIOD
  • FIGURE 14 INDIA TO REGISTER HIGHEST CAGR IN GLOBAL MARKET DURING FORECAST PERIOD
  • FIGURE 15 PHARMACEUTICAL MANUFACTURING EQUIPMENT MARKET: DRIVERS, RESTRAINTS, OPPORTUNITIES, AND CHALLENGES
  • FIGURE 16 PHARMACEUTICAL MANUFACTURING EQUIPMENT MARKET: IMPACT ANALYSIS OF DRIVERS
  • FIGURE 17 PHARMACEUTICAL MANUFACTURING EQUIPMENT MARKET: IMPACT ANALYSIS OF RESTRAINTS
  • FIGURE 18 PHARMACEUTICAL MANUFACTURING EQUIPMENT MARKET: IMPACT ANALYSIS OF OPPORTUNITIES
  • FIGURE 19 PHARMACEUTICAL MANUFACTURING EQUIPMENT MARKET: IMPACT ANALYSIS OF CHALLENGES
  • FIGURE 20 TRENDS/DISRUPTIONS IMPACTING CUSTOMER BUSINESS
  • FIGURE 21 AVERAGE SELLING PRICE TREND OF PHARMACEUTICAL PACKAGING MACHINES, 2019–2023
  • FIGURE 22 AVERAGE SELLING PRICE TREND OF PHARMACEUTICAL PACKAGING MACHINES, BY REGION, 2019–2023
  • FIGURE 23 VALUE CHAIN ANALYSIS
  • FIGURE 24 PHARMACEUTICAL MANUFACTURING EQUIPMENT MARKET ECOSYSTEM ANALYSIS
  • FIGURE 25 IMPACT OF AI/GENERATIVE AI ON PHARMACEUTICAL MANUFACTURING EQUIPMENT MARKET
  • FIGURE 26 PATENTS APPLIED AND GRANTED, 2014–2023
  • FIGURE 27 IMPORT DATA FOR HS CODE 842230-COMPLIANT PRODUCTS, BY COUNTRY, 2019–2023
  • FIGURE 28 EXPORT DATA FOR HS CODE 842230-COMPLIANT PRODUCTS, BY COUNTRY, 2019–2023
  • FIGURE 29 PHARMACEUTICAL MANUFACTURING EQUIPMENT MARKET: PORTER'S FIVE FORCES ANALYSIS
  • FIGURE 30 INFLUENCE OF STAKEHOLDERS IN PHARMACEUTICAL MANUFACTURING EQUIPMENT FOR END-PRODUCT TYPE
  • FIGURE 31 KEY BUYING CRITERIA FOR PHARMACEUTICAL MANUFACTURING EQUIPMENT FOR END-PRODUCT TYPES
  • FIGURE 32 SOLID SEGMENT TO HOLD LARGER MARKET SHARE IN 2024
  • FIGURE 33 PHARMACEUTICAL MANUFACTURING EQUIPMENT MARKET, BY EQUIPMENT TYPE
  • FIGURE 34 PACKAGING MACHINES TO RECORD HIGHEST CAGR DURING FORECAST PERIOD
  • FIGURE 35 PHARMACEUTICAL MANUFACTURING EQUIPMENT MARKET, BY REGION
  • FIGURE 36 ASIA PACIFIC TO ACCOUNT FOR LARGEST MARKET SHARE IN 2024
  • FIGURE 37 NORTH AMERICA: PHARMACEUTICAL MANUFACTURING EQUIPMENT MARKET SNAPSHOT
  • FIGURE 38 EUROPE: PHARMACEUTICAL MANUFACTURING EQUIPMENT MARKET SNAPSHOT
  • FIGURE 39 ASIA PACIFIC: PHARMACEUTICAL MANUFACTURING EQUIPMENT MARKET SNAPSHOT
  • FIGURE 40 SOUTH AMERICA TO DOMINATE MARKET IN ROW REGION IN 2024
  • FIGURE 41 PHARMACEUTICAL PACKAGING MACHINES MARKET: REVENUE ANALYSIS OF KEY PLAYERS, 2019–2023
  • FIGURE 42 MARKET SHARE ANALYSIS OF KEY PLAYERS OFFERING PHARMACEUTICAL PACKAGING MACHINES, 2023
  • FIGURE 43 PHARMACEUTICAL MANUFACTURING EQUIPMENT MARKET: COMPANY VALUATION, 2024
  • FIGURE 44 PHARMACEUTICAL MANUFACTURING EQUIPMENT MARKET: FINANCIAL METRICS (EV/EBITDA), 2024
  • FIGURE 45 PHARMACEUTICAL PACKAGING MACHINES MARKET: BRAND/PRODUCT COMPARISON
  • FIGURE 46 PHARMACEUTICAL PACKAGING MACHINES MARKET: COMPANY EVALUATION MATRIX (KEY PLAYERS), 2023
  • FIGURE 47 PHARMACEUTICAL PACKAGING MACHINES MARKET: COMPANY FOOTPRINT
  • FIGURE 48 PHARMACEUTICAL PACKAGING MACHINES MARKET: COMPANY EVALUATION MATRIX (STARTUPS/SMES), 2023
  • FIGURE 49 GEA GROUP AKTIENGESELLSCHAFT: COMPANY SNAPSHOT
  • FIGURE 50 THERMO FISHER SCIENTIFIC INC.: COMPANY SNAPSHOT
  • FIGURE 51 KÖRBER AG: COMPANY SNAPSHOT

The study involved major activities in estimating the current market size for the pharmaceutical manufacturing equipment market. Exhaustive secondary research was done to collect information on the industry. The next step was to validate these findings, assumptions, and sizing with industry experts across the value chain using primary research. Different approaches, such as top-down and bottom-up, were employed to estimate the total market size. After that, the market breakup and data triangulation procedures were used to estimate the market size of the segments and subsegments of the pharmaceutical manufacturing equipment market.

Secondary Research

The market for the companies offering pharmaceutical manufacturing equipment is arrived at by secondary data available through paid and unpaid sources, analyzing the product portfolios of the major companies in the ecosystem, and rating the companies by their performance and quality. Various sources were referred to in the secondary research process to identify and collect information for this study. The secondary sources include annual reports, press releases, investor presentations of companies, white papers, journals, certified publications, and articles from recognized authors, directories, and databases. In the secondary research process, various secondary sources were referred to for identifying and collecting information related to the study. Secondary sources included annual reports, press releases, and investor presentations of vendors, forums, certified publications, and whitepapers. The secondary research was used to obtain critical information on the industry's value chain, the total pool of key players, market classification, and segmentation from the market and technology-oriented perspectives.

Primary Research

Extensive primary research has been conducted after understanding and analyzing the current scenario of the pharmaceutical manufacturing equipment market through secondary research. Several primary interviews have been conducted with the key opinion leaders from the demand and supply sides across four main regions—North America, Europe, Asia Pacific, and the Rest of World. Approximately 30% of the primary interviews were conducted with the demand-side respondents, while approximately 70% were conducted with the supply-side respondents. The primary data has been collected through questionnaires, emails, and telephone interviews.

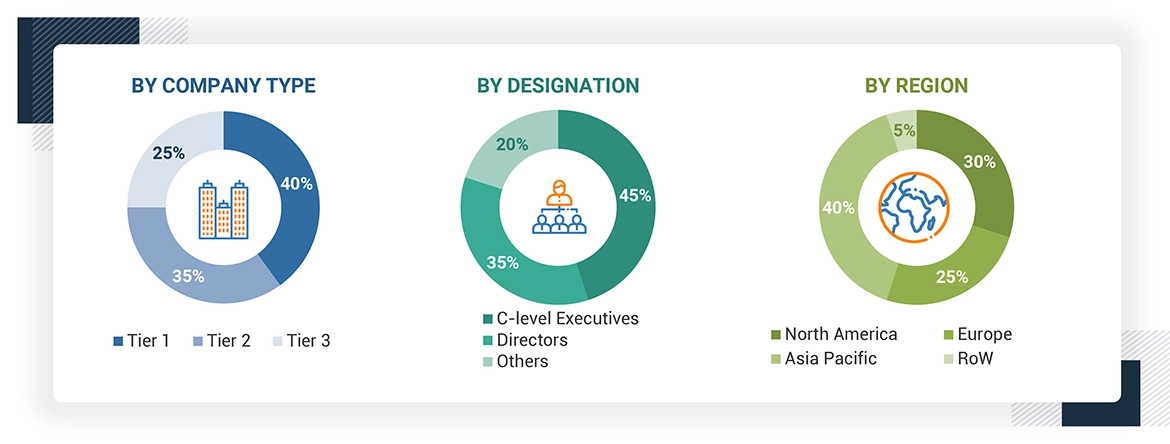
After interacting with industry experts, brief sessions were conducted with highly experienced independent consultants to reinforce the findings from our primary. This, along with the in-house subject matter experts’ opinions, has led us to the findings as described in the remainder of this report. The breakdown of primary respondents is as follows:
Pharmaceutical Manufacturing Equipment Market Size, and Share

To know about the assumptions considered for the study, download the pdf brochure

Market Size Estimation

Both top-down and bottom-up approaches wete used to estimate and validate the total size of the pharmaceutical manufacturing equipment market. These methods were also used extensively to estimate the size of various subsegments in the market. The research methodology used to estimate the market size includes the following:

Pharmaceutical Manufacturing Equipment Market : Top-Down and Bottom-Up Approach

Pharmaceutical Manufacturing Equipment Market Top Down and Bottom Up Approach

Data Triangulation

After arriving at the overall market size using the market size estimation processes as explained above, the market was split into several segments and subsegments. The data triangulation and market breakdown procedures were employed, wherever applicable, to complete the overall market engineering process and arrive at the exact statistics of each market segment and subsegment. The data was triangulated by studying various factors and trends from the demand and supply sides.

Market Definition

Pharmaceutical manufacturing equipment refers to the machinery and instruments used to manufacture pharmaceutical products. Various equipment are used to produce pharmaceutical drugs and solutions, including mixers and blenders, extruders, milling equipment, tablet compression presses, inspection equipment, and packaging machines.

Key Stakeholders

  • End users
  • Government bodies, venture capitalists, and private equity firms
  • Pharmaceutical manufacturing equipment manufacturers
  • Pharmaceutical manufacturing equipment industry associations
  • Professional service/solution providers
  • Research institutions and organizations
  • Standards organizations and regulatory authorities
  • System integrators
  • Technology consultants

Report Objectives

  • To describe and forecast the pharmaceutical manufacturing equipment market, in terms of value, based on equipment type and end-product type
  • To forecast the size of the pharmaceutical manufacturing equipment market in terms of volume
  • To forecast the market size, in terms of value, for four main regions—North America, Europe, Asia Pacific, and the RoW (Rest of the World)
  • To provide detailed information regarding drivers, restraints, opportunities, and challenges influencing the market growth
  • To provide a detailed overview of the value chain of the pharmaceutical manufacturing equipment ecosystem
  • To strategically analyze micromarkets1 with respect to individual growth trends, prospects, and contributions to the total market
  • To analyze the opportunities for stakeholders and details of the competitive landscape of the market
  • To strategically profile the key players and comprehensively analyze their market positions in terms of ranking and core competencies2
  • To analyze the major growth strategies implemented by key market players, such as agreements, acquisitions, product launches, expansions, and partnerships
  • To study the impact of AI on the market under study, along with macroeconomic outlook for each region

Available Customizations

With the given market data, MarketsandMarkets offers customizations according to the specific requirements of companies. The following customization options are available for the report:

  • Detailed analysis and profiling of additional market players based on various blocks of the supply chain

Previous Versions of this Report

Pharmaceutical Manufacturing Equipment Market by Machine (Mixing & Blending, Milling, Spray Drying, Granulation, Extrusion, Tablet Compression, Sterilization, and Inspection), Process (Encapsulation, Formulation, Aseptic) – Global Forecast to 2029

Report Code SE 8645
Published in May, 2023, By MarketsandMarkets™
"Our USP is "providing game-changing business opportunities reports with free customization" - so please feel free to provide us with your specific areas of interest / business challenges in much greater detail !!"

We appreciate your interest in this report. Once you fill out the form, you'll be immediately directed to an exclusive solution tailored to your needs. This high-value offering can help boost your revenue by 30% - a must-see opportunity for anyone looking to maximize growth.


By clicking the "Submit" button, you are agreeing to the Terms of Use and Privacy Policy.

Custom Market Research Services

We Will Customise The Research For You, In Case The Report Listed Above Does Not Meet With Your Requirements

Get 10% Free Customisation

Growth opportunities and latent adjacency in Pharmaceutical Manufacturing Equipment Market

DMCA.com Protection Status