Offshore Support Vessel Market Size, Share, Growth, Analysis

Offshore Support Vessel Market by Technology (AHTS, PSV, MPSV, Standby & Rescue Vessels, Crew Vessels, Chase Vessels, Seismic Vessels), Application (Shallow water, Deepwater), End-user Industry, Material, Fuel Type and Region - Global Forecast to 2029

Report Code: EP 2894 Jun, 2024, by marketsandmarkets.com

[316 Pages Report] The global offshore support vessel market in terms of revenue was estimated to be worth $25.6 billion in 2024 and is poised to reach $36.3 billion by 2029, growing at a CAGR of 7.2% from 2024 to 2029. Government policies and regulations are pivotal drivers shaping the osv market, particularly in the context of addressing pressing environmental challenges and advancing sustainable transportation agendas. Across the globe, governments are increasingly recognizing the urgent need to curb greenhouse gas emissions and mitigate the impacts of climate change. In response, they are enacting stringent regulations aimed at reducing vehicle emissions and promoting the adoption of low-emission alternatives.

Offshore Support Vessel Market

To know about the assumptions considered for the study, Request for Free Sample Report

Offshore Support Vessel Market

To know about the assumptions considered for the study, download the pdf brochure

Offshore Support Vessel Market Dynamics

Driver: Increasing investments in offshore wind and oil & gas projects

The world's escalating population is a significant driver of global energy requirements, anticipated to climb from 8 billion in 2022 to 8.5 billion by 2030, as projected by the UN World Population Prospects. To cater to this surge in energy demand, a diverse array of energy sources—ranging from thermal and nuclear to renewable, oil, gas, and electricity—is essential. Notably, the offshore support vessel market experiences growth propelled by the demand for drilling and production activities stimulated by the discovery of substantial untapped oil reserves, as evidenced by the 1,729.7 billion barrels of oil remaining undiscovered globally in 2018, according to the BP Statistical Review of 2019.

Furthermore, regions with pronounced energy demands, such as the Asia Pacific, are gearing up to enhance their offshore production capacities. Countries like India and China, endowed with offshore oil and gas basins in the Indian Ocean and South China Sea respectively, hold immense potential for offshore exploration activities. Besides the Asia Pacific, notable discoveries are also being made in the offshore regions of Africa, particularly in the western African territories.

Restraint: Constant fluctuations in oil prices and requirement for huge capital to launch offshore support vessels

Oil prices wield significant influence over the demand for diving support vessel market, as they impact the economics of oil and gas operations. Fluctuations in oil prices directly affect the installation costs and profitability of oil and gas ventures. The day rates charged for OSVs are intricately linked to oil prices, necessitating substantial capital investment for the deployment of new vessels. The cyclical nature of oil prices can be attributed to fluctuations in crude demand and the production levels of both OPEC and non-OPEC nations.Furthermore, competition within the oil and gas market, particularly between the US and OPEC countries, along with the emergence of shale gas, has led to a surplus in supply, contributing to the downward pressure on oil prices. The drastic drop in crude prices, halving since June 2014, compelled oil companies to curtail their expenditures, leading to contract delays or cancellations with OSV providers, thereby dampening the uptake of these vessels.

Oil prices have exhibited volatility since the 2014 decline, with a downward trend until 2016, followed by a resurgence in 2017 and 2018, driving demand for production enhancement endeavors. However, prices experienced a dip again in 2019 and 2020, with a marginal uptick observed in the first quarter of 2021.

Opportunities: Increased ultra-deepwater exploration activities, especially in Arctic region

Oil and gas operators are aggressively venturing into uncharted territories, particularly ultra-deepwater regions like the Arctic, in pursuit of new reserves. In 2008, the Circum-Arctic Resource Appraisal (CARA) conducted by the US Geological Survey unveiled staggering estimates: 90 billion barrels of oil, 1,669 trillion cubic feet of natural gas, and 44 billion barrels of natural gas lie potentially within 33 Arctic provinces, with a substantial 84% of these reserves situated offshore. Moreover, the Arctic is believed to harbor approximately 30% of the world's undiscovered gas and 13% of its undiscovered oil resources, as per the US Geological Survey. Such monumental figures necessitate significant investments in the Arctic's exploration and extraction endeavors.

A closer examination by the US Geological Survey reveals that over 70% of these undiscovered oil resources are concentrated in five key provinces—Arctic Alaska, the Amerasia Basin, the East Greenland Rift Basins, the East Barents Basins, and West Greenland–East Canada. The Arctic, witnessing substantial petroleum resource development in recent decades, presents a lucrative landscape for offshore drilling service providers. Offshore drilling services play a pivotal role in navigating the intricate topography of lesser-known Arctic regions, making them indispensable for oil and gas activities in this challenging environment. Anticipated growth in demand for Anchor Handling Tug Supply (AHTS) vessels in the Arctic by 2020 underscores the burgeoning opportunities in this region.

Challenges: Stringent regulations for offshore activities

Government regulations concerning oil and gas field development are progressively tightening, posing challenges for the market. This offshore supply vessel market is characterized by fragmentation and local dominance. Cabotage laws, which regulate shipping and offshore activities within a country's waters, underscore the authority of nations to restrict the operations of foreign vessels within their maritime boundaries. These laws, unique to each country, aim to bolster the participation of local players.

In the Bahamas, cabotage legislation prioritizes job creation for the local populace, while Brazil has enacted several cabotage laws to bolster its domestic industry. Despite these regulatory efforts, the offshore sector in Brazil grapples with meeting Petrobras’ exploration and production (E&P) objectives. Malaysia's Petroleum Development Act and Petroleum Regulations mandate that all offshore support vessel service providers must possess a valid license issued by Petronas Malaysia.

Offshore Support Vessel Market Ecosystem

In this offshore support vessels market, prominent companies stand out as well-established and financially stable providers of offshore support vessel. With years of experience, these companies boast a diverse product portfolio, cutting-edge technologies, and robust global sales and marketing networks. Their proven track record in the industry positions them as reliable and trusted partners for customers seeking offshore support vessel. These companies have demonstrated their ability to adapt to market dynamics and consistently deliver high-quality products and services, making them leaders in meeting the demands of the energy and power sector. Prominent companies in this market A.P. Moller - Maersk (Denmark), Tidewater Inc. (US), BOURBON (France), Edison Chouset Offshore (US), and Deltamarin Ltd (Europe).

Top Companies in Offshore Support Vessel Market

The multipurpose support vessel, by type, is expected to be the fastest growing market during the forecast period.

Multipurpose support vessels (MSVs) are essential for operations in remote and harsh environments, such as deepwater locations, Arctic regions, and ultra-deepwater fields. These vessels are designed with advanced technology and robust construction to withstand extreme conditions like severe weather, high seas, and icy waters. In deepwater locations, MSVs utilize dynamic positioning systems and specialized equipment to perform tasks like drilling and pipeline laying with precision and safety at significant depths. In the Arctic, MSVs are equipped with ice-class hulls, reinforced structures, and winterization measures to navigate ice-covered waters and extreme cold, supporting oil and gas exploration, environmental monitoring, and research. Ultra-deepwater operations benefit from MSVs' cutting-edge technology and high-capacity equipment, which handle immense pressures and technical challenges, ensuring efficient and safe subsea installations and production activities.

By end-user, offshore wind is expected to be the second largest growing segment during the forecast period.

This report segments the offshore support vessel market based on end-user into two segments: offshore oil & gas and offshore wind.  Enhanced operational and maintenance (O&M) strategies, including predictive maintenance and remote monitoring technologies, have improved the reliability and longevity of offshore wind turbines. This reduces downtime and maintenance costs over the lifespan of the project.

North America: The fastest growing region in the offshore support vessel market.

North America is expected to be the fastest growing region in the offshore support vessel market between 2024–2029. Stringent environmental regulations and the growing push for sustainability in offshore operations are significantly reshaping the offshore support vessel service market. Governments and international bodies are implementing increasingly rigorous environmental standards aimed at minimizing the ecological impact of offshore activities. These regulations cover various aspects, from emissions and waste management to the protection of marine biodiversity.

North American Offshore Support Vessel Market Size, and Share

Key Market Players

The osv market is dominated by a few major players that have a wide regional presence. The major players in the offshore support vessel market include A.P. Moller - Maersk (Denmark), Tidewater Inc. (US), BOURBON (France), Edison Chouset Offshore (US), and Deltamarin Ltd (Europe).  Between 2020 and 2024, Strategies such as new product launches, contracts, agreements, partnerships, collaborations, acquisitions, and expansions are followed by these companies to capture a larger offshore support vessel market share.

Want to explore hidden markets that can drive new revenue in Offshore Support Vessel Market?

Scope of the Report

Report Metric

Details

Market size available for years

2019–2029

Base year considered

2023

Forecast period

2024–2029

Forecast units

Value (USD Million)/ Volume (Units)

Segments Covered

Offshore support vessel Market by materials used, fuels used, type, application, end-user and region.                

Geographies covered

North America, Europe, Asia Pacific, and RoW.

Companies covered

A.P. Moller - Maersk (Denmark), Tidewater Inc. (US), BOURBON (France), Edison Chouset Offshore (US), and Deltamarin Ltd (Europe), Østensjø Rederi (Norway), MMA Offshore Limited (Australia), Edison Chouest Offshore (US), Nam Cheong Limited (Malaysia), Group CBO (Brazil), SEACOR Marine (US), Havila Shipping ASA (Norway), POSH (Singapore), Delta marine (Finland), FEG (Singapore), GC Rieber (Norway), Solstad Offshore ASA (Norway), Kawasaki Kisen Kaisha, Ltd. (Tokyo), Harvey Gulf International Marine (US), Hornbeck Offshore (US), M3 MARINE GROUP (Singapore).

This research report categorizes the offshore support vessels market size based on materials used, fuels used, type, application, end-user and region.  

On the basis of materials used, the Offshore support vessel market has been segmented as follows:
  • Offshore support vessel materials
  • Cladding materials
On the basis of fuels used, the Offshore support vessel market has been segmented as follows:
  • Fuel oil
  • Liquified natural gas (LNG)
On the basis of type, the offshore support vessel market has been segmented as follows:
  • Volume-and value-based market analysis
  • Anchor-handling tug supply vessels
  • Platform supply vessels
  • Multipurpose support vessels
  • Standby & rescue vessels
  • Crew vessels
  • Seismic vessels
  • Chase vessels
  • Other vessels
On the basis of application, the offshore support vessel market has been segmented as follows:
  • Shallow water
  • Deepwater
On the basis of end-user industry, the offshore support vessel market has been segmented as follows:
  • Offshore oil & gas
  • Offshore wind
Based on region, the offshore support vessel market has been segmented as follows:
  • North America
  • Europe
  • Asia Pacific
  • RoW

Recent Developments

  • In May 2024, Edison Chouest Offshore has announced the acquisition of ROVOP, a prominent remotely operated vehicle (ROV) company. This acquisition, combined with Chouest's subsea service company, C-Innovation, significantly expands their capabilities, now boasting a fleet of over 100 ROVs and 6 autonomous underwater vehicles (AUVs). Integrating ROVOP into the Chouest family not only broadens Chouest's service portfolio but also provides ROVOP with access to greater resources. ROVOP will benefit from the support and expertise of other Chouest companies, including vessel-based operations, Caltex Oil Tools, Bram Offshore, and C-Innovation. This synergy will enable ROVOP to better serve its existing clients and attract new business with an expanded range of services. This acquisition is a strategic move to enhance Chouest's integrated subsea services, demonstrating its commitment to advancing its technological capabilities and service offerings globally. Chouest looks forward to this new chapter with ROVOP, strengthening its leadership position in the subsea services industry.
  • In May 2024 Deltamarin and ECOLOG have jointly developed a new design for an LCO2 carrier, aimed at tendering at shipyards globally. This design focuses on intra-EU, short-range, low-pressure, and shallow draft specifications. It incorporates LNG dual-fuel propulsion, shore power (AMP), and wind assistance, all of which contribute to minimizing the vessel's environmental footprint.
  • In February 2024, Deltamarin and BAR Technologies have unveiled their new wind-optimized hull design, showcasing their commitment to decarbonization and innovative progress. The co-developed Aframax/LRII design, named Aquilo, marks a significant advancement in performance by combining advanced hull design with WindWings technology. The design features aerodynamic optimization through the strategic positioning of four WindWings and the AeroBridge, an aerodynamically superior deckhouse design. The hull’s main dimensions and characteristics have been tailored for optimal operation with substantial wind assistance, leading to a notable improvement in fuel efficiency.

Frequently Asked Questions (FAQ):

To speak to our analyst for a discussion on the above findings, click Speak to Analyst

Exclusive indicates content/data unique to MarketsandMarkets and not available with any competitors.

INTRODUCTION
27
RESEARCH METHODOLOGY
33
EXECUTIVE SUMMARY
46
PREMIUM INSIGHTS
50
MARKET OVERVIEW
54
  • 5.1 INTRODUCTION
  • 5.2 MARKET DYNAMICS
    DRIVERS
    - Rise in offshore drilling and renewable energy generation
    - Rapid advancement in vessel design and propulsion systems
    RESTRAINTS
    - Fluctuating crude oil prices
    - Price pressures due to supply–demand gap
    - Stringent regulations related to oil and gas field developments
    OPPORTUNITIES
    - Replacement of aging offshore oil and gas infrastructure
    - Increased ultra-deepwater exploration activities in Arctic
    CHALLENGES
    - High operational risks
  • 5.3 TRENDS/DISRUPTIONS IMPACTING CUSTOMERS’ BUSINESSES
  • 5.4 PRICING ANALYSIS
    AVERAGE SELLING PRICE (AVERAGE DAY RATE) TREND OF OFFSHORE SUPPORT VESSELS
    AVERAGE SELLING PRICE (AVERAGE DAY RATE) TREND OF OFFSHORE SUPPORT VESSELS, BY REGION
    AVERAGE SELLING PRICE (AVERAGE DAY RATE) TREND OF OFFSHORE SUPPORT VESSELS, BY TYPE
  • 5.5 VALUE CHAIN ANALYSIS
  • 5.6 ECOSYSTEM ANALYSIS
  • 5.7 REGULATORY LANDSCAPE
    REGULATORY BODIES, GOVERNMENT AGENCIES, AND OTHER ORGANIZATIONS
    REGULATIONS
  • 5.8 PATENT ANALYSIS
  • 5.9 CASE STUDY ANALYSIS
    ALIMAK LEVERAGES TECHNICAL SOLUTIONS TO STREAMLINE VARIABLE TOP LANDING OF ELEVATOR SYSTEMS FOR OFFSHORE VESSELS
    ATZ MARINE TECHNOLOGIES SUPPLIES RETROFIT CLASS-TYPE-APPROVED SEAL TO REDUCE TAIL SHAFT WEAR OF VROON VESSELS
    EIDESVIK OFFSHORE ASA INSTALLS NIDEC ASI’S BESS SYSTEMS TO IMPROVE ENERGY EFFICIENCY OF VESSELS
  • 5.10 TECHNOLOGY ANALYSIS
    KEY TECHNOLOGIES
    - Dynamic positioning systems
    - Advanced navigation systems
    COMPLEMENTARY TECHNOLOGIES
    - Real-time data analytics
    ADJACENT TECHNOLOGIES
    - Unmanned aerial vehicles
    - Augmented reality (AR) and virtual reality (VR)
  • 5.11 KEY CONFERENCES AND EVENTS, 2024–2025
  • 5.12 TRADE ANALYSIS
    HS CODE 72
    - Export scenario
    - Import scenario
    HS CODE 2606
    - Export scenario
    - Import scenario
    HS CODE 7019
    - Export scenario
    - Import scenario
  • 5.13 PORTER’S FIVE FORCES ANALYSIS
    THREAT OF SUBSTITUTES
    BARGAINING POWER OF SUPPLIERS
    BARGAINING POWER OF BUYERS
    THREAT OF NEW ENTRANTS
    INTENSITY OF COMPETITIVE RIVALRY
  • 5.14 KEY STAKEHOLDERS AND BUYING CRITERIA
    KEY STAKEHOLDERS IN BUYING PROCESS
    BUYING CRITERIA
  • 5.15 INVESTMENT AND FUNDING SCENARIO
MATERIALS USED TO BUILD OFFSHORE SUPPORT VESSELS
89
  • 6.1 INTRODUCTION
  • 6.2 CONSTRUCTION MATERIALS
    STEEL
    ALUMINUM
    FIBERGLASS
    COMPOSITE MATERIAL
    WOOD
  • 6.3 CLADDING MATERIALS
    STAINLESS STEEL
    ALUMINUM
    COPPER-NICKEL ALLOY
    TITANIUM
    INCONEL
FUELS USED IN OFFSHORE SUPPORT VESSELS
92
  • 7.1 INTRODUCTION
  • 7.2 FUEL OIL
  • 7.3 LIQUEFIED NATURAL GAS (LNG)
OFFSHORE SUPPORT VESSEL MARKET, BY APPLICATION
93
  • 8.1 INTRODUCTION
  • 8.2 SHALLOW WATER
    EXTENSIVE OIL AND GAS PRODUCTION EFFORTS TO FUEL SEGMENTAL GROWTH
  • 8.3 DEEPWATER
    DEPLETION OF SHALLOW WATER OIL RESERVES TO CONTRIBUTE TO SEGMENTAL GROWTH
OFFSHORE SUPPORT VESSEL MARKET, BY END-USER INDUSTRY
98
  • 9.1 INTRODUCTION
  • 9.2 OIL & GAS
    INCREASING NEED TO SUPPORT DRILLING RIGS AND PRODUCTION PLATFORMS TO BOOST SEGMENTAL GROWTH
  • 9.3 WIND ENERGY
    RISING DEMAND FOR SUSTAINABLE POWER SOURCES TO FOSTER SEGMENTAL GROWTH
OFFSHORE SUPPORT VESSEL MARKET, BY TYPE
103
  • 10.1 INTRODUCTION
  • 10.2 ANCHOR-HANDLING TUG SUPPLY VESSELS
    STABILITY AND SWIFT RESPONSE TO EMERGENCIES TO CONTRIBUTE TO SEGMENTAL GROWTH
  • 10.3 PLATFORM SUPPLY VESSELS
    INCREASED OFFSHORE OIL AND GAS DRILLING OPERATIONS TO FOSTER SEGMENTAL GROWTH
  • 10.4 MULTI-PURPOSE SUPPORT VESSELS
    RISE IN UNDERSEA EXPLORATION TO EXTRACT OIL AND GAS RESOURCES TO ACCELERATE SEGMENTAL GROWTH
  • 10.5 STANDBY & RESCUE VESSELS
    STRICT ADHERENCE TO HEALTH AND SAFETY REGULATIONS TO BOOST SEGMENTAL GROWTH
  • 10.6 CREW VESSELS
    HIGH COMFORT AND FUNCTIONALITY TO FUEL SEGMENTAL GROWTH
  • 10.7 SEISMIC VESSELS
    NEED TO IDENTIFY POTENTIAL OIL AND GAS EXPLORATION SITES TO AUGMENT SEGMENTAL GROWTH
  • 10.8 CHASE VESSELS
    ADOPTION TO REDUCE COLLISION RISKS AND SAFEGUARD SURVEY TOOLS TO DRIVE MARKET
  • 10.9 OTHER VESSELS
OFFSHORE SUPPORT VESSEL MARKET, BY REGION
127
  • 11.1 INTRODUCTION
  • 11.2 ASIA PACIFIC
    RECESSION IMPACT ON OSV MARKET IN ASIA PACIFIC
    CHINA
    - Mounting investment in offshore oil and gas exploration and production projects to foster market growth
    INDIA
    - Rising offshore infrastructure expansion to address oil and gas demand to accelerate market growth
    MALAYSIA
    - Increasing deepwater exploration efforts to contribute to market growth
    THAILAND
    - Rapid transition toward low-carbon economy to facilitate market growth
    VIETNAM
    - Rising investment in deepwater oil and gas projects to augment market growth
    REST OF ASIA PACIFIC
  • 11.3 EUROPE
    RECESSION IMPACT ON OSV MARKET IN EUROPE
    UK
    - Surging demand for offshore wind energy to contribute to market growth
    NORWAY
    - Rising emphasis on boosting wind energy production capacity to drive market
    NETHERLANDS
    - Mounting investment in offshore oil and gas projects to foster market growth
    REST OF EUROPE
  • 11.4 NORTH AMERICA
    RECESSION IMPACT ON OSV MARKET IN NORTH AMERICA
    US
    - Increasing reliance on offshore wind energy to meet renewable energy targets to boost market growth
    CANADA
    - Rising allocation of funds for renewable energy infrastructure development to fuel market growth
    MEXICO
    - Increasing focus on enhancing offshore drilling to facilitate market growth
  • 11.5 SOUTH AMERICA
    RECESSION IMPACT ON OSV MARKET IN SOUTH AMERICA
    BRAZIL
    - Escalating oil production from deepwater and ultra-deepwater reservoirs to augment market growth
    REST OF SOUTH AMERICA
  • 11.6 MIDDLE EAST & AFRICA
    RECESSION IMPACT ON OSV MARKET IN MIDDLE EAST & AFRICA
    GCC
    - Saudi Arabia
    - UAE
    - Qatar
    - Oman
    NIGERIA
    - Rising fiscal incentives for offshore oil operators to fuel market growth
    ANGOLA
    - Increasing deepwater construction activities to boost market growth
    REST OF MIDDLE EAST & AFRICA
COMPETITIVE LANDSCAPE
181
  • 12.1 OVERVIEW
  • 12.2 KEY PLAYER STRATEGIES/RIGHT TO WIN, 2019–2024
  • 12.3 MARKET SHARE ANALYSIS, 2023
  • 12.4 MARKET EVALUATION FRAMEWORK, 2019–2024
  • 12.5 REVENUE ANALYSIS, 2019–2023
  • 12.6 COMPANY VALUATION AND FINANCIAL METRICS
  • 12.7 BRAND/PRODUCT COMPARISON
  • 12.8 COMPANY EVALUATION MATRIX: KEY PLAYERS, 2023
    STARS
    EMERGING LEADERS
    PERVASIVE PLAYERS
    PARTICIPANTS
    COMPANY FOOTPRINT: KEY PLAYERS, 2023
    - Company footprint
    - Region footprint
    - End-user industry footprint
    - Application footprint
    - Type footprint
  • 12.9 COMPETITIVE SCENARIO AND TRENDS
    PRODUCT LAUNCHES
    DEALS
    EXPANSIONS
    OTHERS
COMPANY PROFILES
204
  • 13.1 KEY PLAYERS
    TIDEWATER INC.
    - Business overview
    - Products/Solutions/Services offered
    - Recent developments
    - MnM view
    A.P. MOLLER - MAERSK
    - Business overview
    - Products/Solutions/Services offered
    - Recent developments
    - MnM view
    BOURBON
    - Business overview
    - Products/Solutions/Services offered
    - Recent developments
    - MnM view
    GALLIANO MARINE SERVICE
    - Business overview
    - Products/Solutions/Services offered
    - Recent developments
    - MnM view
    DELTAMARIN LTD
    - Business overview
    - Products/Solutions/Services offered
    - Recent developments
    - MnM view
    SEA1 OFFSHORE
    - Business overview
    - Products/Solutions/Services offered
    - Recent developments
    SOLSTAD OFFSHORE ASA
    - Business overview
    - Products/Solutions/Services offered
    - Recent developments
    DOF
    - Business overview
    - Products/Solutions/Services offered
    - Recent developments
    VROON
    - Business overview
    - Products/Solutions/Services offered
    - Recent developments
    SEACOR MARINE
    - Business overview
    - Products/Solutions/Services offered
    - Recent developments
    HAVILA SHIPPING ASA
    - Business overview
    - Products/Solutions/Services offered
    - Recent developments
    KAWASAKI KISEN KAISHA LTD.
    - Business overview
    - Products/Solutions/Services offered
    - Recent developments
    ØSTENSJØ REDERI
    - Business overview
    - Products/Solutions/Services offered
    - Recent developments
    NAM CHEONG LIMITED
    - Business overview
    - Products/Solutions/Services offered
    MMA OFFSHORE LIMITED
    - Business overview
    - Products/Solutions/Services offered
    - Recent developments
    GRUPO CBO
    - Business overview
    - Products/Solutions/Services offered
    - Recent developments
    POSH
    - Business overview
    - Products/Solutions/Services offered
    VALLIANZ HOLDINGS LIMITED
    - Business overview
    - Products/Solutions/Services offered
    PACIFIC RADIANCE LTD
    - Business overview
    - Products/Solutions/Services offered
  • 13.2 OTHER PLAYERS
    ROYAL IHC
    HARVEY GULF INTERNATIONAL MARINE
    GC RIEBER
    M3 MARINE GROUP
    HORNBECK OFFSHORE
    FEG
    BUMI ARMADA BERHAD
APPENDIX
306
  • 14.1 INSIGHTS FROM INDUSTRY EXPERTS
  • 14.2 DISCUSSION GUIDE
  • 14.3 KNOWLEDGESTORE: MARKETSANDMARKETS’ SUBSCRIPTION PORTAL
  • 14.4 CUSTOMIZATION OPTIONS
  • 14.5 RELATED REPORTS
  • 14.6 AUTHOR DETAILS
LIST OF TABLES
 
  • TABLE 1 OSV MARKET: RISK ASSESSMENT
  • TABLE 2 OFFSHORE SUPPORT VESSEL MARKET SNAPSHOT
  • TABLE 3 MAJOR OFFSHORE PROJECTS AND CONTRACTS
  • TABLE 4 AVERAGE SELLING PRICE (AVERAGE DAY RATE) OF OFFSHORE SUPPORT VESSELS AT NORTH SEA (USD)
  • TABLE 5 AVERAGE SELLING PRICE (AVERAGE DAY RATE) OF OFFSHORE SUPPORT VESSELS, BY REGION, 2019–2023 (USD)
  • TABLE 6 AVERAGE SELLING PRICE (AVERAGE DAY RATE) OF OFFSHORE SUPPORT VESSELS, BY TYPE, 2019–2023 (USD)
  • TABLE 7 ROLE OF COMPANIES IN OFFSHORE SUPPORT VESSEL ECOSYSTEM
  • TABLE 8 ASIA PACIFIC: LIST OF REGULATORY BODIES, GOVERNMENT AGENCIES, AND OTHER ORGANIZATIONS
  • TABLE 9 NORTH AMERICA: LIST OF REGULATORY BODIES, GOVERNMENT AGENCIES, AND OTHER ORGANIZATIONS
  • TABLE 10 EUROPE: LIST OF REGULATORY BODIES, GOVERNMENT AGENCIES, AND OTHER ORGANIZATIONS
  • TABLE 11 SOUTH AMERICA: LIST OF REGULATORY BODIES, GOVERNMENT AGENCIES, AND OTHER ORGANIZATIONS
  • TABLE 12 MIDDLE EAST & AFRICA: LIST OF REGULATORY BODIES, GOVERNMENT AGENCIES, AND OTHER ORGANIZATIONS
  • TABLE 13 REGULATIONS
  • TABLE 14 LIST OF KEY PATENTS, 2018–2023
  • TABLE 15 KEY CONFERENCES AND EVENTS, 2024–2025
  • TABLE 16 EXPORT DATA FOR HS CODE 72-COMPLIANT PRODUCTS, BY COUNTRY, 2021–2023 (USD THOUSAND)
  • TABLE 17 IMPORT DATA FOR HS CODE 72-COMPLIANT PRODUCTS, BY COUNTRY, 2021–2023 (USD THOUSAND)
  • TABLE 18 EXPORT DATA FOR HS CODE 2606-COMPLIANT PRODUCTS, BY COUNTRY, 2021–2023 (USD THOUSAND)
  • TABLE 19 IMPORT DATA FOR HS CODE 2606-COMPLIANT PRODUCTS, BY COUNTRY, 2021–2023 (USD THOUSAND)
  • TABLE 20 EXPORT DATA FOR HS CODE 7019-COMPLIANT PRODUCTS, BY COUNTRY, 2021–2023 (USD THOUSAND)
  • TABLE 21 IMPORT DATA FOR HS CODE 7019-COMPLIANT PRODUCTS, BY COUNTRY, 2021–2023 (USD THOUSAND)
  • TABLE 22 PORTER’S FIVE FORCES ANALYSIS
  • TABLE 23 INFLUENCE OF STAKEHOLDERS ON BUYING PROCESS, BY APPLICATION (%)
  • TABLE 24 KEY BUYING CRITERIA, BY APPLICATION
  • TABLE 25 MARKET, BY APPLICATION, 2019–2023 (USD MILLION)
  • TABLE 26 OFFSHORE SUPPORT VESSEL MARKET, BY APPLICATION, 2024–2029 (USD MILLION)
  • TABLE 27 SHALLOW WATER: OSV MARKET, BY REGION, 2019–2023 (USD MILLION)
  • TABLE 28 SHALLOW WATER: MARKET, BY REGION, 2024–2029 (USD MILLION)
  • TABLE 29 DEEPWATER: OSV MARKET, BY REGION, 2019–2023 (USD MILLION)
  • TABLE 30 DEEPWATER: MARKET, BY REGION, 2024–2029 (USD MILLION)
  • TABLE 31 MARKET, BY END-USER INDUSTRY, 2019–2023 (USD MILLION)
  • TABLE 32 OSV MARKET, BY END-USER INDUSTRY, 2024–2029 (USD MILLION)
  • TABLE 33 OIL & GAS: OSV MARKET, BY REGION, 2019–2023 (USD MILLION)
  • TABLE 34 OIL & GAS: MARKET, BY REGION, 2024–2029 (USD MILLION)
  • TABLE 35 WIND ENERGY: MARKET, BY REGION, 2019–2023 (USD MILLION)
  • TABLE 36 WIND ENERGY: MARKET, BY REGION, 2024–2029 (USD MILLION)
  • TABLE 37 SUPPLY SIDE: MARKET, BY TYPE, 2019–2023 (UNITS)
  • TABLE 38 SUPPLY SIDE: MARKET, BY TYPE, 2024–2029 (UNITS)
  • TABLE 39 DEMAND SIDE: MARKET, BY TYPE, 2019–2023 (UNITS)
  • TABLE 40 DEMAND SIDE: MARKET, BY TYPE, 2024–2029 (UNITS)
  • TABLE 41 OSV MARKET, BY TYPE, 2019–2023 (USD MILLION)
  • TABLE 42 OFFSHORE SUPPORT VESSEL MARKET, BY TYPE, 2024–2029 (USD MILLION)
  • TABLE 43 SUPPLY SIDE: OSV MARKET FOR ANCHOR-HANDLING TUG SUPPLY VESSELS, BY REGION, 2019–2023 (UNITS)
  • TABLE 44 SUPPLY SIDE: MARKET FOR ANCHOR-HANDLING TUG SUPPLY VESSELS, BY REGION, 2024–2029 (UNITS)
  • TABLE 45 DEMAND SIDE: MARKET FOR ANCHOR-HANDLING TUG SUPPLY VESSELS, BY REGION, 2019–2023 (UNITS)
  • TABLE 46 DEMAND SIDE: MARKET FOR ANCHOR-HANDLING TUG SUPPLY VESSELS, BY REGION, 2024–2029 (UNITS)
  • TABLE 47 ANCHOR-HANDLING TUG SUPPLY VESSELS: OSV MARKET, BY REGION, 2019–2023 (USD MILLION)
  • TABLE 48 ANCHOR-HANDLING TUG SUPPLY VESSELS: MARKET, BY REGION, 2024–2029 (USD MILLION)
  • TABLE 49 SUPPLY SIDE: OSV MARKET FOR PLATFORM SUPPLY VESSELS, BY REGION, 2019–2023 (UNITS)
  • TABLE 50 SUPPLY SIDE: MARKET FOR PLATFORM SUPPLY VESSELS, BY REGION, 2024–2029 (UNITS)
  • TABLE 51 DEMAND SIDE: OSV MARKET FOR PLATFORM SUPPLY VESSELS, BY REGION, 2019–2023 (UNITS)
  • TABLE 52 DEMAND SIDE: MARKET FOR PLATFORM SUPPLY VESSELS, BY REGION, 2024–2029 (UNITS)
  • TABLE 53 PLATFORM SUPPLY VESSELS: OSV MARKET, BY REGION, 2019–2023 (USD MILLION)
  • TABLE 54 PLATFORM SUPPLY VESSELS: MARKET, BY REGION, 2024–2029 (USD MILLION)
  • TABLE 55 SUPPLY SIDE: MULTI-PURPOSE SUPPORT VESSEL MARKET, BY REGION, 2019–2023 (UNITS)
  • TABLE 56 SUPPLY SIDE: MULTI-PURPOSE SUPPORT VESSEL MARKET, BY REGION, 2024–2029 (UNITS)
  • TABLE 57 DEMAND SIDE: MULTI-PURPOSE SUPPORT VESSEL MARKET, BY REGION, 2019–2023 (UNITS)
  • TABLE 58 DEMAND SIDE: MULTI-PURPOSE SUPPORT VESSEL MARKET, BY REGION, 2024–2029 (UNITS)
  • TABLE 59 MULTI-PURPOSE SUPPORT VESSELS: OSV MARKET, BY REGION, 2019–2023 (USD MILLION)
  • TABLE 60 MULTI-PURPOSE SUPPORT VESSELS: MARKET, BY REGION, 2024–2029 (USD MILLION)
  • TABLE 61 SUPPLY SIDE: OSV MARKET FOR STANDBY & RESCUE VESSELS, BY REGION, 2019–2023 (UNITS)
  • TABLE 62 SUPPLY SIDE: MARKET FOR STANDBY & RESCUE VESSELS, BY REGION, 2024–2029 (UNITS)
  • TABLE 63 DEMAND SIDE: MARKET FOR STANDBY & RESCUE VESSELS, BY REGION, 2019–2023 (UNITS)
  • TABLE 64 DEMAND SIDE: MARKET FOR STANDBY & RESCUE VESSELS, BY REGION, 2024–2029 (UNITS)
  • TABLE 65 STANDBY & RESCUE VESSELS: OSV MARKET, BY REGION, 2019–2023 (USD MILLION)
  • TABLE 66 STANDBY & RESCUE VESSELS: MARKET, BY REGION, 2024–2029 (USD MILLION)
  • TABLE 67 SUPPLY SIDE: OSV MARKET FOR CREW VESSELS, BY REGION, 2019–2023 (UNITS)
  • TABLE 68 SUPPLY SIDE: MARKET FOR CREW VESSELS, BY REGION, 2024–2029 (UNITS)
  • TABLE 69 DEMAND SIDE: MARKET FOR CREW VESSELS, BY REGION, 2019–2023 (UNITS)
  • TABLE 70 DEMAND SIDE: MARKET FOR CREW VESSELS, BY REGION, 2024–2029 (UNITS)
  • TABLE 71 CREW VESSELS: OSV MARKET, BY REGION, 2019–2023 (USD MILLION)
  • TABLE 72 CREW VESSELS: MARKET, BY REGION, 2024–2029 (USD MILLION)
  • TABLE 73 SUPPLY SIDE: MARKET FOR SEISMIC VESSELS, BY REGION, 2019–2023 (UNITS)
  • TABLE 74 SUPPLY SIDE: MARKET FOR SEISMIC VESSELS, BY REGION, 2024–2029 (UNITS)
  • TABLE 75 DEMAND SIDE: MARKET FOR SEISMIC VESSELS, BY REGION, 2019–2023 (UNITS)
  • TABLE 76 DEMAND SIDE: MARKET FOR SEISMIC VESSELS, BY REGION, 2024–2029 (UNITS)
  • TABLE 77 SEISMIC VESSELS: OSV MARKET, BY REGION, 2019–2023 (USD MILLION)
  • TABLE 78 SEISMIC VESSELS: MARKET, BY REGION, 2024–2029 (USD MILLION)
  • TABLE 79 SUPPLY SIDE: MARKET FOR CHASE VESSELS, BY REGION, 2019–2023 (UNITS)
  • TABLE 80 SUPPLY SIDE: MARKET FOR CHASE VESSELS, BY REGION, 2024–2029 (UNITS)
  • TABLE 81 DEMAND SIDE: OSV MARKET FOR CHASE VESSELS, BY REGION, 2019–2023 (UNITS)
  • TABLE 82 DEMAND SIDE: MARKET FOR CHASE VESSELS, BY REGION, 2024–2029 (UNITS)
  • TABLE 83 CHASE VESSELS: MARKET, BY REGION, 2019–2023 (USD MILLION)
  • TABLE 84 CHASE VESSELS: MARKET, BY REGION, 2024–2029 (USD MILLION)
  • TABLE 85 SUPPLY SIDE: OSV MARKET FOR OTHER VESSELS, BY REGION, 2019–2023 (UNITS)
  • TABLE 86 SUPPLY SIDE: MARKET FOR OTHER VESSELS, BY REGION, 2024–2029 (UNITS)
  • TABLE 87 DEMAND SIDE: MARKET FOR OTHER VESSELS, BY REGION, 2019–2023 (UNITS)
  • TABLE 88 DEMAND SIDE: MARKET FOR OTHER VESSELS, BY REGION, 2024–2029 (UNITS)
  • TABLE 89 OTHER VESSELS: MARKET, BY REGION, 2019–2023 (USD MILLION)
  • TABLE 90 OTHER VESSELS: MARKET, BY REGION, 2024–2029 (USD MILLION)
  • TABLE 91 SUPPLY SIDE: MARKET, BY REGION, 2019–2023 (UNITS)
  • TABLE 92 SUPPLY SIDE: MARKET, BY REGION, 2024–2029 (UNITS)
  • TABLE 93 DEMAND SIDE: MARKET, BY REGION, 2019–2023 (UNITS)
  • TABLE 94 DEMAND SIDE: MARKET, BY REGION, 2024–2029 (UNITS)
  • TABLE 95 OSV MARKET, BY REGION, 2019–2023 (USD MILLION)
  • TABLE 96 OFFSHORE SUPPORT VESSEL MARKET, BY REGION, 2024–2029 (USD MILLION)
  • TABLE 97 SUPPLY SIDE: OSV MARKET IN ASIA PACIFIC, BY TYPE, 2019–2023 (UNITS)
  • TABLE 98 SUPPLY SIDE: MARKET IN ASIA PACIFIC, BY TYPE, 2024–2029 (UNITS)
  • TABLE 99 DEMAND SIDE: MARKET IN ASIA PACIFIC, BY TYPE, 2019–2023 (UNITS)
  • TABLE 100 DEMAND SIDE: MARKET IN ASIA PACIFIC, BY TYPE, 2024–2029 (UNITS)
  • TABLE 101 ASIA PACIFIC: OSV MARKET, BY TYPE, 2019–2023 (USD MILLION)
  • TABLE 102 ASIA PACIFIC: MARKET, BY TYPE, 2024–2029 (USD MILLION)
  • TABLE 103 ASIA PACIFIC: OFFSHORE SUPPORT VESSEL MARKET, BY APPLICATION, 2019–2023 (USD MILLION)
  • TABLE 104 ASIA PACIFIC: MARKET, BY APPLICATION, 2024–2029 (USD MILLION)
  • TABLE 105 ASIA PACIFIC: MARKET, BY END-USER INDUSTRY, 2019–2023 (USD MILLION)
  • TABLE 106 ASIA PACIFIC: MARKET, BY END-USER INDUSTRY, 2024–2029 (USD MILLION)
  • TABLE 107 ASIA PACIFIC: MARKET, BY COUNTRY, 2019–2023 (USD MILLION)
  • TABLE 108 ASIA PACIFIC: MARKET, BY COUNTRY, 2024–2029 (USD MILLION)
  • TABLE 109 CHINA: MARKET, BY END-USER INDUSTRY, 2019–2023 (USD MILLION)
  • TABLE 110 CHINA: OSV MARKET, BY END-USER INDUSTRY, 2024–2029 (USD MILLION)
  • TABLE 111 INDIA: OSV MARKET, BY END-USER INDUSTRY, 2019–2023 (USD MILLION)
  • TABLE 112 INDIA: MARKET, BY END-USER INDUSTRY, 2024–2029 (USD MILLION)
  • TABLE 113 MALAYSIA: MARKET, BY END-USER INDUSTRY, 2019–2023 (USD MILLION)
  • TABLE 114 MALAYSIA: MARKET, BY END-USER INDUSTRY, 2024–2029 (USD MILLION)
  • TABLE 115 THAILAND: OSV MARKET, BY END-USER INDUSTRY, 2019–2023 (USD MILLION)
  • TABLE 116 THAILAND: MARKET, BY END-USER INDUSTRY, 2024–2029 (USD MILLION)
  • TABLE 117 VIETNAM: MARKET, BY END-USER INDUSTRY, 2019–2023 (USD MILLION)
  • TABLE 118 VIETNAM: MARKET, BY END-USER INDUSTRY, 2024–2029 (USD MILLION)
  • TABLE 119 REST OF ASIA PACIFIC: OSV MARKET, BY END-USER INDUSTRY, 2019–2023 (USD MILLION)
  • TABLE 120 REST OF ASIA PACIFIC: MARKET, BY END-USER INDUSTRY, 2024–2029 (USD MILLION)
  • TABLE 121 SUPPLY SIDE: MARKET IN EUROPE, BY TYPE, 2019–2023 (UNITS)
  • TABLE 122 SUPPLY SIDE: MARKET IN EUROPE, BY TYPE, 2024–2029 (UNITS)
  • TABLE 123 DEMAND SIDE: MARKET IN EUROPE, BY TYPE, 2019–2023 (UNITS)
  • TABLE 124 DEMAND SIDE: MARKET IN EUROPE, BY TYPE, 2024–2029 (UNITS)
  • TABLE 125 EUROPE: MARKET, BY TYPE, 2019–2023 (USD MILLION)
  • TABLE 126 EUROPE: OFFSHORE SUPPORT VESSEL MARKET, BY TYPE, 2024–2029 (USD MILLION)
  • TABLE 127 EUROPE: MARKET, BY APPLICATION, 2019–2023 (USD MILLION)
  • TABLE 128 EUROPE: MARKET, BY APPLICATION, 2024–2029 (USD MILLION)
  • TABLE 129 EUROPE: MARKET, BY END-USER INDUSTRY, 2019–2023 (USD MILLION)
  • TABLE 130 EUROPE: MARKET, BY END-USER INDUSTRY, 2024–2029 (USD MILLION)
  • TABLE 131 EUROPE: MARKET, BY COUNTRY, 2019–2023 (USD MILLION)
  • TABLE 132 EUROPE: MARKET, BY COUNTRY, 2024–2029 (USD MILLION)
  • TABLE 133 UK: MARKET, BY END-USER INDUSTRY, 2019–2023 (USD MILLION)
  • TABLE 134 UK: OSV MARKET, BY END-USER INDUSTRY, 2024–2029 (USD MILLION)
  • TABLE 135 NORWAY: MARKET, BY END-USER INDUSTRY, 2019–2023 (USD MILLION)
  • TABLE 136 NORWAY: MARKET, BY END-USER INDUSTRY, 2024–2029 (USD MILLION)
  • TABLE 137 NETHERLANDS: MARKET, BY END-USER INDUSTRY, 2019–2023 (USD MILLION)
  • TABLE 138 NETHERLANDS: MARKET, BY END-USER INDUSTRY, 2024–2029 (USD MILLION)
  • TABLE 139 REST OF EUROPE: OSV MARKET, BY END-USER INDUSTRY, 2019–2023 (USD MILLION)
  • TABLE 140 REST OF EUROPE: MARKET, BY END-USER INDUSTRY, 2024–2029 (USD MILLION)
  • TABLE 141 SUPPLY SIDE: OSV MARKET IN NORTH AMERICA, BY TYPE, 2019–2023 (UNITS)
  • TABLE 142 SUPPLY SIDE: MARKET IN NORTH AMERICA, BY TYPE, 2024–2029 (UNITS)
  • TABLE 143 DEMAND SIDE: MARKET IN NORTH AMERICA, BY TYPE, 2019–2023 (UNITS)
  • TABLE 144 DEMAND SIDE: MARKET IN NORTH AMERICA, BY TYPE, 2024–2029 (UNITS)
  • TABLE 145 NORTH AMERICA: MARKET, BY TYPE, 2019–2023 (USD MILLION)
  • TABLE 146 NORTH AMERICA: OFFSHORE SUPPORT VESSEL MARKET, BY TYPE, 2024–2029 (USD MILLION)
  • TABLE 147 NORTH AMERICA: MARKET, BY APPLICATION, 2019–2023 (USD MILLION)
  • TABLE 148 NORTH AMERICA: MARKET, BY APPLICATION, 2024–2029 (USD MILLION)
  • TABLE 149 NORTH AMERICA: MARKET, BY END-USER INDUSTRY, 2019–2023 (USD MILLION)
  • TABLE 150 NORTH AMERICA: MARKET, BY END-USER INDUSTRY, 2024–2029 (USD MILLION)
  • TABLE 151 NORTH AMERICA: MARKET, BY COUNTRY, 2019–2023 (USD MILLION)
  • TABLE 152 NORTH AMERICA: MARKET, BY COUNTRY, 2024–2029 (USD MILLION)
  • TABLE 153 US: OSV MARKET, BY END-USER INDUSTRY, 2019–2023 (USD MILLION)
  • TABLE 154 US: MARKET, BY END-USER INDUSTRY, 2024–2029 (USD MILLION)
  • TABLE 155 CANADA: MARKET, BY END-USER INDUSTRY, 2019–2023 (USD MILLION)
  • TABLE 156 CANADA: MARKET, BY END-USER INDUSTRY, 2024–2029 (USD MILLION)
  • TABLE 157 MEXICO: OSV MARKET, BY END-USER INDUSTRY, 2019–2023 (USD MILLION)
  • TABLE 158 MEXICO: MARKET, BY END-USER INDUSTRY, 2024–2029 (USD MILLION)
  • TABLE 159 SUPPLY SIDE: MARKET IN SOUTH AMERICA, BY TYPE, 2019–2023 (UNITS)
  • TABLE 160 SUPPLY SIDE: MARKET IN SOUTH AMERICA, BY TYPE, 2024–2029 (UNITS)
  • TABLE 161 DEMAND SIDE: MARKET IN SOUTH AMERICA, BY TYPE, 2019–2023 (UNITS)
  • TABLE 162 DEMAND SIDE: MARKET IN SOUTH AMERICA, BY TYPE, 2024–2029 (UNITS)
  • TABLE 163 SOUTH AMERICA: OFFSHORE SUPPORT VESSEL MARKET, BY TYPE, 2019–2023 (USD MILLION)
  • TABLE 164 SOUTH AMERICA: MARKET, BY TYPE, 2024–2029 (USD MILLION)
  • TABLE 165 SOUTH AMERICA: MARKET, BY APPLICATION, 2019–2023 (USD MILLION)
  • TABLE 166 SOUTH AMERICA: MARKET, BY APPLICATION, 2024–2029 (USD MILLION)
  • TABLE 167 SOUTH AMERICA: MARKET, BY END-USER INDUSTRY, 2019–2023 (USD MILLION)
  • TABLE 168 SOUTH AMERICA: MARKET, BY END-USER INDUSTRY, 2024–2029 (USD MILLION)
  • TABLE 169 SOUTH AMERICA: MARKET, BY COUNTRY, 2019–2023 (USD MILLION)
  • TABLE 170 SOUTH AMERICA: MARKET, BY COUNTRY, 2024–2029 (USD MILLION)
  • TABLE 171 BRAZIL: OSV MARKET, BY END-USER INDUSTRY, 2019–2023 (USD MILLION)
  • TABLE 172 BRAZIL: MARKET, BY END-USER INDUSTRY, 2024–2029 (USD MILLION)
  • TABLE 173 REST OF SOUTH AMERICA: MARKET, BY END-USER INDUSTRY, 2019–2023 (USD MILLION)
  • TABLE 174 REST OF SOUTH AMERICA: MARKET, BY END-USER INDUSTRY, 2024–2029 (USD MILLION)
  • TABLE 175 SUPPLY SIDE: OSV MARKET IN MIDDLE EAST & AFRICA, BY TYPE, 2019–2023 (UNITS)
  • TABLE 176 SUPPLY SIDE: MARKET IN MIDDLE EAST & AFRICA, BY TYPE, 2024–2029 (UNITS)
  • TABLE 177 DEMAND SIDE: MARKET IN MIDDLE EAST & AFRICA, BY TYPE, 2019–2023 (UNITS)
  • TABLE 178 DEMAND SIDE: MARKET IN MIDDLE EAST & AFRICA, BY TYPE, 2024–2029 (UNITS)
  • TABLE 179 MIDDLE EAST & AFRICA: OFFSHORE SUPPORT VESSEL MARKET, BY TYPE, 2019–2023 (USD MILLION)
  • TABLE 180 MIDDLE EAST & AFRICA: MARKET, BY TYPE, 2024–2029 (USD MILLION)
  • TABLE 181 MIDDLE EAST & AFRICA: MARKET, BY APPLICATION, 2019–2023 (USD MILLION)
  • TABLE 182 MIDDLE EAST & AFRICA: MARKET, BY APPLICATION, 2024–2029 (USD MILLION)
  • TABLE 183 MIDDLE EAST & AFRICA: MARKET, BY END-USER INDUSTRY, 2019–2023 (USD MILLION)
  • TABLE 184 MIDDLE EAST & AFRICA: MARKET, BY END-USER INDUSTRY, 2024–2029 (USD MILLION)
  • TABLE 185 MIDDLE EAST & AFRICA: MARKET, BY COUNTRY, 2019–2023 (USD MILLION)
  • TABLE 186 MIDDLE EAST & AFRICA: MARKET, BY COUNTRY, 2024–2029 (USD MILLION)
  • TABLE 187 GCC: OSV MARKET, BY COUNTRY, 2019–2023 (USD MILLION)
  • TABLE 188 GCC: MARKET, BY COUNTRY, 2024–2029 (USD MILLION)
  • TABLE 189 SAUDI ARABIA: MARKET, BY END-USER INDUSTRY, 2019–2023 (USD MILLION)
  • TABLE 190 SAUDI ARABIA: MARKET, BY END-USER INDUSTRY, 2024–2029 (USD MILLION)
  • TABLE 191 UAE: MARKET, BY END-USER INDUSTRY, 2019–2023 (USD MILLION)
  • TABLE 192 UAE: MARKET, BY END-USER INDUSTRY, 2024–2029 (USD MILLION)
  • TABLE 193 QATAR: OSV MARKET, BY END-USER INDUSTRY, 2019–2023 (USD MILLION)
  • TABLE 194 QATAR: MARKET, BY END-USER INDUSTRY, 2024–2029 (USD MILLION)
  • TABLE 195 OMAN: MARKET, BY END-USER INDUSTRY, 2019–2023 (USD MILLION)
  • TABLE 196 OMAN: MARKET, BY END-USER INDUSTRY, 2024–2029 (USD MILLION)
  • TABLE 197 NIGERIA: MARKET, BY END-USER INDUSTRY, 2019–2023 (USD MILLION)
  • TABLE 198 NIGERIA: MARKET, BY END-USER INDUSTRY, 2024–2029 (USD MILLION)
  • TABLE 199 ANGOLA: MARKET, BY END-USER INDUSTRY, 2019–2023 (USD MILLION)
  • TABLE 200 ANGOLA: MARKET, BY END-USER INDUSTRY, 2024–2029 (USD MILLION)
  • TABLE 201 REST OF MIDDLE EAST & AFRICA: OSV MARKET, BY END-USER INDUSTRY, 2019–2023 (USD MILLION)
  • TABLE 202 REST OF MIDDLE EAST & AFRICA: MARKET, BY END-USER INDUSTRY, 2024–2029 (USD MILLION)
  • TABLE 203 OFFSHORE SUPPORT VESSEL MARKET: OVERVIEW OF STRATEGIES ADOPTED BY KEY PLAYERS, 2019–2024
  • TABLE 204 OSV MARKET: DEGREE OF COMPETITION
  • TABLE 205 OSV MARKET EVALUATION FRAMEWORK, 2019–2024
  • TABLE 206 OSV MARKET: REGION FOOTPRINT
  • TABLE 207 OSV MARKET: END-USER INDUSTRY FOOTPRINT
  • TABLE 208 OSV MARKET: APPLICATION FOOTPRINT
  • TABLE 209 OSV MARKET: TYPE FOOTPRINT
  • TABLE 210 OSV MARKET: PRODUCT LAUNCHES, JANUARY 2019–MAY 2024
  • TABLE 211 OSV MARKET: DEALS, JANUARY 2019–MAY 2024
  • TABLE 212 OSV MARKET: EXPANSIONS, JANUARY 2019–MAY 2024
  • TABLE 213 OSV MARKET: OTHERS, JANUARY 2019–MAY 2024
  • TABLE 214 TIDEWATER INC.: COMPANY OVERVIEW
  • TABLE 215 TIDEWATER INC.: PRODUCTS/SOLUTIONS/SERVICES OFFERED
  • TABLE 216 TIDEWATER INC.: DEALS
  • TABLE 217 A.P. MOLLER - MAERSK: COMPANY OVERVIEW
  • TABLE 218 A.P. MOLLER - MAERSK: PRODUCTS/SOLUTIONS/SERVICES OFFERED
  • TABLE 219 A.P. MOLLER - MAERSK: PRODUCT LAUNCHES
  • TABLE 220 A.P. MOLLER - MAERSK: DEALS
  • TABLE 221 A.P. MOLLER - MAERSK: OTHERS
  • TABLE 222 BOURBON: COMPANY OVERVIEW
  • TABLE 223 BOURBON: PRODUCTS/SOLUTIONS/SERVICES OFFERED
  • TABLE 224 BOURBON: PRODUCT LAUNCHES
  • TABLE 225 BOURBON: DEALS
  • TABLE 226 BOURBON: OTHERS
  • TABLE 227 GALLIANO MARINE SERVICE: COMPANY OVERVIEW
  • TABLE 228 GALLIANO MARINE SERVICE: PRODUCTS/SOLUTIONS/SERVICES OFFERED
  • TABLE 229 GALLIANO MARINE SERVICE: DEALS
  • TABLE 230 GALLIANO MARINE SERVICE: EXPANSIONS
  • TABLE 231 DELTAMARINE LTD: COMPANY OVERVIEW
  • TABLE 232 DELTAMARINE LTD: PRODUCTS/SOLUTIONS/SERVICES OFFERED
  • TABLE 233 DELTAMARINE LTD: DEALS
  • TABLE 234 DELTAMARINE LTD: OTHERS
  • TABLE 235 SEA1 OFFSHORE: COMPANY OVERVIEW
  • TABLE 236 SEA1 OFFSHORE: PRODUCTS/SOLUTIONS/SERVICES OFFERED
  • TABLE 237 SEA1 OFFSHORE: PRODUCT LAUNCHES
  • TABLE 238 SEA1 OFFSHORE: DEALS
  • TABLE 239 SEA1 OFFSHORE: OTHERS
  • TABLE 240 SOLSTAD OFFSHORE ASA: COMPANY OVERVIEW
  • TABLE 241 SOLSTAD OFFSHORE ASA: PRODUCTS SOLUTIONS/SERVICES OFFERED
  • TABLE 242 SOLSTAD OFFSHORE ASA: PRODUCT LAUNCHES
  • TABLE 243 SOLSTAD OFFSHORE ASA: DEALS
  • TABLE 244 SOLSTAD OFFSHORE ASA: OTHERS
  • TABLE 245 DOF: COMPANY OVERVIEW
  • TABLE 246 DOF: PRODUCTS/SOLUTIONS/SERVICES OFFERED
  • TABLE 247 DOF: DEALS
  • TABLE 248 DOF: OTHERS
  • TABLE 249 VROON: COMPANY OVERVIEW
  • TABLE 250 VROON: PRODUCTS/SOLUTIONS/SERVICES OFFERED
  • TABLE 251 VROON: DEALS
  • TABLE 252 VROON: OTHERS
  • TABLE 253 SEACOR MARINE: COMPANY OVERVIEW
  • TABLE 254 SEACOR MARINE: PRODUCTS/SOLUTIONS/SERVICES OFFERED
  • TABLE 255 SEACOR MARINE: DEALS
  • TABLE 256 HAVILA SHIPPING ASA: COMPANY OVERVIEW
  • TABLE 257 HAVILA SHIPPING ASA: PRODUCTS/SOLUTIONS/SERVICES OFFERED
  • TABLE 258 HAVILA SHIPPING ASA: OTHERS
  • TABLE 259 KAWASAKI KISEN KAISHA LTD.: COMPANY OVERVIEW
  • TABLE 260 KAWASAKI KISEN KAISHA LTD.: PRODUCTS/SOLUTIONS/SERVICES OFFERED
  • TABLE 261 KAWASAKI KISEN KAISHA LTD.: DEALS
  • TABLE 262 KAWASAKI KISEN KAISHA LTD.: OTHERS
  • TABLE 263 ØSTENSJØ REDERI: COMPANY OVERVIEW
  • TABLE 264 ØSTENSJØ REDERI: PRODUCTS/SOLUTIONS/SERVICES OFFERED
  • TABLE 265 ØSTENSJØ REDERI: DEALS
  • TABLE 266 ØSTENSJØ REDERI: OTHERS
  • TABLE 267 NAM CHEONG LIMITED: COMPANY OVERVIEW
  • TABLE 268 NAM CHEONG LIMITED: PRODUCTS/SOLUTIONS/SERVICES OFFERED
  • TABLE 269 MMA OFFSHORE LIMITED: COMPANY OVERVIEW
  • TABLE 270 MMA OFFSHORE LIMITED: PRODUCTS/SOLUTIONS/SERVICES OFFERED
  • TABLE 271 MMA OFFSHORE LIMITED: DEALS
  • TABLE 272 MMA OFFSHORE LIMITED: OTHERS
  • TABLE 273 GRUPO CBO: COMPANY OVERVIEW
  • TABLE 274 GRUPO CBO: PRODUCTS/SOLUTIONS/SERVICES OFFERED
  • TABLE 275 GRUPO CBO: DEALS
  • TABLE 276 POSH: COMPANY OVERVIEW
  • TABLE 277 POSH: PRODUCTS/SOLUTIONS/SERVICES OFFERED
  • TABLE 278 VALLIANZ HOLDINGS LIMITED: COMPANY OVERVIEW
  • TABLE 279 VALLIANZ HOLDINGS LIMITED: PRODUCTS/SOLUTIONS/SERVICES OFFERED
  • TABLE 280 PACIFIC RADIANCE LTD: COMPANY OVERVIEW
  • TABLE 281 PACIFIC RADIANCE LTD: PRODUCTS/SOLUTIONS/SERVICES OFFERED
LIST OF FIGURES
 
  • FIGURE 1 OFFSHORE SUPPORT VESSEL MARKET SEGMENTATION
  • FIGURE 2 OFFSHORE SUPPORT VESSEL MARKET: RESEARCH DESIGN
  • FIGURE 3 MARKET: DATA TRIANGULATION
  • FIGURE 4 OSV MARKET: BOTTOM-UP APPROACH
  • FIGURE 5 OSV MARKET: TOP-DOWN APPROACH
  • FIGURE 6 KEY METRICS CONSIDERED TO ANALYZE DEMAND FOR OFFSHORE SUPPORT VESSELS
  • FIGURE 7 KEY METRICS CONSIDERED TO ANALYZE SUPPLY OF OFFSHORE SUPPORT VESSELS
  • FIGURE 8 OSV MARKET: SUPPLY-SIDE ANALYSIS
  • FIGURE 9 ANCHOR-HANDLING TUG SUPPLY VESSELS TO DOMINATE OSV MARKET, BY TYPE, DURING FORECAST PERIOD
  • FIGURE 10 SHALLOW WATER TO HOLD LARGER SHARE OF OSV MARKET, BY APPLICATION, IN 2029
  • FIGURE 11 WIND ENERGY TO EXHIBIT HIGHER CAGR IN OSV MARKET, BY END-USER INDUSTRY, BETWEEN 2024 AND 2029
  • FIGURE 12 ASIA PACIFIC ACCOUNTED FOR LARGEST SHARE OF GLOBAL OSV MARKET IN 2023
  • FIGURE 13 INCREASING DEEPWATER EXPLORATION AND OFFSHORE WIND FARM CONSTRUCTION TO DRIVE OSV MARKET
  • FIGURE 14 ANCHOR-HANDLING TUG SUPPLY VESSELS SEGMENT ACCOUNTED FOR LARGEST OSV MARKET SHARE IN 2023
  • FIGURE 15 SHALLOW WATER SEGMENT HELD LARGER SHARE OF OSV MARKET IN 2023
  • FIGURE 16 OIL & GAS SEGMENT ACCOUNTED FOR LARGER OSV MARKET SHARE IN 2023
  • FIGURE 17 OIL & GAS SEGMENT AND CHINA HELD LARGEST SHARES OF ASIA PACIFIC OSV MARKET IN 2023
  • FIGURE 18 NORTH AMERICA TO RECORD HIGHEST CAGR IN GLOBAL OFFSHORE SUPPORT VESSEL MARKET FROM 2024 TO 2029
  • FIGURE 19 DRIVERS, RESTRAINTS, OPPORTUNITIES, AND CHALLENGES
  • FIGURE 20 CUMULATIVE INSTALLED OFFSHORE WIND CAPACITY IN EUROPE, 2011–2022 (MW)
  • FIGURE 21 CUMULATIVE INSTALLED OFFSHORE WIND ENERGY CAPACITY, BY SEA BASIN, 2020 (MW)
  • FIGURE 22 WEST TEXAS INTERMEDIATE (WTI) CRUDE OIL PRICES, JANUARY 2018–MARCH 2023 (USD/BARREL)
  • FIGURE 23 AVERAGE VESSEL UTILIZATION RATE, BY TYPE, JANUARY 2023
  • FIGURE 24 TRENDS/DISRUPTIONS IMPACTING CUSTOMERS’ BUSINESSES
  • FIGURE 25 AVERAGE SELLING PRICE (AVERAGE DAY RATE) OF OFFSHORE SUPPORT VESSELS, BY REGION, 2019–2023 (USD)
  • FIGURE 26 AVERAGE SELLING PRICE (AVERAGE DAY RATE) OF OFFSHORE SUPPORT VEHICLES, BY TYPE, 2019–2023 (USD)
  • FIGURE 27 VALUE CHAIN ANALYSIS
  • FIGURE 28 ECOSYSTEM ANALYSIS
  • FIGURE 29 PATENTS APPLIED AND GRANTED, 2013–2023
  • FIGURE 30 EXPORT DATA FOR HS CODE 72-COMPLIANT PRODUCTS FOR TOP 5 COUNTRIES, 2021–2023 (USD THOUSAND)
  • FIGURE 31 IMPORT DATA FOR HS CODE 72-COMPLIANT PRODUCTS FOR TOP 5 COUNTRIES, 2021–2023 (USD THOUSAND)
  • FIGURE 32 EXPORT DATA FOR HS CODE 2606-COMPLIANT PRODUCTS FOR TOP 5 COUNTRIES, 2021–2023 (USD THOUSAND)
  • FIGURE 33 IMPORT DATA FOR HS CODE 2606-COMPLIANT PRODUCTS FOR TOP 5 COUNTRIES, 2021–2023 (USD THOUSAND)
  • FIGURE 34 EXPORT DATA FOR HS CODE 7019-COMPLIANT PRODUCTS FOR TOP 5 COUNTRIES, 2021–2023 (USD THOUSAND)
  • FIGURE 35 IMPORT DATA FOR HS CODE 7019-COMPLIANT PRODUCTS FOR TOP 5 COUNTRIES, 2021–2023 (USD THOUSAND)
  • FIGURE 36 PORTER’S FIVE FORCES ANALYSIS
  • FIGURE 37 INFLUENCE OF KEY STAKEHOLDERS ON BUYING PROCESS, BY APPLICATION
  • FIGURE 38 KEY BUYING CRITERIA, BY APPLICATION
  • FIGURE 39 INVESTMENT AND FUNDING SCENARIO (USD MILLION)
  • FIGURE 40 OFFSHORE SUPPORT VESSEL MARKET SHARE, BY APPLICATION, 2023
  • FIGURE 41 OFFSHORE SUPPORT VESSEL MARKET SHARE, BY END-USER INDUSTRY, 2023
  • FIGURE 42 OFFSHORE SUPPORT VESSEL MARKET SHARE, BY TYPE, 2023
  • FIGURE 43 OFFSHORE SUPPORT VESSEL MARKET SHARE, BY REGION, 2023
  • FIGURE 44 NORTH AMERICA TO REGISTER HIGHEST CAGR IN GLOBAL OFFSHORE SUPPORT VESSEL MARKET DURING FORECAST PERIOD
  • FIGURE 45 ASIA PACIFIC: OSV MARKET SNAPSHOT
  • FIGURE 46 EUROPE: OSV MARKET SNAPSHOT
  • FIGURE 47 OFFSHORE SUPPORT VESSEL MARKET SHARE ANALYSIS, 2023
  • FIGURE 48 OSV MARKET: REVENUE ANALYSIS OF TWO KEY PLAYERS, 2019–2023 (USD MILLION)
  • FIGURE 49 COMPANY VALUATION, 2024 (USD MILLION)
  • FIGURE 50 FINANCIAL METRICS, 2024 (EV/EBITDA)
  • FIGURE 51 BRAND/PRODUCT COMPARISON
  • FIGURE 52 OSV MARKET: COMPANY EVALUATION MATRIX (KEY PLAYERS), 2023
  • FIGURE 53 OFFSHORE SUPPORT VESSEL: COMPANY FOOTPRINT
  • FIGURE 54 OFFSHORE SUPPORT VESSEL: MARKET FOOTPRINT
  • FIGURE 55 TIDEWATER INC.: COMPANY SNAPSHOT
  • FIGURE 56 A.P. MOLLER - MAERSK: COMPANY SNAPSHOT
  • FIGURE 57 SEA1 OFFSHORE: COMPANY SNAPSHOT
  • FIGURE 58 SOLSTAD OFFSHORE ASA: COMPANY SNAPSHOT
  • FIGURE 59 DOF: COMPANY SNAPSHOT
  • FIGURE 60 SEACOR MARINE: COMPANY SNAPSHOT
  • FIGURE 61 HAVILA SHIPPING ASA: COMPANY SNAPSHOT
  • FIGURE 62 KAWASAKI KISEN KAISHA LTD.: COMPANY SNAPSHOT
  • FIGURE 63 NAM CHEONG LIMITED: COMPANY SNAPSHOT
  • FIGURE 64 MMA OFFSHORE LIMITED: COMPANY SNAPSHOT
  • FIGURE 65 VALLIANZ HOLDINGS LIMITED: COMPANY SNAPSHOT
  • FIGURE 66 PACIFIC RADIANCE LTD: COMPANY SNAPSHOT


The study involved major activities in estimating the current size of the offshore support vessel market. Exhaustive secondary research was done to collect information on the peer and parent markets. The next step was to validate these findings, assumptions, and sizing with industry experts across the value chain through primary research. Both top-down and bottom-up approaches were employed to estimate the total market size. Thereafter, market breakdown and data triangulation were used to estimate the market size of the segments and subsegments.

Secondary Research

This research study on the osv market involved the use of extensive secondary sources, directories, and databases, such as Hoover’s, Bloomberg, Factiva, IRENA, International Energy Agency, and Statista Industry Journal, to collect and identify information useful for a technical, market-oriented, and commercial study of the osv market. The other secondary sources included annual reports, press releases & investor presentations of companies, white papers, certified publications, articles by recognized authors, manufacturer associations, trade directories, and databases.

Primary Research

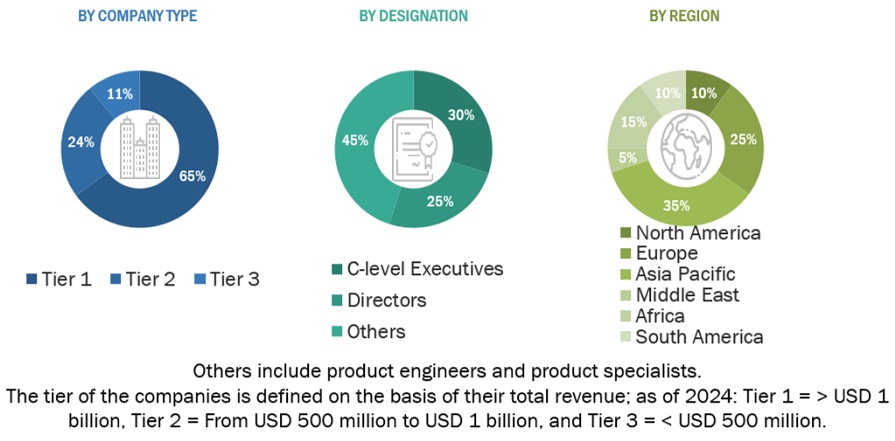
The osv market comprises several stakeholders, such as offshore support vessel manufacturers, technology providers, and technical support providers in the supply chain. The demand side of this market is characterized by the rising demand for storage solutions in various applications such as energy, mobility, industrial, and transportation. The supply side is characterized by rising demand for contracts from the industrial sector and mergers & acquisitions among big players. Various primary sources from both the supply and demand sides of the market were interviewed to obtain qualitative and quantitative information. Following is the breakdown of primary respondents:
Offshore Support Vessel Market Size, and Share

To know about the assumptions considered for the study, download the pdf brochure

Offshore Support Vessel Market Size Estimation

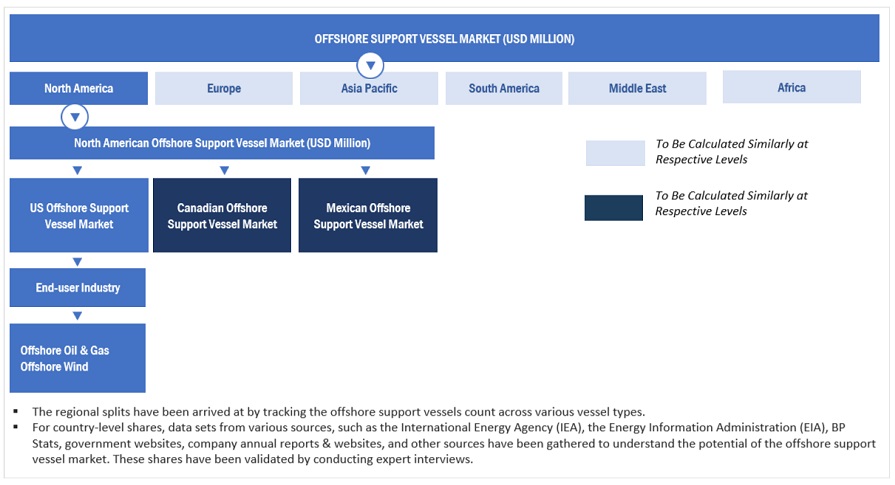
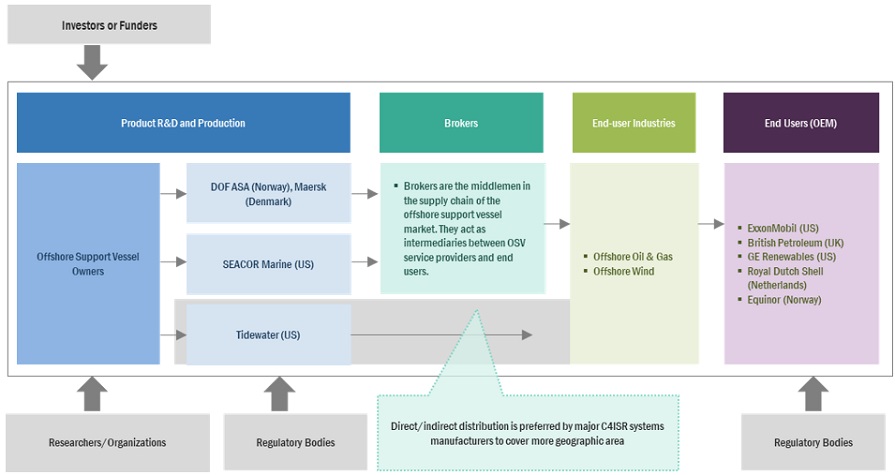
Both top-down and bottom-up approaches were used to estimate and validate the total size of the osv market. These methods were also used extensively to estimate the size of various subsegments in the market. The research methodology used to estimate the market size includes the following:

  • The key players in the industry and market have been identified through extensive secondary research, and their market share has been determined through primary and secondary research.
  • The industry’s value chain and market size, in terms of value, have been determined through both primary and secondary research processes.
  • All percentage shares, splits, and breakdowns have been determined using secondary sources and verified through primary sources.  

Offshore Support Vessel Market Size: Top-Down Approach
Offshore Support Vessel Market Top Down Approach

To know about the assumptions considered for the study, Request for Free Sample Report

Offshore Support Vessel Market Size: Bottom-Up Approach
Offshore Support Vessel Market Bottom Up Approach

Data Triangulation

After arriving at the overall market size from the above estimation process, the total market has been split into several segments and subsegments. Data triangulation and market breakdown processes have been employed to complete the overall market engineering process and arrive at the exact statistics for all the segments and sub-segments, wherever applicable. The data has been triangulated by studying various factors and trends from both the demand- and supply sides. Along with this, the market has been validated using both the top-down and bottom-up approaches.

Market Definition

An offshore support vessel (OSV) is specially designed to support offshore exploration, drilling, production, and construction activities in the oil & gas industry. These vessels provide a range of services, such as transportation of personnel, equipment and supplies, maintenance and repair, and oil spill response. OSVs are also used for specialized tasks such as platform installation, decommissioning, seismic surveying, providing firefighting, towing, and positioning of drilling rigs and other offshore structures, and subsea construction. These vessels are equipped with dynamic positioning systems to maintain their position in rough seas and are built to withstand harsh offshore conditions. Different types of offshore support vessels are used in offshore oil & gas and offshore wind applications. OSVs play a crucial role in offshore oil & gas and offshore wind farms by enabling safe and efficient operations.

Key Stakeholders

  • Offshore support vessel manufacturers and suppliers
  • Offshore support vessel operators
  • Offshore wind turbine manufacturers
  • Oil and gas companies
  • Wind farm owners, operators, and developers
  • Offshore support vessel consulting companies
  • Offshore logistics and ship authorities
  • Offshore platform operators
  • Associations and industry associations
  • Government and research organizations
  • Investment banks

State and National Regulatory Authorities Objectives of the Study

  • To forecast the osv market based on materials used, fuels used, type, application, end-user, and region in terms of value
  • To describe the market for four key regions: Asia Pacific, North America, Europe, and Rest of the World, along with their country-level market sizes in terms of value
  • To provide detailed information regarding key drivers, restraints, opportunities, and challenges influencing the growth of the market
  • To strategically analyze the micromarkets with respect to individual growth trends, prospects, and contributions to the overall market size
  • To provide the supply chain analysis, trends/disruptions impacting customers’ businesses, market map, ecosystem analysis, tariffs and regulations, pricing analysis, patent analysis, case study analysis, technology analysis, key conferences and events, trade analysis, Porter’s five forces analysis, key stakeholders and buying criteria, and regulatory analysis of osv market
  • To analyze opportunities for stakeholders in the offshore support vessel and draw a competitive landscape of the market
  • To benchmark market players using the company evaluation matrix, which analyzes market players on broad categories of business and product strategies adopted by them
  • To compare key market players with respect to product specifications and utility
  • To strategically profile key players and comprehensively analyze their market rankings and core competencies
  • To analyze competitive developments, such as contracts & agreements, investments & expansions, mergers & acquisitions, new product launches, partnerships, joint ventures & collaborations, in the osv market.

Available Customizations:

With the given market data, MarketsandMarkets offers customizations according to the specific requirements of companies. The following customization options are available for the report:

Product Analysis

  • Product Matrix, which provides a detailed comparison of the product portfolio of each company

Company Information

  • Detailed analyses and profiling of additional market players
Custom Market Research Services

We will customize the research for you, in case the report listed above does not meet with your exact requirements. Our custom research will comprehensively cover the business information you require to help you arrive at strategic and profitable business decisions.

Request Customization

Instant Answers with GPT - Ask Now!

Ask real questions. Get complete answers !
Report Code
EP 2894
Published ON
Jun, 2024
Choose License Type
BUY NOW
  • SHARE
X
Request Customization
Speak to Analyst
Speak to Analyst
OR FACE-TO-FACE MEETING
PERSONALIZE THIS RESEARCH
  • Triangulate with your Own Data
  • Get Data as per your Format and Definition
  • Gain a Deeper Dive on a Specific Application, Geography, Customer or Competitor
  • Any level of Personalization
REQUEST A FREE CUSTOMIZATION
LET US HELP YOU!
  • What are the Known and Unknown Adjacencies Impacting the Offshore Support Vessel Market
  • What will your New Revenue Sources be?
  • Who will be your Top Customer; what will make them switch?
  • Defend your Market Share or Win Competitors
  • Get a Scorecard for Target Partners
CUSTOMIZED WORKSHOP REQUEST
knowledgestore logo

Want to explore hidden markets that can drive new revenue in Offshore Support Vessel Market?

Find Hidden Markets
  • Call Us
  • +1-888-600-6441 (Corporate office hours)
  • +1-888-600-6441 (US/Can toll free)
  • +44-800-368-9399 (UK office hours)
CONNECT WITH US
ABOUT TRUST ONLINE
©2024 MarketsandMarkets Research Private Ltd. All rights reserved
DMCA.com Protection Status
Website Feedback