Micro-inverter Market

Micro-inverter Market by Offering, Communication Technology (Wired, Wireless), Type (Single Phase, Three Phase), Power Rating (Below 250 W, Between 250 & 500 W, Above 500 W), Connection Type, Sales Channel, Application - Global Forecast to 2029

Report Code: SE 6610 Jan, 2024, by marketsandmarkets.com

Micro-inverter Market

Micro-inverter Market and Top Companies

Enphase Energy : Enphase Energy designs, develops, and sells micro-inverter systems for residential and commercial end users in the US and internationally. The company offers its products such as AC modules, micro-inverters, battery energy storage systems, accessories, and supportive software applications. It also provides IQ Envoy—a communication gateway.

Darfon Electronics: Darfon Electronics offers micro-inverters through its US-based subsidiary, Darfon Solar. Its product portfolio consists of an extensive range of micro-inverters, storage solutions, and monitoring systems. Darfon Solar offers G640 micro-inverter series. These micro-inverters are well-suited for residential and commercial applications. The company also provides data loggers, programmable logic controller (PLC) boxes, and ComBox. The cloud-based monitoring systems offered by Darfon enable users to efficiently troubleshoot problems in PV systems, thereby resulting in low maintenance costs.

Altenergy Power System: Altenergy Power System, also known as APsystems, is a global company that develops, manufactures, and markets micro-inverters. The micro-inverters offered by the company are based on its proprietary solar technology. APsystems offers advanced solar micro-inverters for use in residential and commercial applications. It offers QS1, YC600, and YC1000 micro-inverters, as well as an energy monitoring & analysis (EMA) web portal and mobile apps to monitor and control the panel-by-panel performance of solar systems. Its proprietary system architecture combines highly efficient power inversion systems with user-friendly monitoring interfaces to offer reliable and intelligent energy solutions that ensure maximum output of solar arrays.

ReneSola : ReneSola is a leading manufacturer and supplier of green energy products. Its micro-inverter solution is branded as Micro Replus and comprises micro-inverters, Micro Replus Gateway (MRG), and monitoring software. The micro-inverters offered by ReneSola are designed to improve the reliability of solar PV harvesting in residential applications. Its LED portfolio includes LED outdoor lighting, LED indoor lighting, compact fluorescent lamps (CFL), and LED retrofit lamps.

Chilicon Power: Chilicon Power develops, manufactures, and sells advanced micro-inverters. The offerings of the company include CP-720 and CP-250E micro-inverters, and a gateway. The micro-inverters of Chilicon Power can replace large central inverters. They integrate with advanced networking technologies and web-based software to enable a new level of intelligence and connectivity for solar arrays. The CP-720 inverter of the company offers sustainable power production of 720 watts AC, which acts as a well-scaled output power that is compatible with 60-cell, 72-cell, or 96-cell modules up to 840 W DC.


Micro-inverter Market and Top Applications


  • Residential: PV installations in the residential sector have been increasing tremendously and are projected to continue in the coming years. Solar inverter systems at residential levels have also become critical due to the increased adoption of residential-scale PV. Micro-inverters are mainly used in residential applications. Owing to its features such as great scalability and flexibility and because they are easy to install as compared to conventional string or central inverter technology, these micro-inverters are well suited in residential solar rooftop PV installations.
  • Commercial: A commercial-scale PV system is among the most familiar ways to enhance the company’s green credentials, as well as reduce electricity bills. Installing a solar PV system at a commercial level not only protects against the ever-rising retail energy prices but can also provide financial incentives by selling power to the grid. Mostly college and school campuses, as well as commercial buildings, hotels, and farms, have rooftop and ground solar PV installations. A micro-inverter helps in increasing the amount of energy harvested from an array in commercial applications. In addition, the lower voltages of micro-inverters make them a safer choice for commercial applications.
  • PV Power Plant: PV power plants are a relatively newer application segment for micro-inverters. It accounts for a smaller share than residential and commercial applications. The number of solar panels installed in a PV plant is huge, and it may not be convenient and cost-efficient to integrate micro-inverters for each panel. Also, most micro-inverters are single phased and are not suitable for this application as the electricity generated is transmitted directly to the grid, which requires a three-phase connection. However, a few manufacturers, such as Altenergy Power Systems, have expanded their micro-inverter product portfolio and offer three-phase micro-inverters that can handle up to 3–4 modules per unit, which is suitable for PV power plant applications.

Micro-inverter Market and Top Types


  • Single Phase: Most micro-inverters available in the market, at present, are single phased. New homes and small businesses adopt single-phase micro-inverters, wherein single-phase electric power is transmitted via 2 wires—active and neutral. Electricity from the solar PV system flows through one active wire, while the neutral wire is connected to the ground (earth) at the switchboard.
  • Three Phase: A three-phase micro-inverter is invented recently. These inverters are specifically designed to supply three-phase electric power and are mostly suitable for PV power plant applications. In conventional micro-inverter designs that work on single-phase power, the energy from the panel must be stored during the period when the voltage is passing through zero, which it does twice per cycle. In contrast, in a three-phase system, throughout the cycle, one of the three wires has a positive or negative voltage, and thus the need for storage can be greatly reduced by transferring the output of the panel to different wires during each cycle.
 

[204 Pages Report] The global micro-inverter market was valued at USD  4.9 billion in 2024 and is estimated to reach USD 14.5 billion by 2029, registering a CAGR of 24.1% during the forecast period. Government subsidies, incentives, and renewable energy adoption have driven the demand for micro-inverters. Also, rising investments in solar energy and technological advancements in solar energy systems are fueling the market's growth.

Micro-inverter Market

Micro-inverter Market

Micro-inverter Market Forecast to 2029

To know about the assumptions considered for the study, Request for Free Sample Report

Market Dynamics:

Driver: Increasing energy prices across the globe

Over the recent years, gas, coal, and electricity prices have surged to levels not seen in decades. The simultaneous increase in gas and coal prices and the rising trajectory of carbon prices in Europe have resulted in a noticeable upswing in electricity prices. These price upswings are expected to place significant upward pressure on household energy bills, presenting a potential difficulty for consumers dealing with heightened costs in the energy sector. With the ongoing escalation of traditional energy prices, homeowners and businesses are increasingly exploring alternative and cost-efficient solutions to fulfill their energy requirements. Rooftop solar panel installations powered by microinverters emerge as a compelling solution in response to this challenge.

Restraint: Limited power handling capacity

Microinverters are tailored to manage designated power ranges, and this constraint can pose challenges, especially in expansive solar installations. There are instances where a lone microinverter might be unable to control the power output from specific high-wattage solar panels. Consequently, larger systems may require multiple microinverters per panel or additional units to effectively handle the overall power generation.

Opportunity: Government incentives and policies for renewable energy

Governments worldwide have acknowledged the significance of transitioning to cleaner and sustainable energy sources to address environmental concerns and diminish reliance on traditional fossil fuels. Governments frequently provide financial incentives, tax credits, or subsidies to individuals, businesses, and utilities investing in solar energy infrastructure to encourage the adoption of solar power systems. For example, the government of India offers subsidies ranging from 30% to 90% for on-grid solar systems, hybrid solar systems, and solar water pumps. Additionally, in the US, subsidies for renewable energy reached USD 15.6 billion in 2022. These incentives can substantially impact the economic viability of solar installations, rendering them more financially feasible for consumers and businesses.

Challenge: Complexity during installations

The installation complexity is a notable hurdle for the micro inverter market. In contrast to string inverters, usually centralized in a solar power system, microinverters are situated on or near individual solar panels. This decentralized positioning demands a more intricate installation procedure, given that each microinverter must be connected to its respective solar panel. This complexity extends the time and labor necessary for installation, potentially resulting in increased overall installation expenses. Furthermore, the requirement for specialized knowledge and training among installers presents an additional challenge, as not all solar technicians may be acquainted with the distinctive demands of micro-inverter setups.

Micro-Inverter Market Ecosystem

The Micro-inverter market is consolidated, with major companies such as Enphase Energy, Altenergy Power Systems, Hoymiles, Ningbo Deye Inverter Technology Co Ltd, Chilicon Power LLC, and numerous small- and medium-sized enterprises. Almost all players offer various products in micro-inverter. These products are used for residential, commercial, and PV power plant applications.

Micro-inverter Market  by Ecosystem

Based on communication technology, the wired segment is expected to dominate during the forecast period.

Wired communication methods offer a stable and reliable data transfer environment. This is crucial for micro-inverters, as consistent and uninterrupted communication is essential for their effective performance in solar energy systems. Wired communication typically provides higher data transfer speeds compared to wireless options. This is advantageous for micro-inverters, especially in scenarios where large amounts of data need to be transmitted quickly, such as monitoring and optimizing solar system performance. These advantages of wired over wireless communication technology is fueling the market growth.

Based on application, the residential segment is projected to have the largest market share during the forecast period

The residential solar market has experienced significant growth in recent years, with more homeowners adopting solar energy systems to reduce electricity costs and environmental impact. This surge in residential solar installations naturally contributes to the prominence of micro-inverters. Micro-inverters are effective in mitigating the effects of shading and panel mismatch issues. In residential settings, shading from nearby structures or trees is more likely, and micro-inverters enable individual panels to operate optimally, even if others are partially shaded. Micro-inverters are generally easier to install and maintain than centralized string inverters, making them more appealing for residential solar installations. Moreover, simplified installation processes can save homeowners and installers costs. Some regions offer specific regulatory support or financial incentives for residential solar installations, further driving this sector's market share of micro-inverters. These advantages are leading to the installation of micro-inverters for residential applications.

Based on region, the Asia Pacific region is projected to grow at the highest CAGR for the micro-inverter market

Numerous countries in the Asia Pacific region, including India, China, and Australia, are actively engaging in investments and advocacy for adopting renewable energy sources. The rising awareness of environmental sustainability and the imperative to diminish carbon footprints have resulted in a notable upswing in the request for solar power. This heightened demand is contributing to the expansion of the micro-inverter market. Moreover, these countries are implementing supportive policies, offering financial incentives, and promoting research and development initiatives to further accelerate the adoption of solar technologies, particularly micro-inverters, in their pursuit of sustainable energy solutions.

Micro-inverter Market  by Region

Micro-inverter Market by Region

To know about the assumptions considered for the study, download the pdf brochure

Key Market Players

The micro-inverter companis is dominated by a few globally established players such as Enphase Energy (US), Altenergy Power Systems (US), Hoymiles (China), Ningbo Deye Inverter Technology Co Ltd (China), Chilicon Power LLC (US), AEconversion GmbH & CO. KG (Germany), Envertech (China), ZJBENY (China), Bluesun Solar Co., Ltd. (China), and Solar Panels Plus (US).

Get online access to the report on the World's First Market Intelligence Cloud

  • Easy to Download Historical Data & Forecast Numbers
  • Company Analysis Dashboard for high growth potential opportunities
  • Research Analyst Access for customization & queries
  • Competitor Analysis with Interactive dashboard
  • Latest News, Updates & Trend analysis
Request Sample

Scope of the Report

Report Metric

Details

Market Size Availability for Years

2020–2029

Base Year

2023

Forecast Period

2024–2029

Forecast Units

Value (USD)

Segments Covered

By offerings, communication technology, type, power rating, connection type, sales channel, application, and region

Geographies Covered

North America, Europe, Asia Pacific, and Rest of the world

Companies Covered

Enphase Energy (US), Altenergy Power Systems (US), Hoymiles (China), Ningbo Deye Inverter Technology Co Ltd (China), Chilicon Power LLC (US), AEconversion GmbH & CO. KG (Germany), Envertech (China), ZJBENY (China), Bluesun Solar Co., Ltd. (China), and Solar Panels Plus (US)

Micro-inverter Market Highlights

This research report categorizes the micro-inverter market based on offerings, communication technology, type, power rating, connection type, application, and region

Segment

Subsegment

Based on Offerings:

  • Hardware
  • Software & Services

Based on Communication Technology:

  • Wired
  • Wireless

Based on Type:

  • Single Phase
  • Three Phase

Based on Power Rating:

  • Below 250 W
  • Between 250 and 500 W
  • Above 500 W

Based on Connection Type:

  • Stand-alone
  • Grid-tied

Based on Sales Channel:

  • Direct
  • Indirect

Based on Application:

  • Residential
  • Commercial
  • PV Power Plant

Based on Region:

  • North America
    • US
    • Canada
    • Mexico
  • Europe
    • Germany
    • UK
    • France
    • The Netherlands
    • Rest of Europe
  • Asia Pacific (APAC)
    • China
    • Japan
    • India
    • Australia
    • Rest of APAC
  • Rest of the world (RoW)
    • South America
    • Middle East and Africa

Recent Developments

  • In November 2023, Enphase Energy, Inc., a renowned global energy technology firm and the primary provider of microinverter-based solar and battery systems worldwide, unveiled its latest offering – the IQ8 Commercial Microinverters. This release includes the IQ8P-3P Microinverter, explicitly designed for the North American small commercial solar market.
  • In May 2023, APsystems introduced the latest Wi-Fi & Bluetooth EZ1 Microinverter series. This single-phase microinverter solution is designed for balcony installations and do-it-yourself (DIY) PV systems, and it was unveiled at the 16th SNEC International Photovoltaic Power Generation and Smart Energy Conference & Exhibition in Shanghai, China.
  • In March 2023, Hoymiles introduces the cutting-edge HMS-2000DW microinverter series, tailored for high-powered PV modules and featuring seamless Wi-Fi integration. Tailored for small home solar systems, these microinverters offer enhanced efficiency and reduced operational costs compared to alternative devices.
  • In January 2023, Hoymiles launched innovative microinverters to reduce initial customer costs without compromising overall performance. The HMS-C series is accessible in North America and Oceania, while the HMS-D series is available in Latin America and the Asia Pacific region.
  • In August 2022, Enphase Energy, Inc., a prominent global energy technology firm and the top microinverter-based solar and battery systems provider, announced its agreement to acquire GreenCom Networks AG. Headquartered in Munich, Germany, GreenCom Networks specializes in Internet of Things (IoT) software solutions, enabling users to connect and oversee various distributed energy devices within their homes.
  • In June 2020, Enphase Energy partnered with Australia-based Excel Power. Under this partnership, Excel Power installed a 50 kW Enphase micro-inverter-based system for Wippells Autos, a Jaguar and Land Rover dealer based in Toowoomba City, Queensland (Australia). 

Frequently Asked Questions (FAQs):

To speak to our analyst for a discussion on the above findings, click Speak to Analyst

TABLE OF CONTENTS
 
1 INTRODUCTION (Page No. - 28)
    1.1 STUDY OBJECTIVES 
    1.2 MARKET DEFINITION 
    1.3 INCLUSIONS AND EXCLUSIONS 
    1.4 STUDY SCOPE 
           1.4.1 MARKETS COVERED
                    FIGURE 1 MICRO-INVERTER MARKET SEGMENTATION
           1.4.2 REGIONAL SCOPE
           1.4.3 YEARS CONSIDERED
    1.5 CURRENCY CONSIDERED 
    1.6 STAKEHOLDERS 
    1.7 SUMMARY OF CHANGES 
    1.8 IMPACT OF RECESSION 
 
2 RESEARCH METHODOLOGY (Page No. - 33)
    2.1 RESEARCH DATA 
           FIGURE 2 MICRO-INVERTER MARKET: RESEARCH DESIGN
           2.1.1 SECONDARY DATA
                    2.1.1.1 List of key secondary sources
                    2.1.1.2 Key data from secondary sources
           2.1.2 PRIMARY DATA
                    2.1.2.1 Intended participants in primary interviews
                    2.1.2.2 Key data from primary sources
                    2.1.2.3 Key industry insights
                    2.1.2.4 Breakdown of primaries
    2.2 FACTOR ANALYSIS 
           FIGURE 3 MICRO-INVERTER MARKET: REVENUE GENERATED BY COMPANIES FROM SALES OF MICRO-INVERTER PRODUCTS
    2.3 MARKET SIZE ESTIMATION METHODOLOGY 
           2.3.1 BOTTOM-UP APPROACH
                    2.3.1.1 Approach to arrive at market size using bottom-up analysis (demand side)
                               FIGURE 4 MARKET SIZE ESTIMATION METHODOLOGY: BOTTOM-UP APPROACH
           2.3.2 TOP-DOWN APPROACH
                    2.3.2.1 Approach to arrive at market size using top-down analysis (supply side)
                               FIGURE 5 MARKET SIZE ESTIMATION METHODOLOGY: TOP-DOWN APPROACH
    2.4 DATA TRIANGULATION 
           FIGURE 6 MICRO-INVERTER MARKET: DATA TRIANGULATION
    2.5 RESEARCH ASSUMPTIONS 
           TABLE 1 MICRO-INVERTER MARKET: RESEARCH ASSUMPTIONS
    2.6 RESEARCH LIMITATIONS 
    2.7 PARAMETERS CONSIDERED TO ANALYZE RECESSION IMPACT ON MICRO-INVERTER MARKET 
    2.8 RISK ASSESSMENT 
 
3 EXECUTIVE SUMMARY (Page No. - 45)
    FIGURE 7 SINGLE-PHASE MICRO-INVERTERS TO ACCOUNT FOR LARGER MARKET SHARE IN 2024
    FIGURE 8 MICRO-INVERTERS WITH POWER RATINGS BETWEEN 250 AND 500 W TO RECORD HIGHEST CAGR DURING FORECAST PERIOD
    FIGURE 9 RESIDENTIAL APPLICATIONS TO EXHIBIT HIGHEST CAGR IN MICRO-INVERTER MARKET FROM 2024 TO 2029
    FIGURE 10 ASIA PACIFIC TO BE FASTEST-GROWING MARKET FOR MICRO-INVERTERS DURING FORECAST PERIOD
 
4 PREMIUM INSIGHTS (Page No. - 49)
    4.1 ATTRACTIVE OPPORTUNITIES FOR PLAYERS IN MICRO-INVERTER MARKET 
           FIGURE 11 GOVERNMENT SUBSIDIES AND INCENTIVES FOR RENEWABLE ENERGY TO FUEL DEMAND FOR MICRO-INVERTERS IN COMING YEARS
    4.2 MICRO-INVERTER MARKET, BY CONNECTION TYPE 
           FIGURE 12 GRID-TIED SEGMENT TO EXHIBIT FASTER GROWTH RATE IN MICRO-INVERTER MARKET DURING FORECAST PERIOD
    4.3 MICRO-INVERTER MARKET, BY COMMUNICATION TECHNOLOGY 
           FIGURE 13 WIRED SEGMENT DOMINATED MICRO-INVERTER MARKET IN 2023
    4.4 MICRO-INVERTER MARKET, BY APPLICATION AND REGION 
           FIGURE 14 RESIDENTIAL SEGMENT AND NORTH AMERICA TO BE LARGEST MARKET SHAREHOLDERS IN 2029
    4.5 MICRO-INVERTER MARKET, BY REGION 
           FIGURE 15 INDIA TO REGISTER HIGHEST CAGR IN GLOBAL MICRO-INVERTER MARKET BETWEEN 2024 AND 2029
 
5 MARKET OVERVIEW (Page No. - 52)
    5.1 INTRODUCTION 
    5.2 MARKET DYNAMICS 
           FIGURE 16 MICRO-INVERTER MARKET: DRIVERS, RESTRAINTS, OPPORTUNITIES, AND CHALLENGES
           5.2.1 DRIVERS
                    5.2.1.1 Escalating influx of investments in solar energy
                    5.2.1.2 Rising preference for technologically advanced solar inverters over conventional ones
                    5.2.1.3 Increasing solar panel installations due to surge in energy prices
                    5.2.1.4 Rising energy demand
                               FIGURE 17 MICRO-INVERTER MARKET: IMPACT ANALYSIS OF DRIVERS
           5.2.2 RESTRAINTS
                    5.2.2.1 Complex micro-inverter installation process
                    5.2.2.2 Safety concerns for high DC voltages in micro-inverters
                               FIGURE 18 MICRO-INVERTER MARKET: IMPACT ANALYSIS OF RESTRAINTS
           5.2.3 OPPORTUNITIES
                    5.2.3.1 Government incentives and policies encouraging adoption of renewable energy
                    5.2.3.2 Corporate sustainability initiatives by businesses
                               FIGURE 19 MICRO-INVERTER MARKET: IMPACT ANALYSIS OF OPPORTUNITIES
           5.2.4 CHALLENGES
                    5.2.4.1 Limited power handling capacity of micro-inverters
                               FIGURE 20 MICRO-INVERTER MARKET: IMPACT ANALYSIS OF CHALLENGES
    5.3 SUPPLY CHAIN ANALYSIS 
           FIGURE 21 SUPPLY CHAIN ANALYSIS: MICRO-INVERTER MARKET
    5.4 ECOSYSTEM ANALYSIS 
           FIGURE 22 MICRO-INVERTER MARKET: ECOSYSTEM
           TABLE 2 ROLE OF PARTICIPANTS IN MICRO-INVERTER ECOSYSTEM
    5.5 PRICING ANALYSIS 
           5.5.1 PRICING ANALYSIS OF MICRO-INVERTERS OFFERED BY KEY PLAYERS
                    FIGURE 23 AVERAGE SELLING PRICE OF MICRO-INVERTERS OFFERED BY KEY PLAYERS, BY CONNECTION TYPE
                    TABLE 3 AVERAGE SELLING PRICE OF MICRO-INVERTERS PROVIDED BY KEY PLAYERS, BY CONNECTION TYPE (USD)
           5.5.2 REGION-WISE AVERAGE SELLING PRICE TREND
                    FIGURE 24 AVERAGE SELLING PRICE OF MICRO-INVERTERS, BY REGION, 2018–2022 (USD)
    5.6 TRENDS/DISRUPTIONS IMPACTING CUSTOMER BUSINESS 
           FIGURE 25 TRANSITION TO RENEWABLE ENERGY TO HAVE POSITIVE IMPACT ON ECOSYSTEM
    5.7 TECHNOLOGY ANALYSIS 
           5.7.1 SMART GRID
           5.7.2 INTERNET OF THINGS (IOT)
           5.7.3 POWER OPTIMIZERS
    5.8 PORTER’S FIVE FORCES ANALYSIS 
           FIGURE 26 PORTER’S FIVE FORCES MODEL FOR MICRO-INVERTER MARKET
           TABLE 4 MICRO-INVERTER MARKET: PORTER’S FIVE FORCES ANALYSIS
    5.9 KEY STAKEHOLDERS AND BUYING CRITERIA 
           5.9.1 KEY STAKEHOLDERS IN BUYING PROCESS
                    FIGURE 27 INFLUENCE OF STAKEHOLDERS ON BUYING PROCESS FOR KEY APPLICATIONS
                    TABLE 5 INFLUENCE OF STAKEHOLDERS ON BUYING PROCESS FOR MAJOR APPLICATIONS (%)
           5.9.2 BUYING CRITERIA
                    FIGURE 28 KEY BUYING CRITERIA FOR KEY APPLICATIONS
                    TABLE 6 KEY BUYING CRITERIA FOR MAJOR APPLICATIONS
    5.10 CASE STUDY ANALYSIS 
           5.10.1 VINE FRESH PRODUCE LTD. INSTALLED MICRO-INVERTERS BY ENPHASE ENERGY TO POWER ROOFTOP SOLAR SYSTEMS
           5.10.2 PHARMACARE LIMITED DEPLOYED MICRO-INVERTERS FROM HOYMILES IN SOLAR POWER INSTALLATION PROJECT
           5.10.3 HALEAKALA SOLAR IN HAWAII INSTALLED ENPHASE ENERGY’S MICRO-INVERTERS THAT REMAIN FUNCTIONAL IN HARSH ENVIRONMENTAL CONDITIONS
           5.10.4 CONVERGENCE ENERGY CHOSE ENPHASE ENERGY’S MICRO-INVERTERS FOR ROOFTOP INSTALLATIONS TO MEET ENERGY DEMAND
           5.10.5 PIVOT ENERGY INSTALLED ENPHASE ENERGY’S MICRO-INVERTERS IN BUSCH STADIUM TO REDUCE ENERGY CONSUMPTION
           5.10.6 PIVOT ENERGY INSTALLED ENPHASE ENERGY’S MICRO-INVERTERS IN BUSCH STADIUM TO REDUCE ENERGY CONSUMPTION
    5.11 TRADE ANALYSIS 
           5.11.1 IMPORT SCENARIO
                    FIGURE 29 IMPORT VALUES FOR KEY COUNTRIES, 2018–2022 (USD MILLION)
           5.11.2 EXPORT SCENARIO
                    FIGURE 30 EXPORT VALUES FOR KEY COUNTRIES, 2018–2022 (USD MILLION)
    5.12 PATENT ANALYSIS 
           FIGURE 31 MICRO-INVERTER MARKET: PATENTS APPLIED AND GRANTED, 2013–2023
           TABLE 7 LIST OF KEY PATENTS IN MICRO-INVERTER MARKET
    5.13 KEY CONFERENCES AND EVENTS, 2024–2025 
           TABLE 8 MICRO-INVERTER MARKET: LIST OF CONFERENCES AND EVENTS
           5.13.1 TARIFF ANALYSIS
                    TABLE 9 MFN TARIFF FOR HS CODE 8504-COMPLIANT PRODUCTS EXPORTED BY JAPAN
                    TABLE 10 MFN TARIFF FOR HS CODE 8504-COMPLIANT PRODUCTS EXPORTED BY CHINA
    5.14 REGULATORY LANDSCAPE AND STANDARDS 
           5.14.1 REGULATORY BODIES, GOVERNMENT AGENCIES, AND OTHER ORGANIZATIONS
                    TABLE 11 NORTH AMERICA: LIST OF REGULATORY BODIES, GOVERNMENT AGENCIES, AND OTHER ORGANIZATIONS
                    TABLE 12 EUROPE: LIST OF REGULATORY BODIES, GOVERNMENT AGENCIES, AND OTHER ORGANIZATIONS
                    TABLE 13 ASIA PACIFIC: LIST OF REGULATORY BODIES, GOVERNMENT AGENCIES, AND OTHER ORGANIZATIONS
                    TABLE 14 ROW: LIST OF REGULATORY BODIES, GOVERNMENT AGENCIES AND OTHER ORGANIZATIONS
           5.14.2 SAFETY STANDARDS
                    TABLE 15 SAFETY STANDARDS RELATED TO MICRO-INVERTER PRODUCTS
 
6 KEY FEATURES OF MICRO-INVERTERS (Page No. - 78)
    6.1 INTRODUCTION 
    6.2 FAST SHUTDOWN IN EMERGENCY 
    6.3 PANEL-LEVEL MONITORING 
    6.4 SCALABILITY 
    6.5 MULTIPLE-ANGEL INSTALLATION 
 
7 MICRO-INVERTER MARKET, BY OFFERING (Page No. - 80)
    7.1 INTRODUCTION 
           FIGURE 32 MICRO-INVERTER MARKET, BY OFFERING
           FIGURE 33 HARDWARE SEGMENT TO CAPTURE LARGER SHARE OF MICRO-INVERTER MARKET IN 2029
           TABLE 16 MICRO-INVERTER MARKET, BY OFFERING, 2020–2023 (USD MILLION)
           TABLE 17 MICRO-INVERTER MARKET, BY OFFERING, 2024–2029 (USD MILLION)
    7.2 HARDWARE 
           7.2.1 TECHNOLOGICAL ADVANCEMENTS IN HARDWARE COMPONENTS TO ACCELERATE SEGMENTAL GROWTH
    7.3 SOFTWARE & SERVICES 
           7.3.1 RISING ADOPTION OF SMART TECHNOLOGIES IN SOLAR INDUSTRY TO FUEL SEGMENTAL GROWTH
 
8 MICRO-INVERTER MARKET, BY COMMUNICATION TECHNOLOGY (Page No. - 84)
    8.1 INTRODUCTION 
           FIGURE 34 MICRO-INVERTER MARKET, BY COMMUNICATION TECHNOLOGY
           FIGURE 35 WIRED TECHNOLOGY-BASED MICRO-INVERTERS TO ACCOUNT FOR LARGER MARKET SHARE IN 2029
           TABLE 18 MICRO-INVERTER MARKET, BY COMMUNICATION TECHNOLOGY, 2020–2023 (USD MILLION)
           TABLE 19 MICRO-INVERTER MARKET, BY COMMUNICATION TECHNOLOGY, 2024–2029 (USD MILLION)
    8.2 WIRED 
           8.2.1 NEED FOR ROBUST AND SECURE COMMUNICATION INFRASTRUCTURE TO FUEL SEGMENTAL GROWTH
                    TABLE 20 WIRED: MICRO-INVERTER MARKET, BY APPLICATION, 2020–2023 (USD MILLION)
                    TABLE 21 WIRED: MICRO-INVERTER MARKET, BY APPLICATION, 2024–2029 (USD MILLION)
    8.3 WIRELESS 
           8.3.1 REQUIREMENT FOR REMOTE AND REAL-TIME DATA ACCESS TO ACCELERATE SEGMENTAL GROWTH
                    TABLE 22 WIRELESS: MICRO-INVERTER MARKET, BY APPLICATION, 2020–2023 (USD MILLION)
                    TABLE 23 WIRELESS: MICRO-INVERTER MARKET, BY APPLICATION, 2024–2029 (USD MILLION)
 
9 MICRO-INVERTER MARKET, BY TYPE (Page No. - 89)
    9.1 INTRODUCTION 
           FIGURE 36 MICRO-INVERTER MARKET, BY TYPE
           FIGURE 37 SINGLE-PHASE MICRO-INVERTERS TO LEAD MARKET THROUGHOUT FORECAST PERIOD
           TABLE 24 MICRO-INVERTER MARKET, BY TYPE, 2020–2023 (USD MILLION)
           TABLE 25 MICRO-INVERTER MARKET, BY TYPE, 2024–2029 (USD MILLION)
           TABLE 26 MICRO-INVERTER MARKET, BY TYPE, 2020–2023 (MILLION UNITS)
           TABLE 27 MICRO-INVERTER MARKET, BY TYPE, 2024–2029 (MILLION UNITS)
    9.2 SINGLE-PHASE 
           9.2.1 ELEVATING DEMAND FROM RESIDENTIAL APPLICATIONS TO DRIVE MARKET
                    TABLE 28 SINGLE-PHASE: MICRO-INVERTER MARKET, BY APPLICATION, 2020–2023 (USD MILLION)
                    TABLE 29 SINGLE-PHASE: MICRO-INVERTER MARKET, BY APPLICATION, 2024–2029 (USD MILLION)
    9.3 THREE-PHASE 
           9.3.1 RISING ADOPTION IN PV POWER PLANTS AND COMMERCIAL APPLICATIONS TO FUEL MARKET GROWTH
                    TABLE 30 THREE-PHASE: MICRO-INVERTER MARKET, BY APPLICATION, 2020–2023 (USD MILLION)
                    TABLE 31 THREE PHASE: MICRO-INVERTER MARKET, BY APPLICATION, 2024–2029 (USD MILLION)
 
10 MICRO-INVERTER MARKET, BY POWER RATING (Page No. - 94)
     10.1 INTRODUCTION 
             FIGURE 38 MICRO-INVERTER MARKET, BY POWER RATING
             FIGURE 39 MICRO-INVERTERS WITH POWER RATINGS BETWEEN 250 AND 500 W TO LEAD MARKET FROM 2024 TO 2029
             TABLE 32 MICRO-INVERTER MARKET, BY POWER RATING, 2020–2023 (USD MILLION)
             TABLE 33 MICRO-INVERTER MARKET, BY POWER RATING, 2024–2029 (USD MILLION)
     10.2 BELOW 250 W 
             10.2.1 GROWING USE IN SMALL-SCALE RESIDENTIAL APPLICATIONS TO DRIVE MARKET
                        TABLE 34 BELOW 250 W: MICRO-INVERTER MARKET, BY APPLICATION, 2020–2023 (USD MILLION)
                        TABLE 35 BELOW 250 W: MICRO-INVERTER MARKET, BY APPLICATION, 2024–2029 (USD MILLION)
     10.3 BETWEEN 250 AND 500 W 
             10.3.1 INCREASING INSTALLATION OF LARGER GROUND-MOUNTED SOLAR PANELS TO FUEL SEGMENTAL GROWTH
                        TABLE 36 BETWEEN 250 AND 500 W: MICRO-INVERTER MARKET, BY APPLICATION, 2020–2023 (USD MILLION)
                        TABLE 37 BETWEEN 250 AND 500 W: MICRO-INVERTER MARKET, BY APPLICATION, 2024–2029 (USD MILLION)
     10.4 ABOVE 500 W 
             10.4.1 RISING DEMAND FROM PV POWER PLANTS AND LARGE INDUSTRIES TO DRIVE MARKET
                        TABLE 38 ABOVE 500 W: MICRO-INVERTER MARKET, BY APPLICATION, 2020–2023 (USD MILLION)
                        TABLE 39 ABOVE 500 W: MICRO-INVERTER MARKET, BY APPLICATION, 2024–2029 (USD MILLION)
 
11 MICRO-INVERTER MARKET, BY CONNECTION TYPE (Page No. - 99)
     11.1 INTRODUCTION 
             FIGURE 40 MICRO-INVERTER MARKET, BY CONNECTION TYPE
             FIGURE 41 GRID-TIED MICRO-INVERTERS TO DOMINATE MARKET THROUGHOUT FORECAST PERIOD
             TABLE 40 MICRO-INVERTER MARKET, BY CONNECTION TYPE, 2020–2023 (USD MILLION)
             TABLE 41 MICRO-INVERTER MARKET, BY CONNECTION TYPE, 2024–2029 (USD MILLION)
     11.2 STANDALONE 
             11.2.1 RISING UTILIZATION OF MICRO-INVERTERS IN REMOTE AREAS TO BOOST SEGMENTAL GROWTH
                        TABLE 42 STANDALONE: MICRO-INVERTER MARKET, BY APPLICATION, 2020–2023 (USD MILLION)
                        TABLE 43 STANDALONE: MICRO-INVERTER MARKET, BY APPLICATION, 2024–2029 (USD MILLION)
     11.3 GRID-TIED 
             11.3.1 SIGNIFICANT FOCUS ON MAXIMIZING ENERGY HARVESTING TO BOOST DEMAND
                        TABLE 44 GRID-TIED: MICRO-INVERTER MARKET, BY APPLICATION, 2020–2023 (USD MILLION)
                        TABLE 45 GRID-TIED: MICRO-INVERTER MARKET, BY APPLICATION, 2024–2029 (USD MILLION)
 
12 MICRO-INVERTER MARKET, BY SALES CHANNEL (Page No. - 103)
     12.1 INTRODUCTION 
             FIGURE 42 MICRO-INVERTER MARKET, BY SALES CHANNEL
             FIGURE 43 INDIRECT SALES CHANNELS TO COMMAND MICRO-INVERTER MARKET THROUGHOUT FORECAST PERIOD
             TABLE 46 MICRO-INVERTER MARKET, BY SALES CHANNEL, 2020–2023 (USD MILLION)
             TABLE 47 MICRO-INVERTER MARKET, BY SALES CHANNEL, 2024–2029 (USD MILLION)
     12.2 DIRECT 
             12.2.1 GROWING TREND OF E-COMMERCE AND DIGITALIZATION TO PROPEL SEGMENTAL GROWTH
                        TABLE 48 DIRECT: MICRO-INVERTER MARKET, BY APPLICATION, 2020–2023 (USD MILLION)
                        TABLE 49 DIRECT: MICRO-INVERTER MARKET, BY APPLICATION, 2024–2029 (USD MILLION)
     12.3 INDIRECT 
             12.3.1 STRONG DISTRIBUTION NETWORK OF MICRO-INVERTER MANUFACTURERS TO FUEL SEGMENTAL GROWTH
                        TABLE 50 INDIRECT: MICRO-INVERTER MARKET, BY APPLICATION, 2020–2023 (USD MILLION)
                        TABLE 51 INDIRECT: MICRO-INVERTER MARKET, BY APPLICATION, 2024–2029 (USD MILLION)
 
13 MICRO-INVERTER MARKET, BY APPLICATION (Page No. - 107)
     13.1 INTRODUCTION 
             FIGURE 44 MICRO-INVERTER MARKET, BY APPLICATION
             FIGURE 45 RESIDENTIAL SEGMENT TO DOMINATE MICRO-INVERTER MARKET THROUGHOUT FORECAST PERIOD
             TABLE 52 MICRO-INVERTER MARKET, BY APPLICATION, 2020–2023 (USD MILLION)
             TABLE 53 MICRO-INVERTER MARKET, BY APPLICATION, 2024–2029 (USD MILLION)
     13.2 RESIDENTIAL 
             13.2.1 INCREASING INSTALLATION AND AFFORDABILITY OF SOLAR SYSTEMS TO BOOST DEMAND FOR MICRO-INVERTERS
                        TABLE 54 RESIDENTIAL: MICRO-INVERTER MARKET, BY TYPE, 2020–2023 (USD MILLION)
                        TABLE 55 RESIDENTIAL: MICRO-INVERTER MARKET, BY TYPE, 2024–2029 (USD MILLION)
                        TABLE 56 RESIDENTIAL: MICRO-INVERTER MARKET, BY CONNECTION TYPE, 2020–2023 (USD MILLION)
                        TABLE 57 RESIDENTIAL: MICRO-INVERTER MARKET, BY CONNECTION TYPE, 2024–2029 (USD MILLION)
                        TABLE 58 RESIDENTIAL: MICRO-INVERTER MARKET, BY POWER RATING, 2020–2023 (USD MILLION)
                        TABLE 59 RESIDENTIAL: MICRO-INVERTER MARKET, BY POWER RATING, 2024–2029 (USD MILLION)
                        TABLE 60 RESIDENTIAL: MICRO-INVERTER MARKET, BY COMMUNICATION TECHNOLOGY, 2020–2023 (USD MILLION)
                        TABLE 61 RESIDENTIAL: MICRO-INVERTER MARKET, BY COMMUNICATION TECHNOLOGY, 2024–2029 (USD MILLION)
                        TABLE 62 RESIDENTIAL: MICRO-INVERTER MARKET, BY SALES CHANNEL, 2020–2023 (USD MILLION)
                        TABLE 63 RESIDENTIAL: MICRO-INVERTER MARKET, BY SALES CHANNEL, 2024–2029 (USD MILLION)
                        TABLE 64 RESIDENTIAL: MICRO-INVERTER MARKET, BY REGION, 2020–2023 (USD MILLION)
                        TABLE 65 RESIDENTIAL: MICRO-INVERTER MARKET, BY REGION, 2024–2029 (USD MILLION)
     13.3 COMMERCIAL 
             13.3.1 GROWING FOCUS ON ENVIRONMENTAL SUSTAINABILITY TO DRIVE MARKET
                        TABLE 66 COMMERCIAL: MICRO-INVERTER MARKET, BY TYPE, 2020–2023 (USD MILLION)
                        TABLE 67 COMMERCIAL: MICRO-INVERTER MARKET, BY TYPE, 2024–2029 (USD MILLION)
                        TABLE 68 COMMERCIAL: MICRO-INVERTER MARKET, BY CONNECTION TYPE, 2020–2023 (USD MILLION)
                        TABLE 69 COMMERCIAL: MICRO-INVERTER MARKET, BY CONNECTION TYPE, 2024–2029 (USD MILLION)
                        TABLE 70 COMMERCIAL: MICRO-INVERTER MARKET, BY POWER RATING, 2020–2023 (USD MILLION)
                        TABLE 71 COMMERCIAL: MICRO-INVERTER MARKET, BY POWER RATING, 2024–2029 (USD MILLION)
                        TABLE 72 COMMERCIAL: MICRO-INVERTER MARKET, BY COMMUNICATION TECHNOLOGY, 2020–2023 (USD MILLION)
                        TABLE 73 COMMERCIAL: MICRO-INVERTER MARKET, BY COMMUNICATION TECHNOLOGY, 2024–2029 (USD MILLION)
                        TABLE 74 COMMERCIAL: MICRO-INVERTER MARKET, BY SALES CHANNEL, 2020–2023 (USD MILLION)
                        TABLE 75 COMMERCIAL: MICRO-INVERTER MARKET, BY SALES CHANNEL, 2024–2029 (USD MILLION)
                        TABLE 76 COMMERCIAL: MICRO-INVERTER MARKET, BY REGION, 2020–2023 (USD MILLION)
                        TABLE 77 COMMERCIAL: MICRO-INVERTER MARKET, BY REGION, 2024–2029 (USD MILLION)
     13.4 PV POWER PLANTS 
             13.4.1 INCREASING INVESTMENTS IN PV POWER PLANTS TO FUEL MARKET GROWTH
                        TABLE 78 PV POWER PLANTS: MICRO-INVERTER MARKET, BY TYPE, 2020–2023 (USD MILLION)
                        TABLE 79 PV POWER PLANTS: MICRO-INVERTER MARKET, BY TYPE, 2024–2029 (USD MILLION)
                        TABLE 80 PV POWER PLANTS: MICRO-INVERTER MARKET, BY CONNECTION TYPE, 2020–2023 (USD MILLION)
                        TABLE 81 PV POWER PLANTS: MICRO-INVERTER MARKET, BY CONNECTION TYPE, 2024–2029 (USD MILLION)
                        TABLE 82 PV POWER PLANTS: MICRO-INVERTER MARKET, BY POWER RATING, 2020–2023 (USD MILLION)
                        TABLE 83 PV POWER PLANTS: MICRO-INVERTER MARKET, BY POWER RATING, 2024–2029 (USD MILLION)
                        TABLE 84 PV POWER PLANTS: MICRO-INVERTER MARKET, BY COMMUNICATION TECHNOLOGY, 2020–2023 (USD MILLION)
                        TABLE 85 PV POWER PLANTS: MICRO-INVERTER MARKET, BY COMMUNICATION TECHNOLOGY, 2024–2029 (USD MILLION)
                        TABLE 86 PV POWER PLANTS: MICRO-INVERTER MARKET, BY SALES CHANNEL, 2020–2023 (USD MILLION)
                        TABLE 87 PV POWER PLANTS: MICRO-INVERTER MARKET, BY SALES CHANNEL, 2024–2029 (USD MILLION)
                        TABLE 88 PV POWER PLANTS: MICRO-INVERTER MARKET, BY REGION, 2020–2023 (USD MILLION)
                        TABLE 89 PV POWER PLANTS: MICRO-INVERTER MARKET, BY REGION, 2024–2029 (USD MILLION)
 
14 MICRO-INVERTER MARKET, BY REGION (Page No. - 120)
     14.1 INTRODUCTION 
             FIGURE 46 REGIONAL SPLIT OF MICRO-INVERTER MARKET
             FIGURE 47 ASIA PACIFIC TO REGISTER HIGHEST CAGR IN MICRO-INVERTER MARKET FROM 2024 TO 2029
             TABLE 90 MICRO-INVERTER MARKET, BY REGION, 2020–2023 (USD MILLION)
             TABLE 91 MICRO-INVERTER MARKET, BY REGION, 2024–2029 (USD MILLION)
     14.2 NORTH AMERICA 
             FIGURE 48 NORTH AMERICA: MICRO-INVERTER MARKET SNAPSHOT
             TABLE 92 NORTH AMERICA: MICRO-INVERTER MARKET, BY APPLICATION, 2020–2023 (USD MILLION)
             TABLE 93 NORTH AMERICA: MICRO-INVERTER MARKET, BY APPLICATION, 2024–2029 (USD MILLION)
             TABLE 94 NORTH AMERICA: MICRO-INVERTER MARKET, BY COUNTRY, 2020–2023 (USD MILLION)
             TABLE 95 NORTH AMERICA: MICRO-INVERTER MARKET, BY COUNTRY, 2024–2029 (USD MILLION)
             14.2.1 NORTH AMERICA: RECESSION IMPACT
             14.2.2 US
                        14.2.2.1 Increasing solar installations to fuel demand for micro-inverters
             14.2.3 CANADA
                        14.2.3.1 Government incentives for solar installations to drive market
             14.2.4 MEXICO
                        14.2.4.1 Rapid transition toward clean energy to accelerate market growth
     14.3 EUROPE 
             FIGURE 49 EUROPE: MICRO-INVERTER MARKET SNAPSHOT
             TABLE 96 EUROPE: MICRO-INVERTER MARKET, BY APPLICATION, 2020–2023 (USD MILLION)
             TABLE 97 EUROPE: MICRO-INVERTER MARKET, BY APPLICATION, 2024–2029 (USD MILLION)
             TABLE 98 EUROPE: MICRO-INVERTER MARKET, BY COUNTRY, 2020–2023 (USD MILLION)
             TABLE 99 EUROPE: MICRO-INVERTER MARKET, BY COUNTRY, 2024–2029 (USD MILLION)
             14.3.1 EUROPE: RECESSION IMPACT
             14.3.2 GERMANY
                        14.3.2.1 Strong focus on solar PV expansion to boost requirement for micro-inverters
             14.3.3 UK
                        14.3.3.1 Government investments in innovative energy technologies to foster market growth
             14.3.4 NETHERLANDS
                        14.3.4.1 High utilization of solar panels in residential and commercial applications to support market growth
             14.3.5 FRANCE
                        14.3.5.1 Renewable energy initiatives to contribute to market growth
             14.3.6 REST OF EUROPE
     14.4 ASIA PACIFIC 
             FIGURE 50 ASIA PACIFIC: MICRO-INVERTER MARKET SNAPSHOT
             TABLE 100 ASIA PACIFIC: MICRO-INVERTER MARKET, BY APPLICATION, 2020–2023 (USD MILLION)
             TABLE 101 ASIA PACIFIC: MICRO-INVERTER MARKET, BY APPLICATION, 2024–2029 (USD MILLION)
             TABLE 102 ASIA PACIFIC: MICRO-INVERTER MARKET, BY COUNTRY, 2020–2023 (USD MILLION)
             TABLE 103 ASIA PACIFIC: MICRO-INVERTER MARKET, BY COUNTRY, 2024–2029 (USD MILLION)
             14.4.1 ASIA PACIFIC: RECESSION IMPACT
             14.4.2 CHINA
                        14.4.2.1 Increasing rooftop solar PV installations to stimulate market growth
             14.4.3 JAPAN
                        14.4.3.1 Enforcement of policies and initiatives encouraging solar energy utilization to drive market
             14.4.4 INDIA
                        14.4.4.1 Government schemes and programs to increase solar power generation to boost demand for micro-inverters
             14.4.5 AUSTRALIA
                        14.4.5.1 Heightened rooftop solar power installation to drive market
             14.4.6 REST OF ASIA PACIFIC
     14.5 REST OF THE WORLD (ROW) 
             TABLE 104 ROW: MICRO-INVERTER MARKET, BY APPLICATION, 2020–2023 (USD MILLION)
             TABLE 105 ROW: MICRO-INVERTER MARKET, BY APPLICATION, 2024–2029 (USD MILLION)
             TABLE 106 ROW: MICRO-INVERTER MARKET, BY REGION, 2020–2023 (USD MILLION)
             TABLE 107 ROW: MICRO-INVERTER MARKET, BY REGION, 2024–2029 (USD MILLION)
             14.5.1 ROW: RECESSION IMPACT
             14.5.2 SOUTH AMERICA
                        14.5.2.1 Increasing number of solar projects to support market growth
             14.5.3 MIDDLE EAST
                        14.5.3.1 Rising number of PV projects to accelerate demand for micro-inverters
 
15 COMPETITIVE LANDSCAPE (Page No. - 139)
     15.1 OVERVIEW 
     15.2 KEY PLAYER STRATEGIES/RIGHT TO WIN 
             TABLE 108 OVERVIEW OF STRATEGIES DEPLOYED BY KEY MICRO-INVERTER MANUFACTURERS
             15.2.1 PRODUCT PORTFOLIO
             15.2.2 REGIONAL FOCUS
             15.2.3 SOLUTION OFFERINGS
             15.2.4 ORGANIC/INORGANIC STRATEGIES
     15.3 REVENUE ANALYSIS OF TOP COMPANIES 
             FIGURE 51 FIVE-YEAR REVENUE ANALYSIS OF TOP PLAYERS IN MICRO-INVERTER MARKET, 2018–2022
     15.4 MARKET SHARE ANALYSIS 
             TABLE 109 DEGREE OF COMPETITION IN MICRO-INVERTER MARKET, 2023
             FIGURE 52 MARKET SHARE ANALYSIS OF KEY PLAYERS, 2023
     15.5 EVALUATION MATRIX FOR KEY PLAYERS 
             15.5.1 STARS
             15.5.2 EMERGING LEADERS
             15.5.3 PERVASIVE PLAYERS
             15.5.4 PARTICIPANTS
                        FIGURE 53 EVALUATION MATRIX FOR KEY COMPANIES, 2023
             15.5.5 MICRO-INVERTER MARKET: COMPANY FOOTPRINT
                        TABLE 110 OVERALL FOOTPRINT (17 COMPANIES)
                        TABLE 111 TYPE FOOTPRINT (17 COMPANIES)
                        TABLE 112 APPLICATION FOOTPRINT (17 COMPANIES)
                        TABLE 113 REGION FOOTPRINT (17 COMPANIES)
     15.6 EVALUATION MATRIX FOR STARTUPS/SMALL AND MEDIUM-SIZED ENTERPRISES 
             15.6.1 PROGRESSIVE COMPANIES
             15.6.2 RESPONSIVE COMPANIES
             15.6.3 DYNAMIC COMPANIES
             15.6.4 STARTING BLOCKS
                        FIGURE 54 EVALUATION MATRIX FOR STARTUPS/SMALL AND MEDIUM-SIZED ENTERPRISES, 2023
             15.6.5 COMPETITIVE BENCHMARKING OF KEY STARTUPS/SMES
                        TABLE 114 MICRO-INVERTER MARKET: LIST OF KEY STARTUPS/SMES
                        TABLE 115 MICRO-INVERTER MARKET: COMPETITIVE BENCHMARKING OF KEY STARTUPS/SMES (8 COMPANIES)
     15.7 COMPETITIVE SCENARIO 
             15.7.1 PRODUCT LAUNCHES
                        TABLE 116 MICRO-INVERTER MARKET: PRODUCT LAUNCHES, 2020−2023
             15.7.2 DEALS
                        TABLE 117 MICRO-INVERTER MARKET: DEALS, 2020–2023
 
16 COMPANY PROFILES (Page No. - 155)
     16.1 KEY PLAYERS 
(Business Overview, Products/Solutions/Services Offered, Recent Developments, MnM view (Key strengths/Right to win, Strategic choices made, Weakness/competitive threats)*  
             16.1.1 ENPHASE ENERGY
                        TABLE 118 ENPHASE ENERGY: COMPANY OVERVIEW
                        FIGURE 55 ENPHASE ENERGY: COMPANY SNAPSHOT
                        TABLE 119 ENPHASE ENERGY: PRODUCTS OFFERED
                        TABLE 120 ENPHASE ENERGY: PRODUCT LAUNCHES
                        TABLE 121 ENPHASE ENERGY: DEALS
             16.1.2 ALTENERGY POWER SYSTEM INC.
                        TABLE 122 ALTENERGY POWER SYSTEM INC.: COMPANY OVERVIEW
                        TABLE 123 ALTENERGY POWER SYSTEM INC.: PRODUCTS OFFERED
                        TABLE 124 ALTENERGY POWER SYSTEM INC.: PRODUCT LAUNCHES
             16.1.3 HOYMILES
                        TABLE 125 HOYMILES: COMPANY OVERVIEW
                        FIGURE 56 HOYMILES: COMPANY SNAPSHOT
                        TABLE 126 HOYMILES: PRODUCTS OFFERED
                        TABLE 127 HOYMILES: PRODUCT LAUNCHES
             16.1.4 NINGBO DEYE INVERTER TECHNOLOGY CO., LTD.
                        TABLE 128 NINGBO DEYE INVERTER TECHNOLOGY CO., LTD.: COMPANY OVERVIEW
                        TABLE 129 NINGBO DEYE INVERTER TECHNOLOGY CO., LTD.: PRODUCTS OFFERED
             16.1.5 CHILICON POWER, LLC.
                        TABLE 130 CHILICON POWER, LLC.: COMPANY OVERVIEW
                        TABLE 131 CHILICON POWER, LLC.: PRODUCTS OFFERED
             16.1.6 AECONVERSION GMBH & CO. KG.
                        TABLE 132 AECONVERSION GMBH & CO. KG.: COMPANY OVERVIEW
                        TABLE 133 AECONVERSION GMBH & CO. KG.: PRODUCTS OFFERED
             16.1.7 ENVERTECH
                        TABLE 134 ENVERTECH: COMPANY OVERVIEW
                        TABLE 135 ENVERTECH: PRODUCTS OFFERED
             16.1.8 ZJBENY
                        TABLE 136 ZJBENY: COMPANY OVERVIEW
                        TABLE 137 ZJBENY: PRODUCTS OFFERED
             16.1.9 BLUESUN SOLAR CO., LTD
                        TABLE 138 BLUESUN SOLAR CO., LTD: COMPANY OVERVIEW
                        TABLE 139 BLUESUN SOLAR CO., LTD: PRODUCTS OFFERED
             16.1.10 SOLAR PANELS PLUS
                        TABLE 140 SOLAR PANELS PLUS: COMPANY OVERVIEW
                        TABLE 141 SOLAR PANELS PLUS: PRODUCTS OFFERED
     16.2 OTHER KEY PLAYERS 
             16.2.1 NORTHERN ELECTRIC POWER TECHNOLOGY INC.
                        TABLE 142 NORTHERN ELECTRIC POWER TECHNOLOGY INC.: COMPANY OVERVIEW
             16.2.2 SPARQ SYSTEMS
                        TABLE 143 SPARQ SYSTEMS: COMPANY OVERVIEW
             16.2.3 U R ENERGY
                        TABLE 144 U R ENERGY: COMPANY OVERVIEW
             16.2.4 LEADSOLAR ENERGY
                        TABLE 145 LEADSOLAR ENERGY: COMPANY OVERVIEW
             16.2.5 GRACE RENEWABLE ENERGY
                        TABLE 146 GRACE RENEWABLE ENERGY: COMPANY OVERVIEW
             16.2.6 ZHEJIANG SANDI ELECTRIC CO., LTD
                        TABLE 147 ZHEJIANG SANDI ELECTRIC CO., LTD: COMPANY OVERVIEW
             16.2.7 SUNROVER POWER CO., LTD
                        TABLE 148 SUNROVER POWER CO., LTD: COMPANY OVERVIEW
             16.2.8 YOTTA ENERGY
                        TABLE 149 YOTTA ENERGY: COMPANY OVERVIEW
             16.2.9 CRYSTAL SOLAR ENERGY
                        TABLE 150 CRYSTAL SOLAR ENERGY: COMPANY OVERVIEW
             16.2.10 HUAYU(NINGBO)NEW ENERGY TECHNOLOGIES CO., LTD.
                        TABLE 151 HUAYU(NINGBO)NEW ENERGY TECHNOLOGIES CO., LTD.: COMPANY OVERVIEW
             16.2.11 CHISAGEESS
                        TABLE 152 CHISAGEESS: COMPANY OVERVIEW
             16.2.12 TSUNESS CO., LTD.
                        TABLE 153 TSUNESS CO., LTD.: COMPANY OVERVIEW
             16.2.13 SHENZHEN WOCOR POWERAY TECHNOLOGY CO., LTD.
                        TABLE 154 SHENZHEN WOCOR POWERAY TECHNOLOGY CO., LTD.: COMPANY OVERVIEW
             16.2.14 NINGBO AUSTA SOLAR TECH CO., LTD.
                        TABLE 155 NINGBO AUSTA SOLAR TECH CO., LTD.: COMPANY OVERVIEW
             16.2.15 SUNSIGHTS ENERGY LLP
                        TABLE 156 SUNSIGHTS ENERGY LLP: COMPANY OVERVIEW
*Details on Business Overview, Products/Solutions/Services Offered, Recent Developments, MnM view (Key strengths/Right to win, Strategic choices made, Weakness/competitive threats)* might not be captured in case of unlisted companies.  
 
17 ADJACENT MARKET (Page No. - 188)
     17.1 INTRODUCTION 
     17.2 PHOTOVOLTAIC MARKET, BY APPLICATION 
             TABLE 157 PHOTOVOLTAIC MARKET, BY APPLICATION, 2019–2022 (USD BILLION)
             TABLE 158 PHOTOVOLTAIC MARKET, BY APPLICATION, 2023–2028 (USD BILLION)
     17.3 RESIDENTIAL 
             17.3.1 GOVERNMENT INCENTIVES ENCOURAGING ADOPTION OF PV SYSTEMS TO ACCELERATE SEGMENTAL GROWTH
                        TABLE 159 RESIDENTIAL: PHOTOVOLTAIC MARKET, BY COMPONENT, 2019–2022 (USD BILLION)
                        TABLE 160 RESIDENTIAL: PHOTOVOLTAIC MARKET, BY COMPONENT, 2023–2028 (USD BILLION)
                        TABLE 161 RESIDENTIAL: PHOTOVOLTAIC MARKET, BY REGION, 2019–2022 (USD BILLION)
                        TABLE 162 RESIDENTIAL: PHOTOVOLTAIC MARKET, BY REGION, 2023–2028 (USD BILLION)
     17.4 COMMERCIAL AND INDUSTRIAL 
             17.4.1 COMMERCIAL BUILDINGS, BANKS, EDUCATIONAL INSTITUTIONS, ENTERPRISES, AND HOSPITALS TO CONTRIBUTE TO SEGMENTAL GROWTH
                        TABLE 163 COMMERCIAL AND INDUSTRIAL: PHOTOVOLTAIC MARKET, BY COMPONENT, 2019–2022 (USD BILLION)
                        TABLE 164 COMMERCIAL AND INDUSTRIAL: PHOTOVOLTAIC MARKET, BY COMPONENT, 2023–2028 (USD BILLION)
                        TABLE 165 COMMERCIAL AND INDUSTRIAL: PHOTOVOLTAIC MARKET, BY REGION, 2019–2022 (USD BILLION)
                        TABLE 166 COMMERCIAL AND INDUSTRIAL: PHOTOVOLTAIC MARKET, BY REGION, 2023–2028 (USD BILLION)
     17.5 UTILITY 
             17.5.1 RISING FOCUS ON BUILDING ECOLOGICALLY SAFE POWER PLANTS TO BOOST DEMAND FOR PV SYSTEMS
                        TABLE 167 UTILITY: PHOTOVOLTAIC MARKET, BY COMPONENT, 2019–2022 (USD BILLION)
                        TABLE 168 UTILITY: PHOTOVOLTAIC MARKET, BY COMPONENT, 2023–2028 (USD BILLION)
                        TABLE 169 UTILITY: PHOTOVOLTAIC MARKET, BY REGION, 2019–2022 (USD BILLION)
                        TABLE 170 UTILITY: PHOTOVOLTAIC MARKET, BY REGION, 2023–2028 (USD BILLION)
 
18 APPENDIX (Page No. - 197)
     18.1 INSIGHTS FROM INDUSTRY EXPERTS 
     18.2 DISCUSSION GUIDE 
     18.3 KNOWLEDGESTORE: MARKETSANDMARKETS’ SUBSCRIPTION PORTAL 
     18.4 CUSTOMIZATION OPTIONS 
     18.5 RELATED REPORTS 
     18.6 AUTHOR DETAILS 


To estimate the size of the micro-inverter market, the study utilized four major activities. Exhaustive secondary research was conducted to gather information on the market, as well as its peer and parent markets. The next step was to validate these findings, assumptions, and sizing with industry experts across the value chain through primary research. Both top-down and bottom-up approaches were employed to estimate the total market size. Finally, market breakdown and data triangulation methods were utilized to estimate the market size for different segments and subsegments.

Secondary Research

In the secondary research process, various sources have been referred to for identifying and collecting information for this study on the micro-inverter market. Secondary sources for this research study include corporate filings (such as annual reports, investor presentations, and financial statements); trade, business, and professional associations, white papers, certified publications, articles by recognized authors, directories, and databases. The secondary data was collected and analyzed to determine the overall market size, further validated through primary research.

List of key secondary sources

SOURCE NAME

WEBLINK

Department of Energy

https://www.energy.gov/

International Energy Agency

https://www.iea.org/

United Nations Environment Programme

https://www.unep.org/

European Environment Agency

https://www.eea.europa.eu/

Primary Research

To gather insights on market statistics, revenue data, market breakdowns, size estimations, and forecasting, primary interviews were conducted. Additionally, primary research was used to comprehend the various technology, application, vertical, and regional trends. Interviews with stakeholders from the demand side, including CIOs, CTOs, CSOs, and customer/end-user installation teams using micro-inverter, were also conducted to understand their perspective on suppliers, products, component providers, and their current and future use of micro-inverter, which will impact the overall market. Several primary interviews were conducted across major countries of North America, Europe, Asia Pacific, the Middle East & Africa, and Latin America.

Micro-inverter Market
 Size, and Share

To know about the assumptions considered for the study, download the pdf brochure

Market Size Estimation

To estimate and validate the size of the micro-inverter market and its submarkets, both top-down and bottom-up approaches were utilized. Secondary research was conducted to identify the key players in the market, and primary and secondary research was used to determine their market share in specific regions. The entire process involved studying the annual and financial reports of top players and conducting extensive interviews with industry leaders such as CEOs, VPs, directors, and marketing executives. Secondary sources were used to determine all percentage shares and breakdowns, which were then verified through primary sources. All parameters that could impact the markets covered in this research study were accounted for, analyzed in detail, verified through primary research, and consolidated to obtain the final quantitative and qualitative data.

Global Micro-Inverter Market Size: Botton Up Approach

  • First, companies offering Micro-Inverter products have been identified, and their product mapping with respect to different parameters, such as offering, communication technology, type, power rating, connection type, sales channel, and application has been carried out.
  • The market size has been estimated based on the demand for different types of micro-inverters for different applications. The anticipated change in demand for micro-inverters offered by these companies in the recession and company revenues have been analyzed and estimated.
  • Primary research has been conducted with a few major players operating in the micro-inverters market to validate the global market size. Discussions included the recession impact on the micro-inverters ecosystem.
  • Then, the size of the micro-inverters market has been validated through secondary sources, which include the International Trade Centre (ITC), world trade organization, and world economic forum.
  • The CAGR of the micro-inverters market has been calculated considering the historical and future market trends and the impact of recession by understanding the adoption rate of micro-inverters for different applications.
  • The estimates at every level have been verified and cross-checked through discussions with key opinion leaders, such as corporate executives (CXOs), directors, and sales heads, as well as with the domain experts in MarketsandMarkets.
  • Various paid and unpaid information sources, such as company websites, annual reports, press releases, research journals, magazines, white papers, and databases, have also been studied.

Micro-inverter Market
 Size, and Botton Up Approach

Global Micro-Inverter Market Size: Top Down Approach

The top-down approach has been used to estimate and validate the total size of the micro-inverter market market.

  • Focusing initially on the R&D investments and expenditures being made in the ecosystem of the micro-inverter market, further splitting the market on the basis of offerings, communication technology, type, power rating, connection type, sales channel, and region and listing the key developments.
  • Identifying leading players in the micro-inverter market through secondary research and verifying them through brief discussions with industry experts
  • Analyzing revenue, product mix, geographic presence, and key applications for which products are served by all identified players to estimate and arrive at percentage splits for all key segments.
  • Discussing splits with industry experts to validate the information and identify key growth pockets across all key segments.
  • Breaking down the total market based on verified splits and key growth pockets across all segments.

Micro-inverter Market
 Size, and Top Down Approach

Data Triangulation

Once the overall size of the micro-inverter market was determined using the methods described above, it was divided into multiple segments and subsegments. Market engineering was performed for each segment and subsegment using market breakdown and data triangulation methods, as applicable, to obtain accurate statistics. To triangulate the data, various factors and trends from the demand and supply sides were studied. The market was validated using both top-down and bottom-up approaches.

Market Definition

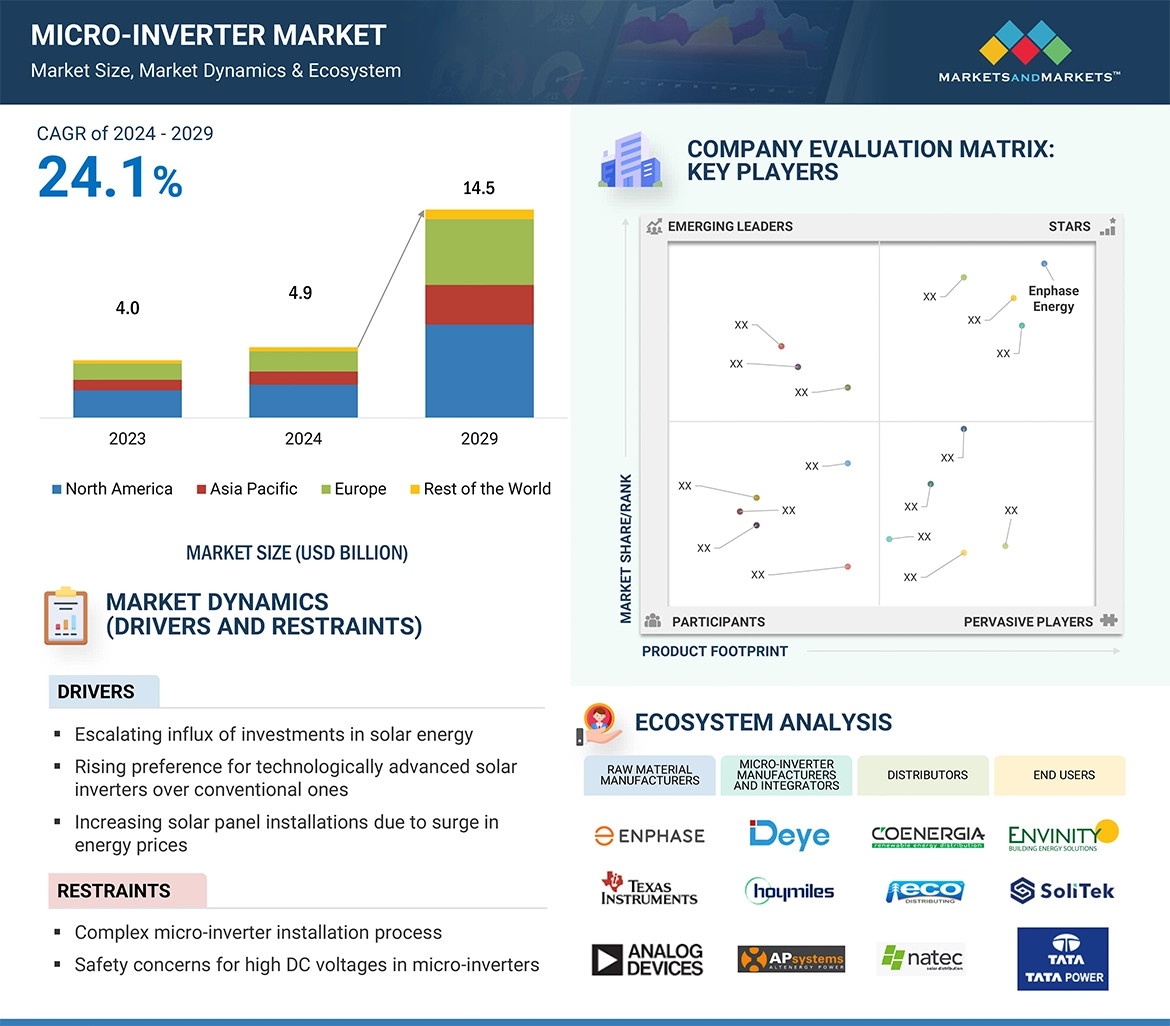
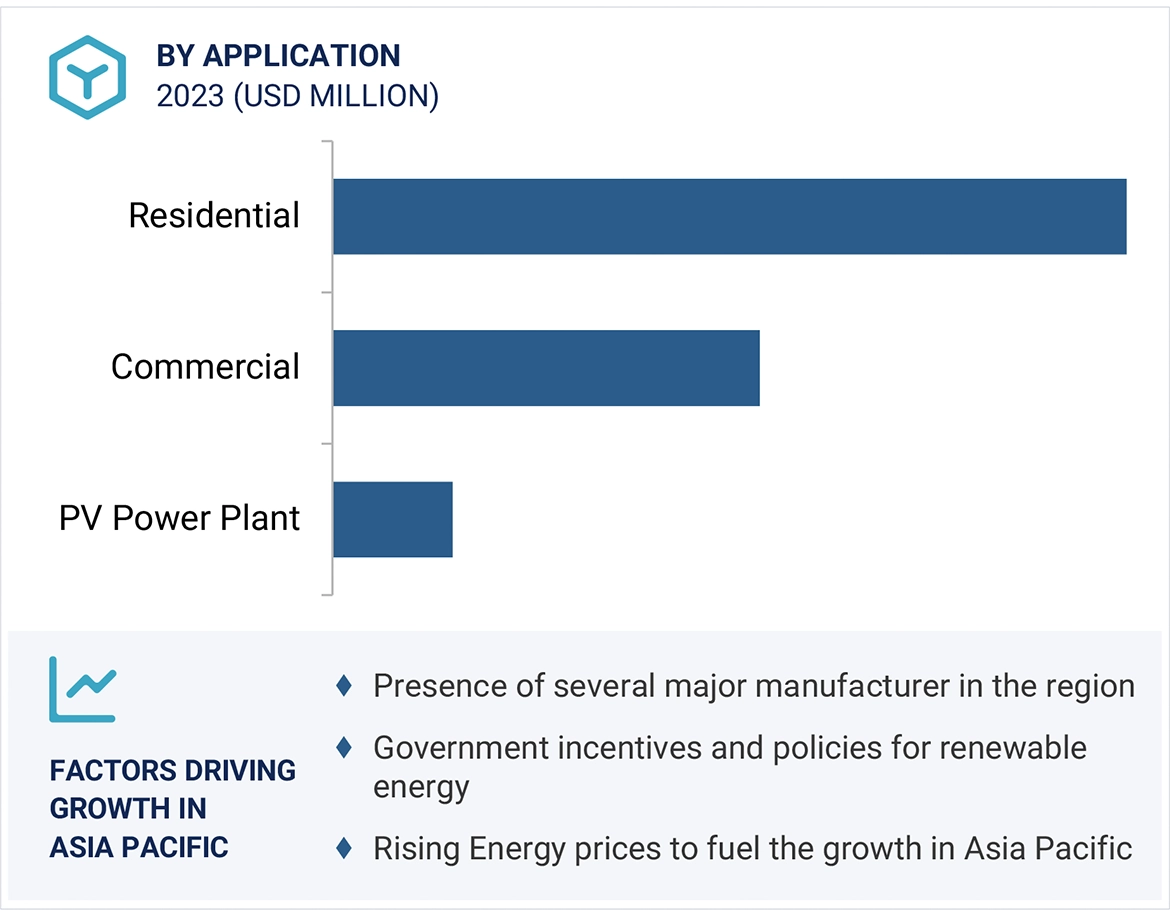
A micro-inverter is a device used in solar photovoltaic (PV) systems to convert direct current (DC) electricity generated by individual solar panels into alternating current (AC) electricity. Unlike traditional string inverters, which are designed to handle the output of multiple solar panels in a series, micro-inverters operate on a per-panel basis. Micro-inverters are often more flexible in terms of system design and installation. They can be used in complex roof layouts or situations where shading is a concern, offering greater design flexibility. The micro-inverters are used for applications such as residential, commercial, and PV power plants.

Key Stakeholders

  • Associations and industrial bodies
  • End-user industries
  • Government bodies such as regulating authorities and policymakers
  • Market research and consulting firms
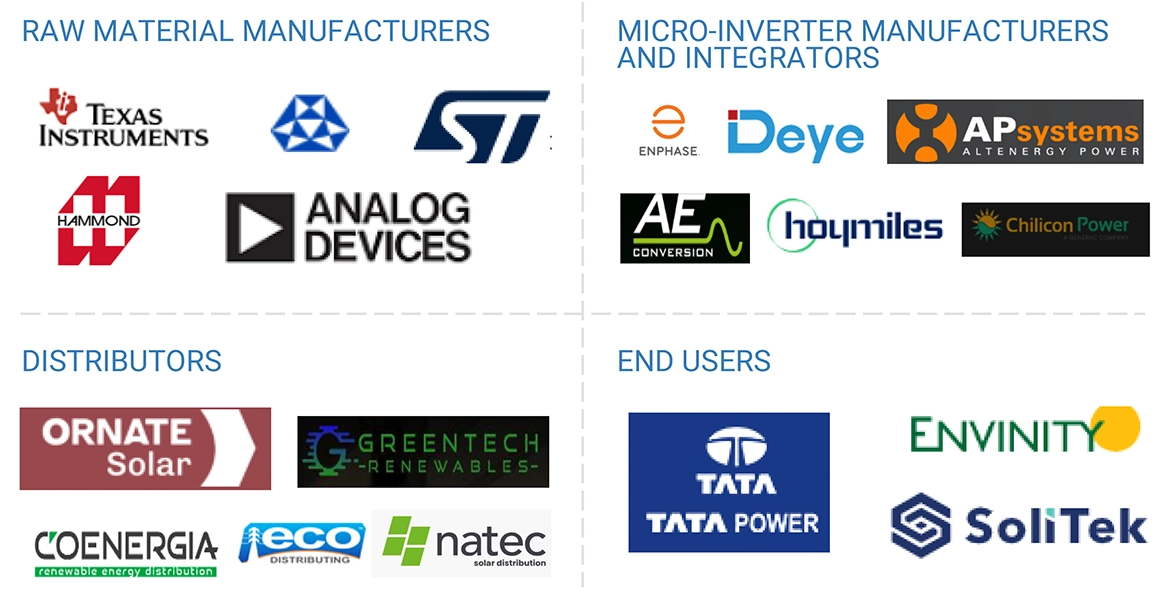
  • Raw material suppliers and distributors
  • Research institutes and organizations
  • Original equipment manufacturers (OEMs)
  • Micro-inverter system manufacturers
  • Micro-inverter system traders and suppliers

Report Objectives

  • To define, describe, and forecast the micro-inverter market based on offerings, communication technology, type, power rating, connection type, sales channel, application, and region.
  • To forecast the market size, in terms of value, for the concerned segments with regard to four main regions, namely, Americas, Europe, Asia Pacific (APAC), and Rest of the World (RoW)
  • To strategically analyze the micromarkets with regard to the individual growth trends, prospects, and contribution to the micro-inverter market
  • To provide detailed information regarding the major factors (drivers, restraints, opportunities, and industry-specific challenges) influencing the growth of the micro-inverter market
  • To analyze opportunities in the market for stakeholders and the details of the competitive landscape for the market leaders
  • To provide a detailed overview of the micro-inverter value chain
  • To benchmark players within the market using a proprietary “Competitive Leadership Mapping” framework, which analyzes market players on various parameters within the broad categories of business and product strategy
  • To analyze competitive developments such as partnerships, acquisitions, expansions, agreements, collaborations, contracts, and product launches, along with research and development (R&D) in the micro-inverter market
  • To strategically profile key players of the micro-inverter market and comprehensively analyze their market shares and core competencies

Available Customizations:

With the given market data, MarketsandMarkets offers customizations according to the specific requirements of companies. The following customization options are available for the report:

  • Detailed analysis and profiling of additional market players (up to 5)
  • Additional country-level analysis of the micro-inverter market

Product Analysis

  • Product matrix, which provides a detailed comparison of the product portfolio of each company in the micro-inverter market.
Custom Market Research Services

We will customize the research for you, in case the report listed above does not meet with your exact requirements. Our custom research will comprehensively cover the business information you require to help you arrive at strategic and profitable business decisions.

Request Customization
Report Code
SE 6610
Published ON
Jan, 2024
Choose License Type
BUY NOW
  • SHARE
X
Request Customization
Speak to Analyst
Speak to Analyst
OR FACE-TO-FACE MEETING
PERSONALIZE THIS RESEARCH
  • Triangulate with your Own Data
  • Get Data as per your Format and Definition
  • Gain a Deeper Dive on a Specific Application, Geography, Customer or Competitor
  • Any level of Personalization
REQUEST A FREE CUSTOMIZATION
LET US HELP YOU!
  • What are the Known and Unknown Adjacencies Impacting the Micro-inverter Market
  • What will your New Revenue Sources be?
  • Who will be your Top Customer; what will make them switch?
  • Defend your Market Share or Win Competitors
  • Get a Scorecard for Target Partners
CUSTOMIZED WORKSHOP REQUEST
+1-888-600-6441
  • Call Us
  • +1-888-600-6441 (Corporate office hours)
  • +1-888-600-6441 (US/Can toll free)
  • +44-800-368-9399 (UK office hours)
CONNECT WITH US
ABOUT TRUST ONLINE
©2024 MarketsandMarkets Research Private Ltd. All rights reserved
DMCA.com Protection Status Website Feedback