The study involved four major activities in estimating the current size of the medical electronics market—exhaustive secondary research collected information on the market, peer, and parent markets. The next step was to validate these findings, assumptions, and sizing with industry experts across the value chain through primary research. Both top-down and bottom-up approaches were employed to estimate the complete market size. After that, market breakdown and data triangulation were used to estimate the market size of segments and subsegments.
Secondary Research
Various secondary sources have been referred to in the secondary research process to identify and collect information important for this study. The secondary sources include annual reports, press releases, and investor presentations of companies; white papers; journals and certified publications; and articles from recognized authors, websites, directories, and databases. Secondary research has been conducted to obtain critical information about the industry’s supply chain, the market’s value chain, the total pool of key players, market segmentation according to the industry trends (to the bottom-most level), regional markets, and key developments from market- and technology-oriented perspectives. The secondary data has been collected and analyzed to determine the overall market size, further validated by primary research.
List of major secondary sources
Primary Research
Extensive primary research was conducted after gaining knowledge about the current scenario of the medical electronics market through secondary research. Several primary interviews were conducted with experts from the demand and supply sides across four major regions—North America, Europe, Asia Pacific, and RoW. This primary data was collected through questionnaires, emails, and telephonic interviews.

To know about the assumptions considered for the study, download the pdf brochure
Market Size Estimation
In the complete market engineering process, top-down and bottom-up approaches and several data triangulation methods have been used to estimate and forecast the overall market segments and subsegments listed in this report. Key players in the market have been identified through secondary research, and their market shares in the respective regions have been determined through primary and secondary research. This entire procedure includes the study of annual and financial reports of the top market players and extensive interviews for key insights (quantitative and qualitative) with industry experts (CEOs, VPs, directors, and marketing executives).
All percentage shares, splits, and breakdowns have been determined using secondary sources and verified through primary sources. All the parameters affecting the markets covered in this research study have been accounted for, viewed in detail, verified through primary research, and analyzed to obtain the final quantitative and qualitative data. This data has been consolidated and supplemented with detailed inputs and analysis from MarketsandMarkets and presented in this report. The following figure represents this study’s overall market size estimation process.
Bottom-Up Approach
The bottom-up approach was used to determine the overall size of the medical electronics market from the revenues of the key players and their shares in the market. The overall market size was calculated based on the revenues of the key players identified in the market.
-
Identifying entities in the supply chain influencing the entire medical electronics industry
-
Analyzing each entity, along with related major companies
-
Identifying technology providers for deployment of components
-
Estimating market for medical electronics end users
-
Tracking ongoing and upcoming implementation of medical electronic components developments by various companies and forecasting market based on these developments and other critical parameters
-
Arriving at market size by analyzing medical electronics companies based on their countries and combining it to obtain market estimates by region
-
Verifying estimates and crosschecking them through a discussion with key opinion leaders, including chief experience officers (CXOs), directors, and operation managers

Top-Down Approach
In the top-down approach, the overall market size has been used to estimate the size of individual markets (mentioned in the market segmentation) through percentage splits from secondary and primary research.
The most appropriate immediate parent market size has been used to implement the top-down approach to calculate the market size of specific segments. A top-down approach was implemented for the data extracted from the secondary research to validate the market size obtained.
Each company’s market share has been estimated to verify the revenue shares used earlier in the top-down approach. This study has determined and confirmed the overall parent market and individual market sizes by the data triangulation method and data validation through primaries. The data triangulation method in this study is explained in the next section.
-
Focusing initially on topline investments by market players in the medical electronics ecosystem
-
Calculating market size based on revenue generated by market players through sales of medical electronics
-
Mapping the use of medical electronics in different equipment/ device types
-
Building and developing information related to revenue generated by market players through key products
-
Estimating geographic split using secondary sources considering factors such as number of players in a specific country and region, role of key players in developing innovative products, and adoption and penetration rates for various components and end uses in a particular country

Data Triangulation
After arriving at the overall market size from the above estimation process, the market has been split into several segments and subsegments. The data triangulation procedure has been employed wherever applicable to complete the overall market engineering process and arrive at the exact statistics for all segments and subsegments. The data has been triangulated by studying various factors and trends from both the demand and supply sides. Additionally, the market size has been validated using top-down and bottom-up approaches.
Market Definition
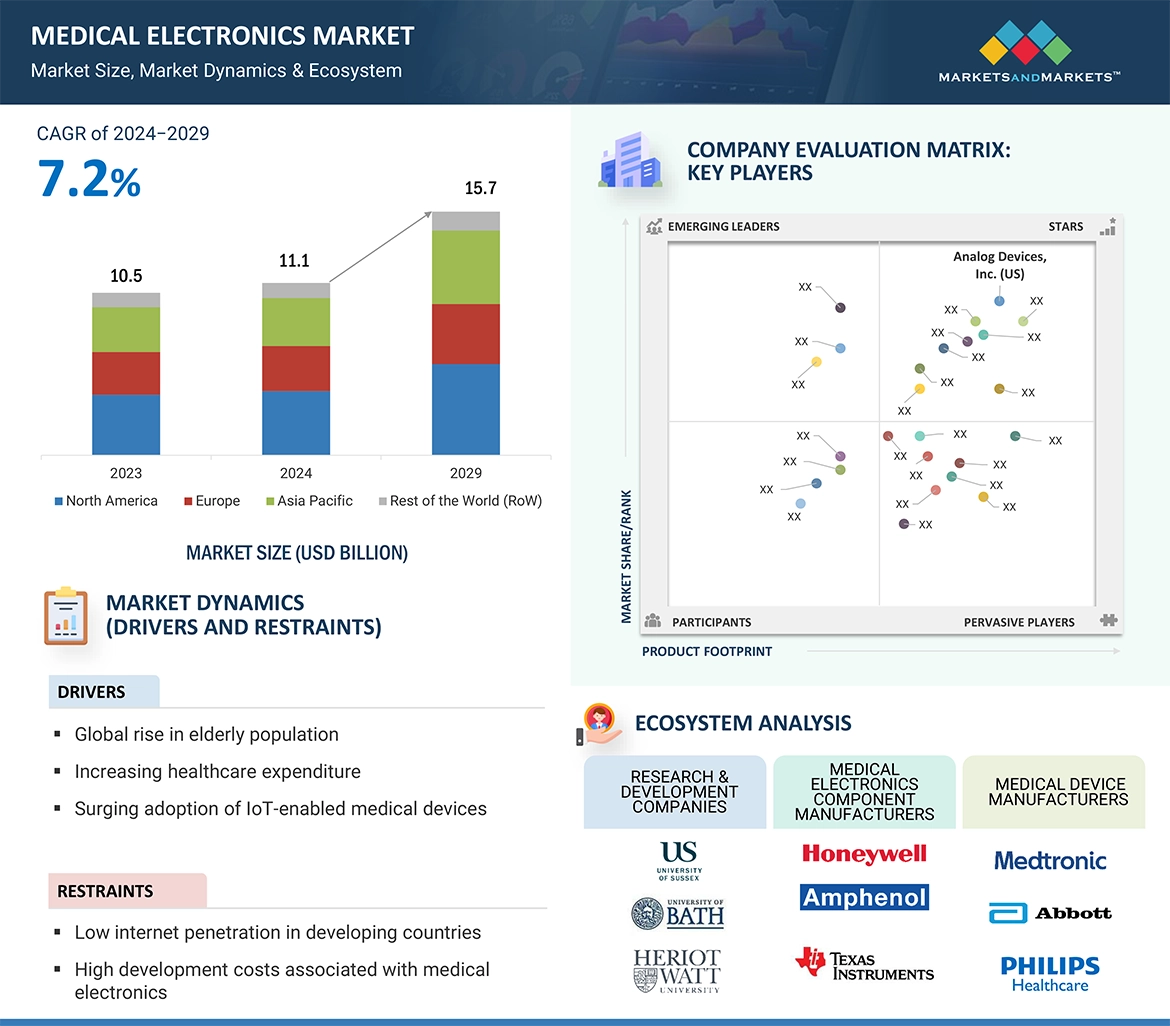
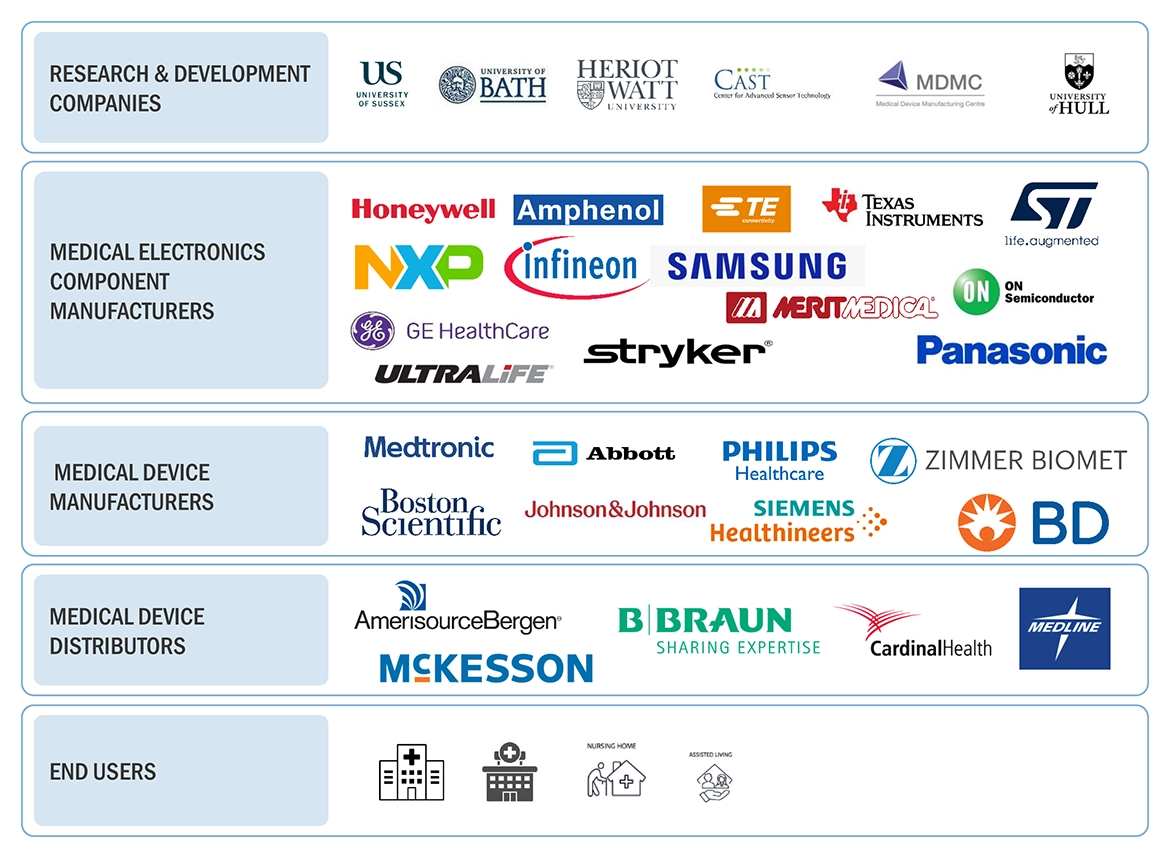
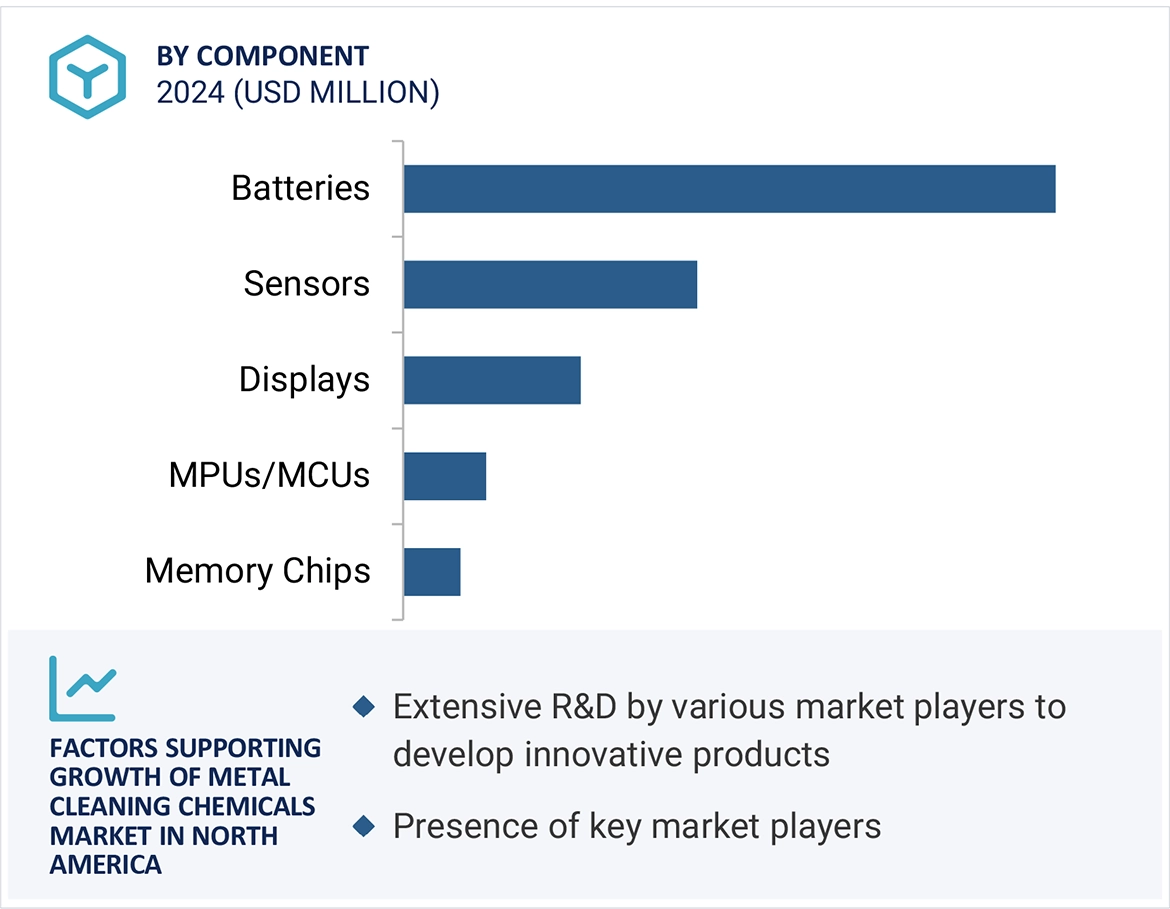
The term medical electronics refers to components such as sensors, memory devices, microcontrollers/microprocessors, batteries, and displays that are deployed in medical devices, and these components support multiple wireless and wired medical imaging, monitoring, and implantable devices.
Key Stakeholders
-
Original equipment manufacturers (OEMs)
-
Original device manufacturers (ODMs)
-
Component suppliers
-
Semiconductor component and device manufacturers
-
Product manufacturers
-
Component and device suppliers and distributors
-
Medical technology providers
-
Standardization and testing firms
-
Government bodies such as regulatory authorities and policymakers
-
Associations, organizations, forums, and alliances related to semiconductor, electronics, and medical equipment industries
-
Research institutes and organizations
-
Market research and consulting firms
-
End Users
Report Objectives
-
To describe and forecast the size of the medical electronics market, in terms of value, by component, medical equipment/device type, medical procedure, medical device classification, medical facility, and region
-
To estimate the size of the medical electronics market, in terms of volume, by medical sensor type
-
To forecast the market, in terms of value, for various segments with regard to four main regions: North America, Europe, Asia Pacific, and RoW
-
To provide detailed information regarding the major factors, such as drivers, restraints, opportunities, and industry-specific challenges, influencing the growth of the medical electronics market
-
To analyze the micromarkets1 with respect to individual growth trends, prospects, and contributions to the total market
-
To study the complete supply chain and allied industry segments and perform a value chain analysis of the medical electronics landscape
-
To strategically analyze the regulatory landscape, tariff, standards, patents, Porter's Five Forces, import and export scenarios, trade values, and case studies pertaining to the market under study
-
To analyze the opportunities in the market for various stakeholders by identifying the high-growth segments of the medical electronics market
-
To profile the key players and comprehensively analyze their market position in terms of ranking and core competencies2, along with detailing the competitive landscape for market leaders
-
To analyze competitive developments, such as product launches, acquisitions strategies, partnerships, and expansions, in the medical electronics market
Available Customizations:
With the given market data, MarketsandMarkets offers customizations according to the specific requirements of companies. The following customization options are available for the report:
-
Detailed analysis and profiling of additional market players (up to 5)
-
Additional country-level analysis of the medical electronics market
Product Analysis
-
Product matrix provides a detailed comparison of the product portfolio of each company in the medical electronics market.


Ajay
Aug, 2022
We are a product development firm interested in tailoring our offering to specific markets so we can be more targeted with our internal investments. To do so requires an understanding of the different markets so we can pick and choose the right fit for us. .
Duane
Aug, 2022
We are looking to obtain information regarding opportunities within the Medical Manufacturing field and how our experience can translate into future Projects..
Byron
Aug, 2022
Hello, this is Byron from the comen medical company, I want to know about the access policy of the Israeli medical device market and the general situation and the market share, etc. of the Israeli medical device market. Can you send me samples for reference? .
Alan
Sep, 2019
Looking for data on national and global market for recycling of computers, hard drives and data security related to the transition when companys update their equipment and need to safely and responsibly remove and replace there computers and software. .
Elliot
Sep, 2015
Particularly interested in interoperable devices and medical record systems, as well as security/privacy issues related to this market..