
Material Informatics Market Size, Share & Trends, 2025 To 2030

Material Informatics Market by Material (Chemicals, Superalloys, Solid-state Electrolytes, Composites), Technique (Statistical Analysis, Genetic Algorithm), Application (Materials Discovery, Product Development) and Region - Global Forecast to 2030


OVERVIEW
Source: Secondary Research, Interviews with Experts, MarketsandMarkets Analysis
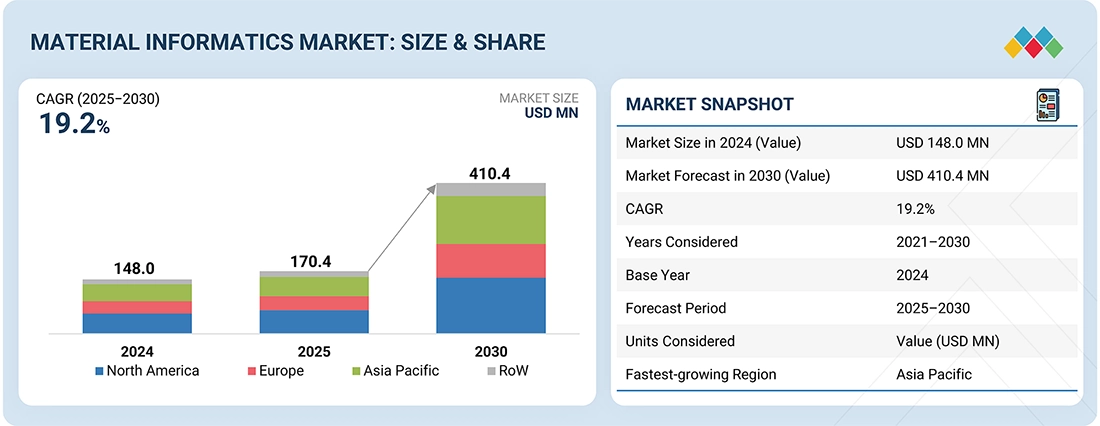
The global material informatics market is projected to grow from USD 170.4 million in 2025 to USD 410.4 million by 2030, at a CAGR of 19.2% during the forecast period. This growth is driven by the increasing use of AI in the discovery and development of materials. AI applications are gaining popularity for high-throughput screening, data-driven decision-making in materials chemistry, property estimation, and optimization.
KEY TAKEAWAYS
-
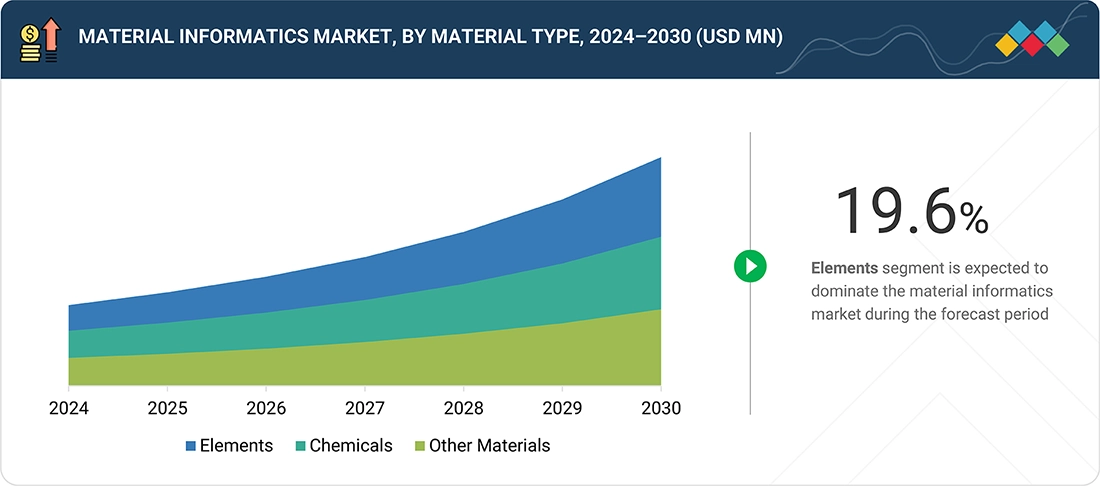
BY MATERIAL TYPEBy material type, the elements segment held the largest share of ~49.0% of the material informatics market in 2024.
-
BY INDUSTRYBy industry, material science is expected to exhibit the highest CAGR of 20.2% in the materials informatics market during the forecast period.
-
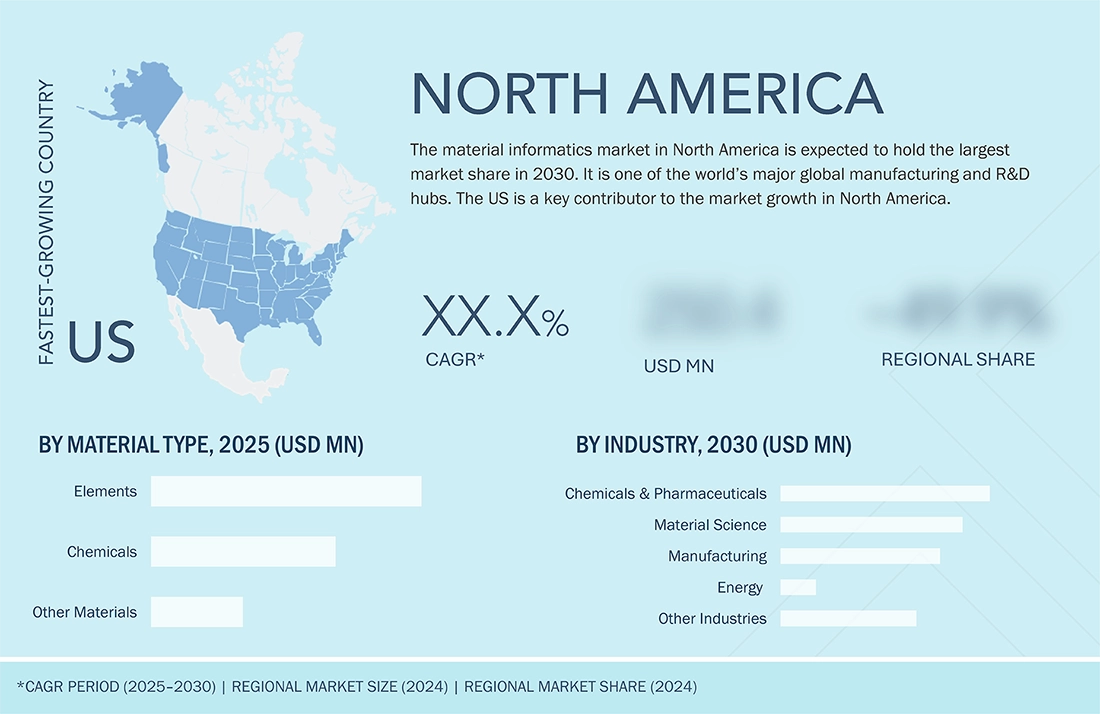
BY REGIONBy region, North America is expected to account for the largest market share in 2025.
-
COMPETITIVE LANDSCAPEThe leading players in the market are Schrödinger, Inc., Dassault Systèmes, Exabyte Inc., Citrine Informatics, and Phaseshift Technologies. Competition is fueled by rapid innovation and added features in software.
Material informatics is becoming increasingly important in fields such as high-throughput screening, data-driven decision-making in materials chemistry, property estimation, and optimization. Platforms for material informatics leverage artificial intelligence algorithms, including graph neural networks (GNNs) and physics-informed neural networks (PINNs), to analyze large datasets, identify patterns, and provide predictive insights into material behavior at the atomic level. Additionally, the growing use of environmentally friendly materials in industries like automotive, electronics, and packaging is further driving the adoption of material informatics solutions.
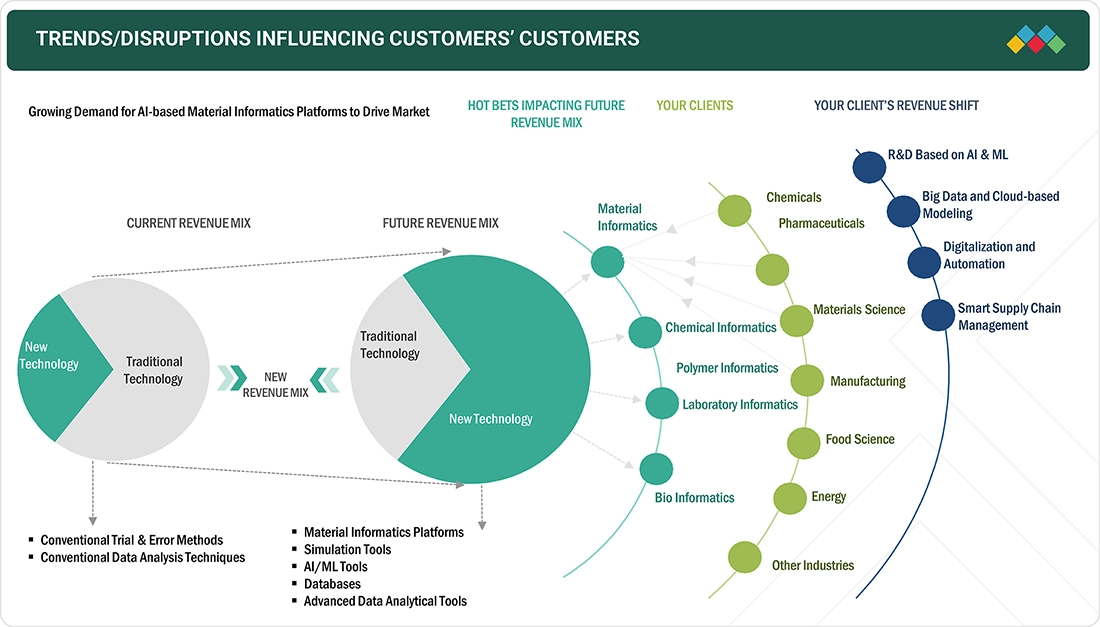
TRENDS & DISRUPTIONS IMPACTING CUSTOMERS' CUSTOMERS
The material informatics market has been rapidly evolving, driven by the convergence of big data analytics, machine learning, and advanced computational methods in the field of materials science. Recent trends indicate a shift toward leveraging artificial intelligence to predict material properties and behaviors, significantly reducing the time and cost associated with experimental testing. Additionally, the widespread adoption of cloud computing and the growth of open-access materials databases are democratizing the field and facilitating collaboration between academia and industry.
Source: Secondary Research, Interviews with Experts, MarketsandMarkets Analysis
MARKET DYNAMICS
Level
-
Increasing reliance on AI technology to speed up material discovery and deployment

-
Rising government initiatives to provide low-cost clean energy materials

Level
-
Shortage of technical experts

-
High costs of maintenance and services

Level
-
Emerging applications of large language models (LLMs) in material development

-
Ease of building material databases using digital technologies

Level
-
Insufficient data volume and quality

Source: Secondary Research, Interviews with Experts, MarketsandMarkets Analysis
Driver: Increasing reliance on AI technology to speed up material discovery and deployment
The rapid adoption of AI in materials science has shown remarkable success in areas, such as batteries, solar cells, and environmentally friendly materials. Data analytics allows the processing and examination of vast datasets, uncovering patterns and relationships in material properties that were previously difficult to identify.
Restraint: Shortage of technical experts
Material informatics is a complex, integrated solution that combines various software applications and digital tools with different database systems. It is essential to have experts with the appropriate skill sets to effectively implement materials informatics in necessary applications.
Opportunity: Emerging applications of large language models (LLMs) in material development
The emerging applications of large language models (LLMs) in material development are changing material discovery, design, and optimization processes to a great extent. With the power of LLMs, businesses can speed up the discovery and design of new materials, providing new opportunities for expansion. LLMs can examine huge datasets with data on material properties, composition, and performance characteristics, which allows the quick identification of new materials with specific attributes.
Challenge: Insufficient data volume and quality
Lack of data volume and quality substantially impede the development and adoption of material informatics since these factors directly influence the accuracy and reliability of Al-based models for material discovery and optimization. Data are produced from diverse sources across the field of material science, from laboratory experiments to computational simulations and archives. These data sets are often inconsistent or proprietary and are not necessarily able to be utilized for training machine-learning models.
Material Informatics Market: COMMERCIAL USE CASES ACROSS INDUSTRIES
| COMPANY | USE CASE DESCRIPTION | BENEFITS |
|---|---|---|
 |
Provides automated machine learning tools and physics based molecular modeling platform for materials science applications across aerospace, energy, semiconductors, and electronic displays | Integrates physics-based simulation with ML for accurate predictions. Enables prediction of material properties at molecular level |
 |
BIOVIA Materials Studio delivers modeling, simulation, and materials informatics solutions for predicting and optimizing material properties at the molecular level | Streamlines material design process through virtual testing |
 |
AI-driven materials and chemicals development platform that ingests data from patents, research papers, and databases to predict material behavior | Reduces development time to 1/2 to 1/5 of traditional timelines |
 |
Provides materials informatics (MI) solutions powered by AI and data analytics that utilize computational science techniques to predict target material performance based on past experimental data | Enables the discovery of new formulations difficult to achieve through traditional R&D |
 |
SaaS platform leveraging generative AI and materials science to enhance product innovation, performance, and sustainability | Generates physically possible results that fit design constraints |
Logos and trademarks shown above are the property of their respective owners. Their use here is for informational and illustrative purposes only.
MARKET ECOSYSTEM
The material informatics ecosystem comprises software providers, service providers, and end users of the material informatics market. Software providers offer tools that utilize AI and machine learning for predicting material properties, simulation, and data management. Service providers offer consulting and custom R&D services to integrate material informatics into business processes, helping industries such as aerospace, automotive, and energy.
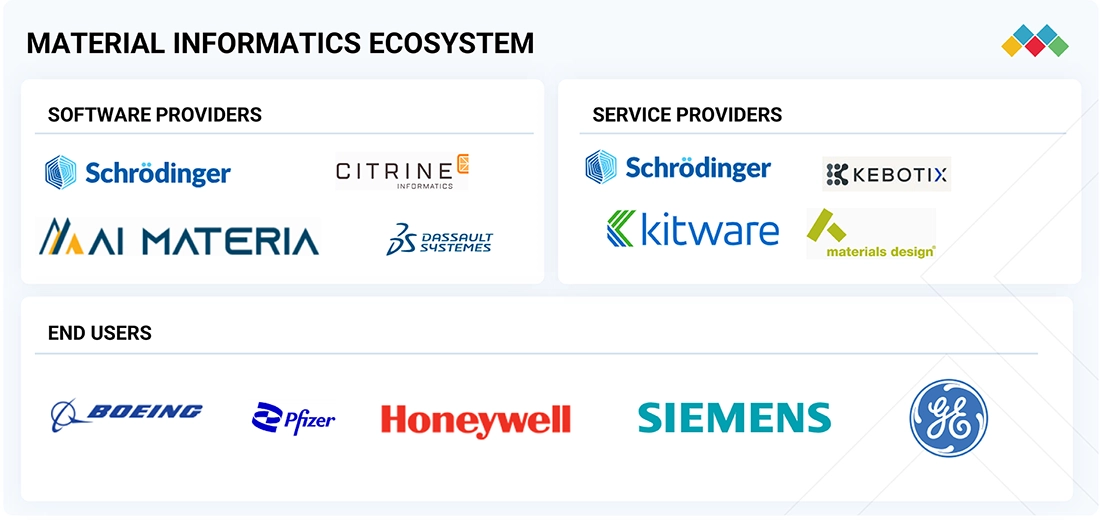
Logos and trademarks shown above are the property of their respective owners. Their use here is for informational and illustrative purposes only.
MARKET SEGMENTS
Source: Secondary Research, Interviews with Experts, MarketsandMarkets Analysis
Material Informatics Market, by Material Type
The elements segment accounts for the largest share of the material informatics market. Material informatics employs data-driven methods, computational resources, and extensive databases to enhance the discovery, design, and utilization of elemental materials. It enables high-throughput screening, catalyst design, and additive manufacturing, promoting the efficient, cost-effective, and environmentally friendly use of elements. Additionally, it plays a crucial role in developing quantum materials, tailoring elemental properties, and providing deeper insights into elemental behavior across various scales.
Material Informatics Market, by Industry
The chemicals & pharmaceuticals industry is undergoing a sudden transformation due to rapid globalization, intensified competition in the area of development, and swift technological progress. This drives business enterprises to deliver high-value-added and differentiated chemicals and allied products. Drug discovery comprises the utilization of chemical informatics tools to access and store chemical information, structural-chemical information, and biological information.
REGION
North America to hold the largest market share in the global material informatics market during the forecast period
The material informatics market in North America is expected to hold the largest market share in 2030. It is one of the world’s major global manufacturing and R&D hubs. The US is a key contributor to the market growth in North America. The region is home to numerous large aerospace companies, which are accelerating the demand for material informatics. It also has a vast scope for funding in chemical and material research. Federal agencies distribute funds through contracts, grants, and cooperative agreements to support basic and applied research, startup endeavors, and education and training.
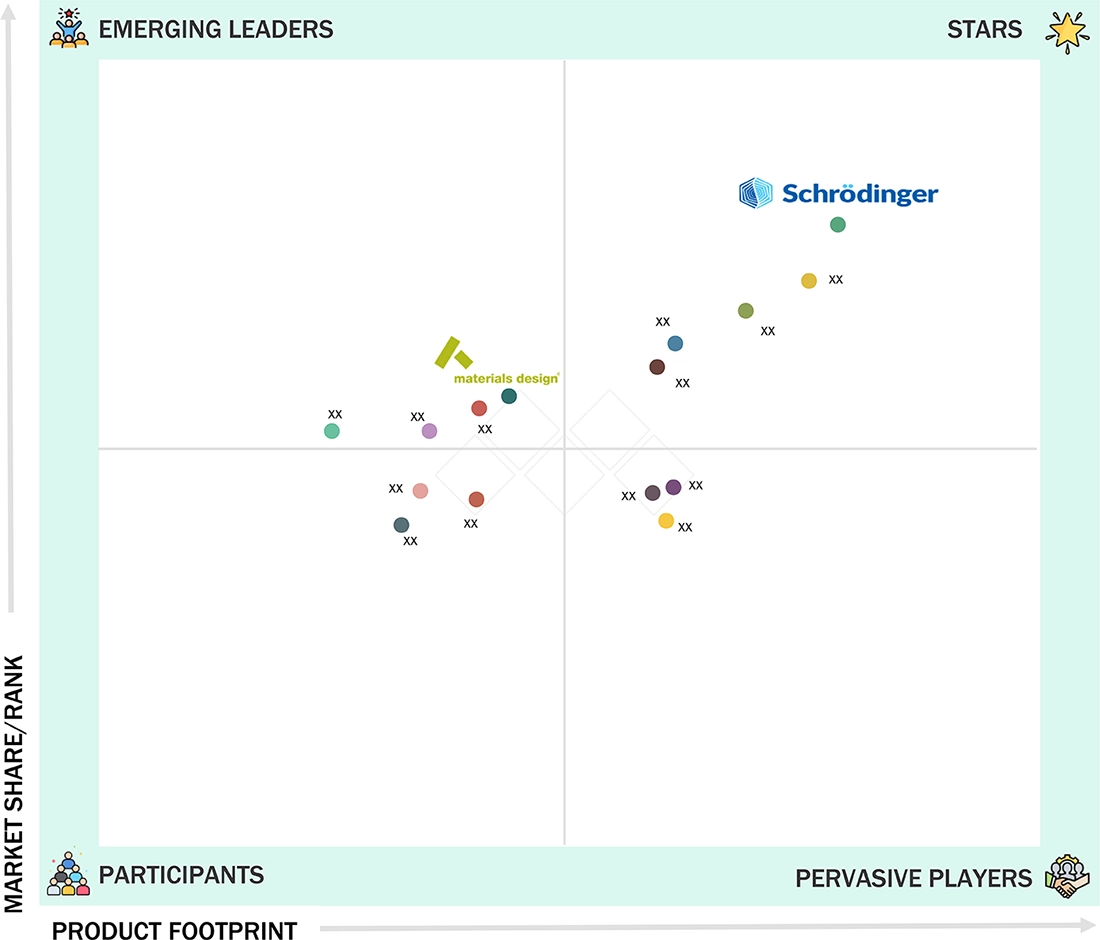
Material Informatics Market: COMPANY EVALUATION MATRIX
In the material informatics market matrix, Schrödinger Inc. (Star) and Material Design, Inc. (Emerging Leader) occupy prominent positions due to their robust product portfolios, global presence, and partnerships.
Source: Secondary Research, Interviews with Experts, MarketsandMarkets Analysis
KEY MARKET PLAYERS
MARKET SCOPE
| REPORT METRIC | DETAILS |
|---|---|
| Market Size in 2024 (Value) | USD 148.0 Million |
| Market Forecast in 2030 (Value) | USD 410.4 Million |
| Growth Rate | CAGR of 19.2% from 2025-2030 |
| Years Considered | 2021–2030 |
| Base Year | 2024 |
| Forecast Period | 2025–2030 |
| Units Considered | Value (USD Million) |
| Report Coverage | Revenue Forecast, Company Ranking, Competitive Landscape, Growth Factors, and Trends |
| Segments Covered |
|
| Regions Covered | North America, Europe, Asia Pacific, Middle East, and RoW |
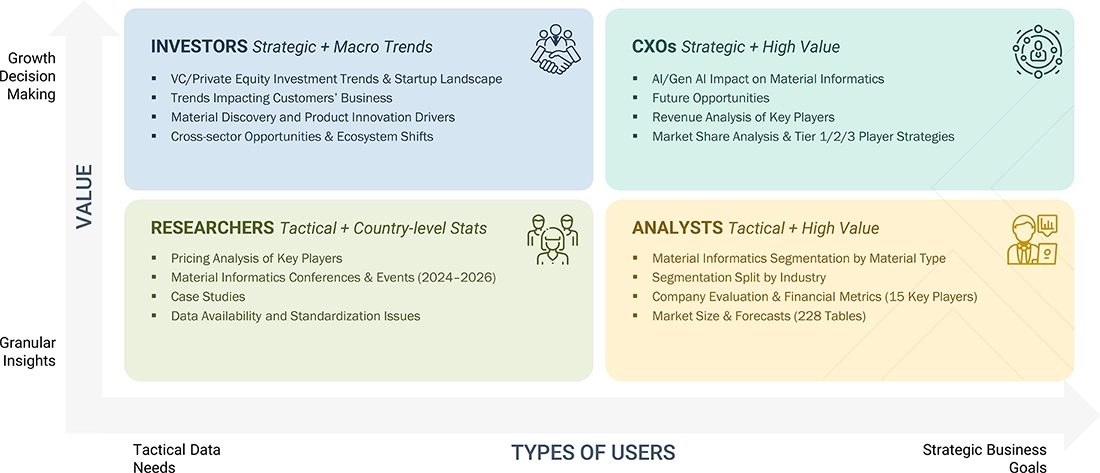
WHAT IS IN IT FOR YOU: Material Informatics Market REPORT CONTENT GUIDE
DELIVERED CUSTOMIZATIONS
We have successfully delivered the following deep-dive customizations:
| CLIENT REQUEST | CUSTOMIZATION DELIVERED | VALUE ADDS |
|---|---|---|
| Need for competitor benchmarking across global material informatics startups | Created a customized comparative matrix covering funding, partnerships, and product positioning | Enabled client to identify acquisition targets and strategic alliances |
| Request for customer segmentation and demand forecasting for key user industries | Built a demand model based on end-user adoption curves, R&D expenditure, and digital maturity levels | Helped refine client’s sales pipeline and prioritize high-growth segments |
| Demand for regional analysis of materials informatics adoption in the Asia Pacific | Developed a regional deep-dive with country-level adoption trends, regulatory landscape, and local ecosystem mapping | Supported client’s localization strategy and market entry planning |
RECENT DEVELOPMENTS
- December 2024 : MaterialsZone (Israel), a leading solution for Lean R&D in materials innovation, has announced the launch of its AI-guided product development feature. This new feature provides users with direct access to AI-generated experiment suggestions, allowing them to streamline their development cycles within their existing workflows.
- December 2024 : Materials Design, Inc. (US) announced the release of MedeA 3.10, the next version of its MedeA software package. MedeA 3.10 offers an integrated suite of multiscale modeling capabilities with advanced features that empower researchers to explore and design materials at unprecedented precision and efficiency.
- April 2024 : QuesTek International LLC (US) and Materials Design, Inc. (US) announced a partnership. The partnership will connect MedeA Environment outputs to ICMD models to provide common clients with the most accurate predictive and prescriptive materials designs and compositions.
Table of Contents
 Exclusive indicates content/data unique to MarketsandMarkets and not available with any competitors.
Methodology
The study involved major activities in estimating the current market size for the material informatics market. Exhaustive secondary research was done to collect information on the industry. The next step was to validate these findings, assumptions, and sizing with industry experts across the value chain using primary research. Different approaches, such as top-down and bottom-up, were employed to estimate the total market size. After that, the market breakup and data triangulation procedures were used to estimate the market size of the segments and subsegments of the material informatics market.
Secondary Research
The market for the companies offering material informatics software is arrived at by secondary data available through paid and unpaid sources, analyzing the product portfolios of the major companies in the ecosystem, and rating the companies by their performance and quality. Various sources were referred to in the secondary research process to identify and collect information for this study. The secondary sources include annual reports, press releases, investor presentations of companies, white papers, journals, certified publications, and articles from recognized authors, directories, and databases. In the secondary research process, various secondary sources were referred to for identifying and collecting information related to the study. Secondary sources included annual reports, press releases, and investor presentations of vendors, forums, certified publications, and whitepapers. The secondary research was used to obtain critical information on the industry's value chain, the total pool of key players, market classification, and segmentation from the market and technology-oriented perspectives.
Primary Research
Extensive primary research has been conducted after understanding and analyzing the current scenario of the material informatics market through secondary research. Several primary interviews have been conducted with the key opinion leaders from the demand and supply sides across four main regions—North America, Europe, Asia Pacific, and the Rest of World. Approximately 30% of the primary interviews were conducted with the demand-side respondents, while approximately 70% were conducted with the supply-side respondents. The primary data has been collected through questionnaires, emails, and telephone interviews.
After interacting with industry experts, brief sessions were conducted with highly experienced independent consultants to reinforce the findings from our primary. This, along with the in-house subject matter experts’ opinions, has led us to the findings as described in the remainder of this report. The breakdown of primary respondents is as follows:

Note: “Others” includes sales, marketing, and product managers
To know about the assumptions considered for the study, download the pdf brochure
Market Size Estimation
Both top-down and bottom-up approaches wete used to estimate and validate the total size of the material informatics market. These methods were also used extensively to estimate the size of various subsegments in the market. The research methodology used to estimate the market size includes the following:
Material Informatics Market : Top-Down and Bottom-Up Approach

Data Triangulation
After arriving at the overall market size using the market size estimation processes as explained above, the market was split into several segments and subsegments. The data triangulation and market breakdown procedures were employed, wherever applicable, to complete the overall market engineering process and arrive at the exact statistics of each market segment and subsegment. The data was triangulated by studying various factors and trends from the demand and supply sides.
Market Definition
Material informatics is a branch of study that applies the fundamentals of informatics to materials science and engineering to enhance the understanding, use, selection, development, and discovery of various materials. This field has gained traction in recent years due to integrating various information technologies, such as artificial intelligence, simulations, cloud computing, security, big data analytics, and machine learning, into materials science and engineering. It is a software platform with the help of which it has become possible for researchers, academicians, and material experts to understand a spectrum of material properties, combinatorial chemistry, process modeling, materials property databases, materials data management, and product life cycle management.
Key Stakeholders
- Materials science and engineering-related associations, forums, and alliances
- Software vendors and technology providers
- Automotive, chemicals, aerospace, semiconductor & electronics,
- food science, materials science, and other end-use industries
- IT services providers
- Cloud service providers
- Original technology designers and suppliers
- Research institutes and organizations
- Materials science industry-related standard organizations and regulatory authorities
- Materials research and consulting firms
Report Objectives
- To define, describe, and forecast the global material informatics market, by material type, industry, and region, in terms of value
- To describe and forecast the market for several countries in four main regions—North America, Europe, Asia Pacific, and the Rest of the World (RoW), in terms of value
- To provide detailed information regarding drivers, restraints, opportunities, and challenges that influence the market growth
- To describe prominent techniques involved in material informatics
- To strategically analyze micromarkets1 with respect to individual growth trends, prospects, and contributions to the total market
- To study the complete value chain of the material informatics ecosystem, along with market trends and use cases
- To study and analyze technology trends, average subscription pricing, regulatory landscape, trends/disruptions impacting customer business, and key criteria for buying material informatics platforms
- To analyze opportunities for stakeholders by identifying high-growth segments of the global material informatics market
- To strategically profile key players and comprehensively analyze their core competencies2 along with detailing the competitive landscape for market leaders
- To analyze competitive developments, such as product launches, acquisitions, partnerships, and expansions, in the global material informatics market
- To benchmark market players using the company evaluation matrix, which analyzes players based on various parameters with respect to business categories and product strategies
Available Customizations
With the given market data, MarketsandMarkets offers customizations according to the specific requirements of companies. The following customization options are available for the report:
- Detailed analysis and profiling of additional market players based on various blocks of the supply chain
Key Questions Addressed by the Report
Need a Tailored Report?
Customize this report to your needs
Get 10% FREE Customization
Customize This ReportPersonalize This Research
- Triangulate with your Own Data
- Get Data as per your Format and Definition
- Gain a Deeper Dive on a Specific Application, Geography, Customer or Competitor
- Any level of Personalization
Let Us Help You
- What are the Known and Unknown Adjacencies Impacting the Material Informatics Market
- What will your New Revenue Sources be?
- Who will be your Top Customer; what will make them switch?
- Defend your Market Share or Win Competitors
- Get a Scorecard for Target Partners

Custom Market Research Services
We Will Customise The Research For You, In Case The Report Listed Above Does Not Meet With Your Requirements
Get 10% Free Customisation


Growth opportunities and latent adjacency in Material Informatics Market