This comprehensive market research study on the IT operations analytics market involved the use of extensive secondary sources, directories, as well as several journals and magazines, such as European Journal of Information Systems, International Journal of Data Science and Analytics, and ITOA Magazine, to identify and collect relevant information. The primary sources were mainly industry experts from the core and related industries, preferred ITOA solution providers, third-party service providers, consulting service providers, end users, and other commercial enterprises. In-depth interviews were conducted with various primary respondents, including key industry participants and subject-matter experts, to obtain and verify critical qualitative and quantitative information, as well as assess the prospects.
Secondary Research
The market size of companies across the globe offering IT operations analytics solutions and services was arrived at based on the secondary data available through paid and unpaid sources. It was also arrived at by analyzing the product portfolios of major companies and rating companies based on their performance and quality.
In the secondary research process, various sources were referred to for identifying and collecting information for this study. The secondary sources included annual reports, press releases, and investor presentations of companies; white papers, journals, and certified publications; and articles from recognized authors, directories, and databases. Data on IT operations analytics spending was collected from secondary sources, such as IT operations analytics conferences and related magazines. Secondary research was mainly used to obtain key information about the industry’s value chain and supply chain to identify the key players by solution, service, market classifications, and segmentation according to offerings of the major players and industry trends related to solutions, technologies, applications, end user, and regions, and key developments from both market- and technology-oriented perspectives.
Primary Research
In the primary research process, various primary sources from both supply and demand sides were interviewed to obtain qualitative and quantitative information on the market. The primary sources from the supply side included various industry experts, such as Chief Experience Officers (CXOs), Vice Presidents (VPs), directors from the business development department, marketing experts, product development/innovation n teams, and related key executives from ITOA solution vendors, SIs, professional service providers, industry associations, and key opinion leaders.
Primary interviews were conducted to gather insights, such as market statistics, data of revenue collected from the solutions, and services, market breakups, market size estimations, market forecasting, and data triangulation. Primary research also helped in understanding the various trends related to technology, application, deployment, and region. Stakeholders from the demand side, such as Chief Information Officers (CIOs), Chief Technology Officers (CTOs), and Chief Strategy Officers (CSOs), and installation teams of the governments/end users using ITOA solutions were interviewed to understand the buyers’ perspective on the suppliers, products, and service providers; and their current usage of ITOA solutions and services and how it would affect the overall ITOA market.
The following is the breakup of primary profiles:
 Market Size, and Share")
To know about the assumptions considered for the study, download the pdf brochure
Market Size Estimation
Multiple approaches were adopted for estimating and forecasting the IT operations analytics (ITOA) market. The first approach involves estimating the market size by summation of companies’ revenue generated through the sale of solutions and services.
Market Size Estimation Methodology-Top-down approach
In the top-down approach, an exhaustive list of all the vendors offering solutions and services in the IT operations analytics (ITOA) market was prepared. The revenue contribution of the market vendors was estimated through annual reports, press releases, funding, investor presentations, paid databases, and primary interviews. Each vendor's offerings were evaluated based on the breadth of solutions and services, technology, data source, application, and end user. The aggregate of all the companies’ revenue was extrapolated to reach the overall market size. Each subsegment was studied and analyzed for its global market size and regional penetration. The markets were triangulated through both primary and secondary research. The primary procedure included extensive interviews for key insights from industry leaders, such as CIOs, CEOs, VPs, directors, and marketing executives. The market numbers were further triangulated with the existing MarketsandMarkets’ repository for validation.
Market Size Estimation Methodology-Bottom-up approach
In the bottom-up approach, the adoption rate of ITOA solutions and services among different verticals in key countries with respect to their regions contributing the most to the market share was identified. For cross-validation, the adoption of ITOA solutions and services among industries, along with different use cases with respect to their regions, was identified and extrapolated. Weightage was given to use cases identified in different regions for the market size calculation.
Based on the market numbers, the regional split was determined by primary and secondary sources. The procedure included the analysis of the ITOA market’s regional penetration. Based on secondary research, the regional spending on Information and Communications Technology (ICT), socio-economic analysis of each country, strategic vendor analysis of major ITOA providers, and organic and inorganic business development activities of regional and global players were estimated. With the data triangulation procedure and data validation through primaries, the exact values of the overall IT operations analytics (ITOA) market size and segments’ size were determined and confirmed using the study.
Top-down and Bottom-up approaches
 Market Top Down andd Bottom Up Approach")
To know about the assumptions considered for the study, Request for Free Sample Report
Data Triangulation
After arriving at the overall market size using the market size estimation processes as explained above, the market was split into several segments and subsegments. To complete the overall market engineering process and arrive at the exact statistics of each market segment and subsegment, data triangulation and market breakup procedures were employed, wherever applicable. The overall market size was then used in the top-down procedure to estimate the size of other individual markets via percentage splits of the market segmentation.
Market Definition
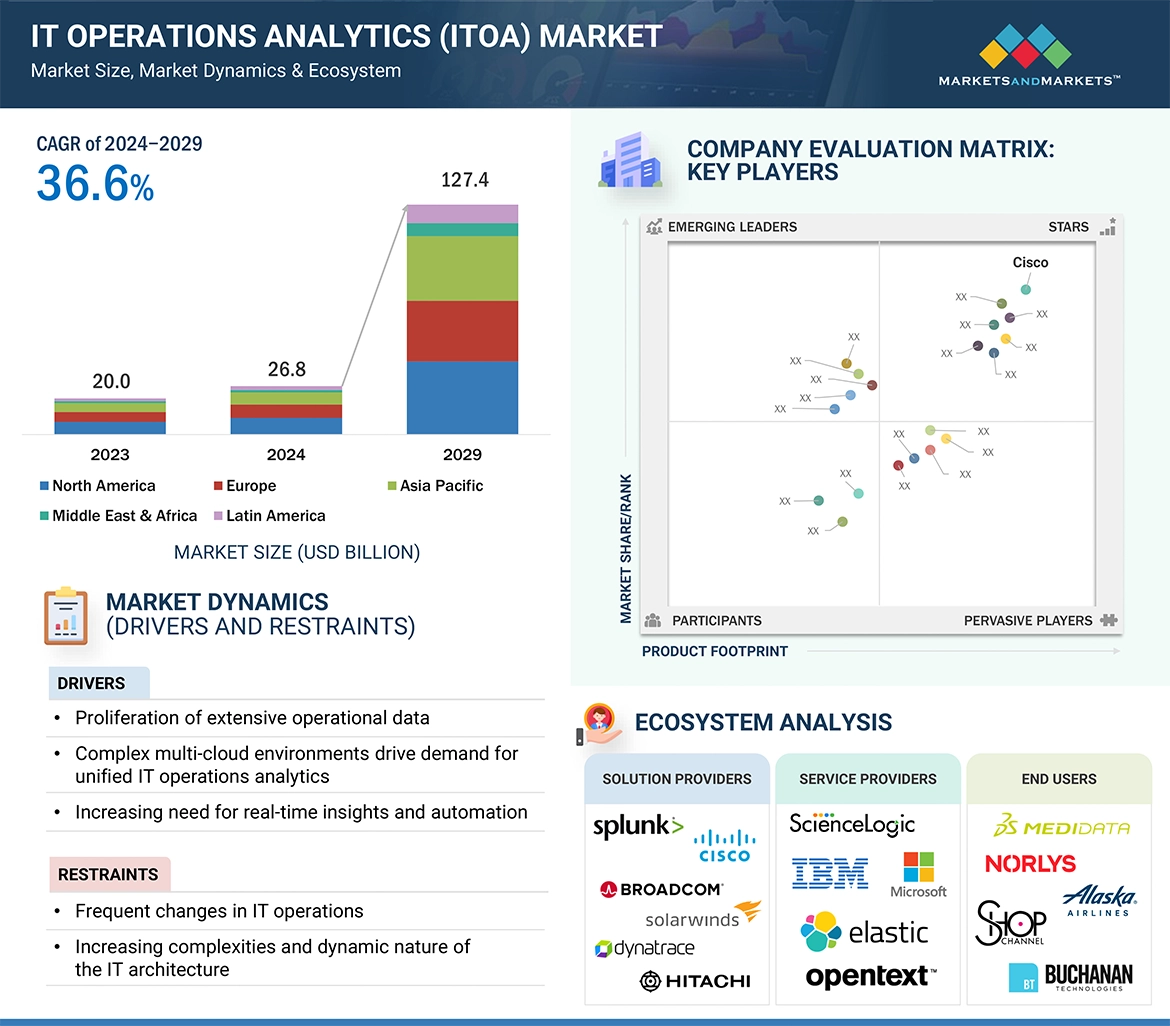
As per BMC Software, ITOA automates the process of collecting, identifying, and analyzing patterns, and is made even more powerful by leveraging ML and AI to drastically improve service performance. With the help of ITOA, users can optimize IT systems and manage application performance and guide business decisions through a single analytics platform and proactively identify issues related to IT operations.
According to Nexthink, ITOA is the practice of monitoring systems and gathering, processing, analyzing and interpreting data from various IT operations sources to guide decisions and predict potential issues. Information is gathered from live running infrastructure as well as older logged data from application, service and infrastructure hardware logs.
Stakeholders
-
Distributors and Value-added Resellers (VARs)
-
System Integrators (SIs)
-
Independent Software Vendors (ISV)
-
Cloud service providers
-
IT Operations end to end solution vendors
-
Research organizations
-
Analytics solution vendors
-
Marketing analytics executives
-
Predictive analytics providers
-
Third-party providers
-
Technology providers
Report Objectives
-
To define, describe, and predict the IT operations analytics (ITOA) market, by offering (solution and services), technology, data source, application, end user, and region.
-
To describe and forecast the IT operations analytics (ITOA) market, in terms of value, by region—North America, Europe, Asia Pacific, Middle East & Africa and Latin America
-
To provide detailed information regarding major factors influencing the market growth (drivers, restraints, opportunities, and challenges)
-
To strategically analyze micromarkets1 with respect to individual growth trends, prospects, and contribution to the overall IT operations analytics (ITOA) market.
-
To profile key players and comprehensively analyze their market positions in terms of ranking and core competencies2, along with detailing the competitive landscape for market leaders.
-
To analyze competitive developments such as joint ventures, mergers and acquisitions, product developments, and ongoing research and development (R&D) in the IT operations analytics (ITOA) market.
-
To provide the illustrative segmentation, analysis, and projection of the main regional markets.
Available customizations
With the given market data, MarketsandMarkets offers customizations as per the company’s specific needs. The following customization options are available for the report:
Product analysis
-
The product matrix provides a detailed comparison of the product portfolio of each company.
Geographic analysis as per feasibility
-
Further breakup of the North American IT Operations Analytics (ITOA) Market
-
Further breakup of the European IT Operations Analytics (ITOA) Market
-
Further breakup of the Asia Pacific IT Operations Analytics (ITOA) Market
-
Further breakup of the Middle East & Africa IT Operations Analytics (ITOA) Market
-
Further breakup of the Latin American IT Operations Analytics (ITOA) Market
Company information
-
Detailed analysis and profiling of additional market players (up to five)


Growth opportunities and latent adjacency in IT Operations Analytics (ITOA) Market