Big Data Market

Big Data Market by Offering (Software (Big Data Analytics, Data Mining), Services), Business Function (Marketing & Sales, Finance & Accounting), Data Type (Structured, Semi-structured, Unstructured), Vertical and Region - Global Forecast to 2028

Report Code: TC 1521 Jan, 2024, by marketsandmarkets.com

[483 Pages Report] The big data market is experiencing unprecedented growth, with estimates indicating a substantial expansion in market size from USD 220.2 billion in 2023 to USD 401.2 billion by 2028. This significant growth is expected to occur at a CAGR of 12.7% over the forecast period (2023–2028). The market shift is driven by organizations increasingly recognizing the transformative power of harnessing vast amounts of information. Businesses are capitalizing on the invaluable insights derived from large and diverse datasets, enabling strategic decision-making, enhanced customer experiences, and improved operational efficiency. The exponential rise in data creation, fueled by the digital revolution, is also a key driver propelling the big data market forward. As industries embrace digital transformation, the demand for advanced analytics, real-time processing, and scalable infrastructure continues to surge, contributing significantly to the flourishing big data market.

Technology Roadmap of Big data Market

The big data market report covers the technology roadmap, with insights into the short-term and long-term developments.

  • Short-term (Next 5 Years):
    • Integration of AI and Machine Learning into data processing workflows for enhanced analytics.
    • Development of more efficient and specialized data processing engines for improved performance.
    • Evolution of cloud-native technologies to provide increased flexibility and agility in handling data.
    • Emergence of specialized tools catering to industry-specific analytics needs.
    • Increased focus on user-friendly interfaces and enhanced accessibility.
    • Growth of integrated analytics and business intelligence solutions.
  • Long-term (Next 5+ years):
    • Quantum computing adoption for handling advanced and complex data processing tasks.
    • Integration of Blockchain technology for enhanced security and transparency in data transactions.
    • Development of new paradigms for distributed computing to handle quantum-scale data processing.
    • Proliferation of AI-driven analytics platforms offering automation and autonomous decision-making.
    • Fusion of IoT and Big Data solutions for comprehensive insights into connected systems.
    • Introduction of highly automated and autonomous analytics platforms for advanced analytics.
    • Widening adoption in autonomous systems and smart cities for data-driven decision-making.
    • Advancements in precision medicine and genomic analytics for personalized healthcare.
    • Integration with emerging technologies like Augmented Reality (AR) and Virtual Reality (VR) for immersive data exploration.

Big Data Market

To know about the assumptions considered for the study, Request for Free Sample Report

Market Dynamics

Driver: Increasing demand for data-driven decision-making

The big data market is experiencing unprecedented growth, with a key driver being the escalating demand for data-driven decision-making. In today's competitive landscape, organizations recognize the strategic value of leveraging data insights to inform precise and informed decisions. This shift signifies a departure from traditional decision-making models, as businesses increasingly rely on big data analytics to unlock opportunities, mitigate risks, and optimize performance. The ability to process, analyze, and derive actionable insights from vast datasets in real-time empowers enterprises to respond swiftly to market trends and customer preferences.

Restraint: Rise in data silos and a fragmented data landscape

The growth trajectory of the big data market faces a significant restraint with the pervasive rise in data silos and a fragmented data landscape. As organizations accumulate vast amounts of data from various sources, the lack of integration and interoperability creates isolated data silos. This fragmentation hinders the seamless flow of information across an enterprise, impeding the ability to derive comprehensive insights. The resulting data silos limit the effectiveness of big data solutions, as businesses struggle to access a unified view of their information. This not only complicates decision-making processes but also hampers the realization of the full potential of big data analytics.

Opportunity: Integration of big data applications with untapped data sources

The big data market presents a promising opportunity with the integration of big data applications with untapped data sources. By tapping into new and varied data sources, organizations can unlock valuable insights, enabling more robust analytics and informed decision-making. Whether it's incorporating social media data, IoT-generated information, or unstructured data, the synergy between big data applications and untapped sources opens avenues for innovation. This integration not only enhances the depth and breadth of data analysis but also fosters a more comprehensive understanding of business dynamics. Embracing this opportunity positions businesses to stay competitive, drive innovation, and derive greater value from the wealth of untapped data sources available in today's dynamic digital landscape.

Challenge: Issues related to big data scalability

One significant hurdle in the big data market revolves around issues related to scalability. As organizations accumulate vast volumes of data, the ability of big data infrastructure and applications to scale efficiently becomes a critical concern. Challenges arise as systems struggle to handle the increasing magnitude of data processing demands, leading to potential bottlenecks, performance degradation, and operational inefficiencies. The sheer size and complexity of big data environments often require substantial investments in scalable solutions, posing financial challenges for businesses. Addressing scalability issues is paramount to ensuring that big data technologies can seamlessly accommodate the growing influx of data.

Big Data Market Opportunities

To know about the assumptions considered for the study, download the pdf brochure

By offering, big data analytics software segment to account for a larger market size during forecast period.

Big data analytics software is expected to claim the largest market share in 2023, due to its transformative impact on business decision-making. With the exponential growth of data, businesses are increasingly relying on advanced analytics tools to extract actionable insights and drive strategic initiatives. The versatility of big data analytics software allows organizations to harness the power of machine learning algorithms, predictive modeling, and real-time analysis, offering a comprehensive solution for extracting meaningful intelligence from vast and complex datasets. This capability not only enhances operational efficiency but also enables businesses to gain a competitive edge by making informed decisions based on data-driven insights. Companies like IBM, SAS, and Microsoft are at the forefront, offering advanced analytics solutions that empower businesses to extract actionable intelligence, enhance operational efficiency, and gain a competitive advantage.

By business function, marketing & sales segment to hold the largest market share during the forecast period.

The marketing & salesbusiness function is rapidly ascending as the largest segment by market share in the big data market due to its transformative impact on enhancing customer engagement and driving revenue growth. Big data analytics empowers marketing and sales professionals with unparalleled insights into consumer behavior, preferences, and market trends. This enables highly targeted and personalized marketing campaigns, optimizing the customer experience and boosting conversion rates. With the ability to analyze vast datasets in real-time, businesses can make data-driven decisions, refine marketing strategies, and adapt swiftly to changing market dynamics.

Moreover, the integration of big data analytics facilitates sales teams in identifying and prioritizing leads, ultimately improving efficiency and closing deals more effectively. As organizations increasingly recognize the strategic importance of data-driven marketing and sales strategies, the demand for big data solutions within this business function continues to surge, solidifying its dominant position in the market.

By vertical, digital resale & reuse segment to register the fastest growth rate during the forecast period.

The retail & consumer goods vertical is emerging as the fastest-growing segment in the big data market, driven by its ability to revolutionize customer experiences and operational efficiency. With the exponential growth in online shopping and digital interactions, retailers are leveraging big data analytics to gain deep insights into consumer behavior, preferences, and buying patterns. This data-driven approach enables personalized marketing strategies, targeted promotions, and optimized pricing strategies, fostering customer loyalty and satisfaction. Moreover, big data facilitates inventory management, supply chain optimization, and demand forecasting, allowing retailers to streamline operations, reduce costs, and minimize stockouts. As the retail landscape continues to evolve, the demand for big data solutions within this vertical is witnessing unparalleled growth, positioning it as a key driver of innovation and competitiveness in the retail and consumer goods industry.

By region, Asia Pacific is set to experience the fastest growth rate during the forecast period.

Asia Pacific is swiftly establishing itself as the fastest-growing hub in the big data market, propelled by a confluence of factors driving unprecedented adoption and innovation. With a rapidly expanding digital landscape, the region is experiencing an unparalleled surge in data generation. Asia Pacific is anticipated to contribute significantly to the global datasphere, accounting for over 40% of the world's data by 2025. This massive influx of data from various sources, including the proliferation of smartphones and IoT devices, is a primary catalyst fueling the demand for advanced big data analytics solutions.

The region's commitment to digital transformation is evident in the strategic initiatives undertaken by governments and businesses alike. For instance, Singapore has emerged as a frontrunner in harnessing the power of big data for smart city development. The government's Smart Nation initiative leverages data analytics to enhance urban living, optimize resource allocation, and improve public services. Such proactive measures exemplify the region's recognition of big data as a transformative force driving economic growth and efficiency.

Furthermore, the Asia Pacific market benefits from a collaborative ecosystem fostering innovation and investment. Major technology players are actively expanding their presence in the region, contributing to the development of robust big data infrastructure. As a result, Asia Pacific is witnessing a surge in partnerships and collaborations aimed at advancing data analytics capabilities. This collaborative spirit, coupled with a data-driven mindset, positions the region at the forefront of the global big data market, poised for sustained and unparalleled growth in the coming years.

Big Data Market By Region

Key Market Players

The big data solution and service providers have implemented various types of organic and inorganic growth strategies, such as new product launches, product upgrades, partnerships, and agreements, business expansions, and mergers and acquisitions to strengthen their offerings in the market. Some major big data market leaders include Microsoft (US), Oracle (US), SAP (Germany), AWS (US) and Salesforce (US) along with SMEs and startups such as Centerfield (US), ValueCoders (India), Fusionex (Malaysia), BigPanda (US), and Imply (US).

Want to explore hidden markets that can drive new revenue in Big Data Market?

Scope of the Report

Report Metrics

Details

Market size available for years

2018–2028

Base year considered

2022

Forecast period

2023–2028

Forecast units

USD (Billion)

Segments covered

Offering, Business Function, Data Type, Vertical, and Region

Geographies covered

North America, Europe, Asia Pacific, Middle East & Africa, and Latin America

Top Big Data Companies covered

Oracle (US), Microsoft (US), SAP (Germany), IBM (US), SAS Institute (US), Salesforce (US), AWS (US), Teradata (US), Google (US), Accenture (Ireland), Alteryx (US), Cloudera (US), TIBCO (US), Informatica (US), Wipro (India), HPE (US), Qlik (US), Splunk (US), VMWare (US), Ataccama (Canada), Imply (US), Centerfield (US), Datapine (Germany), Fusionex (Malaysia), BigPanda (US), Bigeye (US), Rivery (US), Cardagraph (US), Syncari (US), Firebolt (US), ValueCoders (India), Sisense (US), Digital Guardian (US), Centric Consulting (US), and Happiest Minds Technologies (India)

This research report categorizes the big data market based on offering, business function, data type, vertical, and region.

By Offering:
  • Software, By Type
    • Big Data Analytics Software
      • Prescriptive Analytics Tools
      • Diagnostic Analytics Tools
      • Descriptive Analytics Tools
      • Predictive Analytics Tools
    • Data Management Software
      • Data Security Tools
      • Master Data Management Tools
      • Data Integration Tools
      • Data Migration Tools
      • Data Warehousing Tools
      • Data Governance Tools
      • Others
    • Data Mining Software
      • Data Classification Tools
      • Regression Tools
      • Clustering Tools
      • Association Rule Mining Tools
    • Data Visualization Software
      • Static Data Visualization Tools
      • Interactive Data Visualization Tools
  • Software, By Deployment Mode
    • Cloud
      • Public Cloud
      • Private Cloud
      • Hybrid Cloud
    • On-Premises
  • Services
    • Big Data Consulting Services
    • Big Data Cleansing & Scrubbing Services
    • Big Data Storage  & Processing Services
    • Big Data Analytics & Reporting Services
    • Big Data Security Services
    • Big Data As A Service
    • Other Services
    • Data Management Software

By Business Function:

  • Marketing & Sales
    • Customer Segmentation
    • Social Media Management
    • Sales Forecasting
    • Customer Journey Management
    • Others
  • Human Resources
    • Talent Acquisition
    • Employee Engagement
    • Workforce Management
    • Performance Management
    • Others
  • Operations
    • IT Infrastructure Optimization
    • IT Service Management
    • Incident Response And Resolution
    • Inventory Management
    • Others
  • Finance & Accounting
    • Fraud Detection
    • Risk Management
    • Financial Forecasting
    • Credit Scoring
    • Others
  • Other Business Functions

By Data Type:

  • Unstructured Data
  • Semi-structured Data
  • Unstructured Data

By Vertical:

  • BFSI
    • Algorithmic Trading & Investment Analysis
    • Customer Churn Prediction & Retention
    • Credit Scoring & Risk Assessment
    • Financial Fraud Detection & Prevention
    • Personalized Financial Planning
    • Others
  • Telecommunications
    • Network Performance Monitoring
    • Subscriber Management
    • Network Infrastructure Predictive Maintenance
    • Telecom Revenue Assurance
    • Network Capacity Planning
    • Others
  • Retail & Consumer Goods
    • Customer Segmentation & Personalization
    • Retail Inventory Management
    • E-Commerce Management
    • Price Optimization
    • Point-Of-Sale Management
    • Others
  • Healthcare & Life Sciences
    • Clinical Data Management
    • Personalized Treatment
    • Population Health Management
    • Drug Discovery & Development
    • Patient Outcome Prediction
    • Others
  • Government & Defense
    • Predictive Policing & Crime Pattern Analysis
    • Cybersecurity & Threat Intelligence
    • Tax & Welfare Management
    • Emergency Response Optimization
    • Resource Allocation & Planning
    • Others
  • Automotive
    • Autonomous Vehicle Development
    • Connected Car Services
    • Vehicle Predictive Maintenance
    • Telematics & Usage-Based Insurance
    • Vehicle Production Optimization
    • Others
  • Education
    • Student Performance Management
    • Customized Courses & Personalized Learning
    • Conflict Anticipation & Behavior Detection
    • Academic Research
    • Adaptive Testing & Grading
    • Others
  • Manufacturing
    • Equipment & Machinery Predictive Maintenance
    • Quality Control & Defect Analysis
    • Smart Manufacturing
    • Energy Management & Efficiency
    • Production Process Optimization
    • Others
  • Transportation & Logistics
    • Route Optimization & Traffic Management
    • Fleet Management
    • Vehicles & Equipment Maintenance
    • Supply Chain Visibility
    • Logistics & Inventory Management
    • Others
  • Other Verticals

By Region:

  • North America
    • US
    • Canada
  • Europe
    • UK
    • Germany
    • France
    • Italy
    • Spain
    • Rest of Europe
  • Asia Pacific
    • China
    • India
    • Japan
    • South Korea
    • Singapore
    • Australia & New Zealand (ANZ)
    • Rest of Asia Pacific
  • Middle East and Africa
    • GCC
    • Egypt
    • South Africa
    • Turkey
    • Rest of Middle East & Africa
  • Latin America
    • Brazil
    • Mexico
    • Argentina
    • Rest of Latin America

Recent Developments:

  • In November 2023, Microsoft upgraded its Microsoft Purview with a suite of powerful features. Data lifecycle management and records management functionalities offer improved control over data throughout its lifecycle. Additionally, the update incorporates Data Loss Prevention measures, fortifying data security, and Information Protection tools to safeguard sensitive information within the Purview ecosystem.
  • In November 2023, Salesforce and AWS announced a significant expansion of their long standing, global strategic partnership, deepening product integrations across data and artificial intelligence (AI), and for the first time offering select Salesforce products on the AWS marketplace.
  • In October 2023, SAP enhanced its SAP HANA Cloud with a host of new innovations, including embedded AI, a set of new predefined predictive scenarios, expansions to the predefined event catalog rooted in FI-CA processes and data, and augmentations to the predefined ML feature catalog based on FI-CA processes and data.
  • In September 2023, Salesforce and Databricks announced an expanded strategic partnership that delivers zero-ETL (Extract, Transform, Load) data sharing in Salesforce Data Cloud. Customers can now seamlessly merge data from Salesforce Data Cloud with external data from the Databricks Lakehouse Platform.
  • In July 2023, Teradata announced that it has acquired Stemma Technologies, a cloud-native, fully managed, data catalog solution. Founded in 2020, Stemma is recognized for its innovation and adept use of AI and machine learning that helps users discover, trust, and use their data and metadata more effectively.
  • In June 2023, Salesforce and Google Cloud announced an expanded strategic partnership to help businesses utilize data and AI to deliver more personalized customer experiences, better understand customer behavior, and run more effective campaigns at a lower cost across marketing, sales, service, and commerce.

Frequently Asked Questions (FAQ):

To speak to our analyst for a discussion on the above findings, click Speak to Analyst

Exclusive indicates content/data unique to MarketsandMarkets and not available with any competitors.

INTRODUCTION
40
RESEARCH METHODOLOGY
48
EXECUTIVE SUMMARY
62
PREMIUM INSIGHTS
69
MARKET OVERVIEW AND INDUSTRY TRENDS
72
  • 5.1 INTRODUCTION
  • 5.2 MARKET DYNAMICS
    DRIVERS
    - Ascent of artificial intelligence and machine learning in enterprise applications
    - Increase in demand for data-driven decision-making
    - Exponential rise in data volume
    - Innovations and developments in unstructured data management software
    RESTRAINTS
    - Increase in data silos and fragmented data landscape
    - Integration challenges with legacy systems
    - Regulatory compliance complexity
    OPPORTUNITIES
    - Integration of big data applications with untapped data sources
    - Rise in penetration of internet and connected devices
    - Increase in adoption of cloud-based big data solutions
    - Emergence of advanced analytics technologies
    CHALLENGES
    - Issues related to scalability in big data
    - Meeting real-time processing demands of modern businesses
    - Effective management of data variety and complexity of data being collected
  • 5.3 EVOLUTION OF BIG DATA
  • 5.4 BIG DATA: ARCHITECTURE
  • 5.5 VALUE CHAIN ANALYSIS
  • 5.6 ECOSYSTEM/MARKET MAP
    TECHNOLOGY PROVIDERS
    CLOUD SERVICE PROVIDERS
    BIG DATA SOLUTION PROVIDERS
    CONSULTING & PROFESSIONAL SERVICE PROVIDERS
    BIG DATA SECURITY & GOVERNANCE PROVIDERS
    GOVERNMENT & REGULATORY BODIES
  • 5.7 INVESTMENT LANDSCAPE
  • 5.8 BEST PRACTICES IN BIG DATA MARKET
  • 5.9 CASE STUDY ANALYSIS
    BFSI
    - Erste Group Bank gained 360-degree view of customers using Oracle Big Data Appliance on single cloud platform
    TELECOMMUNICATIONS
    - Robi Axiata Limited used Cloudera platform to enhance customer experience
    RETAIL & CONSUMER GOODS
    - Myntra used Azure Synapse Analytics and Azure HDInsight to stabilize services and increase year-over-year traffic
    GOVERNMENT & DEFENSE
    - Indian Oil used Qlik to achieve business value by providing real-time analytics on big data
    MANUFACTURING
    - Brembo used TIBCO Spotfire to enhance production processes with help of big data
    HEALTHCARE & LIFE SCIENCE
    - IQVIA used Qlik big data analytics to help UK healthcare services
  • 5.10 TECHNOLOGY ANALYSIS
    KEY TECHNOLOGY
    - Data Mining
    - Data Stream Processing
    - NoSQL Databases
    - Data Warehousing
    COMPLEMENTARY TECHNOLOGY
    - Cloud Computing
    - Data Analytics
    - Business Intelligence (BI)
    - Data Visualization
    ADJACENT TECHNOLOGY
    - Machine Learning
    - Artificial Intelligence
    - Internet of Things (IoT)
    - Data Integration
  • 5.11 TARIFF AND REGULATORY LANDSCAPE
    TARIFF RELATED TO BIG DATA SOFTWARE
    REGULATORY LANDSCAPE
    - Regulatory bodies, government agencies, and other organizations
    REGULATIONS
    - North America
    - Europe
    - Asia Pacific
    - Middle East & Africa
    - Latin America
  • 5.12 PATENT ANALYSIS
    METHODOLOGY
    PATENTS FILED, BY DOCUMENT TYPE
    INNOVATION AND PATENT APPLICATIONS
    - Top 10 applicants in big data market
  • 5.13 PRICING ANALYSIS
    AVERAGE SELLING PRICE TRENDS OF KEY PLAYERS, BY SOFTWARE TYPE
    INDICATIVE PRICING ANALYSIS, BY BIG DATA VENDORS
  • 5.14 TRADE ANALYSIS
    EXPORT SCENARIO OF COMPUTER SOFTWARE
    IMPORT SCENARIO OF COMPUTER SOFTWARE
  • 5.15 KEY CONFERENCES AND EVENTS
  • 5.16 PORTER’S FIVE FORCES ANALYSIS
    THREAT FROM NEW ENTRANTS
    THREAT FROM SUBSTITUTES
    BARGAINING POWER OF SUPPLIERS
    BARGAINING POWER OF BUYERS
    INTENSITY OF COMPETITION RIVALRY
  • 5.17 BIG DATA TECHNOLOGY ROADMAP
  • 5.18 BIG DATA BUSINESS MODELS
    SOFTWARE VENDOR MODEL
    CONSULTING SERVICES MODEL
    PLATFORM-AS-A-SERVICE MODEL
    MANAGED SERVICES MODEL
    BIG DATA-AS-A-SERVICE MODEL
  • 5.19 TRENDS/DISRUPTIONS IMPACTING CUSTOMER’S BUSINESS
  • 5.20 KEY STAKEHOLDERS & BUYING CRITERIA
    KEY STAKEHOLDERS IN BUYING PROCESS
    BUYING CRITERIA
BIG DATA MARKET, BY OFFERING
138
  • 6.1 INTRODUCTION
    OFFERING: BIG DATA MARKET DRIVERS
  • 6.2 SOFTWARE MARKET, BY TYPE
    BIG DATA ANALYTICS SOFTWARE
    - Analyzing and interpreting complex data structures with help of big data analytics software
    - Prescriptive Analytics Tools
    - Diagnostic Analytics Tools
    - Descriptive Analytics Tools
    - Predictive Analytics Tools
    DATA MANAGEMENT SOFTWARE
    - Need to empower organizations by ensuring data quality, integrity, and security as cyber threats increase
    - Data Security Tools
    - Master Data Management Tools
    - Data Integration Tools
    - Data Migration Tools
    - Data Warehousing Tools
    - Data Governance Tools
    - Other Data Management Software
    DATA MINING SOFTWARE
    - Uncovering valuable patterns, correlations, and trends hidden within large and complex datasets with data mining software
    - Data Classification Tools
    - Regression Tools
    - Clustering Tools
    - Association Rule Mining Tools
    DATA VISUALIZATION SOFTWARE
    - Facilitating more informed decision-making within organizations by grasping patterns, trends, and outliers effectively
    - Static Data Visualization Tools
    - Interactive Data Visualization Tools
  • 6.3 SOFTWARE MARKET, BY DEPLOYMENT MODE
    CLOUD
    - Increase in organizational efficiency by providing on-demand computing power and storage
    - Public Cloud
    - Private Cloud
    - Hybrid Cloud
    ON-PREMISES
    - Providing high level of control and customization to organizations with on-premise deployment
  • 6.4 SERVICES
    BIG DATA CONSULTING SERVICES
    - Need for businesses to make informed decisions, optimize processes, and derive actionable intelligence from data assets
    BIG DATA CLEANSING & SCRUBBING SERVICES
    - Need to enhance overall integrity of data, enabling organizations to extract meaningful insights and make informed decisions
    BIG DATA STORAGE & PROCESSING SERVICES
    - Leveraging distributed computing frameworks and data processing engines to optimize processing data-intensive workloads
    BIG DATA ANALYTICS & REPORTING SERVICES
    - Integration of big data analytics & reporting services for more informed and data-driven decisions
    BIG DATA SECURITY SERVICES
    - Demand for greater compliance with regulatory standards to safeguard sensitive information and maintain trust of stakeholders
    BIG DATA-AS-A-SERVICE
    - Fostering agility, innovation, and streamlined data management with help of big data-as-a-service
    OTHER SERVICES
BIG DATA MARKET, BY BUSINESS FUNCTION
167
  • 7.1 INTRODUCTION
    BUSINESS FUNCTION: BIG DATA MARKET DRIVERS
  • 7.2 MARKETING & SALES
    ABILITY TO NAVIGATE COMPLEX LANDSCAPE OF CUSTOMER ENGAGEMENT AND DRIVE EFFECTIVE MARKETING CAMPAIGNS
    CUSTOMER SEGMENTATION
    SOCIAL MEDIA MANAGEMENT
    SALES FORECASTING
    CUSTOMER JOURNEY MANAGEMENT
    OTHER MARKETING & SALES FUNCTIONS
  • 7.3 FINANCE & ACCOUNTING
    EMPOWERING ORGANIZATIONS TO MAKE INFORMED FINANCIAL DECISIONS AND NAVIGATE COMPLEX ECONOMIC LANDSCAPES
    FRAUD DETECTION
    RISK MANAGEMENT
    FINANCIAL FORECASTING
    CREDIT SCORING
    OTHER FINANCE & ACCOUNTING FUNCTIONS
  • 7.4 OPERATIONS
    LEVERAGING DATA ANALYTICS TO OPTIMIZE INVENTORY LEVELS, REDUCE CARRYING COSTS, AND ENHANCE SUPPLY CHAIN EFFICIENCY
    IT INFRASTRUCTURE OPTIMIZATION
    IT SERVICE MANAGEMENT
    INCIDENT RESPONSE & RESOLUTION
    INVENTORY MANAGEMENT
    OTHER OPERATIONAL FUNCTIONS
  • 7.5 HUMAN RESOURCES
    HARNESSING POWER OF BIG DATA ANALYTICS TO CREATE WORK ENVIRONMENT THAT ATTRACTS, RETAINS, AND NURTURES TOP TALENT
    TALENT ACQUISITION
    EMPLOYEE ENGAGEMENT
    WORKFORCE MANAGEMENT
    PERFORMANCE MANAGEMENT
    OTHER HUMAN RESOURCE FUNCTIONS
  • 7.6 OTHER BUSINESS FUNCTIONS
BIG DATA MARKET, BY DATA TYPE
186
  • 8.1 INTRODUCTION
    DATA TYPE: BIG DATA MARKET DRIVERS
  • 8.2 UNSTRUCTURED DATA
    ORGANIZATIONS LEVERAGE UNSTRUCTURED DATA ANALYTICS TO UNLOCK DEEP INSIGHTS BEYOND CONVENTIONAL STRUCTURES
  • 8.3 STRUCTURED DATA
    OPTIMIZING OPERATIONS AND STRATEGIC PLANNING BY ESTABLISHING SOLID GROUNDS FOR INFORMED DECISIONS
  • 8.4 SEMI-STRUCTURED DATA
    ADAPTIVE NATURE OF SEMI-STRUCTURED DATA OFFERS AGILITY TO BUSINESSES IN DATA ANALYTICS AND REPORTING
BIG DATA MARKET, BY VERTICAL
194
  • 9.1 INTRODUCTION
    VERTICAL: BIG DATA MARKET DRIVERS
  • 9.2 BFSI
    ALGORITHMS TO ANALYZE MARKET TRENDS, OPTIMIZE TRADING STRATEGIES, AND MAKE INFORMED INVESTMENT DECISIONS
    ALGORITHMIC TRADING & INVESTMENT ANALYSIS
    CUSTOMER CHURN PREDICTION& RETENTION
    CREDIT SCORING& RISK ASSESSMENT
    FINANCIAL FRAUD DETECTION& PREVENTION
    PERSONALIZED FINANCIAL PLANNING
    OTHER BFSI APPLICATIONS
  • 9.3 TELECOMMUNICATIONS
    EMPOWERING PROVIDERS TO DELIVER EFFICIENT, RELIABLE, AND CUSTOMER-CENTRIC SERVICES WITH BIG DATA
    NETWORK PERFORMANCE MONITORING
    SUBSCRIBER MANAGEMENT
    NETWORK INFRASTRUCTURE PREDICTIVE MAINTENANCE
    TELECOM REVENUE ASSURANCE
    NETWORK CAPACITY PLANNING
    OTHER TELECOMMUNICATION APPLICATIONS
  • 9.4 RETAIL & CONSUMER GOODS
    DRIVING OPERATIONAL EFFICIENCY AND IMPROVING CUSTOMER EXPERIENCES
    CUSTOMER SEGMENTATION & PERSONALIZATION
    RETAIL INVENTORY MANAGEMENT
    ECOMMERCE MANAGEMENT
    PRICE OPTIMIZATION
    POINT-OF-SALE MANAGEMENT
    OTHER RETAIL & CONSUMER GOODS APPLICATIONS
  • 9.5 HEALTHCARE & LIFE SCIENCES
    PAVING WAY FOR DATA-DRIVEN PARADIGM TO PRIORITIZE PRECISION AND IMPROVED HEALTHCARE OUTCOMES
    CLINICAL DATA MANAGEMENT
    PERSONALIZED TREATMENT
    POPULATION HEALTH MANAGEMENT
    DRUG DISCOVERY & DEVELOPMENT
    PATIENT OUTCOME PREDICTION
    OTHER HEALTHCARE & LIFE SCIENCE APPLICATIONS
  • 9.6 GOVERNMENT & DEFENSE
    ENHANCING VARIOUS ASPECTS OF GOVERNANCE, SECURITY, AND PUBLIC SERVICE WITH INTEGRATION OF BIG DATA
    PREDICTIVE POLICING & CRIME PATTERN ANALYSIS
    CYBERSECURITY & THREAT INTELLIGENCE
    TAX & WELFARE MANAGEMENT
    EMERGENCY RESPONSE OPTIMIZATION
    RESOURCE ALLOCATION & PLANNING
    OTHER GOVERNMENT & DEFENSE APPLICATIONS
  • 9.7 AUTOMOTIVE
    INTEGRATION OF CONNECTED VEHICLES AND TELEMATICS SYSTEMS
    AUTONOMOUS VEHICLE DEVELOPMENT
    CONNECTED CAR SERVICES
    VEHICLE PREDICTIVE MAINTENANCE
    TELEMATICS & USAGE-BASED INSURANCE
    VEHICLE PRODUCTION OPTIMIZATION
    OTHER AUTOMOTIVE APPLICATIONS
  • 9.8 EDUCATION
    BIG DATA-DRIVEN APPROACH TO ENHANCE STUDENT ENGAGEMENT AND IMPROVE ACADEMIC OUTCOMES
    STUDENT PERFORMANCE MANAGEMENT
    CUSTOMIZED COURSES & PERSONALIZED LEARNING
    CONFLICT ANTICIPATION & BEHAVIOR DETECTION
    ACADEMIC RESEARCH
    ADAPTIVE TESTING & GRADING
    OTHER EDUCATION APPLICATIONS
  • 9.9 MANUFACTURING
    IMPROVING MANUFACTURERS’ BILITY TO PREDICT EQUIPMENT FAILURES AND OPTIMIZE MAINTENANCE SCHEDULES
    EQUIPMENT & MACHINERY PREDICTIVE MAINTENANCE
    QUALITY CONTROL & DEFECT ANALYSIS
    SMART MANUFACTURING
    ENERGY MANAGEMENT & EFFICIENCY
    PRODUCTION PROCESS OPTIMIZATION
    OTHER MANUFACTURING APPLICATIONS
  • 9.10 TRANSPORTATION & LOGISTICS
    BENEFITS OF REAL-TIME ROUTE OPTIMIZATION AND REDUCED FUEL CONSUMPTION
    ROUTE OPTIMIZATION & TRAFFIC MANAGEMENT
    FLEET MANAGEMENT
    VEHICLES & EQUIPMENT MAINTENANCE
    SUPPLY CHAIN VISIBILITY
    LOGISTICS & INVENTORY MANAGEMENT
    OTHER TRANSPORTATION & LOGISTICS APPLICATIONS
  • 9.11 OTHER VERTICALS
BIG DATA MARKET, BY REGION
267
  • 10.1 INTRODUCTION
  • 10.2 NORTH AMERICA
    NORTH AMERICA: BIG DATA MARKET DRIVERS
    NORTH AMERICA: RECESSION IMPACT
    US
    - Government initiatives and investments in digital infrastructure to contribute to expansion of big data
    CANADA
    - Integration of IoT to expand scope of data analytics
  • 10.3 EUROPE
    EUROPE: BIG DATA MARKET DRIVERS
    EUROPE: RECESSION IMPACT
    UK
    - Need to gain actionable insights into consumer behavior, enhance marketing strategies, and streamline operations to boost growth
    GERMANY
    - Evolving big data landscape driven by focus on Industry 4.0, AI adoption, and data privacy to spur market growth
    FRANCE
    - Rise in adoption of cloud technology for efficient data storage, processing, scalability, and cost efficiency to fuel market growth
    ITALY
    - Focus on incorporating AI and ML into big data offerings to boost demand for big data services
    SPAIN
    - Emphasis on fostering innovation with real-time data processing and analysis with help of big data solutions to increase market penetration
    REST OF EUROPE
  • 10.4 ASIA PACIFIC
    ASIA PACIFIC: BIG DATA MARKET DRIVERS
    ASIA PACIFIC: RECESSION IMPACT
    CHINA
    - Government initiatives and technological advancements to drive market growth
    INDIA
    - Synergy of AI-powered big data analytics to drive wave of innovation across industries
    JAPAN
    - Proactive initiatives by government to harness big data for informed policy decisions to drive popularity
    SOUTH KOREA
    - Unwavering commitment to innovation, strong government support, and a tech-driven approach to drive market
    SINGAPORE
    - Strategic integration of data analytics into various sectors to propel growth
    AUSTRALIA & NEW ZEALAND
    - Need for harnessing full potential of big data for economic and societal benefit to spur market demand
    REST OF ASIA PACIFIC
  • 10.5 MIDDLE EAST & AFRICA
    MIDDLE EAST & AFRICA: BIG DATA MARKET DRIVERS
    MIDDLE EAST & AFRICA: RECESSION IMPACT
    GCC
    - With focus on economic diversification and digital transformation, GCC to foster widespread adoption of big data analytics
    EGYPT
    - Government initiatives and increasing technology investments by organizations to leverage big data analytics
    SOUTH AFRICA
    - Adoption of data-driven strategies by business houses to gain market share
    TURKEY
    - Strategic government initiatives and sharp growth in adoption of analytics to boost market across sectors
    REST OF MIDDLE EAST & AFRICA
  • 10.6 LATIN AMERICA
    LATIN AMERICA: BIG DATA MARKET DRIVERS
    LATIN AMERICA: RECESSION IMPACT
    BRAZIL
    - Robust digital transformation ecosystem driven by government’s aim to harness big data analytics to drive growth
    MEXICO
    - Growth of big data market to be marked by growing recognition of big data analytics across telecom and finance sectors
    ARGENTINA
    - Evolving tech startup landscape and penetration of big data in agritech space to propel growth
    REST OF LATIN AMERICA
COMPETITIVE LANDSCAPE
331
  • 11.1 OVERVIEW
  • 11.2 KEY PLAYER STRATEGIES
  • 11.3 REVENUE ANALYSIS
  • 11.4 MARKET SHARE ANALYSIS
  • 11.5 BRAND/PRODUCT COMPARATIVE ANALYSIS
    BRAND/PRODUCT COMPARATIVE ANALYSIS, BY BIG DATA ANALYTICS SOFTWARE
    - Alteryx
    - AWS
    - Google
    - TIBCO Software
    BRAND/PRODUCT COMPARATIVE ANALYSIS, BY DATA MANAGEMENT SOFTWARE
    - Teradata
    - SAP
    - Cloudera
    - Informatica
    BRAND/PRODUCT COMPARATIVE ANALYSIS, BY DATA MINING SOFTWARE
    - IBM
    - Oracle
    - Microsoft
    - SAS Institute
  • 11.6 VALUATION AND FINANCIAL METRICS OF KEY VENDORS
  • 11.7 COMPANY EVALUATION MATRIX: KEY PLAYERS
    STARS
    EMERGING LEADERS
    PERVASIVE PLAYERS
    PARTICIPANTS
    COMPANY FOOTPRINT: KEY PLAYERS
  • 11.8 COMPANY EVALUATION MATRIX: STARTUPS/SMES
    PROGRESSIVE COMPANIES
    RESPONSIVE COMPANIES
    DYNAMIC COMPANIES
    STARTING BLOCKS
    COMPETITIVE BENCHMARKING: STARTUPS/SMES
  • 11.9 COMPETITIVE SCENARIO AND TRENDS
    PRODUCT LAUNCHES AND ENHANCEMENTS
    DEALS
COMPANY PROFILES
374
  • 12.1 INTRODUCTION
  • 12.2 KEY PLAYERS
    IBM
    - Business overview
    - Products/Solutions/Services offered
    - Recent developments
    - MnM view
    ORACLE
    - Business overview
    - Products/Solutions/Services offered
    - Recent developments
    - MnM view
    MICROSOFT
    - Business overview
    - Products/Solutions/Services offered
    - Recent developments
    - MnM view
    SAP
    - Business overview
    - Products/Solutions/Services offered
    - Recent developments
    - MnM view
    SAS INSTITUTE
    - Business overview
    - Products/Solutions/Services offered
    - Recent developments
    - MnM view
    SALESFORCE
    - Business overview
    - Products/Solutions/Services offered
    - Recent developments
    AWS
    - Business overview
    - Products/Solutions/Services offered
    - Recent developments
    TERADATA
    - Business overview
    - Products/Solutions/Services offered
    - Recent developments
    GOOGLE
    - Business overview
    - Products/Solutions/Services offered
    - Recent developments
    ACCENTURE
    - Business overview
    - Products/Solutions/Services offered
    - Recent developments
    HPE
    - Business overview
    - Products/Solutions/Services offered
    - Recent developments
    ALTERYX
    CLOUDERA
    TIBCO SOFTWARE
    INFORMATICA
    WIPRO
    QLIK
    SPLUNK
    VMWARE
  • 12.3 STARTUP/SME PROFILES
    ATACCAMA
    SISENSE
    IMPLY
    CENTERFIELD
    DATAPINE
    FUSIONEX
    BIGPANDA
    BIGEYE
    RIVERY
    CARDAGRAPH
    SYNCARI
    FIREBOLT
    VALUECODERS
    HAPPIEST MINDS TECHNOLOGIES
    DIGITAL GUARDIAN
    CENTRIC CONSULTING
ADJACENT AND RELATED MARKETS
462
  • 13.1 INTRODUCTION
  • 13.2 BIG DATA SECURITY MARKET - GLOBAL FORECAST TO 2026
    MARKET DEFINITION
    MARKET OVERVIEW
    - Big data security market, by component
    - Big data security market, by software
    - Big data security market, by deployment mode
    - Big data security market, by organization size
    - Big data security market, by vertical
    - Big data security market, by region
  • 13.3 HADOOP BIG DATA ANALYTICS MARKET - GLOBAL FORECAST TO 2025
    MARKET DEFINITION
    MARKET OVERVIEW
    - Hadoop big data analytics market, by component
    - Hadoop big data analytics market, by deployment mode
    - Hadoop big data analytics market, by organization size
    - Hadoop big data analytics market, by business function
    - Hadoop big data analytics market, by vertical
    - Hadoop big data analytics market, by region
APPENDIX
473
  • 14.1 DISCUSSION GUIDE
  • 14.2 KNOWLEDGESTORE: MARKETSANDMARKETS’ SUBSCRIPTION PORTAL
  • 14.3 CUSTOMIZATION OPTIONS
  • 14.4 RELATED REPORTS
  • 14.5 AUTHOR DETAILS
LIST OF TABLES
 
  • TABLE 1 BIG DATA MARKET DETAILED SEGMENTATION
  • TABLE 2 USD EXCHANGE RATES, 2018–2022
  • TABLE 3 PRIMARY INTERVIEWS
  • TABLE 4 FACTOR ANALYSIS
  • TABLE 5 IMPACT OF RECESSION ON GLOBAL BIG DATA MARKET
  • TABLE 6 GLOBAL BIG DATA MARKET SIZE AND GROWTH RATE, 2018–2022 (USD MILLION, Y-O-Y)
  • TABLE 7 GLOBAL MARKET SIZE AND GROWTH RATE, 2023–2028 (USD MILLION, Y-O-Y)
  • TABLE 8  MARKET: VALUE CHAIN ANALYSIS
  • TABLE 9 ROLE OF PLAYERS IN BIG DATA MARKET
  • TABLE 10 BEST PRACTICES IN BIG DATA MARKET
  • TABLE 11 TARIFF RELATED TO BIG DATA SOFTWARE, 2022
  • TABLE 12 NORTH AMERICA: REGULATORY BODIES, GOVERNMENT AGENCIES, AND OTHER ORGANIZATIONS
  • TABLE 13 EUROPE: REGULATORY BODIES, GOVERNMENT AGENCIES, AND OTHER ORGANIZATIONS
  • TABLE 14 ASIA PACIFIC: REGULATORY BODIES, GOVERNMENT AGENCIES, AND OTHER ORGANIZATIONS
  • TABLE 15 MIDDLE EAST & AFRICA: REGULATORY BODIES, GOVERNMENT AGENCIES, AND OTHER ORGANIZATIONS
  • TABLE 16 LATIN AMERICA: REGULATORY BODIES, GOVERNMENT AGENCIES, AND OTHER ORGANIZATIONS
  • TABLE 17 PATENTS FILED, 2013–2023
  • TABLE 18 TOP 20 PATENT OWNERS IN BIG DATA MARKET, 2013–2023
  • TABLE 19 LIST OF PATENTS GRANTED IN BIG DATA MARKET, 2023
  • TABLE 20 AVERAGE SELLING PRICE TREND OF KEY PLAYERS: TOP THREE SOFTWARE TYPES
  • TABLE 21 INDICATIVE PRICING LEVELS OF BIG DATA SOLUTIONS
  • TABLE 22 BIG DATA MARKET: DETAILED LIST OF CONFERENCES & EVENTS, 2023–2024
  • TABLE 23 IMPACT OF PORTER’S FIVE FORCES ANALYSIS
  • TABLE 24 INFLUENCE OF STAKEHOLDERS ON BUYING PROCESS FOR TOP THREE VERTICALS
  • TABLE 25 KEY BUYING CRITERIA FOR TOP THREE VERTICALS
  • TABLE 26 BIG DATA MARKET, BY OFFERING, 2018–2022 (USD MILLION)
  • TABLE 27 BIG DATA MARKET, BY OFFERING, 2023–2028 (USD MILLION)
  • TABLE 28 BIG DATA SOFTWARE MARKET, BY SOFTWARE TYPE, 2018–2022 (USD MILLION)
  • TABLE 29 BIG DATA SOFTWARE MARKET, BY SOFTWARE TYPE, 2023–2028 (USD MILLION)
  • TABLE 30 BIG DATA ANALYTICS SOFTWARE MARKET, BY REGION, 2018–2022 (USD MILLION)
  • TABLE 31 BIG DATA ANALYTICS SOFTWARE MARKET, BY REGION, 2023–2028 (USD MILLION)
  • TABLE 32 DATA MANAGEMENT SOFTWARE MARKET, BY REGION, 2018–2022 (USD MILLION)
  • TABLE 33 DATA MANAGEMENT SOFTWARE MARKET, BY REGION, 2023–2028 (USD MILLION)
  • TABLE 34 DATA MINING SOFTWARE MARKET, BY REGION, 2018–2022 (USD MILLION)
  • TABLE 35 DATA MINING SOFTWARE MARKET, BY REGION, 2023–2028 (USD MILLION)
  • TABLE 36 DATA VISUALIZATION SOFTWARE MARKET, BY REGION, 2018–2022 (USD MILLION)
  • TABLE 37 DATA VISUALIZATION SOFTWARE MARKET, BY REGION, 2023–2028 (USD MILLION)
  • TABLE 38 BIG DATA SOFTWARE MARKET, BY DEPLOYMENT MODE, 2018–2022 (USD MILLION)
  • TABLE 39 BIG DATA SOFTWARE MARKET, BY DEPLOYMENT MODE, 2023–2028 (USD MILLION)
  • TABLE 40 CLOUD-BASED BIG DATA SOFTWARE MARKET, BY REGION, 2018–2022 (USD MILLION)
  • TABLE 41 CLOUD-BASED BIG DATA SOFTWARE MARKET, BY REGION, 2023–2028 (USD MILLION)
  • TABLE 42 ON-PREMISE BIG DATA SOFTWARE MARKET, BY REGION, 2018–2022 (USD MILLION)
  • TABLE 43 ON-PREMISE BIG DATA SOFTWARE MARKET, BY REGION, 2023–2028 (USD MILLION)
  • TABLE 44 BIG DATA SERVICES MARKET, BY TYPE, 2018–2022 (USD MILLION)
  • TABLE 45 BIG DATA SERVICES MARKET, BY TYPE, 2023–2028 (USD MILLION)
  • TABLE 46 BIG DATA CONSULTING SERVICES MARKET, BY REGION, 2018–2022 (USD MILLION)
  • TABLE 47 BIG DATA CONSULTING SERVICES MARKET, BY REGION, 2023–2028 (USD MILLION)
  • TABLE 48 BIG DATA CLEANSING & SCRUBBING SERVICES MARKET, BY REGION, 2018–2022 (USD MILLION)
  • TABLE 49 BIG DATA CLEANSING & SCRUBBING SERVICES MARKET, BY REGION, 2023–2028 (USD MILLION)
  • TABLE 50 BIG DATA STORAGE & PROCESSING SERVICES MARKET, BY REGION, 2018–2022 (USD MILLION)
  • TABLE 51 BIG DATA STORAGE & PROCESSING SERVICES MARKET, BY REGION, 2023–2028 (USD MILLION)
  • TABLE 52 BIG DATA ANALYTICS & REPORTING SERVICES MARKET, BY REGION, 2018–2022 (USD MILLION)
  • TABLE 53 BIG DATA ANALYTICS & REPORTING SERVICES MARKET, BY REGION, 2023–2028 (USD MILLION)
  • TABLE 54 BIG DATA SECURITY SERVICES MARKET, BY REGION, 2018–2022 (USD MILLION)
  • TABLE 55 BIG DATA SECURITY SERVICES MARKET, BY REGION, 2023–2028 (USD MILLION)
  • TABLE 56 BIG DATA-AS-A-SERVICE: BIG DATA MARKET, BY REGION, 2018–2022 (USD MILLION)
  • TABLE 57 BIG DATA-AS-A-SERVICE: MARKET, BY REGION, 2023–2028 (USD MILLION)
  • TABLE 58 OTHER BIG DATA SERVICES MARKET, BY REGION, 2018–2022 (USD MILLION)
  • TABLE 59 OTHER BIG DATA SERVICES MARKET, BY REGION, 2023–2028 (USD MILLION)
  • TABLE 60 MARKET, BY BUSINESS FUNCTION, 2018–2022 (USD MILLION)
  • TABLE 61 MARKET, BY BUSINESS FUNCTION, 2023–2028 (USD MILLION)
  • TABLE 62 MARKET FOR MARKETING & SALES, BY REGION, 2018–2022 (USD MILLION)
  • TABLE 63 MARKET FOR MARKETING & SALES, BY REGION, 2023–2028 (USD MILLION)
  • TABLE 64 MARKET FOR FINANCE & ACCOUNTING, BY REGION, 2018–2022 (USD MILLION)
  • TABLE 65 MARKET FOR FINANCE & ACCOUNTING, BY REGION, 2023–2028 (USD MILLION)
  • TABLE 66 MARKET FOR OPERATIONS, BY REGION, 2018–2022 (USD MILLION)
  • TABLE 67 MARKET FOR OPERATIONS, BY REGION, 2023–2028 (USD MILLION)
  • TABLE 68 MARKET FOR HUMAN RESOURCES, BY REGION, 2018–2022 (USD MILLION)
  • TABLE 69 MARKET FOR HUMAN RESOURCES, BY REGION, 2023–2028 (USD MILLION)
  • TABLE 70 MARKET FOR OTHER BUSINESS FUNCTIONS, BY REGION, 2018–2022 (USD MILLION)
  • TABLE 71 MARKET FOR OTHER BUSINESS FUNCTIONS, BY REGION, 2023–2028 (USD MILLION)
  • TABLE 72 MARKET, BY DATA TYPE, 2018–2022 (USD MILLION)
  • TABLE 73 MARKET, BY DATA TYPE, 2023–2028 (USD MILLION)
  • TABLE 74 UNSTRUCTURED MARKET, BY REGION, 2018–2022 (USD MILLION)
  • TABLE 75 UNSTRUCTURED MARKET, BY REGION, 2023–2028 (USD MILLION)
  • TABLE 76 STRUCTURED MARKET, BY REGION, 2018–2022 (USD MILLION)
  • TABLE 77 STRUCTURED MARKET, BY REGION, 2023–2028 (USD MILLION)
  • TABLE 78 SEMI-STRUCTURED MARKET, BY REGION, 2018–2022 (USD MILLION)
  • TABLE 79 SEMI-STRUCTURED MARKET, BY REGION, 2023–2028 (USD MILLION)
  • TABLE 80 BIG DATA MARKET, BY VERTICAL, 2018–2022 (USD MILLION)
  • TABLE 81 MARKET, BY VERTICAL, 2023–2028 (USD MILLION)
  • TABLE 82 MARKET IN BFSI VERTICAL, BY APPLICATION, 2018–2022 (USD MILLION)
  • TABLE 83 MARKET IN BFSI VERTICAL, BY APPLICATION, 2023–2028 (USD MILLION)
  • TABLE 84 MARKET IN ALGORITHMIC TRADING & INVESTMENT ANALYSIS, BY REGION, 2018–2022 (USD MILLION)
  • TABLE 85 MARKET IN ALGORITHMIC TRADING & INVESTMENT ANALYSIS, BY REGION, 2023–2028 (USD MILLION)
  • TABLE 86 MARKET IN CUSTOMER CHURN PREDICTION & RETENTION, BY REGION, 2018–2022 (USD MILLION)
  • TABLE 87 MARKET IN CUSTOMER CHURN PREDICTION & RETENTION, BY REGION, 2023–2028 (USD MILLION)
  • TABLE 88 MARKET IN CREDIT SCORING & RISK ASSESSMENT, BY REGION, 2018–2022 (USD MILLION)
  • TABLE 89 MARKET IN CREDIT SCORING & RISK ASSESSMENT, BY REGION, 2023–2028 (USD MILLION)
  • TABLE 90 MARKET IN FINANCIAL FRAUD DETECTION & PREVENTION, BY REGION, 2018–2022 (USD MILLION)
  • TABLE 91 MARKET IN FINANCIAL FRAUD DETECTION & PREVENTION, BY REGION, 2023–2028 (USD MILLION)
  • TABLE 92 MARKET IN PERSONALIZED FINANCIAL PLANNING, BY REGION, 2018–2022 (USD MILLION)
  • TABLE 93 MARKET IN PERSONALIZED FINANCIAL PLANNING, BY REGION, 2023–2028 (USD MILLION)
  • TABLE 94 MARKET IN OTHER BFSI APPLICATIONS, BY REGION, 2018–2022 (USD MILLION)
  • TABLE 95 MARKET IN OTHER BFSI APPLICATIONS, BY REGION, 2023–2028 (USD MILLION)
  • TABLE 96 MARKET IN TELECOMMUNICATIONS VERTICAL, BY APPLICATION, 2018–2022 (USD MILLION)
  • TABLE 97 MARKET IN TELECOMMUNICATIONS VERTICAL, BY APPLICATION, 2023–2028 (USD MILLION)
  • TABLE 98 BIG DATA MARKET IN NETWORK PERFORMANCE MONITORING, BY REGION, 2018–2022 (USD MILLION)
  • TABLE 99 MARKET IN NETWORK PERFORMANCE MONITORING, BY REGION, 2023–2028 (USD MILLION)
  • TABLE 100 MARKET IN SUBSCRIBER MANAGEMENT, BY REGION, 2018–2022 (USD MILLION)
  • TABLE 101 MARKET IN SUBSCRIBER MANAGEMENT, BY REGION, 2023–2028 (USD MILLION)
  • TABLE 102 MARKET IN NETWORK INFRASTRUCTURE PREDICTIVE MAINTENANCE, BY REGION, 2018–2022 (USD MILLION)
  • TABLE 103 MARKET IN NETWORK INFRASTRUCTURE PREDICTIVE MAINTENANCE, BY REGION, 2023–2028 (USD MILLION)
  • TABLE 104 MARKET IN TELECOM REVENUE ASSURANCE, BY REGION, 2018–2022 (USD MILLION)
  • TABLE 105 MARKET IN TELECOM REVENUE ASSURANCE, BY REGION, 2023–2028 (USD MILLION)
  • TABLE 106 MARKET IN NETWORK CAPACITY PLANNING, BY REGION, 2018–2022 (USD MILLION)
  • TABLE 107 MARKET IN NETWORK CAPACITY PLANNING, BY REGION, 2023–2028 (USD MILLION)
  • TABLE 108 MARKET IN OTHER TELECOMMUNICATION APPLICATIONS, BY REGION, 2018–2022 (USD MILLION)
  • TABLE 109 BIG DATA MARKET IN OTHER TELECOMMUNICATION APPLICATIONS, BY REGION, 2023–2028 (USD MILLION)
  • TABLE 110 MARKET IN RETAIL & CONSUMER GOODS VERTICAL, BY APPLICATION, 2018–2022 (USD MILLION)
  • TABLE 111 MARKET IN RETAIL & CONSUMER GOODS VERTICAL, BY APPLICATION, 2023–2028 (USD MILLION)
  • TABLE 112 MARKET IN CUSTOMER SEGMENTATION & PERSONALIZATION, BY REGION, 2018–2022 (USD MILLION)
  • TABLE 113 MARKET IN CUSTOMER SEGMENTATION & PERSONALIZATION, BY REGION, 2023–2028 (USD MILLION)
  • TABLE 114 MARKET IN RETAIL INVENTORY MANAGEMENT, BY REGION, 2018–2022 (USD MILLION)
  • TABLE 115 MARKET IN RETAIL INVENTORY MANAGEMENT, BY REGION, 2023–2028 (USD MILLION)
  • TABLE 116 MARKET IN ECOMMERCE MANAGEMENT, BY REGION, 2018–2022 (USD MILLION)
  • TABLE 117 MARKET IN ECOMMERCE MANAGEMENT, BY REGION, 2023–2028 (USD MILLION)
  • TABLE 118 MARKET IN PRICE OPTIMIZATION, BY REGION, 2018–2022 (USD MILLION)
  • TABLE 119 MARKET IN PRICE OPTIMIZATION, BY REGION, 2023–2028 (USD MILLION)
  • TABLE 120 MARKET IN POINT-OF-SALE MANAGEMENT, BY REGION, 2018–2022 (USD MILLION)
  • TABLE 121 MARKET IN POINT-OF-SALE MANAGEMENT, BY REGION, 2023–2028 (USD MILLION)
  • TABLE 122 MARKET IN OTHER RETAIL & CONSUMER GOODS APPLICATIONS, BY REGION, 2018–2022 (USD MILLION)
  • TABLE 123 MARKET IN OTHER RETAIL & CONSUMER GOODS APPLICATIONS, BY REGION, 2023–2028 (USD MILLION)
  • TABLE 124 MARKET IN HEALTHCARE & LIFE SCIENCES VERTICAL, BY APPLICATION, 2018–2022 (USD MILLION)
  • TABLE 125 MARKET, BY HEALTHCARE & LIFE SCIENCES VERTICAL, 2023–2028 (USD MILLION)
  • TABLE 126 MARKET IN CLINICAL DATA MANAGEMENT, BY REGION, 2018–2022 (USD MILLION)
  • TABLE 127 MARKET IN CLINICAL DATA MANAGEMENT, BY REGION, 2023–2028 (USD MILLION)
  • TABLE 128 MARKET IN PERSONALIZED TREATMENT, BY REGION, 2018–2022 (USD MILLION)
  • TABLE 129 MARKET IN PERSONALIZED TREATMENT, BY REGION, 2023–2028 (USD MILLION)
  • TABLE 130 MARKET IN POPULATION HEALTH MANAGEMENT, BY REGION, 2018–2022 (USD MILLION)
  • TABLE 131 MARKET IN POPULATION HEALTH MANAGEMENT, BY REGION, 2023–2028 (USD MILLION)
  • TABLE 132 BIG DATA MARKET IN DRUG DISCOVERY & DEVELOPMENT, BY REGION, 2018–2022 (USD MILLION)
  • TABLE 133 MARKET IN DRUG DISCOVERY & DEVELOPMENT, BY REGION, 2023–2028 (USD MILLION)
  • TABLE 134 MARKET IN PATIENT OUTCOME PREDICTION, BY REGION, 2018–2022 (USD MILLION)
  • TABLE 135 MARKET IN PATIENT OUTCOME PREDICTION, BY REGION, 2023–2028 (USD MILLION)
  • TABLE 136 MARKET IN OTHER HEALTHCARE & LIFE SCIENCE APPLICATIONS, BY REGION, 2018–2022 (USD MILLION)
  • TABLE 137 MARKET IN OTHER HEALTHCARE & LIFE SCIENCE APPLICATIONS, BY REGION, 2023–2028 (USD MILLION)
  • TABLE 138 MARKET IN GOVERNMENT & DEFENSE VERTICAL, BY APPLICATION, 2018–2022 (USD MILLION)
  • TABLE 139 MARKET IN GOVERNMENT & DEFENSE VERTICAL, BY APPLICATION, 2023–2028 (USD MILLION)
  • TABLE 140 MARKET ON PREDICTIVE POLICING & CRIME PATTERN ANALYSIS, BY REGION, 2018–2022 (USD MILLION)
  • TABLE 141 MARKET ON PREDICTIVE POLICING & CRIME PATTERN ANALYSIS, BY REGION, 2023–2028 (USD MILLION)
  • TABLE 142 MARKET IN CYBERSECURITY & THREAT INTELLIGENCE, BY REGION, 2018–2022 (USD MILLION)
  • TABLE 143 MARKET IN CYBERSECURITY & THREAT INTELLIGENCE, BY REGION, 2023–2028 (USD MILLION)
  • TABLE 144 MARKET IN TAX & WELFARE MANAGEMENT, BY REGION, 2018–2022 (USD MILLION)
  • TABLE 145 MARKET IN TAX & WELFARE MANAGEMENT, BY REGION, 2023–2028 (USD MILLION)
  • TABLE 146 MARKET IN EMERGENCY RESPONSE OPTIMIZATION, BY REGION, 2018–2022 (USD MILLION)
  • TABLE 147 MARKET IN EMERGENCY RESPONSE OPTIMIZATION, BY REGION, 2023–2028 (USD MILLION)
  • TABLE 148 BIG DATA MARKET IN RESOURCE ALLOCATION & PLANNING, BY REGION, 2018–2022 (USD MILLION)
  • TABLE 149 MARKET IN RESOURCE ALLOCATION & PLANNING, BY REGION, 2023–2028 (USD MILLION)
  • TABLE 150 MARKET IN OTHER GOVERNMENT & DEFENSE APPLICATIONS, BY REGION, 2018–2022 (USD MILLION)
  • TABLE 151 MARKET IN OTHER GOVERNMENT & DEFENSE APPLICATIONS, BY REGION, 2023–2028 (USD MILLION)
  • TABLE 152 MARKET IN AUTOMOTIVE VERTICAL, BY APPLICATION, 2018–2022 (USD MILLION)
  • TABLE 153 MARKET IN AUTOMOTIVE VERTICAL, BY APPLICATION, 2023–2028 (USD MILLION)
  • TABLE 154 MARKET IN AUTONOMOUS VEHICLE DEVELOPMENT, BY REGION, 2018–2022 (USD MILLION)
  • TABLE 155 MARKET IN AUTONOMOUS VEHICLE DEVELOPMENT, BY REGION, 2023–2028 (USD MILLION)
  • TABLE 156 MARKET IN CONNECTED CAR SERVICES, BY REGION, 2018–2022 (USD MILLION)
  • TABLE 157 MARKET IN CONNECTED CAR SERVICES, BY REGION, 2023–2028 (USD MILLION)
  • TABLE 158 MARKET IN VEHICLE PREDICTIVE MAINTENANCE, BY REGION, 2018–2022 (USD MILLION)
  • TABLE 159 MARKET IN VEHICLE PREDICTIVE MAINTENANCE, BY REGION, 2 023–2028 (USD MILLION)
  • TABLE 160 MARKET IN TELEMATICS & USAGE-BASED INSURANCE, BY REGION, 2018–2022 (USD MILLION)
  • TABLE 161 MARKET IN TELEMATICS & USAGE-BASED INSURANCE, BY REGION, 2023–2028 (USD MILLION)
  • TABLE 162 BIG DATA MARKET IN VEHICLE PRODUCTION OPTIMIZATION, BY REGION, 2018–2022 (USD MILLION)
  • TABLE 163 MARKET IN VEHICLE PRODUCTION OPTIMIZATION, BY REGION, 2023–2028 (USD MILLION)
  • TABLE 164 MARKET IN OTHER AUTOMOTIVE APPLICATIONS, BY REGION, 2018–2022 (USD MILLION)
  • TABLE 165 MARKET IN OTHER AUTOMOTIVE APPLICATIONS, BY REGION, 2023–2028 (USD MILLION)
  • TABLE 166 MARKET IN EDUCATION VERTICAL, BY APPLICATION, 2018–2022 (USD MILLION)
  • TABLE 167 MARKET IN EDUCATION VERTICAL, BY APPLICATION, 2023–2028 (USD MILLION)
  • TABLE 168 MARKET IN STUDENT PERFORMANCE MANAGEMENT, BY REGION, 2018–2022 (USD MILLION)
  • TABLE 169 MARKET IN STUDENT PERFORMANCE MANAGEMENT, BY REGION, 2023–2028 (USD MILLION)
  • TABLE 170 MARKET IN CUSTOMIZED COURSES & PERSONALIZED LEARNING, BY REGION, 2018–2022 (USD MILLION)
  • TABLE 171 MARKET IN CUSTOMIZED COURSES & PERSONALIZED LEARNING, BY REGION, 2023–2028 (USD MILLION)
  • TABLE 172 MARKET IN CONFLICT ANTICIPATION & BEHAVIOR DETECTION, BY REGION, 2018–2022 (USD MILLION)
  • TABLE 173 MARKET IN CONFLICT ANTICIPATION & BEHAVIOR DETECTION, BY REGION, 2023–2028 (USD MILLION)
  • TABLE 174 MARKET IN ACADEMIC RESEARCH, BY REGION, 2018–2022 (USD MILLION)
  • TABLE 175 MARKET IN ACADEMIC RESEARCH, BY REGION, 2023–2028 (USD MILLION)
  • TABLE 176 MARKET IN ADAPTIVE TESTING & GRADING, BY REGION, 2018–2022 (USD MILLION)
  • TABLE 177 MARKET IN ADAPTIVE TESTING & GRADING, BY REGION, 2023–2028 (USD MILLION)
  • TABLE 178 BIG DATA MARKET IN OTHER EDUCATION APPLICATIONS, BY REGION, 2018–2022 (USD MILLION)
  • TABLE 179 MARKET IN OTHER EDUCATION APPLICATIONS, BY REGION, 2023–2028 (USD MILLION)
  • TABLE 180 MARKET IN MANUFACTURING VERTICAL, BY APPLICATION, 2018–2022 (USD MILLION)
  • TABLE 181 MARKET IN MANUFACTURING VERTICAL, BY APPLICATION, 2023–2028 (USD MILLION)
  • TABLE 182 MARKET IN EQUIPMENT & MACHINERY PREDICTIVE MAINTENANCE, BY REGION, 2018–2022 (USD MILLION)
  • TABLE 183 MARKET IN EQUIPMENT & MACHINERY PREDICTIVE MAINTENANCE, BY REGION, 2023–2028 (USD MILLION)
  • TABLE 184 MARKET IN QUALITY CONTROL & DEFECT ANALYSIS, BY REGION, 2018–2022 (USD MILLION)
  • TABLE 185 MARKET IN QUALITY CONTROL & DEFECT ANALYSIS, BY REGION, 2023–2028 (USD MILLION)
  • TABLE 186 MARKET IN SMART MANUFACTURING, BY REGION, 2018–2022 (USD MILLION)
  • TABLE 187 MARKET IN SMART MANUFACTURING, BY REGION, 2023–2028 (USD MILLION)
  • TABLE 188 MARKET IN ENERGY MANAGEMENT & EFFICIENCY, BY REGION, 2018–2022 (USD MILLION)
  • TABLE 189 MARKET IN ENERGY MANAGEMENT & EFFICIENCY, BY REGION, 2023–2028 (USD MILLION)
  • TABLE 190 BIG DATA MARKET IN PRODUCTION PROCESS OPTIMIZATION, BY REGION, 2018–2022 (USD MILLION)
  • TABLE 191 MARKET IN PRODUCTION PROCESS OPTIMIZATION, BY REGION, 2023–2028 (USD MILLION)
  • TABLE 192 MARKET IN OTHER MANUFACTURING APPLICATIONS, BY REGION, 2018–2022 (USD MILLION)
  • TABLE 193 MARKET IN OTHER MANUFACTURING APPLICATIONS, BY REGION, 2023–2028 (USD MILLION)
  • TABLE 194 MARKET IN TRANSPORTATION & LOGISTICS VERTICAL, BY APPLICATION, 2018–2022 (USD MILLION)
  • TABLE 195 MARKET IN TRANSPORTATION & LOGISTICS VERTICAL, BY APPLICATION, 2023–2028 (USD MILLION)
  • TABLE 196 MARKET IN ROUTE OPTIMIZATION & TRAFFIC MANAGEMENT, BY REGION, 2018–2022 (USD MILLION)
  • TABLE 197 MARKET IN ROUTE OPTIMIZATION & TRAFFIC MANAGEMENT, BY REGION, 2023–2028 (USD MILLION)
  • TABLE 198 MARKET IN FLEET MANAGEMENT, BY REGION, 2018–2022 (USD MILLION)
  • TABLE 199 MARKET IN FLEET MANAGEMENT, BY REGION, 2023–2028 (USD MILLION)
  • TABLE 200 MARKET IN VEHICLES & EQUIPMENT MAINTENANCE, BY REGION, 2018–2022 (USD MILLION)
  • TABLE 201 MARKET IN VEHICLES & EQUIPMENT MAINTENANCE, BY REGION, 2023–2028 (USD MILLION)
  • TABLE 202 MARKET IN SUPPLY CHAIN VISIBILITY, BY REGION, 2018–2022 (USD MILLION)
  • TABLE 203 MARKET IN SUPPLY CHAIN VISIBILITY, BY REGION, 2023–2028 (USD MILLION)
  • TABLE 204 BIG DATA MARKET IN LOGISTICS & INVENTORY MANAGEMENT, BY REGION, 2018–2022 (USD MILLION)
  • TABLE 205 MARKET IN LOGISTICS & INVENTORY MANAGEMENT, BY REGION, 2023–2028 (USD MILLION)
  • TABLE 206 MARKET IN OTHER TRANSPORTATION & LOGISTICS APPLICATIONS, BY REGION, 2018–2022 (USD MILLION)
  • TABLE 207 MARKET IN OTHER TRANSPORTATION & LOGISTICS APPLICATIONS, BY REGION, 2023–2028 (USD MILLION)
  • TABLE 208 MARKET IN OTHER VERTICALS, BY REGION, 2018–2022 (USD MILLION)
  • TABLE 209 MARKET IN OTHER VERTICALS, BY REGION, 2023–2028 (USD MILLION)
  • TABLE 210 MARKET, BY REGION, 2018–2022 (USD MILLION)
  • TABLE 211 MARKET, BY REGION, 2023–2028 (USD MILLION)
  • TABLE 212 NORTH AMERICA: BIG DATA MARKET, BY OFFERING, 2018–2022 (USD MILLION)
  • TABLE 213 NORTH AMERICA: MARKET, BY OFFERING, 2023–2028 (USD MILLION)
  • TABLE 214 NORTH AMERICA: MARKET, BY SOFTWARE TYPE, 2018–2022 (USD MILLION)
  • TABLE 215 NORTH AMERICA: MARKET, BY SOFTWARE TYPE, 2023–2028 (USD MILLION)
  • TABLE 216 NORTH AMERICA: BIG DATA SOFTWARE MARKET, BY DEPLOYMENT MODE, 2018–2022 (USD MILLION)
  • TABLE 217 NORTH AMERICA: BIG DATA SOFTWARE MARKET, BY DEPLOYMENT MODE, 2023–2028 (USD MILLION)
  • TABLE 218 NORTH AMERICA: MARKET, BY SERVICE, 2018–2022 (USD MILLION)
  • TABLE 219 NORTH AMERICA: MARKET, BY SERVICE, 2023–2028 (USD MILLION)
  • TABLE 220 NORTH AMERICA: MARKET, BY BUSINESS FUNCTION, 2018–2022 (USD MILLION)
  • TABLE 221 NORTH AMERICA: MARKET, BY BUSINESS FUNCTION, 2023–2028 (USD MILLION)
  • TABLE 222 NORTH AMERICA: MARKET, BY DATA TYPE, 2018–2022 (USD MILLION)
  • TABLE 223 NORTH AMERICA: MARKET, BY DATA TYPE, 2023–2028 (USD MILLION)
  • TABLE 224 NORTH AMERICA: MARKET, BY VERTICAL, 2018–2022 (USD MILLION)
  • TABLE 225 NORTH AMERICA: MARKET, BY VERTICAL, 2023–2028 (USD MILLION)
  • TABLE 226 NORTH AMERICA: MARKET, BY COUNTRY, 2018–2022 (USD MILLION)
  • TABLE 227 NORTH AMERICA: MARKET, BY COUNTRY, 2023–2028 (USD MILLION)
  • TABLE 228 US: BIG DATA MARKET, BY OFFERING, 2018–2022 (USD MILLION)
  • TABLE 229 US: MARKET, BY OFFERING, 2023–2028 (USD MILLION)
  • TABLE 230 CANADA: MARKET, BY OFFERING, 2018–2022 (USD MILLION)
  • TABLE 231 CANADA: MARKET, BY OFFERING, 2023–2028 (USD MILLION)
  • TABLE 232 EUROPE: MARKET, BY OFFERING, 2018–2022 (USD MILLION)
  • TABLE 233 EUROPE: MARKET, BY OFFERING, 2023–2028 (USD MILLION)
  • TABLE 234 EUROPE: MARKET, BY SOFTWARE TYPE, 2018–2022 (USD MILLION)
  • TABLE 235 EUROPE: MARKET, BY SOFTWARE TYPE, 2023–2028 (USD MILLION)
  • TABLE 236 EUROPE: BIG DATA SOFTWARE MARKET, BY DEPLOYMENT MODE, 2018–2022 (USD MILLION)
  • TABLE 237 EUROPE: BIG DATA SOFTWARE MARKET, BY DEPLOYMENT MODE, 2023–2028 (USD MILLION)
  • TABLE 238 EUROPE: MARKET, BY SERVICE, 2018–2022 (USD MILLION)
  • TABLE 239 EUROPE: MARKET, BY SERVICE, 2023–2028 (USD MILLION)
  • TABLE 240 EUROPE: MARKET, BY BUSINESS FUNCTION, 2018–2022 (USD MILLION)
  • TABLE 241 EUROPE: BIG DATA MARKET, BY BUSINESS FUNCTION, 2023–2028 (USD MILLION)
  • TABLE 242 EUROPE: MARKET, BY DATA TYPE, 2018–2022 (USD MILLION)
  • TABLE 243 EUROPE: MARKET, BY DATA TYPE, 2023–2028 (USD MILLION)
  • TABLE 244 EUROPE: MARKET, BY VERTICAL, 2018–2022 (USD MILLION)
  • TABLE 245 EUROPE: MARKET, BY VERTICAL, 2023–2028 (USD MILLION)
  • TABLE 246 EUROPE: MARKET, BY COUNTRY, 2018–2022 (USD MILLION)
  • TABLE 247 EUROPE: MARKET, BY COUNTRY, 2023–2028 (USD MILLION)
  • TABLE 248 UK: BIG DATA MARKET, BY OFFERING, 2018–2022 (USD MILLION)
  • TABLE 249 UK: MARKET, BY OFFERING, 2023–2028 (USD MILLION)
  • TABLE 250 GERMANY: MARKET, BY OFFERING, 2018–2022 (USD MILLION)
  • TABLE 251 GERMANY: MARKET, BY OFFERING, 2023–2028 (USD MILLION)
  • TABLE 252 FRANCE: MARKET, BY OFFERING, 2018–2022 (USD MILLION)
  • TABLE 253 FRANCE: MARKET, BY OFFERING, 2023–2028 (USD MILLION)
  • TABLE 254 ITALY: MARKET, BY OFFERING, 2018–2022 (USD MILLION)
  • TABLE 255 ITALY: MARKET, BY OFFERING, 2023–2028 (USD MILLION)
  • TABLE 256 SPAIN: MARKET, BY OFFERING, 2018–2022 (USD MILLION)
  • TABLE 257 SPAIN: MARKET, BY OFFERING, 2023–2028 (USD MILLION)
  • TABLE 258 REST OF EUROPE: MARKET, BY OFFERING, 2018–2022 (USD MILLION)
  • TABLE 259 REST OF EUROPE: MARKET, BY OFFERING, 2023–2028 (USD MILLION)
  • TABLE 260 ASIA PACIFIC: BIG DATA MARKET, BY OFFERING, 2018–2022 (USD MILLION)
  • TABLE 261 ASIA PACIFIC: MARKET, BY OFFERING, 2023–2028 (USD MILLION)
  • TABLE 262 ASIA PACIFIC: MARKET, BY SOFTWARE TYPE, 2018–2022 (USD MILLION)
  • TABLE 263 ASIA PACIFIC: MARKET, BY SOFTWARE TYPE, 2023–2028 (USD MILLION)
  • TABLE 264 ASIA PACIFIC: BIG DATA SOFTWARE MARKET, BY DEPLOYMENT MODE, 2018–2022 (USD MILLION)
  • TABLE 265 ASIA PACIFIC: BIG DATA SOFTWARE MARKET, BY DEPLOYMENT MODE, 2023–2028 (USD MILLION)
  • TABLE 266 ASIA PACIFIC: MARKET, BY SERVICE, 2018–2022 (USD MILLION)
  • TABLE 267 ASIA PACIFIC: MARKET, BY SERVICE, 2023–2028 (USD MILLION)
  • TABLE 268 ASIA PACIFIC: MARKET, BY BUSINESS FUNCTION, 2018–2022 (USD MILLION)
  • TABLE 269 ASIA PACIFIC: MARKET, BY BUSINESS FUNCTION, 2023–2028 (USD MILLION)
  • TABLE 270 ASIA PACIFIC: MARKET, BY DATA TYPE, 2018–2022 (USD MILLION)
  • TABLE 271 ASIA PACIFIC: MARKET, BY DATA TYPE, 2023–2028 (USD MILLION)
  • TABLE 272 ASIA PACIFIC: MARKET, BY VERTICAL, 2018–2022 (USD MILLION)
  • TABLE 273 ASIA PACIFIC: MARKET, BY VERTICAL, 2023–2028 (USD MILLION)
  • TABLE 274 ASIA PACIFIC: MARKET, BY COUNTRY, 2018–2022 (USD MILLION)
  • TABLE 275 ASIA PACIFIC: BIG DATA MARKET, BY COUNTRY, 2023–2028 (USD MILLION)
  • TABLE 276 CHINA: MARKET, BY OFFERING, 2018–2022 (USD MILLION)
  • TABLE 277 CHINA: MARKET, BY OFFERING, 2023–2028 (USD MILLION)
  • TABLE 278 INDIA: MARKET, BY OFFERING, 2018–2022 (USD MILLION)
  • TABLE 279 INDIA: MARKET, BY OFFERING, 2023–2028 (USD MILLION)
  • TABLE 280 JAPAN: MARKET, BY OFFERING, 2018–2022 (USD MILLION)
  • TABLE 281 JAPAN: MARKET, BY OFFERING, 2023–2028 (USD MILLION)
  • TABLE 282 SOUTH KOREA: MARKET, BY OFFERING, 2018–2022 (USD MILLION)
  • TABLE 283 SOUTH KOREA: MARKET, BY OFFERING, 2023–2028 (USD MILLION)
  • TABLE 284 SINGAPORE: MARKET, BY OFFERING, 2018–2022 (USD MILLION)
  • TABLE 285 SINGAPORE: MARKET, BY OFFERING, 2023–2028 (USD MILLION)
  • TABLE 286 AUSTRALIA & NEW ZEALAND: MARKET, BY OFFERING, 2018–2022 (USD MILLION)
  • TABLE 287 AUSTRALIA & NEW ZEALAND: BIG DATA MARKET, BY OFFERING, 2023–2028 (USD MILLION)
  • TABLE 288 REST OF ASIA PACIFIC: MARKET, BY OFFERING, 2018–2022 (USD MILLION)
  • TABLE 289 REST OF ASIA PACIFIC: MARKET, BY OFFERING, 2023–2028 (USD MILLION)
  • TABLE 290 MIDDLE EAST & AFRICA: MARKET, BY OFFERING, 2018–2022 (USD MILLION)
  • TABLE 291 MIDDLE EAST & AFRICA: MARKET, BY OFFERING, 2023–2028 (USD MILLION)
  • TABLE 292 MIDDLE EAST & AFRICA: MARKET, BY SOFTWARE TYPE, 2018–2022 (USD MILLION)
  • TABLE 293 MIDDLE EAST & AFRICA: MARKET, BY SOFTWARE TYPE, 2023–2028 (USD MILLION)
  • TABLE 294 MIDDLE EAST & AFRICA: BIG DATA SOFTWARE MARKET, BY DEPLOYMENT MODE, 2018–2022 (USD MILLION)
  • TABLE 295 MIDDLE EAST & AFRICA: BIG DATA SOFTWARE MARKET, BY DEPLOYMENT MODE, 2023–2028 (USD MILLION)
  • TABLE 296 MIDDLE EAST & AFRICA: MARKET, BY SERVICE, 2018–2022 (USD MILLION)
  • TABLE 297 MIDDLE EAST & AFRICA: MARKET, BY SERVICE, 2023–2028 (USD MILLION)
  • TABLE 298 MIDDLE EAST & AFRICA: MARKET, BY BUSINESS FUNCTION, 2018–2022 (USD MILLION)
  • TABLE 299 MIDDLE EAST & AFRICA: MARKET, BY BUSINESS FUNCTION, 2023–2028 (USD MILLION)
  • TABLE 300 MIDDLE EAST & AFRICA: MARKET, BY DATA TYPE, 2018–2022 (USD MILLION)
  • TABLE 301 MIDDLE EAST & AFRICA: MARKET, BY DATA TYPE, 2023–2028 (USD MILLION)
  • TABLE 302 MIDDLE EAST & AFRICA: MARKET, BY VERTICAL, 2018–2022 (USD MILLION)
  • TABLE 303 MIDDLE EAST & AFRICA: MARKET, BY VERTICAL, 2023–2028 (USD MILLION)
  • TABLE 304 MIDDLE EAST & AFRICA: MARKET, BY COUNTRY/REGION, 2018–2022 (USD MILLION)
  • TABLE 305 MIDDLE EAST & AFRICA: MARKET, BY COUNTRY/REGION, 2023–2028 (USD MILLION)
  • TABLE 306 GCC: BIG DATA MARKET, BY OFFERING, 2018–2022 (USD MILLION)
  • TABLE 307 GCC: MARKET, BY OFFERING, 2023–2028 (USD MILLION)
  • TABLE 308 EGYPT: MARKET, BY OFFERING, 2018–2022 (USD MILLION)
  • TABLE 309 EGYPT: MARKET, BY OFFERING, 2023–2028 (USD MILLION)
  • TABLE 310 SOUTH AFRICA: MARKET, BY OFFERING, 2018–2022 (USD MILLION)
  • TABLE 311 SOUTH AFRICA: MARKET, BY OFFERING, 2023–2028 (USD MILLION)
  • TABLE 312 TURKEY: BIG DATA MARKET, BY OFFERING, 2018–2022 (USD MILLION)
  • TABLE 313 TURKEY: MARKET, BY OFFERING, 2023–2028 (USD MILLION)
  • TABLE 314 REST OF MIDDLE EAST & AFRICA: MARKET, BY OFFERING, 2018–2022 (USD MILLION)
  • TABLE 315 REST OF MIDDLE EAST & AFRICA: MARKET, BY OFFERING, 2023–2028 (USD MILLION)
  • TABLE 316 LATIN AMERICA: MARKET, BY OFFERING, 2018–2022 (USD MILLION)
  • TABLE 317 LATIN AMERICA: MARKET, BY OFFERING, 2023–2028 (USD MILLION)
  • TABLE 318 LATIN AMERICA: MARKET, BY SOFTWARE TYPE, 2018–2022 (USD MILLION)
  • TABLE 319 LATIN AMERICA: MARKET, BY SOFTWARE TYPE, 2023–2028 (USD MILLION)
  • TABLE 320 LATIN AMERICA: BIG DATA SOFTWARE MARKET, BY DEPLOYMENT MODE, 2018–2022 (USD MILLION)
  • TABLE 321 LATIN AMERICA: BIG DATA SOFTWARE MARKET, BY DEPLOYMENT MODE, 2023–2028 (USD MILLION)
  • TABLE 322 LATIN AMERICA: MARKET, BY SERVICE, 2018–2022 (USD MILLION)
  • TABLE 323 LATIN AMERICA: MARKET, BY SERVICE, 2023–2028 (USD MILLION)
  • TABLE 324 LATIN AMERICA: MARKET, BY BUSINESS FUNCTION, 2018–2022 (USD MILLION)
  • TABLE 325 LATIN AMERICA: MARKET, BY BUSINESS FUNCTION, 2023–2028 (USD MILLION)
  • TABLE 326 LATIN AMERICA: MARKET, BY DATA TYPE, 2018–2022 (USD MILLION)
  • TABLE 327 LATIN AMERICA: MARKET, BY DATA TYPE, 2023–2028 (USD MILLION)
  • TABLE 328 LATIN AMERICA: MARKET, BY VERTICAL, 2018–2022 (USD MILLION)
  • TABLE 329 LATIN AMERICA: MARKET, BY VERTICAL, 2023–2028 (USD MILLION)
  • TABLE 330 LATIN AMERICA: MARKET, BY COUNTRY, 2018–2022 (USD MILLION)
  • TABLE 331 LATIN AMERICA: MARKET, BY COUNTRY, 2023–2028 (USD MILLION)
  • TABLE 332 BRAZIL: BIG DATA MARKET, BY OFFERING, 2018–2022 (USD MILLION)
  • TABLE 333 BRAZIL: MARKET, BY OFFERING, 2023–2028 (USD MILLION)
  • TABLE 334 MEXICO: MARKET, BY OFFERING, 2018–2022 (USD MILLION)
  • TABLE 335 MEXICO: MARKET, BY OFFERING, 2023–2028 (USD MILLION)
  • TABLE 336 ARGENTINA: MARKET, BY OFFERING, 2018–2022 (USD MILLION)
  • TABLE 337 ARGENTINA: MARKET, BY OFFERING, 2023–2028 (USD MILLION)
  • TABLE 338 REST OF LATIN AMERICA: MARKET, BY OFFERING, 2018–2022 (USD MILLION)
  • TABLE 339 REST OF LATIN AMERICA: MARKET, BY OFFERING, 2023–2028 (USD MILLION)
  • TABLE 340 OVERVIEW OF STRATEGIES ADOPTED BY KEY BIG DATA VENDORS
  • TABLE 341 BIG DATA MARKET: DEGREE OF COMPETITION
  • TABLE 342 PRODUCT FOOTPRINT: KEY PLAYERS (19 COMPANIES)
  • TABLE 343 VERTICAL FOOTPRINT: KEY PLAYERS (19 COMPANIES)
  • TABLE 344 REGIONAL FOOTPRINT: KEY PLAYERS (19 COMPANIES)
  • TABLE 345 COMPANY FOOTPRINT: KEY PLAYERS (19 COMPANIES)
  • TABLE 346 MARKET: DETAILED LIST OF STARTUPS/SMES
  • TABLE 347 MARKET: COMPETITIVE BENCHMARKING OF STARTUPS/SMES
  • TABLE 348 BIG DATA MARKET: PRODUCT LAUNCHES AND ENHANCEMENTS, JANUARY 2020– NOVEMBER 2023
  • TABLE 349 MARKET: DEALS, JANUARY 2020–NOVEMBER 2023
  • TABLE 350 IBM: BUSINESS OVERVIEW
  • TABLE 351 IBM: PRODUCTS/SOLUTIONS/SERVICES OFFERED
  • TABLE 352 IBM: PRODUCT LAUNCHES AND ENHANCEMENTS
  • TABLE 353 IBM: DEALS
  • TABLE 354 ORACLE: BUSINESS OVERVIEW
  • TABLE 355 ORACLE: PRODUCTS/SOLUTIONS/SERVICES OFFERED
  • TABLE 356 ORACLE: PRODUCT LAUNCHES AND ENHANCEMENTS
  • TABLE 357 ORACLE: DEALS
  • TABLE 358 MICROSOFT: BUSINESS OVERVIEW
  • TABLE 359 MICROSOFT: PRODUCTS/SOLUTIONS/SERVICES OFFERED
  • TABLE 360 MICROSOFT: PRODUCT LAUNCHES AND ENHANCEMENTS
  • TABLE 361 MICROSOFT: DEALS
  • TABLE 362 SAP: BUSINESS OVERVIEW
  • TABLE 363 SAP: PRODUCTS/SOLUTIONS/SERVICES OFFERED
  • TABLE 364 SAP: PRODUCT LAUNCHES AND ENHANCEMENTS
  • TABLE 365 SAP: DEALS
  • TABLE 366 SAS INSTITUTE: BUSINESS OVERVIEW
  • TABLE 367 SAS INSTITUTE: PRODUCTS/SOLUTIONS/SERVICES OFFERED
  • TABLE 368 SAS INSTITUTE: PRODUCT LAUNCHES AND ENHANCEMENTS
  • TABLE 369 SAS INSTITUTE: DEALS
  • TABLE 370 SALESFORCE: BUSINESS OVERVIEW
  • TABLE 371 SALESFORCE: PRODUCTS/SOLUTIONS/SERVICES OFFERED
  • TABLE 372 SALESFORCE: PRODUCT LAUNCHES AND ENHANCEMENTS
  • TABLE 373 SALESFORCE: DEALS
  • TABLE 374 AWS: BUSINESS OVERVIEW
  • TABLE 375 AWS: PRODUCTS/SOLUTIONS/SERVICES OFFERED
  • TABLE 376 AWS: PRODUCT LAUNCHES AND ENHANCEMENTS
  • TABLE 377 AWS: DEALS
  • TABLE 378 TERADATA: BUSINESS OVERVIEW
  • TABLE 379 TERADATA: PRODUCTS/SOLUTIONS/SERVICES OFFERED
  • TABLE 380 TERADATA: PRODUCT LAUNCHES AND ENHANCEMENTS
  • TABLE 381 TERADATA: DEALS
  • TABLE 382 GOOGLE: BUSINESS OVERVIEW
  • TABLE 383 GOOGLE: PRODUCTS/SOLUTIONS/SERVICES OFFERED
  • TABLE 384 GOOGLE: PRODUCT LAUNCHES AND ENHANCEMENTS
  • TABLE 385 GOOGLE: DEALS
  • TABLE 386 ACCENTURE: BUSINESS OVERVIEW
  • TABLE 387 ACCENTURE: PRODUCTS/SOLUTIONS/SERVICES OFFERED
  • TABLE 388 ACCENTURE: PRODUCT LAUNCHES AND ENHANCEMENTS
  • TABLE 389 ACCENTURE: DEALS
  • TABLE 390 HPE: BUSINESS OVERVIEW
  • TABLE 391 HPE: PRODUCTS/SOLUTIONS/SERVICES OFFERED
  • TABLE 392 HPE: PRODUCT LAUNCHES AND ENHANCEMENTS
  • TABLE 393 HPE: DEALS
  • TABLE 394 BIG DATA SECURITY MARKET, BY COMPONENT, 2014–2019 (USD MILLION)
  • TABLE 395 BIG DATA SECURITY MARKET, BY COMPONENT, 2020–2026 (USD MILLION)
  • TABLE 396 BIG DATA SECURITY MARKET, BY SOFTWARE, 2014–2019 (USD MILLION)
  • TABLE 397 BIG DATA SECURITY MARKET, BY SOFTWARE, 2020–2026 (USD MILLION)
  • TABLE 398 BIG DATA SECURITY MARKET, BY DEPLOYMENT MODE, 2014–2019 (USD MILLION)
  • TABLE 399 BIG DATA SECURITY MARKET, BY DEPLOYMENT MODE, 2020–2026 (USD MILLION)
  • TABLE 400 BIG DATA SECURITY MARKET, BY ORGANIZATION SIZE, 2014–2019 (USD MILLION)
  • TABLE 401 BIG DATA SECURITY MARKET, BY ORGANIZATION SIZE, 2020–2026 (USD MILLION)
  • TABLE 402 BIG DATA SECURITY MARKET, BY VERTICAL, 2014–2019 (USD MILLION)
  • TABLE 403 BIG DATA SECURITY MARKET, BY VERTICAL, 2020–2026 (USD MILLION)
  • TABLE 404 BIG DATA SECURITY MARKET, BY REGION, 2014–2019 (USD MILLION)
  • TABLE 405 BIG DATA SECURITY MARKET, BY REGION, 2020–2026 (USD MILLION)
  • TABLE 406 HADOOP BIG DATA ANALYTICS MARKET, BY COMPONENT, 2014–2019 (USD MILLION)
  • TABLE 407 HADOOP BIG DATA ANALYTICS MARKET, BY COMPONENT, 2 020–2025 (USD MILLION)
  • TABLE 408 HADOOP BIG DATA ANALYTICS MARKET, BY DEPLOYMENT MODE, 2014–2019 (USD MILLION)
  • TABLE 409 HADOOP BIG DATA ANALYTICS MARKET, BY DEPLOYMENT MODE, 2020–2025 (USD MILLION)
  • TABLE 410 HADOOP BIG DATA ANALYTICS MARKET, BY ORGANIZATION SIZE, 2014–2019 (USD MILLION)
  • TABLE 411 HADOOP BIG DATA ANALYTICS MARKET, BY ORGANIZATION SIZE, 2020–2025 (USD MILLION)
  • TABLE 412 HADOOP BIG DATA ANALYTICS MARKET, BY BUSINESS FUNCTION, 2014–2019 (USD MILLION)
  • TABLE 413 HADOOP BIG DATA ANALYTICS MARKET, BY BUSINESS FUNCTION, 2020–2025 (USD MILLION)
  • TABLE 414 HADOOP BIG DATA ANALYTICS MARKET, BY VERTICAL, 2014–2019 (USD MILLION)
  • TABLE 415 HADOOP BIG DATA ANALYTICS MARKET, BY VERTICAL, 2020–2025 (USD MILLION)
  • TABLE 416 HADOOP BIG DATA ANALYTICS MARKET, BY REGION, 2014–2019 (USD MILLION)
  • TABLE 417 HADOOP BIG DATA ANALYTICS MARKET SIZE, BY REGION, 2020–2025 (USD MILLION)
LIST OF FIGURES
 
  • FIGURE 1 BIG DATA MARKET SEGMENTATION
  • FIGURE 2 REGIONAL SEGMENTATION
  • FIGURE 3 MARKET: RESEARCH DESIGN
  • FIGURE 4 MARKET: TOP-DOWN AND BOTTOM-UP APPROACHES
  • FIGURE 5 APPROACH 1, BOTTOM-UP (SUPPLY-SIDE): REVENUE FROM SOLUTIONS/SERVICES OF MARKET
  • FIGURE 6 APPROACH 2, BOTTOM-UP (SUPPLY-SIDE): COLLECTIVE REVENUE FROM ALL SOLUTIONS/SERVICES OF MARKET
  • FIGURE 7 APPROACH 3, BOTTOM-UP (SUPPLY-SIDE): COLLECTIVE REVENUE FROM ALL SOLUTIONS/SERVICES OF MARKET
  • FIGURE 8 APPROACH 4, BOTTOM-UP (DEMAND-SIDE): SHARE OF BIG DATA THROUGH OVERALL DIGITAL SOLUTIONS SPENDING
  • FIGURE 9 DATA TRIANGULATION
  • FIGURE 10 SOFTWARE SEGMENT TO BE LARGER MARKET IN 2023
  • FIGURE 11 BIG DATA ANALYTICS SOFTWARE TO BE LEADING SOFTWARE SEGMENT DURING FORECAST PERIOD
  • FIGURE 12 BIG DATA CONSULTING SERVICES TO LEAD MARKET IN 2023
  • FIGURE 13 ON-PREMISE DEPLOYMENT MODEL TO BE LARGER SEGMENT DURING FORECAST PERIOD
  • FIGURE 14 MARKETING & SALES BUSINESS FUNCTION SEGMENT TO ACCOUNT FOR LARGEST MARKET SHARE IN 2023
  • FIGURE 15 UNSTRUCTURED DATA TYPE SEGMENT TO BE DOMINANT MARKET SHARE IN 2023
  • FIGURE 16 RETAIL & CONSUMER GOODS VERTICAL TO WITNESS HIGHEST GROWTH RATE DURING FORECAST PERIOD
  • FIGURE 17 ASIA PACIFIC TO REGISTER FASTEST GROWTH RATE BETWEEN 2023 & 2028
  • FIGURE 18 AMPLIFIED DEMAND FOR DATA-DRIVEN INSIGHTS SET TO PROPAGATE EXPONENTIAL GROWTH IN MARKET
  • FIGURE 19 UNSTRUCTURED DATA TYPE TO WITNESS HIGHEST GROWTH RATE DURING FORECAST PERIOD
  • FIGURE 20 SOFTWARE AND BFSI TO BE LARGEST SHAREHOLDERS IN MARKET IN NORTH AMERICA IN 2023
  • FIGURE 21 NORTH AMERICA TO ACCOUNT FOR LARGEST REGIONAL MARKET SHARE IN 2023
  • FIGURE 22 DRIVERS, RESTRAINTS, OPPORTUNITIES, AND CHALLENGES: MARKET
  • FIGURE 23 DATA-DRIVEN DECISION-MAKING IN ORGANIZATIONS WORLDWIDE, BY SECTOR, 2020
  • FIGURE 24 VOLUME OF DATA CREATED AND REPLICATED WORLDWIDE, 2010–2025 (ZETTABYTE)
  • FIGURE 25 MOST REPORTED DATA SILO ISSUES BY GLOBAL ENTERPRISES, 2017–2022
  • FIGURE 26 GLOBAL INTERNET USER GROWTH, 2018–2023 (BILLION)
  • FIGURE 27 SHARE OF CORPORATE DATA STORED IN CLOUD, 2015–2022
  • FIGURE 28 VARIETY OF DATA COLLECTED IN 60 SECONDS, 2023
  • FIGURE 29 MARKET EVOLUTION
  • FIGURE 30 FUNCTIONAL ELEMENTS OF BIG DATA SOLUTION
  • FIGURE 31 MARKET: VALUE CHAIN ANALYSIS
  • FIGURE 32 KEY PLAYERS IN MARKET ECOSYSTEM
  • FIGURE 33 VENTURE CAPITAL DEAL VOLUME IN BIG DATA, BY CATEGORY, 2011–2022
  • FIGURE 34 BIG DATA SPEND PATTERN OF ENTERPRISES IN THEIR OVERALL TECHNOLOGY EXPENDITURE, 2014–2022
  • FIGURE 35 PERCENTAGE OF TECH COMPANIES INVESTING IN BIG DATA & AI, 2017–2021
  • FIGURE 36 GLOBAL VENTURE CAPITAL INVESTMENT IN BIG DATA, BY CATEGORY, 2018–2022
  • FIGURE 37 TOP FIVE BIG DATA & DATA ANALYTICS FUNDING ROUNDS, 2022 (USD MILLION)
  • FIGURE 38 NUMBER OF PATENTS GRANTED IN LAST 10 YEARS, 2013–2023
  • FIGURE 39 TOP 10 APPLICANTS IN MARKET, 2013–2023
  • FIGURE 40 REGIONAL ANALYSIS OF PATENTS GRANTED, 2013–2023
  • FIGURE 41 AVERAGE SELLING PRICE TREND OF KEY PLAYERS: TOP THREE SOFTWARE TYPES (USD/YEAR)
  • FIGURE 42 COMPUTER SOFTWARE EXPORT, BY KEY COUNTRY, 2015–2022 (USD BILLION)
  • FIGURE 43 COMPUTER SOFTWARE IMPORT, BY KEY COUNTRY, 2015–2022 (USD BILLION)
  • FIGURE 44 PORTER’S FIVE FORCES ANALYSIS: BIG DATA MARKET
  • FIGURE 45 BIG DATA TECHNOLOGY ROADMAP
  • FIGURE 46 BIG DATA BUSINESS MODELS
  • FIGURE 47 TRENDS/DISRUPTIONS IMPACTING CUSTOMERS’ BUSINESS
  • FIGURE 48 INFLUENCE OF STAKEHOLDERS ON BUYING PROCESS FOR TOP THREE VERTICALS
  • FIGURE 49 KEY BUYING CRITERIA FOR TOP THREE VERTICALS
  • FIGURE 50 BIG DATA SOFTWARE TO REGISTER HIGHER MARKET SHARE DURING FORECAST PERIOD
  • FIGURE 51 BIG DATA ANALYTICS SOFTWARE TO BE LARGEST SOFTWARE SEGMENT BY VALUE IN 2023
  • FIGURE 52 BIG DATA-AS-A-SERVICE SEGMENT TO REGISTER HIGHEST CAGR AMONG SERVICES DURING FORECAST PERIOD
  • FIGURE 53 MARKETING & SALES TO BE LEADING BUSINESS FUNCTION OF BIG DATA DURING FORECAST PERIOD
  • FIGURE 54 UNSTRUCTURED BIG DATA TO ACCOUNT FOR LARGEST MARKET DURING FORECAST PERIOD
  • FIGURE 55 RETAIL & CONSUMER GOODS VERTICAL TO GROW AT HIGHEST CAGR DURING FORECAST PERIOD
  • FIGURE 56 ASIA PACIFIC TO REGISTER HIGHEST CAGR DURING FORECAST PERIOD
  • FIGURE 57 SINGAPORE TO REGISTER HIGHEST GROWTH DURING FORECAST PERIOD
  • FIGURE 58 NORTH AMERICA: BIG DATA MARKET SNAPSHOT
  • FIGURE 59 ASIA PACIFIC: BIG DATA MARKET SNAPSHOT
  • FIGURE 60 BUSINESS SEGMENT REVENUE ANALYSIS FOR KEY PLAYERS
  • FIGURE 61 MARKET SHARE ANALYSIS FOR KEY PLAYERS, 2022
  • FIGURE 62 BRAND/PRODUCT COMPARATIVE ANALYSIS, BY BIG DATA ANALYTICS SOFTWARE
  • FIGURE 63 BRAND/PRODUCT COMPARATIVE ANALYSIS, BY DATA MANAGEMENT SOFTWARE
  • FIGURE 64 BRAND/PRODUCT COMPARATIVE ANALYSIS, BY DATA MINING SOFTWARE
  • FIGURE 65 VALUATION AND FINANCIAL METRICS OF KEY VENDORS
  • FIGURE 66 YEAR-TO-DATE (YTD) PRICE TOTAL RETURN AND 5-YEAR STOCK BETA OF KEY VENDORS
  • FIGURE 67 BIG DATA MARKET: COMPANY EVALUATION MATRIX (KEY PLAYERS), 2022
  • FIGURE 68 BIG DATA MARKET: COMPANY EVALUATION MATRIX (STARTUPS/SMES), 2022
  • FIGURE 69 IBM: COMPANY SNAPSHOT
  • FIGURE 70 ORACLE: COMPANY SNAPSHOT
  • FIGURE 71 MICROSOFT: COMPANY SNAPSHOT
  • FIGURE 72 SAP: COMPANY SNAPSHOT
  • FIGURE 73 SALESFORCE: COMPANY SNAPSHOT
  • FIGURE 74 AWS: COMPANY SNAPSHOT
  • FIGURE 75 TERADATA: COMPANY SNAPSHOT
  • FIGURE 76 GOOGLE: COMPANY SNAPSHOT
  • FIGURE 77 ACCENTURE: COMPANY SNAPSHOT
  • FIGURE 78 HPE: COMPANY SNAPSHOT


The big data market research study involved extensive secondary sources, directories, journals, and paid databases. Primary sources were mainly Interviews with experts from the core and related industries, preferred big data providers, third-party service providers, consulting service providers, end-users, and other commercial enterprises. In-depth interviews were conducted with various primary respondents, including key industry participants and subject matter experts, to obtain and verify critical qualitative and quantitative information and assess the market’s prospects.

Secondary Research

In the secondary research process, various sources were referred to for identifying and collecting information for this study. Secondary sources included annual reports, press releases, and investor presentations of companies; white papers, journals, and certified publications; and articles from recognized authors, directories, and databases. The data was also collected from other secondary sources, such as journals, government websites, blogs, and vendors’ websites. Additionally, big data spending of various countries was extracted from the respective sources. Secondary research was mainly used to obtain key information related to the industry’s value chain and supply chain to identify key players based on solutions, services, market classification, and segmentation according to offerings of major players, industry trends related to solutions, services, deployment modes, business functions, applications, verticals, and regions, and key developments from both market- and technology-oriented perspectives.

Primary Research

In the primary research process, various primary sources from both the supply and demand sides were interviewed to obtain qualitative and quantitative information on the market. The primary sources from the supply side included various Interviews with Experts, including Chief Experience Officers (CXOs); Vice Presidents (VPs); directors from business development, marketing, and big data expertise; related key executives from big data software vendors, SIs, professional service providers, and industry associations; and key opinion leaders.

Primary interviews were conducted to gather insights, such as market statistics, revenue data collected from solutions and services, market breakups, market size estimations, market forecasts, and data triangulation. Primary research also helped understand various trends related to technologies, applications, deployments, and regions. Stakeholders from the demand side, such as Chief Information Officers (CIOs), Chief Technology Officers (CTOs), Chief Strategy Officers (CSOs), and end users using Big data solutions, were interviewed to understand the buyer’s perspective on suppliers, products, service providers, and their current usage of Big data solutions and services, which would impact the overall big data market.

The Breakup of Primary Research:
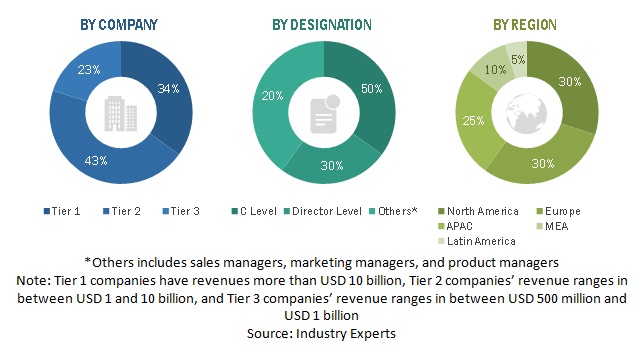
Big Data Market Size, and Share

To know about the assumptions considered for the study, download the pdf brochure

COMPANY NAME

DESIGNATION

Amazon

  • Vice President & Country Manager

Salesforce

  • Vice President – Digital Transformation

Cloudera

  • Regional Vice President

Microsoft

  • Enterprise Cloud & Productivity Architect

Databyte Services & Systems

  • Director 

Informatica

  • Data Governance Expert

HCL

  • General Manager – Marketing & Sales

Good Data

  • VP of Product Marketing 

IBM

  • Deputy General Manager – Digital Ops & Strategy
  • Product Marketing Director

Market Size Estimation

In the bottom-up approach, the adoption rate of big data solutions and services among different end users in key countries with respect to their regions contributing the most to the market share was identified. For cross-validation, the adoption of Big data solutions and services among industries, along with different use cases with respect to their regions, was identified and extrapolated. Weightage was given to use cases identified in different regions for the market size calculation.

Based on the market numbers, the regional split was determined by primary and secondary sources. The procedure included the analysis of the big data market’s regional penetration. Based on secondary research, the regional spending on Information and Communications Technology (ICT), socio-economic analysis of each country, strategic vendor analysis of major big data providers, and organic and inorganic business development activities of regional and global players were estimated. With the data triangulation procedure and data validation through primaries, the exact values of the overall big data market size and segments’ size were determined and confirmed using the study.

Global Big Data Market Size: Bottom-Up and Top-Down Approach:
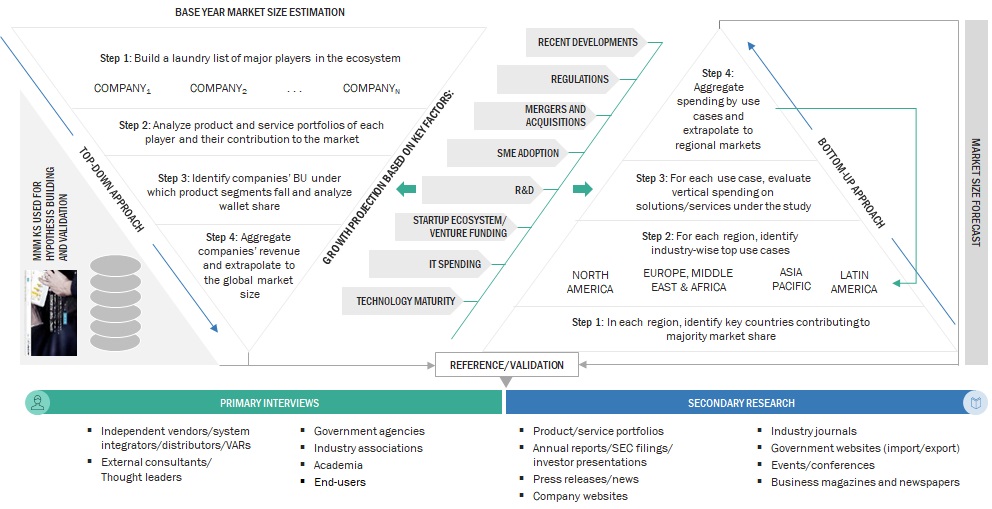
Big Data Market Top-Down and Bottom-Up approaches

To know about the assumptions considered for the study, Request for Free Sample Report

Data Triangulation

Based on the market numbers, the regional split was determined by primary and secondary sources. The procedure included the analysis of the big data market’s regional penetration. Based on secondary research, the regional spending on Information and Communications Technology (ICT), socio-economic analysis of each country, strategic vendor analysis of major big data providers, and organic and inorganic business development activities of regional and global players were estimated. With the data triangulation procedure and data validation through primaries, the exact values of the overall Big data market size and segments’ size were determined and confirmed using the study.

Market Definition

Big data refers to vast and complex sets of information that surpass the processing capabilities of traditional databases. It encompasses massive volumes of structured and unstructured data, generated at high velocity from various sources. The essence of big data lies in its potential for revealing valuable insights, patterns, and trends when analyzed. Businesses leverage big data analytics to extract meaningful information, enhance decision-making processes, and gain a competitive edge. In today's digital landscape, big data plays a pivotal role in uncovering hidden opportunities, mitigating risks, and driving innovation across diverse industries.

Stakeholders

  • Application design and software developers
  • Big data vendors
  • Business analysts
  • Cloud service providers
  • Consulting service providers
  • Data scientists
  • Distributors and Value-added Resellers (VARs)
  • Government agencies
  • Independent Software Vendors (ISV)
  • Managed service providers
  • Market research and consulting firms
  • Support and maintenance service providers
  • System Integrators (SIs)/migration service providers
  • Technology providers
  • Value-added resellers (VARs)

Report Objectives

  • To define, describe, and predict the big data market by offering (software and services), business function, data type, vertical, and region
  • To provide detailed information related to major factors (drivers, restraints, opportunities, and industry-specific challenges) influencing the market growth
  • To analyze the micro markets with respect to individual growth trends, prospects, and their contribution to the total market
  • To analyze the opportunities in the market for stakeholders by identifying the high-growth segments of the big data market
  • To analyze opportunities in the market and provide details of the competitive landscape for stakeholders and market leaders
  • To forecast the market size of segments for five main regions: North America, Europe, Asia Pacific, Middle East & Africa, and Latin America
  • To profile key players and comprehensively analyze their market rankings and core competencies.
  • To analyze competitive developments, such as partnerships, new product launches, and mergers and acquisitions, in the big data market
  • To analyze the impact of recession across all the regions across the big data market

Available Customizations

With the given market data, MarketsandMarkets offers customizations as per your company’s specific needs. The following customization options are available for the report:

Product Analysis

  • Product quadrant, which gives a detailed comparison of the product portfolio of each company.

Geographic Analysis

  • Further breakup of the North American big data market
  • Further breakup of the European big data market
  • Further breakup of the Asia Pacific big data market
  • Further breakup of the Middle Eastern & African big data market
  • Further breakup of the Latin America big data market

Company Information

  • Detailed analysis and profiling of additional market players (up to five)
Custom Market Research Services

We will customize the research for you, in case the report listed above does not meet with your exact requirements. Our custom research will comprehensively cover the business information you require to help you arrive at strategic and profitable business decisions.

Request Customization

Instant Answers with GPT - Ask Now!

Ask real questions. Get complete answers !
Report Code
TC 1521
Published ON
Jan, 2024
Choose License Type
BUY NOW
  • SHARE
X
Request Customization
Speak to Analyst
Speak to Analyst
OR FACE-TO-FACE MEETING
PERSONALIZE THIS RESEARCH
  • Triangulate with your Own Data
  • Get Data as per your Format and Definition
  • Gain a Deeper Dive on a Specific Application, Geography, Customer or Competitor
  • Any level of Personalization
REQUEST A FREE CUSTOMIZATION
LET US HELP YOU!
  • What are the Known and Unknown Adjacencies Impacting the Big Data Market
  • What will your New Revenue Sources be?
  • Who will be your Top Customer; what will make them switch?
  • Defend your Market Share or Win Competitors
  • Get a Scorecard for Target Partners
CUSTOMIZED WORKSHOP REQUEST
knowledgestore logo

Want to explore hidden markets that can drive new revenue in Big Data Market?

Find Hidden Markets
  • Call Us
  • +1-888-600-6441 (Corporate office hours)
  • +1-888-600-6441 (US/Can toll free)
  • +44-800-368-9399 (UK office hours)
CONNECT WITH US
ABOUT TRUST ONLINE
©2024 MarketsandMarkets Research Private Ltd. All rights reserved
DMCA.com Protection Status
Website Feedback