Isostatic Pressing Market

Isostatic Pressing Market by Offering ( System, Services), Type (Hot and Cold), HIP Capacity (Small, Medium, & Large), CIP Process (Wet & Dry), Industry (Automotive, Aerospace, Medical, Manufacturing) and Geography - Global Forecast to 2028

Report Code: SE 6684 Jun, 2023, by marketsandmarkets.com

[239 Pages Report] The global Isostatic pressing market size is expected to grow from USD 8.1 billion in 2023 to USD 11.7 billion by 2028, registering a CAGR of 7.6%. The isostatic pressing industry is witnessing significant growth driven by several factors, including an increasing need for intricate components, advancements in material science, emphasis on precision and quality, go for efficiency and cost-effectiveness, expanding industrial applications, technological progress, and the requirement to meet rigorous quality and performance standards. Collectively, these factors are driving the growth of isostatic pressing as it continues to meet the evolving demands of various industries.

Isostatic Pressing Market

Isostatic Pressing Market

Isostatic Pressing Market Statistics Forecast to 2028

To know about the assumptions considered for the study, Request for Free Sample Report

Global Isostatic Pressing Market Dynamics

Driver: Growing Emphasis on the Combination of Hot Isostatic Pressing (HIP) With Other Heat Treatment Processes

The HIP and heat treatment processes in a conventional practice are carried out at different facilities, where the parts have to be loaded and unloaded into process vessels twice and shipped from one facility to another, which consumes time. Thus, combining HIP and other heat treatment processes in a single and integrated unit can help reduce energy consumption and meet the components' delivery time. The constant improvements in HIP equipment from the 1970s have led to advanced processing options, such as rapid cooling capability and automatic processing. For instance, processes such as HIP, additive manufacturing, and spark plasma sintering can be used as a single unit to create high-integrity, near-net-shaped parts from metal powder while reducing processing costs and energy consumption.

Some of such combined techniques are used in the aerospace industry. However, their implementation has yet to be commercialized for civil nuclear applications. The Nuclear Advanced Manufacturing Research Centre (AMRC) (UK) is planning to invest in industry-led projects to assess the potential of these processes in the civil nuclear sector. The organization has designed a strategy to commercialize such promising techniques for production processes.

Restraint:Requirement of high initial investments

The market for isostatic pressing necessitates a significant initial investment due to the need for advanced machinery, specialized technologies, and high-pressure vessels. Establishing an isostatic pressing facility involves substantial costs associated with acquiring equipment, implementing safety measures, and ensuring proper training and maintenance. This initial investment acts as a barrier to entry for new entrants and contributes to a competitive landscape dominated by established companies. However, despite the high initial costs, the potential for long-term benefits, such as market growth and the ability to meet the increasing demand for high-quality components, justifies the investment in isostatic pressing.

Opportunity: Growing demand for low-cost titanium and its alloys in the automotive industry.

Titanium and its alloys are light in weight, corrosive resistant, and feature high strength, which makes them ideal for use in various automobile applications. The increasing focus on the light weighing of automobiles has encouraged manufacturers and designers to use titanium tubes and titanium-welded tubes. However, the cost of titanium is the main drawback associated with using this metal. Therefore, the manufacturers are looking forward to developing new innovative ways to produce low-cost titanium for different automobile applications. Hence, the HIP processes decrease the manufacturing cost of titanium alloys and other PM superalloys by ensuring lower manufacturing time and cost than conventional processes. This cost-related benefit is expected to fuel adopting HIP systems in titanium alloy manufacturing for the automotive industry and soon create lucrative opportunities for market players.

Challenge: Limited size and shape capabilities of Isostatic Pressing

Isostatic pressing is typically best suited for small to medium-sized parts. More significant parts can be difficult to manufacture using this process because it requires large equipment, which can be expensive to purchase and maintain. Isostatic pressing is best suited for parts with simple geometries. More complex shapes can be difficult to manufacture using this process. This is because the powder must be evenly distributed in the mold, which can be challenging to achieve with complex shapes. The tooling cost required for isostatic pressing can be significant, particularly for parts with complex shapes. This can make the process less cost-effective for parts with irregular shapes. The thickness of the part can also be a limiting factor for isostatic pressing. Parts that are too thick can be difficult to manufacture using this process because the powder may not be able to be evenly distributed in the mold.

Isostatic pressing Market Ecosystem

Component suppliers and system integrators have witnessed a decline in production activities. Consequently, OEMs have needed more essential components. The figure below shows the Isostatic pressing ecosystem.

Isostatic Pressing Market by Ecosystem

Global Isostatic Pressing Industry Segment Dynamics

Services segment to hold largest market share in the year.

Currently, the services market of isostatic pressing is gaining traction, with the increasing applications of isostatic pressing systems in the automotive, manufacturing, energy & power, and medical industries. To improve the quality and reliability of components and configurations, isostatic pressing systems are regularly inspected to detect discontinuities, defects, or any other faults, which might reduce operational reliability and lead to failures.

Hot isostatic pressing segment to hold largest market share in the year 2022.

The hot isostatic pressing (HIP) market is experiencing substantial growth, driven by various factors. Industries such as aerospace, automotive, medical, energy, and manufacturing increasingly demand reliable, high-performance components. As a response, there is a notable adoption of HIP technology, which provides advanced manufacturing solutions to enhance material properties and component performance. Moreover, advancements in materials, alloys, and improvements in HIP equipment technology further facilitate market expansion. The industry's focus on cost efficiency, waste reduction, and sustainable manufacturing practices supports the market’s growth.

Medical industry is expected to register highest CAGR during the forecast period.

The players in the medical industry are continuously adopting new technologies, such as additive manufacturing or 3D printing, in a wide range of applications. CIP consolidates the 3D-printed parts; apart from this, its applications mainly include the consolidation of ceramic powders and other fine or advanced grades of ceramics used in the dental and medical sectors. The growth of the CIP market for the medical industry is attributed to the need for complex shapes with uniform and high-density parts for developing artificial bone, artificial tooth material, and resin powder.

Isostatic Pressing Market by Region

Isostatic Pressing Market Statistics by Region

To know about the assumptions considered for the study, download the pdf brochure

Isostatic Pressing Market Share & Growth

Asia Pacific to grow at highest CAGR during the forecast period.

The robust growth of the isostatic pressing market in the Asia-Pacific region can be attributed to several key factors. These include the rapid pace of industrialization, new markets, technological advancements, the expanding automotive and aerospace sectors, the growth of electronics manufacturing, supportive government policies, and the increasing emphasis on energy and environmental technologies. Moreover, the increase in demand for low-cost and reliable metal and ceramic products for various applications and rising preference for custom implants (in medical applications) due to better and more efficient recovery are expected to propel the demand for isostatic pressing in the region. The major markets in APAC are Japan and China. India has high growth potential for isostatic pressing products and service providers and is also the fastest-growing market in APAC. The leading players in the isostatic pressing market in APAC are Kobe Steel, Ltd. (Japan), Bodycote (UK), Kennametal, Inc. (US), and Nikkiso., Ltd. (Japan)

Top Isostatic Pressing Companies - Key Market Players

The Isostatic pressing companies players have implemented various organic and inorganic growth strategies, such as product launches, collaborations, partnerships, and acquisitions, to strengthen their offerings in the market. The major players in the market are Kobe Steel, Ltd. (Japan), Bodycote (UK), Kennametal, Inc. (US), Nikkiso., Ltd. (Japan), DORST Technologies GmbH & Co. KG (Germany), American Isostatic Presses, Inc (US), EPSI (US), Pressure Technology, Inc. (US), Shanxi Golden Kaiyuan Co., Ltd. (China)

The study includes an in-depth competitive analysis of these key players in the Isostatic pressing market with their company profiles, recent developments, and key market strategies.

Isostatic Pressing Market Report Scope

Report Metric

Details

Estimated Market Size  USD 8.1 billion in 2023
Projected Market Size USD 11.7 billion by 2028
Isostatic Pressing Market Growth Rate CAGR of 7.6%

Years Considered

2019–2028

Base Year Considered

2022

Forecast Period

2023–2028

Forecast Units

Value (USD Million/Billion)

Segments Covered

Offerings, Types, Process types, Capacity, Industry, and Region

Regions Covered

North America, Asia Pacific, Europe, and the Rest of the World

Companies Covered

Kobe Steel, Ltd. (Japan), Bodycote (UK), Kennametal, Inc. (US), Nikkiso., Ltd. (Japan), DORST Technologies GmbH & Co. KG (Germany), American Isostatic Presses, Inc (US), EPSI (US), Pressure Technology, Inc. (US), Shanxi Golden Kaiyuan Co., Ltd. (China) A total of 25 players covered

Isostatic Pressing Market Highlights

This report has segmented the overall Isostatic pressing market based on Offerings, components, industry, and region.

Segment

Subsegment

By Offerings

  • Systems
  • Services

By Type

  • Hot Isostatic pressing
  • Cold Isostatic Pressing

By Process Type

  • Wet Bag Pressing
  • Dry Bag Pressing

By Capacity

  • Small-Sized
  •  Medium-Sized
  •  Large-Sized

By Industry

  • Manufacturing
  • Automotive
  • Electronics & Semiconductor
  • Medical
  • Aerospace & Defense
  • Energy & Power
  • Research & Development
  • Others

By Region

  • North America
    • US
    • Canada
    • Mexico
  • Europe
    • UK
    • Germany
    • France
    • Rest of Europe
  • Asia Pacific
    • China
    • Japan
    • South Korea
    • India
    • Rest of Asia Pacific
  • Rest of the World
    • Middle East & Africa
    • South America

Recent Developments in Isostatic Pressing Industry

  • In July 2022, Bodycote, the world’s largest thermal processing services provider, is expanding its Hot Isostatic Pressing (HIP) capability in Greenville, South Carolina, USA. The new HIP capacity will be online by the end of 2022, focusing on developments in additive manufacturing and advanced materials.
  • In February 2021, Bodycote expanded its facility in Syracuse, North America. It offers a wide range of heat treatment processes. These include vacuum heat treating, atmospheric carburizing, low-pressure carburizing, carbonitriding, ferritic nitrocarburizing, nitriding, and aluminum heat treating.

Frequently Asked Questions (FAQ):

To speak to our analyst for a discussion on the above findings, click Speak to Analyst

TABLE OF CONTENTS
 
1 INTRODUCTION (Page No. - 31)
    1.1 STUDY OBJECTIVES 
    1.2 MARKET DEFINITION 
    1.3 INCLUSIONS AND EXCLUSIONS 
    1.4 STUDY SCOPE 
           1.4.1 MARKETS COVERED
           1.4.2 REGIONAL SCOPE
           1.4.3 YEARS CONSIDERED
           1.4.4 CURRENCY CONSIDERED
    1.5 LIMITATIONS 
    1.6 STAKEHOLDERS 
    1.7 SUMMARY OF CHANGES 
           1.7.1 RECESSION IMPACT
 
2 RESEARCH METHODOLOGY (Page No. - 35)
    2.1 RESEARCH DATA 
           2.1.1 SECONDARY DATA
                    2.1.1.1 List of major secondary sources
                    2.1.1.2 Key data from secondary sources
           2.1.2 PRIMARY DATA
                    2.1.2.1 Breakdown of primary sources
                    2.1.2.2 Key data from primary sources
           2.1.3 SECONDARY AND PRIMARY RESEARCH
                    2.1.3.1 Key industry insights
    2.2 MARKET SIZE ESTIMATION 
           2.2.1 BOTTOM-UP APPROACH
                    2.2.1.1 Approach to derive market size using bottom-up analysis
           2.2.2 TOP-DOWN APPROACH
                    2.2.2.1 Approach to derive market size using top-down analysis
    2.3 MARKET BREAKDOWN AND DATA TRIANGULATION 
    2.4 RESEARCH ASSUMPTIONS 
    2.5 APPROACH TO DETERMINE IMPACT OF RECESSION ON ISOSTATIC PRESSING MARKET 
    2.6 RISK ASSESSMENT 
           TABLE 1 LIMITATIONS AND ASSOCIATED RISKS
 
3 EXECUTIVE SUMMARY (Page No. - 47)
 
4 PREMIUM INSIGHTS (Page No. - 51)
    4.1 ATTRACTIVE OPPORTUNITIES FOR PLAYERS IN ISOSTATIC PRESSING MARKET 
    4.2 ISOSTATIC PRESSING MARKET, BY OFFERING 
    4.3 ISOSTATIC PRESSING MARKET, BY TYPE 
    4.4 ISOSTATIC PRESSING MARKET, BY CAPACITY 
    4.5 ISOSTATIC PRESSING MARKET, BY PROCESS TYPE 
    4.6 ISOSTATIC PRESSING MARKET, BY END-USER INDUSTRY 
    4.7 ISOSTATIC PRESSING MARKET, BY REGION 
    4.8 ISOSTATIC PRESSING MARKET, BY COUNTRY 
 
5 MARKET OVERVIEW (Page No. - 55)
    5.1 INTRODUCTION 
    5.2 MARKET DYNAMICS 
           5.2.1 DRIVERS
                    5.2.1.1 Increased installation of HIP systems to densify 3D-printed parts
                    5.2.1.2 Capability of HIP systems to reduce product maintenance costs and cycle time
                    5.2.1.3 Rising emphasis on combining HIP with other heat-treatment processes
           5.2.2 RESTRAINTS
                    5.2.2.1 High initial investment
           5.2.3 OPPORTUNITIES
                    5.2.3.1 Growing adoption of HIP by aircraft companies
                    5.2.3.2 Rising demand for low-cost titanium and alloys from automakers
           5.2.4 CHALLENGES
                    5.2.4.1 Shortage of skilled workforce
                    5.2.4.2 Limitations associated with isostatic pressing tools
    5.3 VALUE CHAIN ANALYSIS 
    5.4 ECOSYSTEM ANALYSIS 
           TABLE 2 ISOSTATIC PRESSING MARKET: ECOSYSTEM ANALYSIS
    5.5 PRICING ANALYSIS 
           5.5.1 AVERAGE SELLING PRICE (ASP) OF ISOSTATIC PRESSING SYSTEMS OFFERED BY TOP TWO PLAYERS
                    TABLE 3 AVERAGE SELLING PRICE (ASP) OF ISOSTATIC PRESSING SYSTEMS OFFERED BY TOP TWO PLAYERS (USD)
                    TABLE 4 AVERAGE SELLING PRICE (ASP) OF HOT ISOSTATIC PRESSING (HIP) SYSTEMS, BY REGION (USD)
    5.6 TRENDS/DISRUPTIONS IMPACTING CUSTOMERS’ BUSINESSES 
    5.7 TECHNOLOGY ANALYSIS 
           5.7.1 HYDROSTATIC ISOSTATIC PRESSING
           5.7.2 PNEUMATIC ISOSTATIC PRESSING (PIP)
           5.7.3 ELECTRO-HYDRAULIC ISOSTATIC PRESSING (EHIP)
           5.7.4 HIGH-PRESSURE TORSION (HPT)
    5.8 PORTER’S FIVE FORCES ANALYSIS 
           TABLE 5 ISOSTATIC PRESSING MARKET: PORTER’S FIVE FORCES ANALYSIS
           5.8.1 INTENSITY OF COMPETITIVE RIVALRY
           5.8.2 THREAT OF SUBSTITUTES
           5.8.3 BARGAINING POWER OF BUYERS
           5.8.4 BARGAINING POWER OF SUPPLIERS
           5.8.5 THREAT OF NEW ENTRANTS
    5.9 KEY STAKEHOLDERS AND BUYING CRITERIA 
           5.9.1 KEY STAKEHOLDERS IN BUYING CRITERIA
                    TABLE 6 INFLUENCE OF STAKEHOLDERS ON BUYING PROCESS FOR TOP THREE END-USER INDUSTRIES
           5.9.2 BUYING CRITERIA
                    TABLE 7 KEY BUYING CRITERIA FOR STAKEHOLDERS FROM TOP THREE END-USER INDUSTRIES
    5.10 CASE STUDY ANALYSIS 
           5.10.1 NUCLEAR DECOMMISSIONING AUTHORITY (NDA) USES ISOSTATIC PRESSING SYSTEMS TO ADDRESS ISSUES RELATED TO MATERIALS BLENDED WITH PLUTONIUM
           5.10.2 LUCIDEON’S EXPERTISE HELPS TACKLE ADDITIVE MANUFACTURING HIP ISSUES
    5.11 TRADE ANALYSIS 
    5.12 PATENT ANALYSIS 
           TABLE 8 TOP PATENT OWNERS, 2013–2022 (US)
           TABLE 9 LIST OF MAJOR PATENTS
    5.13 KEY CONFERENCES AND EVENTS, 2023–2024 
           TABLE 10 ISOSTATIC PRESSING MARKET: LIST OF CONFERENCES AND EVENTS
    5.14 REGULATORY LANDSCAPE AND STANDARDS 
           5.14.1 REGULATORY BODIES, GOVERNMENT AGENCIES, AND OTHER ORGANIZATIONS
                    TABLE 11 NORTH AMERICA: LIST OF REGULATORY BODIES, GOVERNMENT AGENCIES, AND OTHER ORGANIZATIONS
                    TABLE 12 EUROPE: LIST OF REGULATORY BODIES, GOVERNMENT AGENCIES, AND OTHER ORGANIZATIONS
                    TABLE 13 ASIA PACIFIC: LIST OF REGULATORY BODIES, GOVERNMENT AGENCIES, AND OTHER ORGANIZATIONS
                    TABLE 14 ROW: LIST OF REGULATORY BODIES, GOVERNMENT AGENCIES, AND OTHER ORGANIZATIONS
           5.14.2 STANDARDS
                    TABLE 15 ISOSTATIC PRESSINGS MARKET: STANDARDS
 
6 ISOSTATIC PRESSING MARKET, BY MATERIAL (Page No. - 81)
    6.1 INTRODUCTION 
    6.2 METAL 
           6.2.1 EFFECTIVE IN MANUFACTURING HIGH ASPECT RATIO PRODUCTS
    6.3 CERAMIC 
           6.3.1 PREFERRED FOR HIGH-QUALITY CERAMIC PRODUCTION
    6.4 COMPOSITE 
           6.4.1 USED TO CONSOLIDATE AND SHAPE COMPOSITES WITH HIGH DIMENSIONAL PRECISION
    6.5 PLASTIC 
           6.5.1 HELPS MANUFACTURE HIGH-DENSITY PLASTIC COMPONENTS OF COMPLEX SHAPES
    6.6 CARBON 
           6.6.1 BENEFICIAL IN CREATING INTRICATE FORMS FOR VARIOUS APPLICATIONS
 
7 ISOSTATIC PRESSING MARKET, BY OFFERING (Page No. - 83)
    7.1 INTRODUCTION 
           TABLE 16 ISOSTATIC PRESSING MARKET, BY OFFERING, 2019–2022 (USD MILLION)
           TABLE 17 ISOSTATIC PRESSING MARKET, BY OFFERING, 2023–2028 (USD MILLION)
    7.2 SYSTEMS 
           7.2.1 NEAR-NET SHAPING ABILITY OF ISOSTATIC PRESSING SYSTEMS TO BOOST DEMAND
                    TABLE 18 SYSTEMS: ISOSTATIC PRESSING MARKET, BY TYPE, 2019–2022 (USD MILLION)
                    TABLE 19 SYSTEMS: ISOSTATIC PRESSING MARKET, BY TYPE, 2023–2028 (USD MILLION)
    7.3 SERVICES 
           7.3.1 GROWING ADOPTION OF ISOSTATIC PRESSING SERVICES IN VARIOUS INDUSTRIES TO DRIVE MARKET
                    TABLE 20 SERVICES: ISOSTATIC PRESSING MARKET, BY TYPE, 2019–2022 (USD MILLION)
                    TABLE 21 SERVICES: ISOSTATIC PRESSING MARKET, BY TYPE, 2023–2028 (USD MILLION)
 
8 ISOSTATIC PRESSING MARKET, BY TYPE (Page No. - 88)
    8.1 INTRODUCTION 
           TABLE 22 ISOSTATIC PRESSING MARKET, BY TYPE, 2019–2022 (USD MILLION)
           TABLE 23 ISOSTATIC PRESSING MARKET, BY TYPE, 2023–2028 (USD MILLION)
           TABLE 24 ISOSTATIC PRESSING SYSTEM SHIPMENT, BY TYPE, 2022 (THOUSAND UNITS)
    8.2 HOT ISOSTATIC PRESSING (HIP) 
           8.2.1 USED IN METAL CASTING, DIFFUSION BONDING, AND CONSOLIDATION OF POWDER METAL AND CERAMIC PARTS TO ENHANCE MATERIAL PRODUCTION CYCLE AND EFFICIENCY
                    TABLE 25 HOT ISOSTATIC PRESSING (HIP): ISOSTATIC PRESSING MARKET, BY OFFERING, 2019–2022 (USD MILLION)
                    TABLE 26 HOT ISOSTATIC PRESSING (HIP): ISOSTATIC PRESSING MARKET, BY OFFERING, 2023–2028 (USD MILLION)
                    TABLE 27 HOT ISOSTATIC PRESSING (HIP): ISOSTATIC PRESSING MARKET, BY END-USER INDUSTRY, 2019–2022 (USD MILLION)
                    TABLE 28 HOT ISOSTATIC PRESSING (HIP): ISOSTATIC PRESSING MARKET, BY END-USER INDUSTRY, 2023–2028 (USD MILLION)
                    TABLE 29 HOT ISOSTATIC PRESSING (HIP): ISOSTATIC PRESSING MARKET FOR SYSTEMS, BY END-USER INDUSTRY, 2019–2022 (USD MILLION)
                    TABLE 30 HOT ISOSTATIC PRESSING (HIP): ISOSTATIC PRESSING MARKET FOR SYSTEMS, BY END-USER INDUSTRY, 2023–2028 (USD MILLION)
                    TABLE 31 HOT ISOSTATIC PRESSING (HIP): ISOSTATIC PRESSING MARKET FOR SERVICES, BY END-USER INDUSTRY, 2019–2022 (USD MILLION)
                    TABLE 32 HOT ISOSTATIC PRESSING (HIP): ISOSTATIC PRESSING MARKET FOR SERVICES, BY END-USER INDUSTRY, 2023–2028 (USD MILLION)
    8.3 COLD ISOSTATIC PRESSING (CIP) 
           8.3.1 EFFECTIVE FORMING METHOD IN CERAMIC MANUFACTURING AND POWDER METALLURGY
                    TABLE 33 COLD ISOSTATIC PRESSING (CIP): ISOSTATIC PRESSING MARKET, BY OFFERING, 2019–2022 (USD MILLION)
                    TABLE 34 COLD ISOSTATIC PRESSING (CIP): ISOSTATIC PRESSING MARKET, BY OFFERING, 2023–2028 (USD MILLION)
                    TABLE 35 COLD ISOSTATIC PRESSING (CIP): ISOSTATIC PRESSING MARKET, BY END-USER INDUSTRY, 2019–2022 (USD MILLION)
                    TABLE 36 COLD ISOSTATIC PRESSING (CIP): ISOSTATIC PRESSING MARKET, BY END-USER INDUSTRY, 2023–2028 (USD MILLION)
                    TABLE 37 COLD ISOSTATIC PRESSING (CIP): ISOSTATIC PRESSING MARKET FOR SYSTEMS, BY END-USER INDUSTRY, 2019–2022 (USD MILLION)
                    TABLE 38 COLD ISOSTATIC PRESSING (CIP): ISOSTATIC PRESSING MARKET FOR SYSTEMS, BY END-USER INDUSTRY, 2023–2028 (USD MILLION)
                    TABLE 39 COLD ISOSTATIC PRESSING (CIP): ISOSTATIC PRESSING MARKET FOR SERVICES, BY END-USER INDUSTRY, 2019–2022 (USD MILLION)
                    TABLE 40 COLD ISOSTATIC PRESSING (CIP): ISOSTATIC PRESSING MARKET FOR SERVICES, BY END-USER INDUSTRY, 2023–2028 (USD MILLION)
 
9 HOT ISOSTATIC PRESSING MARKET, BY CAPACITY (Page No. - 99)
    9.1 INTRODUCTION 
           TABLE 41 HOT ISOSTATIC PRESSING MARKET, BY CAPACITY, 2019–2022 (USD MILLION)
           TABLE 42 HOT ISOSTATIC PRESSING MARKET, BY CAPACITY, 2023–2028 (USD MILLION)
    9.2 SMALL-SIZED HIP 
           9.2.1 HIGHLY PREFERRED IN LABORATORY-BASED PROCESSES FOR METAL DENSIFICATION, CASTING, AND FORGING
 
           9.3.1 EXHIBITS IMPROVED PRODUCTION TIME
    9.4 LARGE-SIZED HIP 
           9.4.1 ENHANCES POWDER METALLURGY CAPABILITIES
 
10 COLD ISOSTATIC PRESSING MARKET, BY PROCESS TYPE (Page No. - 103)
     10.1 INTRODUCTION 
             TABLE 43 COLD ISOSTATIC PRESSING MARKET, BY PROCESS TYPE, 2019–2022 (USD MILLION)
             TABLE 44 COLD ISOSTATIC PRESSING MARKET, BY PROCESS TYPE, 2023–2028 (USD MILLION)
     10.2 WET BAG PRESSING 
             10.2.1 INCREASING PREFERENCE IN LARGE, FLEXIBLE PRODUCT AND SYSTEM MANUFACTURING
     10.3 DRY BAG PRESSING 
             10.3.1 GROWING USE IN SMALL-VOLUME PART DENSIFICATION
 
11 ISOSTATIC PRESSING MARKET, BY END-USER INDUSTRY (Page No. - 106)
     11.1 INTRODUCTION 
             TABLE 45 ISOSTATIC PRESSING MARKET, BY END-USER INDUSTRY, 2019–2022 (USD MILLION)
             TABLE 46 ISOSTATIC PRESSING MARKET, BY END-USER INDUSTRY, 2023–2028 (USD MILLION)
     11.2 AUTOMOTIVE 
             11.2.1 IDEAL TECHNOLOGY TO IMPROVE PERFORMANCE, EFFICIENCY, AND SAFETY OF MODERN-DAY VEHICLES
                        TABLE 47 AUTOMOTIVE: ISOSTATIC PRESSING MARKET, BY TYPE, 2019–2022 (USD MILLION)
                        TABLE 48 AUTOMOTIVE: ISOSTATIC PRESSING MARKET, BY TYPE, 2023–2028 (USD MILLION)
                        TABLE 49 AUTOMOTIVE: ISOSTATIC PRESSING MARKET, BY REGION, 2019–2022 (USD MILLION)
                        TABLE 50 AUTOMOTIVE: ISOSTATIC PRESSING MARKET, BY REGION, 2023–2028 (USD MILLION)
                        TABLE 51 AUTOMOTIVE: HOT ISOSTATIC PRESSING MARKET FOR SYSTEMS, BY REGION, 2019–2022 (USD MILLION)
                        TABLE 52 AUTOMOTIVE: HOT ISOSTATIC PRESSING MARKET FOR SYSTEMS, BY REGION, 2023–2028 (USD MILLION)
                        TABLE 53 AUTOMOTIVE: HOT ISOSTATIC PRESSING MARKET FOR SERVICES, BY REGION, 2019–2022 (USD MILLION)
                        TABLE 54 AUTOMOTIVE: HOT ISOSTATIC PRESSING MARKET FOR SERVICES, BY REGION, 2023–2028 (USD MILLION)
                        TABLE 55 AUTOMOTIVE: COLD ISOSTATIC PRESSING MARKET, BY REGION, 2019–2022 (USD MILLION)
                        TABLE 56 AUTOMOTIVE: COLD ISOSTATIC PRESSING MARKET, BY REGION, 2023–2028 (USD MILLION)
     11.3 AEROSPACE 
             11.3.1 USED TO DEVELOP DURABLE AND HIGH-STRENGTH SYSTEMS AND COMPONENTS
                        TABLE 57 AEROSPACE: ISOSTATIC PRESSING MARKET, BY TYPE, 2019–2022 (USD MILLION)
                        TABLE 58 AEROSPACE: ISOSTATIC PRESSING MARKET, BY TYPE, 2023–2028 (USD MILLION)
                        TABLE 59 AEROSPACE: ISOSTATIC PRESSING MARKET, BY REGION, 2019–2022 (USD MILLION)
                        TABLE 60 AEROSPACE: ISOSTATIC PRESSING MARKET, BY REGION, 2023–2028 (USD MILLION)
                        TABLE 61 AEROSPACE: HOT ISOSTATIC PRESSING MARKET FOR SYSTEMS, BY REGION, 2019–2022 (USD MILLION)
                        TABLE 62 AEROSPACE: HOT ISOSTATIC PRESSING MARKET FOR SYSTEMS, BY REGION, 2023–2028 (USD MILLION)
                        TABLE 63 AEROSPACE: HOT ISOSTATIC PRESSING MARKET FOR SERVICES, BY REGION, 2019–2022 (USD MILLION)
                        TABLE 64 AEROSPACE: HOT ISOSTATIC PRESSING MARKET FOR SERVICES, BY REGION, 2023–2028 (USD MILLION)
                        TABLE 65 AEROSPACE: COLD ISOSTATIC PRESSING MARKET, BY REGION, 2019–2022 (USD MILLION)
                        TABLE 66 AEROSPACE: COLD ISOSTATIC PRESSING MARKET, BY REGION, 2023–2028 (USD MILLION)
     11.4 MEDICAL 
             11.4.1 HELPS MANUFACTURE HIGH-QUALITY, BIOCOMPATIBLE CERAMIC COMPONENTS
                        TABLE 67 MEDICAL: ISOSTATIC PRESSING MARKET, BY TYPE, 2019–2022 (USD MILLION)
                        TABLE 68 MEDICAL: ISOSTATIC PRESSING MARKET, BY TYPE, 2023–2028 (USD MILLION)
                        TABLE 69 MEDICAL: ISOSTATIC PRESSING MARKET, BY REGION, 2019–2022 (USD MILLION)
                        TABLE 70 MEDICAL: ISOSTATIC PRESSING MARKET, BY REGION, 2023–2028 (USD MILLION)
                        TABLE 71 MEDICAL: HOT ISOSTATIC PRESSING MARKET FOR SYSTEMS, BY REGION, 2019–2022 (USD MILLION)
                        TABLE 72 MEDICAL: HOT ISOSTATIC PRESSING MARKET FOR SYSTEMS, BY REGION, 2023–2028 (USD MILLION)
                        TABLE 73 MEDICAL: HOT ISOSTATIC PRESSING MARKET FOR SERVICES, BY REGION, 2019–2022 (USD MILLION)
                        TABLE 74 MEDICAL: HOT ISOSTATIC PRESSING MARKET FOR SERVICES, BY REGION, 2023–2028 (USD MILLION)
                        TABLE 75 MEDICAL: COLD ISOSTATIC PRESSING MARKET, BY REGION, 2019–2022 (USD MILLION)
                        TABLE 76 MEDICAL: COLD ISOSTATIC PRESSING MARKET, BY REGION, 2023–2028 (USD MILLION)
     11.5 ENERGY & POWER 
             11.5.1 IMPROVES POWER PLANT EFFICIENCY AND HELPS MEET RISING ENERGY DEMAND
                        TABLE 77 ENERGY & POWER: ISOSTATIC PRESSING MARKET, BY TYPE, 2019–2022 (USD MILLION)
                        TABLE 78 ENERGY & POWER: ISOSTATIC PRESSING MARKET, BY TYPE, 2023–2028 (USD MILLION)
                        TABLE 79 ENERGY & POWER: ISOSTATIC PRESSING MARKET, BY REGION, 2019–2022 (USD MILLION)
                        TABLE 80 ENERGY & POWER: ISOSTATIC PRESSING MARKET, BY REGION, 2023–2028 (USD MILLION)
                        TABLE 81 ENERGY & POWER: HOT ISOSTATIC PRESSING MARKET FOR SYSTEMS, BY REGION, 2019–2022 (USD MILLION)
                        TABLE 82 ENERGY & POWER: HOT ISOSTATIC PRESSING MARKET FOR SYSTEMS, BY REGION, 2023–2028 (USD MILLION)
                        TABLE 83 ENERGY & POWER: HOT ISOSTATIC PRESSING MARKET FOR SERVICES, BY REGION, 2019–2022 (USD MILLION)
                        TABLE 84 ENERGY & POWER: HOT ISOSTATIC PRESSING MARKET FOR SERVICES, BY REGION, 2023–2028 (USD MILLION)
                        TABLE 85 ENERGY & POWER: COLD ISOSTATIC PRESSING MARKET, BY REGION, 2019–2022 (USD MILLION)
                        TABLE 86 ENERGY & POWER: COLD ISOSTATIC PRESSING MARKET, BY REGION, 2023–2028 (USD MILLION)
     11.6 ELECTRONICS & SEMICONDUCTOR 
             11.6.1 INCREASES STRENGTH, DUCTILITY, AND FATIGUE LIFE OF ELECTRONICS & SEMICONDUCTORS
                        TABLE 87 ELECTRONICS & SEMICONDUCTOR: ISOSTATIC PRESSING MARKET, BY TYPE, 2019–2022 (USD MILLION)
                        TABLE 88 ELECTRONICS & SEMICONDUCTOR: ISOSTATIC PRESSING MARKET, BY TYPE, 2023–2028 (USD MILLION)
                        TABLE 89 ELECTRONICS & SEMICONDUCTOR: ISOSTATIC PRESSING MARKET, BY REGION, 2019–2022 (USD MILLION)
                        TABLE 90 ELECTRONICS & SEMICONDUCTOR: ISOSTATIC PRESSING MARKET, BY REGION, 2023–2028 (USD MILLION)
                        TABLE 91 ELECTRONICS & SEMICONDUCTOR: HOT ISOSTATIC PRESSING MARKET FOR SYSTEMS, BY REGION, 2019–2022 (USD MILLION)
                        TABLE 92 ELECTRONICS & SEMICONDUCTOR: HOT ISOSTATIC PRESSING MARKET FOR SYSTEMS, BY REGION, 2023–2028 (USD MILLION)
                        TABLE 93 ELECTRONICS & SEMICONDUCTOR: HOT ISOSTATIC PRESSING MARKET FOR SERVICES, BY REGION, 2019–2022 (USD MILLION)
                        TABLE 94 ELECTRONICS & SEMICONDUCTOR: HOT ISOSTATIC PRESSING MARKET FOR SERVICES, BY REGION, 2023–2028 (USD MILLION)
                        TABLE 95 ELECTRONICS & SEMICONDUCTOR: COLD ISOSTATIC PRESSING MARKET, BY REGION, 2019–2022 (USD MILLION)
                        TABLE 96 ELECTRONICS & SEMICONDUCTOR: COLD ISOSTATIC PRESSING MARKET, BY REGION, 2023–2028 (USD MILLION)
     11.7 PRECISION MACHINE MANUFACTURING 
             11.7.1 REDUCES POROSITY AND INCREASES STRENGTH OF CAST IMPELLERS AND CASINGS
                        TABLE 97 PRECISION MACHINE MANUFACTURING: ISOSTATIC PRESSING MARKET, BY TYPE, 2019–2022 (USD MILLION)
                        TABLE 98 PRECISION MACHINE MANUFACTURING: ISOSTATIC PRESSING MARKET, BY TYPE, 2023–2028 (USD MILLION)
                        TABLE 99 PRECISION MACHINE MANUFACTURING: ISOSTATIC PRESSING MARKET, BY REGION, 2019–2022 (USD MILLION)
                        TABLE 100 PRECISION MACHINE MANUFACTURING: ISOSTATIC PRESSING MARKET, BY REGION, 2023–2028 (USD MILLION)
                        TABLE 101 PRECISION MACHINE MANUFACTURING: HOT ISOSTATIC PRESSING MARKET FOR SYSTEMS, BY REGION, 2019–2022 (USD MILLION)
                        TABLE 102 PRECISION MACHINE MANUFACTURING: HOT ISOSTATIC PRESSING MARKET FOR SYSTEMS, BY REGION, 2023–2028 (USD MILLION)
                        TABLE 103 PRECISION MACHINE MANUFACTURING: HOT ISOSTATIC PRESSING MARKET FOR SERVICES, BY REGION, 2019–2022 (USD MILLION)
                        TABLE 104 PRECISION MACHINE MANUFACTURING: HOT ISOSTATIC PRESSING MARKET FOR SERVICES, BY REGION, 2023–2028 (USD MILLION)
                        TABLE 105 PRECISION MACHINE MANUFACTURING: COLD ISOSTATIC PRESSING MARKET, BY REGION, 2019–2022 (USD MILLION)
                        TABLE 106 PRECISION MACHINE MANUFACTURING: COLD ISOSTATIC PRESSING MARKET, BY REGION, 2023–2028 (USD MILLION)
     11.8 RESEARCH & DEVELOPMENT 
             11.8.1 USED IN POWDERED METAL PROTOTYPES AND FEASIBILITY STUDIES
                        TABLE 107 RESEARCH & DEVELOPMENT: ISOSTATIC PRESSING MARKET, BY TYPE, 2019–2022 (USD MILLION)
                        TABLE 108 RESEARCH & DEVELOPMENT: ISOSTATIC PRESSING MARKET, BY TYPE, 2023–2028 (USD MILLION)
                        TABLE 109 RESEARCH & DEVELOPMENT: ISOSTATIC PRESSING MARKET, BY REGION, 2019–2022 (USD MILLION)
                        TABLE 110 RESEARCH & DEVELOPMENT: ISOSTATIC PRESSING MARKET, BY REGION, 2023–2028 (USD MILLION)
                        TABLE 111 RESEARCH & DEVELOPMENT: HOT ISOSTATIC PRESSING MARKET FOR SYSTEMS, BY REGION, 2019–2022 (USD MILLION)
                        TABLE 112 RESEARCH & DEVELOPMENT: HOT ISOSTATIC PRESSING MARKET FOR SYSTEMS, BY REGION, 2023–2028 (USD MILLION)
                        TABLE 113 RESEARCH & DEVELOPMENT: HOT ISOSTATIC PRESSING MARKET FOR SERVICES, BY REGION, 2019–2022 (USD MILLION)
                        TABLE 114 RESEARCH & DEVELOPMENT: HOT ISOSTATIC PRESSING MARKET FOR SERVICES, BY REGION, 2023–2028 (USD MILLION)
                        TABLE 115 RESEARCH & DEVELOPMENT: COLD ISOSTATIC PRESSING MARKET, BY REGION, 2019–2022 (USD MILLION)
                        TABLE 116 RESEARCH & DEVELOPMENT: COLD ISOSTATIC PRESSING MARKET, BY REGION, 2023–2028 (USD MILLION)
     11.9 OTHERS 
             TABLE 117 OTHERS: ISOSTATIC PRESSING MARKET, BY TYPE, 2019–2022 (USD MILLION)
             TABLE 118 OTHERS: ISOSTATIC PRESSING MARKET, BY TYPE, 2023–2028 (USD MILLION)
             TABLE 119 OTHERS: ISOSTATIC PRESSING MARKET, BY REGION, 2019–2022 (USD MILLION)
             TABLE 120 OTHERS: ISOSTATIC PRESSING MARKET, BY REGION, 2023–2028 (USD MILLION)
             TABLE 121 OTHERS: HOT ISOSTATIC PRESSING MARKET FOR SYSTEMS, BY REGION, 2019–2022 (USD MILLION)
             TABLE 122 OTHERS: HOT ISOSTATIC PRESSING MARKET FOR SYSTEMS, BY REGION, 2023–2028 (USD MILLION)
             TABLE 123 OTHERS: HOT ISOSTATIC PRESSING MARKET FOR SERVICES, BY REGION, 2019–2022 (USD MILLION)
             TABLE 124 OTHERS: HOT ISOSTATIC PRESSING MARKET FOR SERVICES, BY REGION, 2023–2028 (USD MILLION)
             TABLE 125 OTHERS: COLD ISOSTATIC PRESSING MARKET, BY REGION, 2019–2022 (USD MILLION)
             TABLE 126 OTHERS: COLD ISOSTATIC PRESSING MARKET, BY REGION, 2023–2028 (USD MILLION)
 
12 ISOSTATIC PRESSING MARKET, BY REGION (Page No. - 138)
     12.1 INTRODUCTION 
             TABLE 127 ISOSTATIC PRESSING MARKET, BY REGION, 2019–2022 (USD MILLION)
             TABLE 128 ISOSTATIC PRESSING MARKET, BY REGION, 2023–2028 (USD MILLION)
             TABLE 129 HOT ISOSTATIC PRESSING MARKET, BY REGION, 2019–2022 (USD MILLION)
             TABLE 130 HOT ISOSTATIC PRESSING MARKET, BY REGION, 2023–2028 (USD MILLION)
             TABLE 131 COLD ISOSTATIC PRESSING MARKET, BY REGION, 2019–2022 (USD MILLION)
             TABLE 132 COLD ISOSTATIC PRESSING MARKET, BY REGION, 2023–2028 (USD MILLION)
     12.2 NORTH AMERICA 
             12.2.1 NORTH AMERICA: RECESSION IMPACT
                        TABLE 133 NORTH AMERICA: ISOSTATIC PRESSING MARKET, BY COUNTRY, 2019–2022 (USD MILLION)
                        TABLE 134 NORTH AMERICA: ISOSTATIC PRESSING MARKET, BY COUNTRY, 2023–2028 (USD MILLION)
                        TABLE 135 NORTH AMERICA: ISOSTATIC PRESSING MARKET, BY END-USER INDUSTRY, 2019–2022 (USD MILLION)
                        TABLE 136 NORTH AMERICA: ISOSTATIC PRESSING MARKET, BY END-USER INDUSTRY, 2023–2028 (USD MILLION)
             12.2.2 US
                        12.2.2.1 Growing requirement for isostatic pressing systems in aerospace, medical, semiconductor, and energy industries
             12.2.3 CANADA
                        12.2.3.1 Increasing applications of isostatic pressing in automotive, medical, and energy & power industries to reduce manufacturing cost and cycle time
             12.2.4 MEXICO
                        12.2.4.1 Rising demand for high-performance materials and production of new battery types and fuel cells
     12.3 EUROPE 
             12.3.1 EUROPE: RECESSION IMPACT
                        TABLE 137 EUROPE: ISOSTATIC PRESSING MARKET, BY COUNTRY, 2019–2022 (USD MILLION)
                        TABLE 138 EUROPE: ISOSTATIC PRESSING MARKET, BY COUNTRY, 2023–2028 (USD MILLION)
                        TABLE 139 EUROPE: ISOSTATIC PRESSING MARKET, BY END-USER INDUSTRY, 2019–2022 (USD MILLION)
                        TABLE 140 EUROPE: ISOSTATIC PRESSING MARKET, BY END-USER INDUSTRY, 2023–2028 (USD MILLION)
             12.3.2 UK
                        12.3.2.1 Large presence of ceramic companies and expanding automotive industry
             12.3.3 GERMANY
                        12.3.3.1 Strong presence of automobile companies
             12.3.4 FRANCE
                        12.3.4.1 Rising use of isostatic pressing to consolidate ceramic powders and compress graphite and other fine ceramics
             12.3.5 REST OF EUROPE
     12.4 ASIA PACIFIC 
             12.4.1 ASIA PACIFIC: RECESSION IMPACT
                        TABLE 141 ASIA PACIFIC: ISOSTATIC PRESSING MARKET, BY COUNTRY, 2019–2022 (USD MILLION)
                        TABLE 142 ASIA PACIFIC: ISOSTATIC PRESSING MARKET, BY COUNTRY, 2023–2028 (USD MILLION)
                        TABLE 143 ASIA PACIFIC: ISOSTATIC PRESSING MARKET, BY END-USER INDUSTRY, 2019–2022 (USD MILLION)
                        TABLE 144 ASIA PACIFIC: ISOSTATIC PRESSING MARKET, BY END-USER INDUSTRY, 2023–2028 (USD MILLION)
             12.4.2 CHINA
                        12.4.2.1 Growing demand for medical implants and devices
             12.4.3 JAPAN
                        12.4.3.1 High investments in infrastructure development
             12.4.4 SOUTH KOREA
                        12.4.4.1 Government-led investments in R&D to support local firms and foster innovation
             12.4.5 REST OF ASIA PACIFIC
     12.5 ROW 
             12.5.1 ROW: RECESSION IMPACT
                        TABLE 145 ROW: ISOSTATIC PRESSING MARKET, BY REGION, 2019–2022 (USD MILLION)
                        TABLE 146 ROW: ISOSTATIC PRESSING MARKET, BY REGION, 2023–2028 (USD MILLION)
                        TABLE 147 ROW: ISOSTATIC PRESSING MARKET, BY END-USER INDUSTRY, 2019–2022 (USD MILLION)
                        TABLE 148 ROW: ISOSTATIC PRESSING MARKET, BY END-USER INDUSTRY, 2023–2028 (USD MILLION)
             12.5.2 MIDDLE EAST & AFRICA
                        12.5.2.1 Rising partnerships and collaborations among aircraft and automobile manufacturers
             12.5.3 SOUTH AMERICA
                        12.5.3.1 Changes in import and export regulations
 
13 COMPETITIVE LANDSCAPE (Page No. - 160)
     13.1 INTRODUCTION 
             13.1.1 KEY STRATEGIES ADOPTED BY MAJOR PLAYERS
     13.2 REVENUE ANALYSIS, 2022 
     13.3 MARKET SHARE ANALYSIS, 2022 
             TABLE 149 ISOSTATIC PRESSING MARKET: DEGREE OF COMPETITION
     13.4 COMPETITIVE EVALUATION MATRIX, 2022 
             13.4.1 STARS
             13.4.2 EMERGING LEADERS
             13.4.3 PERVASIVE PLAYERS
             13.4.4 PARTICIPANTS
     13.5 STARTUPS/SMALL AND MEDIUM-SIZED ENTERPRISES (SMES) EVALUATION MATRIX, 2022 
             13.5.1 PROGRESSIVE COMPANIES
             13.5.2 RESPONSIVE COMPANIES
             13.5.3 DYNAMIC COMPANIES
             13.5.4 STARTING BLOCKS
     13.6 COMPANY FOOTPRINT 
             TABLE 150 TYPE: COMPANY FOOTPRINT
             TABLE 151 END-USER INDUSTRY: COMPANY FOOTPRINT
             TABLE 152 REGION: COMPANY FOOTPRINT
             TABLE 153 COMPANY FOOTPRINT
     13.7 COMPETITIVE BENCHMARKING 
             13.7.1 LIST OF KEY STARTUPS/SMES
                        TABLE 154 ISOSTATIC PRESSING MARKET: KEY STARTUPS/SMES
             13.7.2 TYPE: STARTUP/SME FOOTPRINT
                        TABLE 155 ISOSTATIC PRESSING MARKET: COMPETITIVE BENCHMARKING OF KEY STARTUPS/SMES, BY TYPE
             13.7.3 END-USER INDUSTRY: STARTUP/SME FOOTPRINT
                        TABLE 156 ISOSTATIC PRESSING MARKET: COMPETITIVE BENCHMARKING OF KEY STARTUPS/SMES, BY END-USER INDUSTRY
             13.7.4 REGION: STARTUP/SME FOOTPRINT
                        TABLE 157 ISOSTATIC PRESSING MARKET: COMPETITIVE BENCHMARKING OF KEY STARTUPS/SMES, BY REGION
     13.8 COMPETITIVE SCENARIOS AND TRENDS 
             13.8.1 PRODUCT LAUNCHES
                        TABLE 158 ISOSTATIC PRESSING MARKET: PRODUCT LAUNCHES, JANUARY 2021–MARCH 2023
             13.8.2 DEALS
                        TABLE 159 ISOSTATIC PRESSING MARKET: DEALS, 2021–2023
             13.8.3 OTHERS
                        TABLE 160 ISOSTATIC PRESSING MARKET: OTHERS, 2021–2023
 
14 COMPANY PROFILES (Page No. - 176)
(Business Overview, Products/Solutions/Services Offered, Recent Developments, and MnM View (Key strengths/Right to Win, Strategic Choices Made, and Weaknesses and Competitive Threats))*  
     14.1 KEY PLAYERS 
             14.1.1 KOBE STEEL, LTD.
                        TABLE 161 KOBE STEEL, LTD.: COMPANY OVERVIEW
                        TABLE 162 KOBE STEEL, LTD.: PRODUCTS/SOLUTIONS/SERVICES OFFERED
                        TABLE 163 KOBE STEEL, LTD.: DEALS
             14.1.2 BODYCOTE
                        TABLE 164 BODYCOTE: COMPANY OVERVIEW
                        TABLE 165 BODYCOTE: PRODUCTS/SOLUTIONS/SERVICES OFFERING
                        TABLE 166 BODYCOTE: OTHERS
             14.1.3 KENNAMETAL INC.
                        TABLE 167 KENNAMETAL INC.: COMPANY OVERVIEW
                        TABLE 168 KENNAMETAL INC.: PRODUCTS/SOLUTIONS/SERVICES OFFERING
             14.1.4 NIKKISO CO., LTD.
                        TABLE 169 NIKKISO CO., LTD.: COMPANY OVERVIEW
                        TABLE 170 NIKKISO CO., LTD.: PRODUCTS/SOLUTIONS/SERVICES OFFERING
             14.1.5 DORST TECHNOLOGIES GMBH & CO. KG
                        TABLE 171 DORST TECHNOLOGIES GMBH & CO. KG: COMPANY OVERVIEW
                        TABLE 172 DORST TECHNOLOGIES GMBH & CO. KG: PRODUCTS/SOLUTIONS/SERVICES OFFERED
                        TABLE 173 DORST TECHNOLOGIES GMBH & CO. KG: PRODUCT LAUNCHES
             14.1.6 AMERICAN ISOSTATIC PRESSES, INC.
                        TABLE 174 AMERICAN ISOSTATIC PRESSES, INC.: COMPANY OVERVIEW
                        TABLE 175 AMERICAN ISOSTATIC PRESSES, INC.: PRODUCTS/SOLUTIONS/SERVICES OFFERED
             14.1.7 EPSI
                        TABLE 176 EPSI: COMPANY OVERVIEW
                        TABLE 177 EPSI: PRODUCTS/SOLUTIONS/SERVICES OFFERED
             14.1.8 PRESSURE TECHNOLOGY, INC.
                        TABLE 178 PRESSURE TECHNOLOGY, INC.: COMPANY OVERVIEW
                        TABLE 179 PRESSURE TECHNOLOGY, INC.: PRODUCTS/SOLUTIONS/SERVICES OFFERED
             14.1.9 SHANXI GOLDEN KAIYUAN CO., LTD.
                        TABLE 180 SHANXI GOLDEN KAIYUAN CO., LTD.: COMPANY OVERVIEW
                        TABLE 181 SHANXI GOLDEN KAIYUAN CO., LTD.: PRODUCTS/SOLUTIONS/SERVICES OFFERED
             14.1.10 FLUITRON
                        TABLE 182 FLUITRON: COMPANY OVERVIEW
                        TABLE 183 FLUITRON: PRODUCTS/SOLUTIONS/SERVICES OFFERED
     14.2 OTHER PLAYERS 
             14.2.1 SANDVIK POWDER SOLUTIONS AB
             14.2.2 INSMART SYSTEMS
             14.2.3 TIANJIN TAIPINGYANG ULTRA-HIGH-PRESSURE EQUIPMENT
             14.2.4 ISOSTATIC PRESSING SERVICES
             14.2.5 FREY & CO. GMBH
             14.2.6 KITTYHAWK
             14.2.7 ILSHIN AUTOCLAVE CO., LTD.
             14.2.8 QUAD CITY MANUFACTURING LAB (QCML)
             14.2.9 HIPERBARIC
             14.2.10 AUBERT & DUVAL
             14.2.11 HOGANAS
             14.2.12 AEGIS TECHNOLOGY
             14.2.13 MTI CORPORATION
             14.2.14 PTC INDUSTRIES
             14.2.15 TECHFORM ADVANCED CASTING TECHNOLOGY LLC
*Details on Business Overview, Products/Solutions/Services Offered, Recent Developments, and MnM View (Key strengths/Right to Win, Strategic Choices Made, and Weaknesses and Competitive Threats) might not be captured in case of unlisted companies.  
 
15 ADJACENT AND RELATED MARKETS (Page No. - 207)
     15.1 INTRODUCTION 
     15.2 LIMITATIONS 
     15.3 3D PRINTING MARKET, BY OFFERING 
             15.3.1 INTRODUCTION
                        TABLE 184 3D PRINTING MARKET, BY OFFERING, 2019–2022 (USD MILLION)
                        TABLE 185 3D PRINTING MARKET, BY OFFERING, 2023–2028 (USD MILLION)
             15.3.2 PRINTERS
                        TABLE 186 PRINTERS: 3D PRINTING MARKET, BY TYPE, 2019–2022 (USD MILLION)
                        TABLE 187 PRINTERS: 3D PRINTING MARKET, BY TYPE, 2023–2028 (USD MILLION)
                        TABLE 188 PRINTERS: 3D PRINTING MARKET, BY APPLICATION, 2019–2022 (USD MILLION)
                        TABLE 189 PRINTERS: 3D PRINTING MARKET, BY APPLICATION, 2023–2028 (USD MILLION)
                        TABLE 190 PRINTERS: 3D PRINTING MARKET, BY VERTICAL, 2019–2022 (USD MILLION)
                        TABLE 191 PRINTERS: 3D PRINTING MARKET, BY VERTICAL, 2023–2028 (USD MILLION)
                        TABLE 192 PRINTERS: 3D PRINTING MARKET, BY REGION, 2019–2022 (USD MILLION)
                        TABLE 193 PRINTERS: 3D PRINTING MARKET, BY REGION, 2023–2028 (USD MILLION)
                        15.3.2.1 Desktop printers
                        15.3.2.2 Industrial printers
             15.3.3 MATERIALS
                        TABLE 194 SOFTWARE: 3D PRINTING MARKET, BY APPLICATION, 2019–2022 (USD MILLION)
                        TABLE 195 SOFTWARE: 3D PRINTING MARKET, BY APPLICATION, 2023–2028 (USD MILLION)
                        TABLE 196 SOFTWARE: 3D PRINTING MARKET, BY VERTICAL, 2019–2022 (USD MILLION)
                        TABLE 197 SOFTWARE: 3D PRINTING MARKET, BY VERTICAL, 2023–2028 (USD MILLION)
                        TABLE 198 SOFTWARE: 3D PRINTING MARKET, BY REGION, 2019–2022 (USD MILLION)
                        TABLE 199 SOFTWARE: 3D PRINTING MARKET, BY REGION, 2023–2028 (USD MILLION)
                        TABLE 200 MATERIALS: 3D PRINTING MARKET, BY TYPE, 2019–2022 (USD MILLION)
                        TABLE 201 MATERIALS: 3D PRINTING MARKET, BY TYPE, 2023–2028 (USD MILLION)
                        15.3.3.1 Plastics
                                     TABLE 202 PLASTICS: 3D PRINTING MARKET, BY TYPE, 2019–2022 (USD MILLION)
                                     TABLE 203 PLASTICS: 3D PRINTING MARKET, BY TYPE, 2023–2028 (USD MILLION)
                                     15.3.3.1.1 Thermoplastics
                                                    TABLE 204 THERMOPLASTICS: 3D PRINTING MARKET, BY TYPE, 2019–2022 (USD MILLION)
                                                    TABLE 205 THERMOPLASTICS: 3D PRINTING MARKET, BY TYPE, 2023–2028 (USD MILLION)
                                                    15.3.3.1.1.1 Acrylonitrile butadiene styrene (ABS)
                                                                     TABLE 206 TECHNICAL SPECIFICATIONS OF ABS
                                                    15.3.3.1.1.2 Polylactic acid (PLA)
                                                                     TABLE 207 TECHNICAL SPECIFICATIONS OF PLA
                                                    15.3.3.1.1.3 Nylon
                                                                     TABLE 208 TECHNICAL SPECIFICATIONS OF NYLON
                                                    15.3.3.1.1.4 Others
                                                                     TABLE 209 TECHNICAL SPECIFICATIONS OF POLYPROPYLENE
                                                                     TABLE 210 TECHNICAL SPECIFICATIONS OF POLYCARBONATE
                                                                     TABLE 211 TECHNICAL SPECIFICATIONS OF PVA
                                     15.3.3.1.2 Photopolymers
                        15.3.3.2 Metals
                                     TABLE 212 METALS: 3D PRINTING MARKET, BY TYPE, 2019–2022 (USD MILLION)
                                     TABLE 213 METALS: 3D PRINTING MARKET, BY TYPE, 2023–2028 (USD MILLION)
                                     15.3.3.2.1 Steel
                                     15.3.3.2.2 Aluminum
                                     15.3.3.2.3 Titanium
                                     15.3.3.2.4 Nickel
                                     15.3.3.2.5 Other metals
                        15.3.3.3 Ceramics
                        15.3.3.4 Other materials
                                     15.3.3.4.1 Wax
                                     15.3.3.4.2 Laywood
                                     15.3.3.4.3 Paper
                                     15.3.3.4.4 Biocompatible materials
 
                                                    15.3.3.4.5.1 Filament
                                                    15.3.3.4.5.2 Powder
                                                    15.3.3.4.5.3 Liquid
             15.3.4 SOFTWARE
                        TABLE 214 SOFTWARE: 3D PRINTING MARKET, BY APPLICATION, 2019–2022 (USD MILLION)
                        TABLE 215 SOFTWARE: 3D PRINTING MARKET, BY APPLICATION, 2023–2028 (USD MILLION)
                        TABLE 216 SOFTWARE: 3D PRINTING MARKET, BY VERTICAL, 2019–2022 (USD MILLION)
                        TABLE 217 SOFTWARE: 3D PRINTING MARKET, BY VERTICAL, 2023–2028 (USD MILLION)
                        TABLE 218 SOFTWARE: 3D PRINTING MARKET, BY REGION, 2019–2022 (USD MILLION)
                        TABLE 219 SOFTWARE: 3D PRINTING MARKET, BY REGION, 2023–2028 (USD MILLION)
                        15.3.4.1 Design
                        15.3.4.2 Inspection
                        15.3.4.3 Printing
                        15.3.4.4 Scanning
             15.3.5 SERVICES
                        TABLE 220 SERVICES: 3D PRINTING MARKET, BY TYPE, 2019–2022 (USD MILLION)
                        TABLE 221 SERVICES: 3D PRINTING MARKET, BY TYPE, 2023–2028 (USD MILLION)
                        TABLE 222 SERVICES: 3D PRINTING MARKET, BY APPLICATION, 2019–2022 (USD MILLION)
                        TABLE 223 SERVICES: 3D PRINTING MARKET, BY APPLICATION, 2023–2028 (USD MILLION)
                        TABLE 224 SERVICES: 3D PRINTING MARKET, BY VERTICAL, 2019–2022 (USD MILLION)
                        TABLE 225 SERVICES: 3D PRINTING MARKET, BY VERTICAL, 2023–2028 (USD MILLION)
                        TABLE 226 SERVICES: 3D PRINTING MARKET, BY REGION, 2019–2022 (USD MILLION)
                        TABLE 227 SERVICES: 3D PRINTING MARKET, BY REGION, 2023–2028 (USD MILLION)
 
16 APPENDIX (Page No. - 233)
     16.1 INSIGHTS FROM INDUSTRY EXPERTS 
     16.2 DISCUSSION GUIDE 
     16.3 KNOWLEDGESTORE: MARKETSANDMARKETS’ SUBSCRIPTION PORTAL 
     16.4 CUSTOMIZATION OPTIONS 
     16.5 RELATED REPORTS 
     16.6 AUTHOR DETAILS 


The study involves four major activities for estimating the size of the Isostatic pressing market. Exhaustive secondary research has been conducted to collect information related to the market. The next step is to validate these findings and assumptions related to the market size with industry experts across the value chain through primary research. Both top-down and bottom-up approaches have been employed to estimate the overall size of the Isostatic pressing market. After that, market breakdown and data triangulation procedures were used to determine the extent of different segments and subsegments of the market.

Secondary Research

Secondary sources for this research study included corporate filings (such as annual reports, investor presentations, and financial statements); trade, business, and professional associations; white papers; certified publications; articles by recognized authors; directories; and databases. The secondary data has been collected and analyzed to determine the overall market size, further validated through primary research.

Primary Research

Extensive primary research has been conducted after gaining knowledge about the current scenario of the Isostatic pressing market through secondary research. Several primary interviews have been conducted with experts from the demand and supply sides across four major regions—Americas, Europe, Asia Pacific, and RoW. This primary data has been collected through questionnaires, emails, and telephonic interviews.

Isostatic Pressing Market Size, and Share

To know about the assumptions considered for the study, download the pdf brochure

Market Size Estimation

In the complete market engineering process, top-down and bottom-up approaches and several data triangulation methods have been implemented to estimate and validate the size of the Isostatic pressing market and other dependent submarkets listed in this report.

  • The key players in the industry and markets have been identified through extensive secondary research.
  • The supply chain of the industry and the market size, in terms of value, have been determined through primary and secondary research.
  • All percentage shares, splits, and breakdowns have been determined using secondary sources and verified through primary sources.

Isostatic Pressing Market: Top-Down Approach

  • In the top-down approach, the overall market size has been used to estimate the size of the individual markets (mentioned in the market segmentation) through percentage splits obtained from secondary and primary research.
  •  For calculating the Isostatic pressing market segments, the market size obtained by implementing the bottom-up approach has been used to implement the top-down approach, which was later confirmed with the primary respondents across different regions.
  • The bottom-up approach has also been implemented for the data extracted from secondary research to validate the market size of various segments.
  • Each company's market share has been estimated to verify the revenue shares used earlier in the bottom-up approach. With the help of data triangulation and validation of data through primaries, the size of the overall Isostatic pressing and each market have been determined and confirmed in this study.

Isostatic Pressing Market Size, and Top-Down Approach

Data Triangulation

After arriving at the overall market size, the total market has been split into several segments. The market breakdown and data triangulation procedures have been employed wherever applicable to complete the overall market engineering process and arrive at exact statistics for all segments. The data was then triangulated by studying various factors and trends from both the demand and supply sides. The market has also been validated using both top-down and bottom-up approaches.

Market Definition

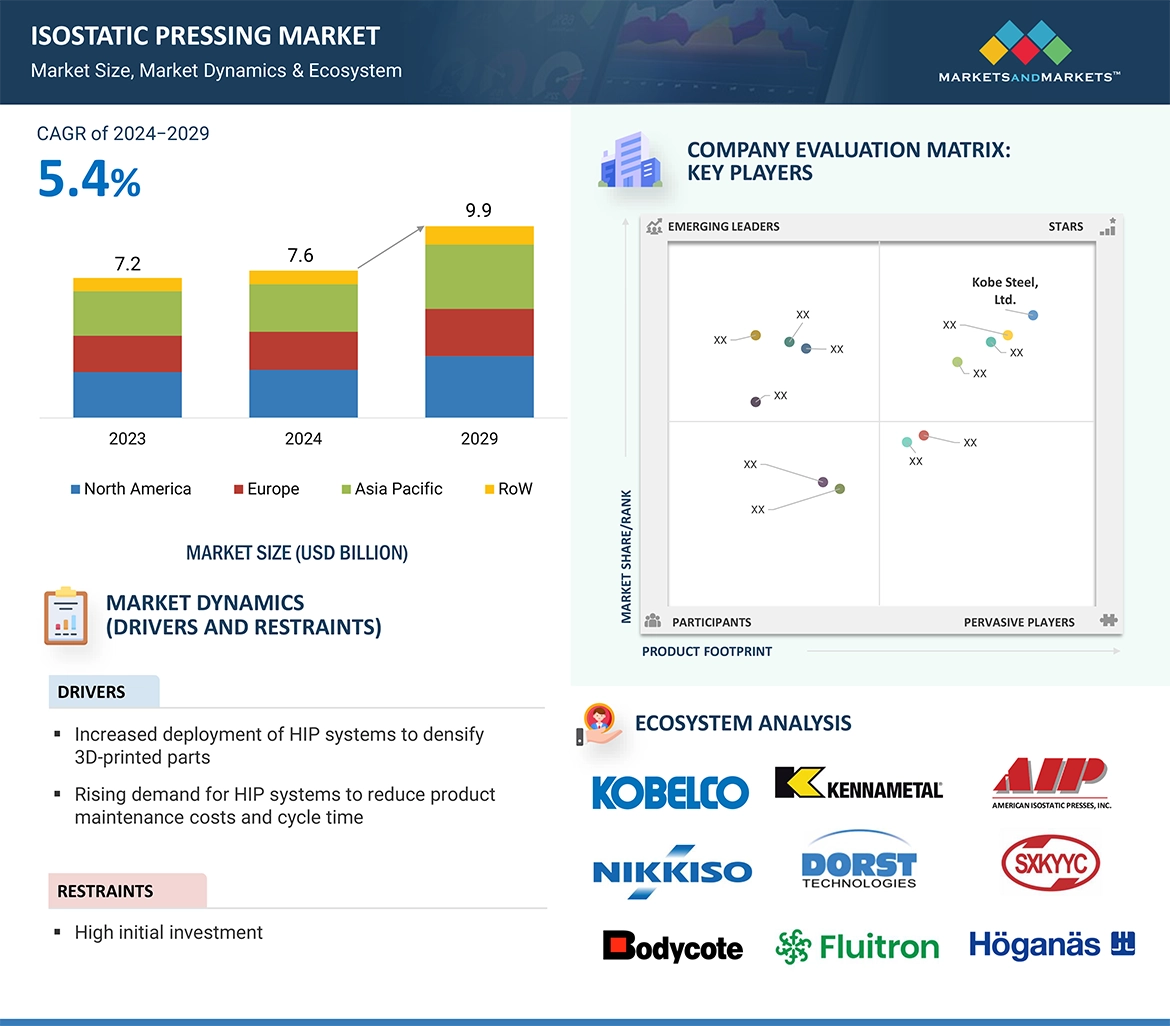
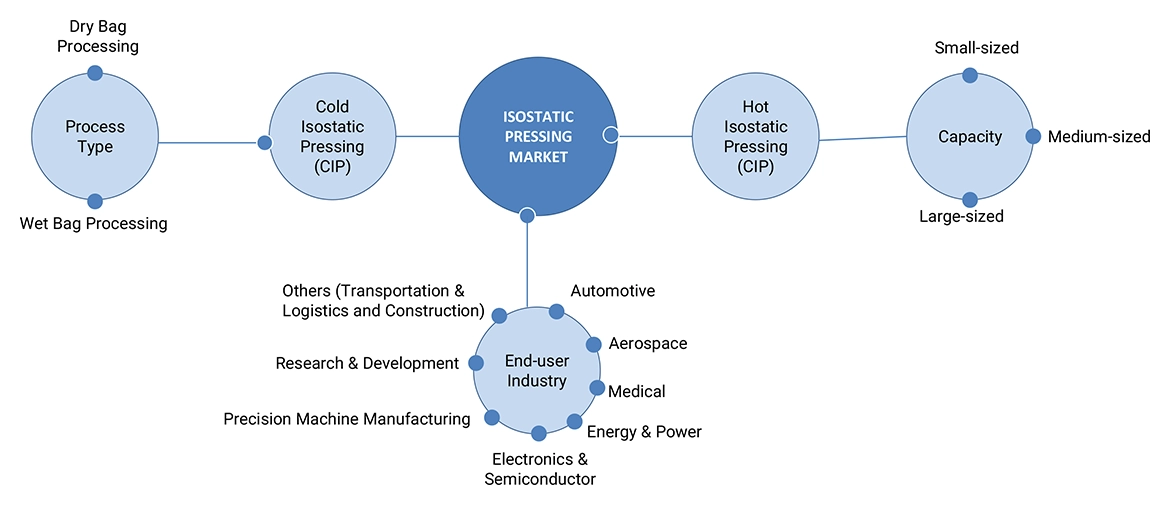
Isostatic pressing is a powder metallurgy-based process in which equal pressure is applied on powdered materials, such as metals, alloys, or ceramics, in all directions to achieve maximum uniformity of density and microstructure without the geometric limitations of uniaxial pressing. Isostatic pressing is categorized into two types: hot isostatic pressing (HIP) and cold isostatic pressing (CIP). The HIP system processes materials using the synergistic effects of temperature and pressure. The HIP is part of the powder metrology process for pressure-assisted brazing and fabrication of metal composites. Manufacturing companies are extensively installing HIP systems to enhance their working efficiency. Cold isostatic pressing (CIP) is a powder-forming technology with uniform pressure to compress powdered materials into various shapes, mainly at room temperature. The CIP system is widely used in ceramic and powder metallurgy as an effective forming method. In the CIP system, a mold is placed into a chamber filled with a working fluid, usually water, with a corrosion inhibitor that is pressurized using an external pump.

The isostatic pressing market is consolidated, with a few players holding a major market share. The companies in the isostatic pressing ecosystem are highly focused on strengthening their positions and increasing their market shares. Kobe Steel, Ltd. (Japan), Bodycote (UK), Kennametal, Inc. (US), Nikkiso., Ltd. (Japan), DORST Technologies GmbH & Co. KG (Germany), American Isostatic Presses, Inc (US), EPSI (US), Pressure Technology, Inc. (US), Shanxi Golden Kaiyuan Co., Ltd. (China) are among a few key companies in this market.

Key Stakeholders

  • Original equipment manufacturers (OEMs)
  • Providers of technology solutions
  • Research institutes
  • Market research and consulting firms
  • Forums, alliances, and associations related to Isostatic pressing
  • Technology investors
  • Governments and financial institutions
  • Analysts and strategic business planners
  • Existing end users and prospective ones

Report Objectives:

  • To describe and forecast the Isostatic pressing market in terms of value based on offerings, type, process types, capacity, and industry.
  • To describe and forecast the Isostatic pressing market size in terms of value for 4 main regions, namely, North America, Europe, Asia Pacific, and the Rest of the World (RoW)
  • To provide detailed information regarding the drivers, restraints, opportunities, and challenges influencing the growth of the isostatic pressing market
  • To provide a detailed overview of the supply chain of the s ecosystem
  • To analyze opportunities in the market for various stakeholders by identifying the high-growth segments of the market
  • To analyze the probable impact of the recession on the market in future
  • To benchmark the market players using the proprietary company evaluation matrix framework, which analyzes the market players on various parameters within the broad categories of market ranking/share and product portfolio.
  • To analyze competitive developments such as acquisitions, product launches, partnerships, expansions, and collaborations undertaken in the Isostatic pressing market

Available Customization

With the given market data, MarketsandMarkets offers customizations according to the company's specific needs. The following customization options are available for this report:

Company Information:

  • Detailed analysis and profiling of additional five market players
Custom Market Research Services

We will customize the research for you, in case the report listed above does not meet with your exact requirements. Our custom research will comprehensively cover the business information you require to help you arrive at strategic and profitable business decisions.

Request Customization

Instant Answers with GPT - Ask Now!

Ask real questions. Get complete answers !
Report Code
SE 6684
Published ON
Jun, 2023
Choose License Type
BUY NOW
  • SHARE
X
Request Customization
Speak to Analyst
Speak to Analyst
OR FACE-TO-FACE MEETING
PERSONALIZE THIS RESEARCH
  • Triangulate with your Own Data
  • Get Data as per your Format and Definition
  • Gain a Deeper Dive on a Specific Application, Geography, Customer or Competitor
  • Any level of Personalization
REQUEST A FREE CUSTOMIZATION
LET US HELP YOU!
  • What are the Known and Unknown Adjacencies Impacting the Isostatic Pressing Market
  • What will your New Revenue Sources be?
  • Who will be your Top Customer; what will make them switch?
  • Defend your Market Share or Win Competitors
  • Get a Scorecard for Target Partners
CUSTOMIZED WORKSHOP REQUEST
+1-888-600-6441
  • Call Us
  • +1-888-600-6441 (Corporate office hours)
  • +1-888-600-6441 (US/Can toll free)
  • +44-800-368-9399 (UK office hours)
CONNECT WITH US
ABOUT TRUST ONLINE
©2024 MarketsandMarkets Research Private Ltd. All rights reserved
DMCA.com Protection Status Website Feedback