Inertial Navigation Systems Market Size, Share & Analysis

Report Code AS 2417
Published in May, 2024, By MarketsandMarkets™
Download PDF

Choose License Type

Buy Report Now Inquire Before Buying

Inertial Navigation Systems Market by Grade (Marine, Navigation, Tactical, Space, Commercial), Technology (Mechanical, Ring Laser, Fiber Optic, MEMS), Platform, End User (Commercial and Defence), Component and Region - Global Forecast to 2029

Overview

The Inertial Navigation Systems Market is estimated to be USD 10.3 billion in 2024 and is projected to reach USD 13.5 billion by 2029, at a CAGR of 5.6% from 2024 to 2029. The market is driven by factors such as increasing industry demand, advancements in sensor technology, the rise of autonomous technologies, and the need for reliable navigation in GPS-denied environments.

Attractive Opportunities in the Inertial Navigation Systems Market

Asia Pacific

Asia Pacific is expected to hold the highest CAGR during the forecast period, driven by the rapid industrialization and urbanization in countries like China and India propel demand for Inertial Navigation System.

The growth of the market can be attributed to the increasing development in the inertial navigation sensor technologies like MEMS.

The market growth in North America can be anticipated by increasing government initiatives like the U.S. Department of Defense's Next Generation Air Dominance (NGAD) program, requiring advanced navigation systems for fighter jets. clean renewable energy.

New product launches and contracts are expected to offer lucrative opportunities to market players in the next five years.

Based on grade, the navigation grade segment is estimated to grow from USD 2.9 billion in 2024 to USD 3.6 billion by 2029, at a CAGR of 4.3%

Global Inertial Navigation Systems Market Dynamics

Driver: Growing space exploration missions and Increasing procurement of commercial aircraft

Space exploration requires precise and reliable navigation technology to ensure the accurate positioning, orientation, and velocity of spacecraft and satellites. Advanced inertial navigation systems play a critical role in guiding space vehicles, enabling them to navigate complex trajectories and maintain stability in space environments. These systems utilize accelerometers, gyroscopes, and other sensors to provide continuous and accurate navigation data essential for the success of space missions. The ongoing evolution and growing scope of space exploration boosts the development and deployment of advanced inertial navigation systems. The increasing investment in space exploration by space agencies and private companies further raises the demand for inertial navigation systems to ensure functionality under extreme space conditions, such as high radiation levels, vacuum, and severe temperature fluctuations.The increase in new commercial aircraft orders worldwide is one of the key factors driving the growth of the inertial navigation systems market. Inertial navigation systems play a significant role in aircraft by providing continuous, precise location and directional data crucial for flight control systems and navigation in areas where satellite navigation signals may be unavailable. The integration of GPS with inertial sensors to create hybrid systems enhances the efficiency of inertial navigation systems in commercial aviation. These hybrid systems offer improved accuracy and reliability, reducing the risk of signal loss or interference and enhancing safety and operational efficiency. The dependence on inertial navigation systems is especially crucial due to the rigorous safety and regulatory requirements in aviation. Increasing procurement of commercial aircraft and modernization of airlines drive the demand for advanced inertial navigation systems to ensure accurate navigation and safety.

Restraints: Complex integration of inertial navigation systems and High development costs

The complex integration of inertial navigation systems can be a significant market restraint. Integrating these systems into broader platforms involves extensive technical challenges due to the need to synchronize the inertial navigation systems with other navigational and operational systems such as GPS, radar, and avionics systems. The complexity of these systems increases particularly in advanced applications such as aerospace, defense, and autonomous vehicles, where high levels of accuracy and reliability are mandatory. This integration of inertial navigation systems requires advanced hardware architecture that can accommodate and process inputs from diverse sensors and advanced software algorithms that can execute sensor fusion effectively. Sensor fusion involves combining data from various sources to produce accurate and dependable navigation outputs.The manufacturing and development of inertial navigation systems involves advanced and costly components such as gyroscopes and accelerometers, which are precision-engineered to deliver high accuracy and reliability. These components, particularly when based on ring laser gyroscopes (RLG) or fiber optics gyroscopes (FOG), are expensive due to the complex manufacturing processes and the high-quality materials required. The integration of these systems into platforms requires additional expenditure. This includes the cost of integrating hardware, calibrating sensors to ensure accuracy, and developing the necessary software algorithms for sensor fusion and error correction. The extensive testing and certification processes required to meet safety and regulatory standards further increase the initial cost of the system. Such high initial costs can be a barrier, especially for small and medium enterprises (SMEs) or industries where cost efficiency is a priority.


Opportunity: The trend of driverless cars and Innovations in sensor design and data processing algorithms

Driverless cars are robotic vehicles capable of traveling without human intervention. Advancements in sensor technology and machine learning are driving demand for commercial driverless vehicles. Companies such as Tesla, Google, Ford, and BMW are actively involved in developing driverless technology for commercial vehicles. Inertial navigation technologies, which use accelerometers and gyroscopes to calculate positional and directional data without reliance on external signals, are critical in ensuring the accuracy and reliability of navigation in autonomous vehicles. Driverless cars require advanced sensor fusion to integrate data from various sources for precise localization and navigation. Advanced inertial navigation systems can provide high integrity and continuous positioning capabilities, especially when GPS signals are unavailable or unreliable, such as in tunnels, urban canyons, or environments with significant electronic interference. These systems enhance the overall safety architecture of autonomous driving technologies by independently verifying vehicle position, velocity, and attitude.Technological advancements in sensor design, computational methods, and data integration technologies represent significant opportunities for the inertial navigation systems market. Key developments include improvements in MEMS technology, which have significantly reduced the size, cost, and power consumption of inertial sensors while enhancing performance. This makes inertial navigation systems more accessible for applications beyond traditional aerospace and defense sectors, extending into automotive, consumer electronics, and unmanned systems. Similarly, advancements in algorithmic techniques for sensor fusion and error correction increase the accuracy and reliability of inertial navigation system outputs. Techniques such as Kalman filtering and other advanced estimation methods effectively integrate inertial data with inputs from other navigation systems, including GPS, LIDAR, or visual odometry.

Challenges: Calibration and alignment issues

Calibration and alignment issues are significant challenges in the market for inertial navigation systems. These systems rely on precise measurements from accelerometers and gyroscopes to determine position, orientation, and velocity without external references. However, the accuracy of these measurements depends on the proper calibration and alignment of the sensors with respect to the vehicle or platform’s reference frame. Misalignment or improper calibration can lead to errors in the computed position and orientation data, which accumulate over time, leading to drift. This drift is particularly problematic in applications requiring high precision over extended periods or in environments where GPS updates are unavailable to correct inertial errors. The calibration process is complex and must be repeatedly conducted over the lifecycle of the device to ensure accuracy, as sensor performance can degrade due to environmental factors such as temperature fluctuations, mechanical stress, and aging. Alignment must also be accurately managed during the installation and operational phases to ensure the sensors maintain their orientation relative to the navigational frame of reference. These calibration and alignment challenges impose additional costs and technical barriers, potentially limiting the deployment of inertial navigation systems in applications where cost-efficiency and maintenance simplicity are prominent.

Global Inertial Navigation Systems Market Ecosystem Analysis

Inertial Navigation Systems Market Ecosystem In the inertial navigation systems market ecosystem, key stakeholders range from manufacturers and suppliers of inertial navigation systems to end consumers. Influential forces shaping the industry include investors, funders, academic researchers, integrators, service providers, and licensing authorities. This intricate network of participants collaboratively drives market dynamics, innovation, and strategic decisions, highlighting the complexity and vitality of the inertial navigation systems sector.


Based on the platform, the aircraft segment is estimated to lead the inertial navigation systems market in 2024

Based on the platform, the inertial navigation systems market has been segmented broadly into Aircraft, Missiles, Marine, Space launch Vehicles, Military Armored Vehicles, Unmanned Aerial Vehicles, Unmanned Ground Vehicles, Unmanned Marine Vehicles. Here aircraft is leading this segment in 2024. The aircraft segment in inertial navigation systems is the increasing demand for precise navigation solutions in aviation. Aircraft rely heavily on accurate inertial navigation systems for safe and efficient navigation, especially during flights where GPS signals may be unreliable or unavailable. The growing air traffic and expansion of commercial aviation further drive the need for advanced navigation systems.

Based on the end user, the Defense segment is estimated to lead the inertial navigation systems market in 2024

Based on the end user, the inertial navigation systems market has been segmented broadly into commercial & government and defense. Here defense is leading this segment in 2024. Defense agencies rely heavily on precise INS for various critical tasks like missile guidance, reconnaissance, and navigating challenging environments. As modern warfare becomes more complex, the need for reliable navigation systems in GPS-denied areas becomes paramount. As defense budgets allocate resources to enhance navigation capabilities, the INS market experiences sustained growth within the defense sector.

North America region holds the largest share of the Inertial Navigation Systems Market.

Based on region, the inertial navigation systems market has been segmented into North America, Europe, Asia Pacific the Middle East, and the Rest of the world. The North American inertial navigation systems market covers the US and Canada. The region is experiencing significant growth, driven by several factors. Increasing demand from military applications, particularly in defense platforms such as aircraft, missiles, and submarines, creates a need for advanced inertial navigation systems for navigation, guidance, and targeting. The aerospace industry's demand for precise and dependable navigation systems in commercial and military aircraft further boosts market expansion, leveraging the expertise of leading aerospace companies such as Teledyne Technologies Inc. (US), Collins Aerospace (US), and Northrop Grumman(US).


Recent Developments of Inertial Navigation Systems Market industry

  • In June 2023, Wisk Aero (US), a leading advanced air mobility (AAM) company, entered into a contract with Safran Electronics & Defense to supply SkyNaute inertial navigation systems for its Generation 6 autonomous, all-electric air taxi.
  • In December 2023, Northrop Grumman secured a contract to procure 12 items to support the WSN-7 ship’s inertial navigation system. The contract was awarded by the Naval Supply Systems Command Weapon Systems Support (US). The deal was valued at USD 12.5 million and is expected to be completed by June 2028.

Key Market Players

Want to explore hidden markets that can drive new revenue in Inertial Navigation Systems Market?

Scope of the Report

Report Attribute Details
Estimated Market Size USD 10.3 billion in 2024
Projected Market Size USD 13.5 billion by 2029
Desiccant Dehumidifier Market Growth Rate at a CAGR of 5.6%
Market size available for years 2020-2029
Base year considered 2023
Forecast period 2024-2029
Forecast units Value (USD)
Segments Covered By Platform, Component, Technology, Grade and End User
Geographies covered North America, Europe, Asia Pacific, the Middle East, and Rest of the World
Companies covered Safran Electronics & Defense (France), Northrop Grumman (US), Teledyne Technologies Inc. (US), Collins Aerospace (US), Honeywell International Inc. (US), Thales (France), General Electric Company (US), Trimble Inc. (US), L3Harris Technologies, Inc. (US),


Key Questions Addressed by the Report

What are the drivers and opportunities for the Inertial Navigation Systems market?
The trend of driverless cars, increasing deployment of unmanned marine vehicles, and innovations in sensor design and data processing algorithms are some of the drivers for the Inertial Navigation Systems market.
Which region is expected to hold the largest share in the next five years?
The market in the Asia Pacific region is projected to account for the largest share from 2024 to 2029, showcasing strong demand for Inertial navigation systems solutions in the region.
What is the CAGR of the Inertial Navigation Systems Market?
The CAGR of the Inertial Navigation Systems Market is 5.6%.
Which segment shows the highest CAGR of the Inertial Navigation Systems Market?
The Fiber Optic Gyro (FOG) by Technology shows the highest growth rate during the forecasted year for the Inertial Navigation Systems Market.
Which are the major companies in the Inertial Navigation Systems market? What are their major strategies to strengthen their market presence?
Some of the key players in the Inertial Navigation Systems market are Safran Electronics & Defense (France), Northrop Grumman (US), Teledyne Technologies Inc. (US), Collins Aerospace (US), Honeywell International Inc. (US), and others. These companies have secured Inertial Navigation Systems contracts in the last few years.


Personalize This Research

  • Triangulate with your Own Data
  • Get Data as per your Format and Definition
  • Gain a Deeper Dive on a Specific Application, Geography, Customer or Competitor
  • Any level of Personalization
Request A Free Customisation

Let Us Help You

  • What are the Known and Unknown Adjacencies Impacting the Inertial Navigation Systems Market
  • What will your New Revenue Sources be?
  • Who will be your Top Customer; what will make them switch?
  • Defend your Market Share or Win Competitors
  • Get a Scorecard for Target Partners
Customized Workshop Request

Table of Contents

Exclusive indicates content/data unique to MarketsandMarkets and not available with any competitors.

TITLE
PAGE NO
INTRODUCTION
27
RESEARCH METHODOLOGY
32
EXECUTIVE SUMMARY
42
PREMIUM INSIGHTS
46
MARKET OVERVIEW
49
  • 5.1 INTRODUCTION
  • 5.2 MARKET DYNAMICS
    DRIVERS
    - Rising space exploration missions
    - Increasing procurement of commercial aircraft
    - Escalating demand for precise navigation systems
    - Growing adoption of missiles due to geopolitical instabilities
    RESTRAINTS
    - Complex integration of inertial navigation systems
    - High development costs
    OPPORTUNITIES
    - Trend of driverless cars
    - Increasing deployment of unmanned maritime vehicles
    - Innovations in sensor design and data processing algorithms
    CHALLENGES
    - Calibration and alignment issues
    - High initialization time
  • 5.3 VALUE CHAIN ANALYSIS
  • 5.4 TRENDS AND DISRUPTIONS IMPACTING CUSTOMERS’ BUSINESSES
  • 5.5 CASE STUDY ANALYSIS
    HONEYWELL’S LASEREF INERTIAL REFERENCE SYSTEM
    SBG SYSTEMS’ ELLIPSE-D INERTIAL NAVIGATION SYSTEM
    ADVANCED NAVIGATION’S BOREAS DIGITAL FOG TECHNOLOGY
  • 5.6 PRICING ANALYSIS
    INDICATIVE PRICING ANALYSIS, BY TECHNOLOGY
    INDICATIVE PRICING ANALYSIS, BY REGION
  • 5.7 ECOSYSTEM ANALYSIS
    PROMINENT COMPANIES
    PRIVATE AND SMALL ENTERPRISES
    END USERS
  • 5.8 TRADE ANALYSIS
  • 5.9 KEY CONFERENCES AND EVENTS, 2024–2025
  • 5.10 REGULATORY LANDSCAPE
  • 5.11 KEY STAKEHOLDERS AND BUYING CRITERIA
    KEY STAKEHOLDERS IN BUYING PROCESS
    BUYING CRITERIA
  • 5.12 TECHNOLOGY ANALYSIS
    KEY TECHNOLOGY
    - Sensor fusion algorithms
    - Optical gyroscopes
    ADJACENT TECHNOLOGY
    - Global navigation satellite systems
    - Barometric altimeters
  • 5.13 TECHNOLOGY ROADMAP
  • 5.14 OPERATIONAL DATA
  • 5.15 BILL OF MATERIALS
  • 5.16 TOTAL COST OF OWNERSHIP
  • 5.17 BUSINESS MODELS
    DIRECT SALE MODEL
    SERVICE MODEL
  • 5.18 INVESTMENT AND FUNDING SCENARIO
INDUSTRY TRENDS
76
  • 6.1 INTRODUCTION
  • 6.2 TECHNOLOGY TRENDS
    ADVANCED MICROELECTROMECHANICAL SYSTEM
    GNSS-AIDED INERTIAL NAVIGATION SYSTEM
    QUANTUM SENSING TECHNOLOGY
    MINIATURIZATION AND LOW POWER CONSUMPTION
    HIGH-END INERTIAL NAVIGATION SYSTEM
    - Ring laser gyro
    - Fiber optic gyro
  • 6.3 IMPACT OF MEGATRENDS
    ARTIFICIAL INTELLIGENCE AND MACHINE LEARNING
    MODERN CALIBRATION TECHNIQUES
  • 6.4 PATENT ANALYSIS
INERTIAL NAVIGATION SYSTEMS MARKET, BY PLATFORM
83
  • 7.1 INTRODUCTION
  • 7.2 AIRCRAFT
    INCREASING AUTONOMY IN AIRCRAFT NAVIGATION TO DRIVE GROWTH
    FIXED-WING
    - Commercial aircraft
    - Military aircraft
    ROTARY-WING
    - Military helicopters
    - Civil helicopters
  • 7.3 MISSILES
    NEED FOR PRECISION STRIKE CAPABILITIES AGAINST TIME-SENSITIVE TARGETS TO DRIVE GROWTH
    BALLISTIC MISSILES
    CRUISE MISSILES
  • 7.4 SPACE LAUNCH VEHICLES
    RISING SPACE EXPLORATION ACTIVITIES TO DRIVE GROWTH
  • 7.5 MARINE VESSELS
    EMPHASIS ON OPERATIONAL EFFICIENCY TO DRIVE GROWTH
    MERCHANT SHIPS
    NAVAL SHIPS
  • 7.6 MILITARY ARMORED VEHICLES
    INCREASING ADOPTION OF NAVIGATION SYSTEMS IN COMBAT OPERATIONS TO DRIVE GROWTH
    MAIN BATTLE TANKS
    MILITARY COMBAT VEHICLES
  • 7.7 UNMANNED AERIAL VEHICLES
    SURGE IN R&D INVESTMENTS IN DEFENSE INDUSTRY TO DRIVE GROWTH
    ENTERPRISE UNMANNED AERIAL VEHICLES
    TACTICAL UNMANNED AERIAL VEHICLES
  • 7.8 UNMANNED GROUND VEHICLES
    ESCALATING DEMAND FOR AUTONOMOUS SYSTEMS TO AUGMENT HUMAN CAPABILITIES TO DRIVE GROWTH
    COMMERCIAL UNMANNED GROUND VEHICLES
    MILITARY UNMANNED GROUND VEHICLES
  • 7.9 UNMANNED MARITIME VEHICLES
    NEED FOR AUTONOMOUS MARINE OPERATIONS TO DRIVE GROWTH
    REMOTELY OPERATED VEHICLES
    AUTONOMOUS UNDERWATER VEHICLES
    UNMANNED SURFACE VEHICLES
INERTIAL NAVIGATION SYSTEMS MARKET, BY COMPONENT
101
  • 8.1 INTRODUCTION
  • 8.2 ACCELEROMETERS
    INTEGRATION OF INERTIAL NAVIGATION SYSTEMS INTO UNMANNED VEHICLES TO DRIVE GROWTH
  • 8.3 GYROSCOPES
    INCREASING DEMAND FOR AUTONOMOUS NAVIGATION SOLUTIONS TO DRIVE GROWTH
  • 8.4 ALGORITHMS & PROCESSORS
    RISING INVESTMENTS IN RESEARCH AND DEVELOPMENT TO DRIVE GROWTH
INERTIAL NAVIGATION SYSTEMS MARKET, BY TECHNOLOGY
104
  • 9.1 INTRODUCTION
  • 9.2 MECHANICAL GYRO
    RESISTANCE TO ENVIRONMENTAL FACTORS TO DRIVE GROWTH
  • 9.3 RING LASER GYRO (RLG)
    CONTINUOUS ADVANCEMENTS IN LASER TECHNOLOGY TO DRIVE GROWTH
  • 9.4 FIBER OPTIC GYRO (FOG)
    INNOVATIONS IN FIBER OPTIC TECHNOLOGY AND MANUFACTURING PROCESSES TO DRIVE GROWTH
  • 9.5 MICROELECTROMECHANICAL SYSTEM (MEMS)
    EMERGENCE OF ADVANCED FABRICATION TECHNOLOGIES TO DRIVE GROWTH
  • 9.6 OTHER TECHNOLOGIES
INERTIAL NAVIGATION SYSTEMS MARKET, BY GRADE
108
  • 10.1 INTRODUCTION
  • 10.2 MARINE
    COMPLIANCE WITH REGULATORY REQUIREMENTS AND INDUSTRY STANDARDS TO DRIVE GROWTH
  • 10.3 NAVIGATION
    NEED FOR RELIABLE NAVIGATION SOLUTIONS IN COMPLEX ENVIRONMENTS TO DRIVE GROWTH
  • 10.4 TACTICAL
    STRINGENT PERFORMANCE REQUIREMENTS TO DRIVE GROWTH
  • 10.5 SPACE
    CRITICALITY OF SPACE MISSIONS TO DRIVE GROWTH
  • 10.6 COMMERCIAL
    TREND TOWARD AUTOMATION TO DRIVE GROWTH
INERTIAL NAVIGATION SYSTEMS MARKET, BY END USER
112
  • 11.1 INTRODUCTION
  • 11.2 COMMERCIAL & GOVERNMENT
    ADVANCEMENTS IN SENSOR TECHNOLOGY AND INTEGRATION CAPABILITIES TO DRIVE GROWTH
  • 11.3 DEFENSE
    NEED FOR ACCURATE POSITIONING, NAVIGATION, AND GUIDANCE IN MODERN WARFARE TO DRIVE GROWTH
INERTIAL NAVIGATION SYSTEMS MARKET, BY REGION
115
  • 12.1 INTRODUCTION
  • 12.2 REGIONAL RECESSION IMPACT ANALYSIS
  • 12.3 NORTH AMERICA
    RECESSION IMPACT ANALYSIS
    PESTLE ANALYSIS
    US
    - Need for precision navigation and targeting systems to drive growth
    CANADA
    - Shift toward self-driving cars to drive growth
  • 12.4 ASIA PACIFIC
    RECESSION IMPACT ANALYSIS
    PESTLE ANALYSIS
    CHINA
    - Rising production of high-performance inertial navigation systems to drive growth
    INDIA
    - Indigenous development of inertial navigation systems to drive growth
    JAPAN
    - Ongoing research and development of advanced navigation technologies to drive growth
    SOUTH KOREA
    - Increasing demand for inertial navigation systems from defense sector to drive growth
    TAIWAN
    - Government incentives for domestic production to drive growth
    REST OF ASIA PACIFIC
  • 12.5 EUROPE
    RECESSION IMPACT ANALYSIS
    PESTLE ANALYSIS
    UK
    - Continuous technological advancements in inertial navigation systems to drive growth
    GERMANY
    - Ongoing developments by iMAR Navigation to drive growth
    FRANCE
    - Collaborations between industry leaders to drive growth
    ITALY
    - Increasing development and production of advanced navigation systems to drive growth
    RUSSIA
    - Focus on developing cutting-edge navigation technologies to drive growth
    REST OF EUROPE
  • 12.6 MIDDLE EAST
    RECESSION IMPACT ANALYSIS
    PESTLE ANALYSIS
    GULF COOPERATION COUNCIL (GCC)
    - UAE
    - Saudi Arabia
    REST OF MIDDLE EAST
  • 12.7 REST OF THE WORLD
    RECESSION IMPACT ANALYSIS
    PESTLE ANALYSIS
    LATIN AMERICA
    - Untapped market potential to drive growth
    AFRICA
    - Surge in demand for precise navigation solutions to drive growth
COMPETITIVE LANDSCAPE
183
  • 13.1 OVERVIEW
  • 13.2 KEY PLAYER STRATEGIES/RIGHT TO WIN, 2020–2024
  • 13.3 RANKING ANALYSIS, 2023
  • 13.4 REVENUE ANALYSIS, 2019–2023
  • 13.5 MARKET SHARE ANALYSIS
  • 13.6 COMPANY EVALUATION MATRIX: KEY PLAYERS, 2023
    STARS
    EMERGING LEADERS
    PERVASIVE PLAYERS
    PARTICIPANTS
    COMPANY FOOTPRINT
    - Company footprint
    - Technology footprint
    - End user footprint
    - Platform footprint
    - Region footprint
  • 13.7 COMPANY EVALUATION MATRIX: START-UPS/SMES, 2023
    PROGRESSIVE COMPANIES
    RESPONSIVE COMPANIES
    DYNAMIC COMPANIES
    STARTING BLOCKS
    COMPETITIVE BENCHMARKING
    - Key start-ups/SMEs
    - Competitive benchmarking of key start-ups/SMEs
  • 13.8 COMPANY VALUATION AND FINANCIAL METRICS
  • 13.9 BRAND/PRODUCT COMPARISON
  • 13.10 COMPETITIVE SCENARIO AND TRENDS
    MARKET EVALUATION FRAMEWORK
    PRODUCT LAUNCHES
    DEALS
    OTHERS
COMPANY PROFILES
204
  • 14.1 KEY PLAYERS
    SAFRAN ELECTRONICS & DEFENSE
    - Business overview
    - Products offered
    - Recent developments
    - MnM view
    NORTHROP GRUMMAN
    - Business overview
    - Products offered
    - Recent developments
    - MnM view
    TELEDYNE TECHNOLOGIES INC.
    - Business overview
    - Products offered
    - Recent developments
    - MnM view
    COLLINS AEROSPACE
    - Business overview
    - Products offered
    - Recent developments
    - MnM view
    HONEYWELL INTERNATIONAL INC.
    - Business overview
    - Products offered
    - Recent developments
    - MnM view
    THALES
    - Business overview
    - Products offered
    - Recent developments
    GENERAL ELECTRIC COMPANY
    - Business overview
    - Products offered
    TRIMBLE INC.
    - Business overview
    - Products offered
    - Recent developments
    L3HARRIS TECHNOLOGIES, INC.
    - Business overview
    - Products offered
    - Recent developments
    EXAIL TECHNOLOGIES
    - Business overview
    - Products offered
    - Recent developments
    MEMSIC SEMICONDUCTOR CO., LTD.
    - Business overview
    - Products offered
    - Recent developments
    ISRAEL AEROSPACE INDUSTRIES LTD.
    - Business overview
    - Products offered
    EMCORE CORPORATION
    - Business overview
    - Products offered
  • 14.2 OTHER PLAYERS
    VECTORNAV TECHNOLOGIES
    GLADIATOR TECHNOLOGIES
    XSENS
    SBG SYSTEMS
    INERTIAL LABS, INC.
    INNALABS
    IMAR NAVIGATION GMBH
    MICROSTRAIN BY HBK
    SILICON SENSING
    SILICON DESIGN, INC.
    SPARTON NAVIGATION AND EXPLORATION LTD.
APPENDIX
249
  • 15.1 DISCUSSION GUIDE
  • 15.2 ANNEXURE
  • 15.3 KNOWLEDGESTORE: MARKETSANDMARKETS’ SUBSCRIPTION PORTAL
  • 15.4 CUSTOMIZATION OPTIONS
  • 15.5 RELATED REPORTS
  • 15.6 AUTHOR DETAILS
LIST OF TABLES
 
  • TABLE 1 INCLUSIONS AND EXCLUSIONS
  • TABLE 2 USD EXCHANGE RATES
  • TABLE 3 MARKET SIZE ESTIMATION PROCEDURE
  • TABLE 4 INDICATIVE PRICING ANALYSIS, BY TECHNOLOGY, 2023 (USD MILLION)
  • TABLE 5 INDICATIVE PRICING ANALYSIS, BY REGION, 2023 (USD MILLION)
  • TABLE 6 ROLE OF COMPANIES IN ECOSYSTEM
  • TABLE 7 IMPORT DATA, BY COUNTRY, 2020–2023 (USD THOUSAND)
  • TABLE 8 EXPORT DATA, BY COUNTRY, 2020–2023 (USD THOUSAND)
  • TABLE 9 KEY CONFERENCES AND EVENTS, 2024–2025
  • TABLE 10 NORTH AMERICA: REGULATORY BODIES, GOVERNMENT AGENCIES, AND OTHER ORGANIZATIONS
  • TABLE 11 EUROPE: REGULATORY BODIES, GOVERNMENT AGENCIES, AND OTHER ORGANIZATIONS
  • TABLE 12 ASIA PACIFIC: REGULATORY BODIES, GOVERNMENT AGENCIES, AND OTHER ORGANIZATIONS
  • TABLE 13 MIDDLE EAST: REGULATORY BODIES, GOVERNMENT AGENCIES, AND OTHER ORGANIZATIONS
  • TABLE 14 REST OF THE WORLD: REGULATORY BODIES, GOVERNMENT AGENCIES, AND OTHER ORGANIZATIONS
  • TABLE 15 INFLUENCE OF STAKEHOLDERS ON BUYING PROCESS FOR TOP FOUR PLATFORMS
  • TABLE 16 KEY BUYING CRITERIA, BY END USER
  • TABLE 17 AIRCRAFT ACTIVE FLEET, BY REGION, 2020–2023
  • TABLE 18 TOTAL COST OF OWNERSHIP OF INERTIAL NAVIGATION SYSTEMS OVER 10-YEAR LIFECYCLE (USD MILLION)
  • TABLE 19 VENTURE CAPITAL AND DEALS, 2019−2023
  • TABLE 20 PATENT ANALYSIS
  • TABLE 21 INERTIAL NAVIGATION SYSTEMS MARKET, BY PLATFORM, 2020–2023 (USD MILLION)
  • TABLE 22 INERTIAL NAVIGATION SYSTEMS MARKET, BY PLATFORM, 2024–2029 (USD MILLION)
  • TABLE 23 INERTIAL NAVIGATION SYSTEM VOLUME, BY PLATFORM, 2020–2029 (UNITS)
  • TABLE 24 INERTIAL NAVIGATION SYSTEMS MARKET, BY AIRCRAFT, 2020–2023 (USD MILLION)
  • TABLE 25 INERTIAL NAVIGATION SYSTEMS MARKET, BY AIRCRAFT, 2024–2029 (USD MILLION)
  • TABLE 26 FIXED-WING INERTIAL NAVIGATION SYSTEMS MARKET, BY TYPE, 2020–2023 (USD MILLION)
  • TABLE 27 FIXED-WING INERTIAL NAVIGATION SYSTEMS MARKET, BY TYPE, 2024–2029 (USD MILLION)
  • TABLE 28 ROTARY-WING INERTIAL NAVIGATION SYSTEMS MARKET, BY TYPE, 2020–2023 (USD MILLION)
  • TABLE 29 ROTARY-WING INERTIAL NAVIGATION SYSTEMS MARKET, BY TYPE, 2024–2029 (USD MILLION)
  • TABLE 30 INERTIAL NAVIGATION SYSTEMS MARKET, BY MISSILE, 2020–2023 (USD MILLION)
  • TABLE 31 INERTIAL NAVIGATION SYSTEMS MARKET, BY MISSILE, 2024–2029 (USD MILLION)
  • TABLE 32 INERTIAL NAVIGATION SYSTEMS MARKET, BY MARINE VESSEL, 2020–2023 (USD MILLION)
  • TABLE 33 INERTIAL NAVIGATION SYSTEMS MARKET, BY MARINE VESSEL, 2024–2029 (USD MILLION)
  • TABLE 34 INERTIAL NAVIGATION SYSTEMS MARKET, BY MILITARY ARMORED VEHICLE, 2020–2023 (USD MILLION)
  • TABLE 35 INERTIAL NAVIGATION SYSTEMS MARKET, BY MILITARY ARMORED VEHICLE, 2024–2029 (USD MILLION)
  • TABLE 36 INERTIAL NAVIGATION SYSTEMS MARKET, BY UNMANNED AERIAL VEHICLE, 2020–2023 (USD MILLION)
  • TABLE 37 INERTIAL NAVIGATION SYSTEMS MARKET, BY UNMANNED AERIAL VEHICLE, 2024–2029 (USD MILLION)
  • TABLE 38 INERTIAL NAVIGATION SYSTEMS MARKET, BY UNMANNED GROUND VEHICLE, 2020–2023 (USD MILLION)
  • TABLE 39 INERTIAL NAVIGATION SYSTEMS MARKET, BY UNMANNED GROUND VEHICLE, 2024–2029 (USD MILLION)
  • TABLE 40 INERTIAL NAVIGATION SYSTEMS MARKET, BY UNMANNED MARITIME VEHICLE, 2020–2023 (USD MILLION)
  • TABLE 41 INERTIAL NAVIGATION SYSTEMS MARKET, BY UNMANNED MARITIME VEHICLE, 2024–2029 (USD MILLION)
  • TABLE 42 INERTIAL NAVIGATION SYSTEMS MARKET, BY COMPONENT, 2020–2023 (USD MILLION)
  • TABLE 43 INERTIAL NAVIGATION SYSTEMS MARKET, BY COMPONENT, 2024–2029 (USD MILLION)
  • TABLE 44 INERTIAL NAVIGATION SYSTEMS MARKET, BY TECHNOLOGY, 2020–2023 (USD MILLION)
  • TABLE 45 INERTIAL NAVIGATION SYSTEMS MARKET, BY TECHNOLOGY, 2024–2029 (USD MILLION)
  • TABLE 46 INERTIAL NAVIGATION SYSTEMS MARKET, BY GRADE, 2020–2023 (USD MILLION)
  • TABLE 47 INERTIAL NAVIGATION SYSTEMS MARKET, BY GRADE, 2024–2029 (USD MILLION)
  • TABLE 48 INERTIAL NAVIGATION SYSTEMS MARKET, BY END USER, 2020–2023 (USD MILLION)
  • TABLE 49 INERTIAL NAVIGATION SYSTEMS MARKET, BY END USER, 2024–2029 (USD MILLION)
  • TABLE 50 INERTIAL NAVIGATION SYSTEMS MARKET, BY REGION, 2020–2023 (USD MILLION)
  • TABLE 51 INERTIAL NAVIGATION SYSTEMS MARKET, BY REGION, 2024–2029 (USD MILLION)
  • TABLE 52 NORTH AMERICA: INERTIAL NAVIGATION SYSTEMS MARKET, BY COUNTRY, 2020–2023 (USD MILLION)
  • TABLE 53 NORTH AMERICA: INERTIAL NAVIGATION SYSTEMS MARKET, BY COUNTRY, 2024–2029 (USD MILLION)
  • TABLE 54 NORTH AMERICA: INERTIAL NAVIGATION SYSTEMS MARKET, BY PLATFORM, 2020–2023 (USD MILLION)
  • TABLE 55 NORTH AMERICA: INERTIAL NAVIGATION SYSTEMS MARKET, BY PLATFORM, 2024–2029 (USD MILLION)
  • TABLE 56 NORTH AMERICA: INERTIAL NAVIGATION SYSTEMS MARKET, BY TECHNOLOGY, 2020–2023 (USD MILLION)
  • TABLE 57 NORTH AMERICA: INERTIAL NAVIGATION SYSTEMS MARKET, BY TECHNOLOGY, 2024–2029 (USD MILLION)
  • TABLE 58 NORTH AMERICA: INERTIAL NAVIGATION SYSTEMS MARKET, BY GRADE, 2020–2023 (USD MILLION)
  • TABLE 59 NORTH AMERICA: INERTIAL NAVIGATION SYSTEMS MARKET, BY GRADE, 2024–2029 (USD MILLION)
  • TABLE 60 NORTH AMERICA: INERTIAL NAVIGATION SYSTEMS MARKET, BY END USER, 2020–2023 (USD MILLION)
  • TABLE 61 NORTH AMERICA: INERTIAL NAVIGATION SYSTEMS MARKET, BY END USER, 2024–2029 (USD MILLION)
  • TABLE 62 US: INERTIAL NAVIGATION SYSTEMS MARKET, BY TECHNOLOGY, 2020–2023 (USD MILLION)
  • TABLE 63 US: INERTIAL NAVIGATION SYSTEMS MARKET, BY TECHNOLOGY, 2024–2029 (USD MILLION)
  • TABLE 64 US: INERTIAL NAVIGATION SYSTEMS MARKET, BY GRADE, 2020–2023 (USD MILLION)
  • TABLE 65 US: INERTIAL NAVIGATION SYSTEMS MARKET, BY GRADE, 2024–2029 (USD MILLION)
  • TABLE 66 US: INERTIAL NAVIGATION SYSTEMS MARKET, BY END USER, 2020–2023 (USD MILLION)
  • TABLE 67 US: INERTIAL NAVIGATION SYSTEMS MARKET, BY END USER, 2024–2029 (USD MILLION)
  • TABLE 68 CANADA: INERTIAL NAVIGATION SYSTEMS MARKET, BY TECHNOLOGY, 2020–2023 (USD MILLION)
  • TABLE 69 CANADA: INERTIAL NAVIGATION SYSTEMS MARKET, BY TECHNOLOGY, 2024–2029 (USD MILLION)
  • TABLE 70 CANADA: INERTIAL NAVIGATION SYSTEMS MARKET, BY GRADE, 2020–2023 (USD MILLION)
  • TABLE 71 CANADA: INERTIAL NAVIGATION SYSTEMS MARKET, BY GRADE, 2024–2029 (USD MILLION)
  • TABLE 72 CANADA: INERTIAL NAVIGATION SYSTEMS MARKET, BY END USER, 2020–2023 (USD MILLION)
  • TABLE 73 CANADA: INERTIAL NAVIGATION SYSTEMS MARKET, BY END USER, 2024–2029 (USD MILLION)
  • TABLE 74 ASIA PACIFIC: INERTIAL NAVIGATION SYSTEMS MARKET, BY COUNTRY, 2020–2023 (USD MILLION)
  • TABLE 75 ASIA PACIFIC: INERTIAL NAVIGATION SYSTEMS MARKET, BY COUNTRY, 2024–2029 (USD MILLION)
  • TABLE 76 ASIA PACIFIC: INERTIAL NAVIGATION SYSTEMS MARKET, BY PLATFORM, 2020–2023 (USD MILLION)
  • TABLE 77 ASIA PACIFIC: INERTIAL NAVIGATION SYSTEMS MARKET, BY PLATFORM, 2024–2029 (USD MILLION)
  • TABLE 78 ASIA PACIFIC: INERTIAL NAVIGATION SYSTEMS MARKET, BY TECHNOLOGY, 2020–2023 (USD MILLION)
  • TABLE 79 ASIA PACIFIC: INERTIAL NAVIGATION SYSTEMS MARKET, BY TECHNOLOGY, 2024–2029 (USD MILLION)
  • TABLE 80 ASIA PACIFIC: INERTIAL NAVIGATION SYSTEMS MARKET, BY GRADE, 2020–2023 (USD MILLION)
  • TABLE 81 ASIA PACIFIC: INERTIAL NAVIGATION SYSTEMS MARKET, BY GRADE, 2024–2029 (USD MILLION)
  • TABLE 82 ASIA PACIFIC: INERTIAL NAVIGATION SYSTEMS MARKET, BY END USER, 2020–2023 (USD MILLION)
  • TABLE 83 ASIA PACIFIC: INERTIAL NAVIGATION SYSTEMS MARKET, BY END USER, 2024–2029 (USD MILLION)
  • TABLE 84 CHINA: INERTIAL NAVIGATION SYSTEMS MARKET, BY TECHNOLOGY, 2020–2023 (USD MILLION)
  • TABLE 85 CHINA: INERTIAL NAVIGATION SYSTEMS MARKET, BY TECHNOLOGY, 2024–2029 (USD MILLION)
  • TABLE 86 CHINA: INERTIAL NAVIGATION SYSTEMS MARKET, BY GRADE, 2020–2023 (USD MILLION)
  • TABLE 87 CHINA: INERTIAL NAVIGATION SYSTEMS MARKET, BY GRADE, 2024–2029 (USD MILLION)
  • TABLE 88 CHINA: INERTIAL NAVIGATION SYSTEMS MARKET, BY END USER, 2020–2023 (USD MILLION)
  • TABLE 89 CHINA: INERTIAL NAVIGATION SYSTEMS MARKET, BY END USER, 2024–2029 (USD MILLION)
  • TABLE 90 INDIA: INERTIAL NAVIGATION SYSTEMS MARKET, BY TECHNOLOGY, 2020–2023 (USD MILLION)
  • TABLE 91 INDIA: INERTIAL NAVIGATION SYSTEMS MARKET, BY TECHNOLOGY, 2024–2029 (USD MILLION)
  • TABLE 92 INDIA: INERTIAL NAVIGATION SYSTEMS MARKET, BY GRADE, 2020–2023 (USD MILLION)
  • TABLE 93 INDIA: INERTIAL NAVIGATION SYSTEMS MARKET, BY GRADE, 2024–2029 (USD MILLION)
  • TABLE 94 INDIA: INERTIAL NAVIGATION SYSTEMS MARKET, BY END USER, 2020–2023 (USD MILLION)
  • TABLE 95 INDIA: INERTIAL NAVIGATION SYSTEMS MARKET, BY END USER, 2024–2029 (USD MILLION)
  • TABLE 96 JAPAN: INERTIAL NAVIGATION SYSTEMS MARKET, BY TECHNOLOGY, 2020–2023 (USD MILLION)
  • TABLE 97 JAPAN: INERTIAL NAVIGATION SYSTEMS MARKET, BY TECHNOLOGY, 2024–2029 (USD MILLION)
  • TABLE 98 JAPAN: INERTIAL NAVIGATION SYSTEMS MARKET, BY GRADE, 2020–2023 (USD MILLION)
  • TABLE 99 JAPAN: INERTIAL NAVIGATION SYSTEMS MARKET, BY GRADE, 2024–2029 (USD MILLION)
  • TABLE 100 JAPAN: INERTIAL NAVIGATION SYSTEMS MARKET, BY END USER, 2020–2023 (USD MILLION)
  • TABLE 101 JAPAN: INERTIAL NAVIGATION SYSTEMS MARKET, BY END USER, 2024–2029 (USD MILLION)
  • TABLE 102 SOUTH KOREA: INERTIAL NAVIGATION SYSTEMS MARKET, BY TECHNOLOGY, 2020–2023 (USD MILLION)
  • TABLE 103 SOUTH KOREA: INERTIAL NAVIGATION SYSTEMS MARKET, BY TECHNOLOGY, 2024–2029 (USD MILLION)
  • TABLE 104 SOUTH KOREA: INERTIAL NAVIGATION SYSTEMS MARKET, BY GRADE, 2020–2023 (USD MILLION)
  • TABLE 105 SOUTH KOREA: INERTIAL NAVIGATION SYSTEMS MARKET, BY GRADE, 2024–2029 (USD MILLION)
  • TABLE 106 SOUTH KOREA: INERTIAL NAVIGATION SYSTEMS MARKET, BY END USER, 2020–2023 (USD MILLION)
  • TABLE 107 SOUTH KOREA: INERTIAL NAVIGATION SYSTEMS MARKET, BY END USER, 2024–2029 (USD MILLION)
  • TABLE 108 TAIWAN: INERTIAL NAVIGATION SYSTEMS MARKET, BY TECHNOLOGY, 2020–2023 (USD MILLION)
  • TABLE 109 TAIWAN: INERTIAL NAVIGATION SYSTEMS MARKET, BY TECHNOLOGY, 2024–2029 (USD MILLION)
  • TABLE 110 TAIWAN: INERTIAL NAVIGATION SYSTEMS MARKET, BY GRADE, 2020–2023 (USD MILLION)
  • TABLE 111 TAIWAN: INERTIAL NAVIGATION SYSTEMS MARKET, BY GRADE, 2024–2029 (USD MILLION)
  • TABLE 112 TAIWAN: INERTIAL NAVIGATION SYSTEMS MARKET, BY END USER, 2020–2023 (USD MILLION)
  • TABLE 113 TAIWAN: INERTIAL NAVIGATION SYSTEMS MARKET, BY END USER, 2024–2029 (USD MILLION)
  • TABLE 114 REST OF ASIA PACIFIC: INERTIAL NAVIGATION SYSTEMS MARKET, BY TECHNOLOGY, 2020–2023 (USD MILLION)
  • TABLE 115 REST OF ASIA PACIFIC: INERTIAL NAVIGATION SYSTEMS MARKET, BY TECHNOLOGY, 2024–2029 (USD MILLION)
  • TABLE 116 REST OF ASIA PACIFIC: INERTIAL NAVIGATION SYSTEMS MARKET, BY GRADE, 2020–2023 (USD MILLION)
  • TABLE 117 REST OF ASIA PACIFIC: INERTIAL NAVIGATION SYSTEMS MARKET, BY GRADE, 2024–2029 (USD MILLION)
  • TABLE 118 REST OF ASIA PACIFIC: INERTIAL NAVIGATION SYSTEMS MARKET, BY END USER, 2020–2023 (USD MILLION)
  • TABLE 119 REST OF ASIA PACIFIC: INERTIAL NAVIGATION SYSTEMS MARKET, BY END USER, 2024–2029 (USD MILLION)
  • TABLE 120 EUROPE: INERTIAL NAVIGATION SYSTEMS MARKET, BY COUNTRY, 2020–2023 (USD MILLION)
  • TABLE 121 EUROPE: INERTIAL NAVIGATION SYSTEMS MARKET, BY COUNTRY, 2024–2029 (USD MILLION)
  • TABLE 122 EUROPE: INERTIAL NAVIGATION SYSTEMS MARKET, BY PLATFORM, 2020–2023 (USD MILLION)
  • TABLE 123 EUROPE: INERTIAL NAVIGATION SYSTEMS MARKET, BY PLATFORM, 2024–2029 (USD MILLION)
  • TABLE 124 EUROPE: INERTIAL NAVIGATION SYSTEMS MARKET, BY TECHNOLOGY, 2020–2023 (USD MILLION)
  • TABLE 125 EUROPE: INERTIAL NAVIGATION SYSTEMS MARKET, BY TECHNOLOGY, 2024–2029 (USD MILLION)
  • TABLE 126 EUROPE: INERTIAL NAVIGATION SYSTEMS MARKET, BY GRADE, 2020–2023 (USD MILLION)
  • TABLE 127 EUROPE: INERTIAL NAVIGATION SYSTEMS MARKET, BY GRADE, 2024–2029 (USD MILLION)
  • TABLE 128 EUROPE: INERTIAL NAVIGATION SYSTEMS MARKET, BY END USER, 2020–2023 (USD MILLION)
  • TABLE 129 EUROPE: INERTIAL NAVIGATION SYSTEMS MARKET, BY END USER, 2024–2029 (USD MILLION)
  • TABLE 130 UK: INERTIAL NAVIGATION SYSTEMS MARKET, BY TECHNOLOGY, 2020–2023 (USD MILLION)
  • TABLE 131 UK: INERTIAL NAVIGATION SYSTEMS MARKET, BY TECHNOLOGY, 2024–2029 (USD MILLION)
  • TABLE 132 UK: INERTIAL NAVIGATION SYSTEMS MARKET, BY GRADE, 2020–2023 (USD MILLION)
  • TABLE 133 UK: INERTIAL NAVIGATION SYSTEMS MARKET, BY GRADE, 2024–2029 (USD MILLION)
  • TABLE 134 UK: INERTIAL NAVIGATION SYSTEMS MARKET, BY END USER, 2020–2023 (USD MILLION)
  • TABLE 135 UK: INERTIAL NAVIGATION SYSTEMS MARKET, BY END USER, 2024–2029 (USD MILLION)
  • TABLE 136 GERMANY: INERTIAL NAVIGATION SYSTEMS MARKET, BY TECHNOLOGY, 2020–2023 (USD MILLION)
  • TABLE 137 GERMANY: INERTIAL NAVIGATION SYSTEMS MARKET, BY TECHNOLOGY, 2024–2029 (USD MILLION)
  • TABLE 138 GERMANY: INERTIAL NAVIGATION SYSTEMS MARKET, BY GRADE, 2020–2023 (USD MILLION)
  • TABLE 139 GERMANY: INERTIAL NAVIGATION SYSTEMS MARKET, BY GRADE, 2024–2029 (USD MILLION)
  • TABLE 140 GERMANY: INERTIAL NAVIGATION SYSTEMS MARKET, BY END USER, 2020–2023 (USD MILLION)
  • TABLE 141 GERMANY: INERTIAL NAVIGATION SYSTEMS MARKET, BY END USER, 2024–2029 (USD MILLION)
  • TABLE 142 FRANCE: INERTIAL NAVIGATION SYSTEMS MARKET, BY TECHNOLOGY, 2020–2023 (USD MILLION)
  • TABLE 143 FRANCE: INERTIAL NAVIGATION SYSTEMS MARKET, BY TECHNOLOGY, 2024–2029 (USD MILLION)
  • TABLE 144 FRANCE: INERTIAL NAVIGATION SYSTEMS MARKET, BY GRADE, 2020–2023 (USD MILLION)
  • TABLE 145 FRANCE: INERTIAL NAVIGATION SYSTEMS MARKET, BY GRADE, 2024–2029 (USD MILLION)
  • TABLE 146 FRANCE: INERTIAL NAVIGATION SYSTEMS MARKET, BY END USER, 2020–2023 (USD MILLION)
  • TABLE 147 FRANCE: INERTIAL NAVIGATION SYSTEMS MARKET, BY END USER, 2024–2029 (USD MILLION)
  • TABLE 148 ITALY: INERTIAL NAVIGATION SYSTEMS MARKET, BY TECHNOLOGY, 2020–2023 (USD MILLION)
  • TABLE 149 ITALY: INERTIAL NAVIGATION SYSTEMS MARKET, BY TECHNOLOGY, 2024–2029 (USD MILLION)
  • TABLE 150 ITALY: INERTIAL NAVIGATION SYSTEMS MARKET, BY GRADE, 2020–2023 (USD MILLION)
  • TABLE 151 ITALY: INERTIAL NAVIGATION SYSTEMS MARKET, BY GRADE, 2024–2029 (USD MILLION)
  • TABLE 152 ITALY: INERTIAL NAVIGATION SYSTEMS MARKET, BY END USER, 2020–2023 (USD MILLION)
  • TABLE 153 ITALY: INERTIAL NAVIGATION SYSTEMS MARKET, BY END USER, 2024–2029 (USD MILLION)
  • TABLE 154 RUSSIA: INERTIAL NAVIGATION SYSTEMS MARKET, BY TECHNOLOGY, 2020–2023 (USD MILLION)
  • TABLE 155 RUSSIA: INERTIAL NAVIGATION SYSTEMS MARKET, BY TECHNOLOGY, 2024–2029 (USD MILLION)
  • TABLE 156 RUSSIA: INERTIAL NAVIGATION SYSTEMS MARKET, BY GRADE, 2020–2023 (USD MILLION)
  • TABLE 157 RUSSIA: INERTIAL NAVIGATION SYSTEMS MARKET, BY GRADE, 2024–2029 (USD MILLION)
  • TABLE 158 RUSSIA: INERTIAL NAVIGATION SYSTEMS MARKET, BY END USER, 2020–2023 (USD MILLION)
  • TABLE 159 RUSSIA: INERTIAL NAVIGATION SYSTEMS MARKET, BY END USER, 2024–2029 (USD MILLION)
  • TABLE 160 REST OF EUROPE: INERTIAL NAVIGATION SYSTEMS MARKET, BY TECHNOLOGY, 2020–2023 (USD MILLION)
  • TABLE 161 REST OF EUROPE: INERTIAL NAVIGATION SYSTEMS MARKET, BY TECHNOLOGY, 2024–2029 (USD MILLION)
  • TABLE 162 REST OF EUROPE: INERTIAL NAVIGATION SYSTEMS MARKET, BY GRADE, 2020–2023 (USD MILLION)
  • TABLE 163 REST OF EUROPE: INERTIAL NAVIGATION SYSTEMS MARKET, BY GRADE, 2024–2029 (USD MILLION)
  • TABLE 164 REST OF EUROPE: INERTIAL NAVIGATION SYSTEMS MARKET, BY END USER, 2020–2023 (USD MILLION)
  • TABLE 165 REST OF EUROPE: INERTIAL NAVIGATION SYSTEMS MARKET, BY END USER, 2024–2029 (USD MILLION)
  • TABLE 166 MIDDLE EAST: INERTIAL NAVIGATION SYSTEMS MARKET, BY REGION, 2020–2023 (USD MILLION)
  • TABLE 167 MIDDLE EAST: INERTIAL NAVIGATION SYSTEMS MARKET, BY REGION, 2024–2029 (USD MILLION)
  • TABLE 168 MIDDLE EAST: INERTIAL NAVIGATION SYSTEMS MARKET, BY PLATFORM, 2020–2023 (USD MILLION)
  • TABLE 169 MIDDLE EAST: INERTIAL NAVIGATION SYSTEMS MARKET, BY PLATFORM, 2024–2029 (USD MILLION)
  • TABLE 170 MIDDLE EAST: INERTIAL NAVIGATION SYSTEMS MARKET, BY TECHNOLOGY, 2020–2023 (USD MILLION)
  • TABLE 171 MIDDLE EAST: INERTIAL NAVIGATION SYSTEMS MARKET, BY TECHNOLOGY, 2024–2029 (USD MILLION)
  • TABLE 172 MIDDLE EAST: INERTIAL NAVIGATION SYSTEMS MARKET, BY GRADE, 2020–2023 (USD MILLION)
  • TABLE 173 MIDDLE EAST: INERTIAL NAVIGATION SYSTEMS MARKET, BY GRADE, 2024–2029 (USD MILLION)
  • TABLE 174 MIDDLE EAST: INERTIAL NAVIGATION SYSTEMS MARKET, BY END USER, 2020–2023 (USD MILLION)
  • TABLE 175 MIDDLE EAST: INERTIAL NAVIGATION SYSTEMS MARKET, BY END USER, 2024–2029 (USD MILLION)
  • TABLE 176 GCC: INERTIAL NAVIGATION SYSTEMS MARKET, BY COUNTRY, 2020–2023 (USD MILLION)
  • TABLE 177 GCC: INERTIAL NAVIGATION SYSTEMS MARKET, BY COUNTRY, 2024–2029 (USD MILLION)
  • TABLE 178 GCC: INERTIAL NAVIGATION SYSTEMS MARKET, BY TECHNOLOGY, 2020–2023 (USD MILLION)
  • TABLE 179 GCC: INERTIAL NAVIGATION SYSTEMS MARKET, BY TECHNOLOGY, 2024–2029 (USD MILLION)
  • TABLE 180 GCC: INERTIAL NAVIGATION SYSTEMS MARKET, BY GRADE, 2020–2023 (USD MILLION)
  • TABLE 181 GCC: INERTIAL NAVIGATION SYSTEMS MARKET, BY GRADE, 2024–2029 (USD MILLION)
  • TABLE 182 GCC: INERTIAL NAVIGATION SYSTEMS MARKET, BY END USER, 2020–2023 (USD MILLION
  • TABLE 183 GCC: INERTIAL NAVIGATION SYSTEMS MARKET, BY END USER, 2024–2029 (USD MILLION)
  • TABLE 184 REST OF MIDDLE EAST: INERTIAL NAVIGATION SYSTEMS MARKET, BY COUNTRY, 2020–2023 (USD MILLION)
  • TABLE 185 REST OF MIDDLE EAST: INERTIAL NAVIGATION SYSTEMS MARKET, BY COUNTRY, 2024–2029 (USD MILLION)
  • TABLE 186 REST OF MIDDLE EAST: INERTIAL NAVIGATION SYSTEMS MARKET, BY TECHNOLOGY, 2020–2023 (USD MILLION)
  • TABLE 187 REST OF MIDDLE EAST: INERTIAL NAVIGATION SYSTEMS MARKET, BY TECHNOLOGY, 2024–2029 (USD MILLION)
  • TABLE 188 REST OF MIDDLE EAST: INERTIAL NAVIGATION SYSTEMS MARKET, BY GRADE, 2020–2023 (USD MILLION)
  • TABLE 189 REST OF MIDDLE EAST: INERTIAL NAVIGATION SYSTEMS MARKET, BY GRADE, 2024–2029 (USD MILLION)
  • TABLE 190 REST OF MIDDLE EAST: INERTIAL NAVIGATION SYSTEMS MARKET, BY END USER, 2020–2023 (USD MILLION
  • TABLE 191 REST OF MIDDLE EAST: INERTIAL NAVIGATION SYSTEMS MARKET, BY END USER, 2024–2029 (USD MILLION)
  • TABLE 192 REST OF THE WORLD: INERTIAL NAVIGATION SYSTEMS MARKET, BY REGION, 2020–2023 (USD MILLION)
  • TABLE 193 REST OF THE WORLD: INERTIAL NAVIGATION SYSTEMS MARKET, BY REGION, 2024–2029 (USD MILLION)
  • TABLE 194 REST OF THE WORLD: INERTIAL NAVIGATION SYSTEMS MARKET, BY PLATFORM, 2020–2023 (USD MILLION)
  • TABLE 195 REST OF THE WORLD: INERTIAL NAVIGATION SYSTEMS MARKET, BY PLATFORM, 2024–2029 (USD MILLION)
  • TABLE 196 REST OF THE WORLD: INERTIAL NAVIGATION SYSTEMS MARKET, BY TECHNOLOGY, 2020–2023 (USD MILLION)
  • TABLE 197 REST OF THE WORLD: INERTIAL NAVIGATION SYSTEMS MARKET, BY TECHNOLOGY, 2024–2029 (USD MILLION)
  • TABLE 198 REST OF THE WORLD: INERTIAL NAVIGATION SYSTEMS MARKET, BY GRADE, 2020–2023 (USD MILLION)
  • TABLE 199 REST OF THE WORLD: INERTIAL NAVIGATION SYSTEMS MARKET, BY GRADE, 2024–2029 (USD MILLION)
  • TABLE 200 REST OF THE WORLD: INERTIAL NAVIGATION SYSTEMS MARKET, BY END USER, 2020–2023 (USD MILLION)
  • TABLE 201 REST OF THE WORLD: INERTIAL NAVIGATION SYSTEMS MARKET, BY END USER, 2024–2029 (USD MILLION)
  • TABLE 202 LATIN AMERICA: INERTIAL NAVIGATION SYSTEMS MARKET, BY TECHNOLOGY, 2020–2023 (USD MILLION)
  • TABLE 203 LATIN AMERICA: INERTIAL NAVIGATION SYSTEMS MARKET, BY TECHNOLOGY, 2024–2029 (USD MILLION)
  • TABLE 204 LATIN AMERICA: INERTIAL NAVIGATION SYSTEMS MARKET, BY GRADE, 2020–2023 (USD MILLION)
  • TABLE 205 LATIN AMERICA: INERTIAL NAVIGATION SYSTEMS MARKET, BY GRADE, 2024–2029 (USD MILLION)
  • TABLE 206 LATIN AMERICA: INERTIAL NAVIGATION SYSTEMS MARKET, BY END USER, 2020–2023 (USD MILLION
  • TABLE 207 LATIN AMERICA: INERTIAL NAVIGATION SYSTEMS MARKET, BY END USER, 2024–2029 (USD MILLION)
  • TABLE 208 AFRICA: INERTIAL NAVIGATION SYSTEMS MARKET, BY TECHNOLOGY, 2020–2023 (USD MILLION)
  • TABLE 209 AFRICA: INERTIAL NAVIGATION SYSTEMS MARKET, BY TECHNOLOGY, 2024–2029 (USD MILLION)
  • TABLE 210 AFRICA: INERTIAL NAVIGATION SYSTEMS MARKET, BY GRADE, 2020–2023 (USD MILLION)
  • TABLE 211 AFRICA: INERTIAL NAVIGATION SYSTEMS MARKET, BY GRADE, 2024–2029 (USD MILLION)
  • TABLE 212 AFRICA: INERTIAL NAVIGATION SYSTEMS MARKET, BY END USER, 2020–2023 (USD MILLION
  • TABLE 213 AFRICA: INERTIAL NAVIGATION SYSTEMS MARKET, BY END USER, 2024–2029 (USD MILLION)
  • TABLE 214 KEY PLAYER STRATEGIES/RIGHT TO WIN, 2020–2024
  • TABLE 215 INERTIAL NAVIGATION SYSTEMS MARKET: DEGREE OF COMPETITION
  • TABLE 216 TECHNOLOGY FOOTPRINT
  • TABLE 217 END USER FOOTPRINT
  • TABLE 218 PLATFORM FOOTPRINT
  • TABLE 219 REGION FOOTPRINT
  • TABLE 220 KEY START-UPS/SMES
  • TABLE 221 COMPETITIVE BENCHMARKING OF KEY START-UPS/SMES
  • TABLE 222 INERTIAL NAVIGATION SYSTEMS MARKET: PRODUCT LAUNCHES, 2020–2024
  • TABLE 223 INERTIAL NAVIGATION SYSTEMS MARKET: DEALS, 2020–2024
  • TABLE 224 INERTIAL NAVIGATION SYSTEMS MARKET: OTHERS, 2020–2024
  • TABLE 225 SAFRAN ELECTRONICS & DEFENSE: COMPANY OVERVIEW
  • TABLE 226 SAFRAN ELECTRONICS & DEFENSE: PRODUCTS OFFERED
  • TABLE 227 SAFRAN ELECTRONICS & DEFENSE: PRODUCT LAUNCHES
  • TABLE 228 SAFRAN ELECTRONICS & DEFENSE: DEALS
  • TABLE 229 SAFRAN ELECTRONICS & DEFENSE: OTHERS
  • TABLE 230 NORTHROP GRUMMAN: COMPANY OVERVIEW
  • TABLE 231 NORTHROP GRUMMAN: PRODUCTS OFFERED
  • TABLE 232 NORTHROP GRUMMAN: OTHERS
  • TABLE 233 TELEDYNE TECHNOLOGIES INC.: COMPANY OVERVIEW
  • TABLE 234 TELEDYNE TECHNOLOGIES INC.: PRODUCTS OFFERED
  • TABLE 235 TELEDYNE TECHNOLOGIES INC.: OTHERS
  • TABLE 236 COLLINS AEROSPACE: COMPANY OVERVIEW
  • TABLE 237 COLLINS AEROSPACE: PRODUCTS OFFERED
  • TABLE 238 COLLINS AEROSPACE: PRODUCT LAUNCHES
  • TABLE 239 COLLINS AEROSPACE: OTHERS
  • TABLE 240 HONEYWELL INTERNATIONAL INC.: COMPANY OVERVIEW
  • TABLE 241 HONEYWELL INTERNATIONAL INC.: PRODUCTS OFFERED
  • TABLE 242 HONEYWELL INTERNATIONAL INC.: PRODUCT LAUNCHES
  • TABLE 243 HONEYWELL INTERNATIONAL INC.: DEALS
  • TABLE 244 THALES: COMPANY OVERVIEW
  • TABLE 245 THALES: PRODUCTS OFFERED
  • TABLE 246 THALES: DEALS
  • TABLE 247 GENERAL ELECTRIC COMPANY: COMPANY OVERVIEW
  • TABLE 248 GENERAL ELECTRIC COMPANY: PRODUCTS OFFERED
  • TABLE 249 TRIMBLE INC.: COMPANY OVERVIEW
  • TABLE 250 TRIMBLE INC.: PRODUCTS OFFERED
  • TABLE 251 TRIMBLE INC.: DEALS
  • TABLE 252 L3HARRIS TECHNOLOGIES, INC.: COMPANY OVERVIEW
  • TABLE 253 L3HARRIS TECHNOLOGIES, INC.: PRODUCTS OFFERED
  • TABLE 254 L3HARRIS TECHNOLOGIES, INC.: DEALS
  • TABLE 255 EXAIL TECHNOLOGIES: COMPANY OVERVIEW
  • TABLE 256 EXAIL TECHNOLOGIES: PRODUCTS OFFERED
  • TABLE 257 EXAIL TECHNOLOGIES: DEALS
  • TABLE 258 EXAIL TECHNOLOGIES: OTHERS
  • TABLE 259 MEMSIC SEMICONDUCTOR CO., LTD.: COMPANY OVERVIEW
  • TABLE 260 MEMSIC SEMICONDUCTOR CO., LTD.: PRODUCTS OFFERED
  • TABLE 261 MEMSIC SEMICONDUCTOR CO., LTD.: PRODUCT LAUNCHES
  • TABLE 262 ISRAEL AEROSPACE INDUSTRIES LTD.: COMPANY OVERVIEW
  • TABLE 263 ISRAEL AEROSPACE INDUSTRIES LTD.: PRODUCTS OFFERED
  • TABLE 264 EMCORE CORPORATION: COMPANY OVERVIEW
  • TABLE 265 EMCORE CORPORATION: PRODUCTS OFFERED
  • TABLE 266 VECTORNAV TECHNOLOGIES: COMPANY OVERVIEW
  • TABLE 267 GLADIATOR TECHNOLOGIES: COMPANY OVERVIEW
  • TABLE 268 XSENS: COMPANY OVERVIEW
  • TABLE 269 SBG SYSTEMS: COMPANY OVERVIEW
  • TABLE 270 INERTIAL LABS, INC.: COMPANY OVERVIEW
  • TABLE 271 INNALABS: COMPANY OVERVIEW
  • TABLE 272 IMAR NAVIGATION GMBH: COMPANY OVERVIEW
  • TABLE 273 MICROSTRAIN BY HBK: COMPANY OVERVIEW
  • TABLE 274 SILICON SENSING: COMPANY OVERVIEW
  • TABLE 275 SILICON DESIGN, INC.: COMPANY OVERVIEW
  • TABLE 276 SPARTON NAVIGATION AND EXPLORATION LTD.: COMPANY OVERVIEW
  • TABLE 277 OTHER MAPPED COMPANIES
LIST OF FIGURES
 
  • FIGURE 1 INERTIAL NAVIGATION SYSTEMS MARKET SEGMENTATION
  • FIGURE 2 REPORT PROCESS FLOW
  • FIGURE 3 RESEARCH DESIGN
  • FIGURE 4 BOTTOM-UP APPROACH
  • FIGURE 5 TOP-DOWN APPROACH
  • FIGURE 6 DATA TRIANGULATION
  • FIGURE 7 AIRCRAFT TO SURPASS OTHER PLATFORMS DURING FORECAST PERIOD
  • FIGURE 8 RING LASER GYRO TO SECURE LEADING MARKET POSITION DURING FORECAST PERIOD
  • FIGURE 9 NAVIGATION TO BE LARGEST SEGMENT DURING FORECAST PERIOD
  • FIGURE 10 DEFENSE TO HOLD DOMINANT SHARE DURING FORECAST PERIOD
  • FIGURE 11 NORTH AMERICA TO BE LARGEST MARKET FOR INERTIAL NAVIGATION SYSTEMS DURING FORECAST PERIOD
  • FIGURE 12 GOVERNMENT INITIATIVES TOWARD DEVELOPMENT OF ADVANCED NAVIGATION SYSTEMS TO DRIVE GROWTH
  • FIGURE 13 FIXED-WING TO BE LARGER SEGMENT THAN ROTARY-WING DURING FORECAST PERIOD
  • FIGURE 14 CRUISE MISSILES TO ACQUIRE HIGHER SHARE IN 2029
  • FIGURE 15 MERCHANT SHIPS TO BE PREVALENT DURING FORECAST PERIOD
  • FIGURE 16 MILITARY COMBAT VEHICLES TO BE DOMINANT DURING FORECAST PERIOD
  • FIGURE 17 ISRAEL TO BE FASTEST-GROWING MARKET DURING FORECAST PERIOD
  • FIGURE 18 INERTIAL NAVIGATION SYSTEMS MARKET DYNAMICS
  • FIGURE 19 ORBITAL LAUNCHES, 2020–2023
  • FIGURE 20 AIRCRAFT DELIVERIES BY BOEING AND AIRBUS, 2019–2023
  • FIGURE 21 VALUE CHAIN ANALYSIS
  • FIGURE 22 TRENDS AND DISRUPTIONS IMPACTING CUSTOMERS’ BUSINESSES
  • FIGURE 23 ECOSYSTEM ANALYSIS
  • FIGURE 24 IMPORT DATA, BY COUNTRY, 2020–2023 (USD THOUSAND)
  • FIGURE 25 EXPORT DATA, BY COUNTRY, 2020–2023 (USD THOUSAND)
  • FIGURE 26 INFLUENCE OF STAKEHOLDERS ON BUYING PROCESS FOR TOP FOUR PLATFORMS
  • FIGURE 27 KEY BUYING CRITERIA, BY END USER
  • FIGURE 28 INTRODUCTION TO TECHNOLOGY ROADMAP
  • FIGURE 29 EVOLUTION OF KEY TECHNOLOGIES
  • FIGURE 30 EMERGING TRENDS RELATED TO INERTIAL NAVIGATION SYSTEMS
  • FIGURE 31 BILL OF MATERIALS FOR INERTIAL NAVIGATION SYSTEMS
  • FIGURE 32 TOTAL COST OF OWNERSHIP OF INERTIAL NAVIGATION SYSTEMS
  • FIGURE 33 AVERAGE BREAKDOWN OF MAJOR COST CATEGORIES AS PERCENTAGES OF TOTAL LIFECYCLE COST
  • FIGURE 34 BUSINESS MODELS OF INERTIAL NAVIGATION SYSTEMS MARKET
  • FIGURE 35 DIRECT SALE MODEL
  • FIGURE 36 SERVICE MODEL
  • FIGURE 37 VENTURE CAPITAL AND DEALS, 2019−2023
  • FIGURE 38 TECHNOLOGY TRENDS
  • FIGURE 39 PATENT ANALYSIS
  • FIGURE 40 INERTIAL NAVIGATION SYSTEMS MARKET, BY PLATFORM, 2024–2029
  • FIGURE 41 INERTIAL NAVIGATION SYSTEM VOLUME, BY PLATFORM, 2020–2029 (UNITS)
  • FIGURE 42 FIXED-WING TO BE LARGEST SEGMENT DURING FORECAST PERIOD
  • FIGURE 43 CRUISE MISSILES TO BE LARGEST SEGMENT DURING FORECAST PERIOD
  • FIGURE 44 MERCHANT SHIPS TO BE LARGEST SEGMENT DURING FORECAST PERIOD
  • FIGURE 45 MILITARY COMBAT VEHICLES TO BE LARGEST SEGMENT DURING FORECAST PERIOD
  • FIGURE 46 TACTICAL UNMANNED AERIAL VEHICLES TO BE LARGEST SEGMENT DURING FORECAST PERIOD
  • FIGURE 47 MILITARY UNMANNED GROUND VEHICLES TO BE LARGEST SEGMENT DURING FORECAST PERIOD
  • FIGURE 48 UNMANNED SURFACE VEHICLES TO BE LARGEST SEGMENT DURING FORECAST PERIOD
  • FIGURE 49 INERTIAL NAVIGATION SYSTEMS MARKET, BY COMPONENT, 2024–2029
  • FIGURE 50 INERTIAL NAVIGATION SYSTEMS MARKET, BY TECHNOLOGY, 2024–2029
  • FIGURE 51 INERTIAL NAVIGATION SYSTEMS MARKET, BY GRADE, 2024–2029
  • FIGURE 52 INERTIAL NAVIGATION SYSTEMS MARKET, BY END USER, 2024–2029
  • FIGURE 53 INERTIAL NAVIGATION SYSTEMS MARKET, BY REGION, 2024–2029
  • FIGURE 54 NORTH AMERICA: INERTIAL NAVIGATION SYSTEMS MARKET SNAPSHOT
  • FIGURE 55 ASIA PACIFIC: INERTIAL NAVIGATION SYSTEMS MARKET SNAPSHOT
  • FIGURE 56 EUROPE: INERTIAL NAVIGATION SYSTEMS MARKET SNAPSHOT
  • FIGURE 57 MIDDLE EAST: INERTIAL NAVIGATION SYSTEMS MARKET SNAPSHOT
  • FIGURE 58 REST OF THE WORLD: INERTIAL NAVIGATION SYSTEMS MARKET SNAPSHOT
  • FIGURE 59 MARKET RANKING OF KEY PLAYERS, 2023
  • FIGURE 60 REVENUE ANALYSIS OF TOP FIVE PLAYERS, 2019–2023
  • FIGURE 61 MARKET SHARE ANALYSIS OF KEY PLAYERS, 2023
  • FIGURE 62 COMPANY EVALUATION MATRIX (KEY PLAYERS), 2023
  • FIGURE 63 COMPANY FOOTPRINT
  • FIGURE 64 COMPANY EVALUATION MATRIX (START-UPS/SMES), 2023
  • FIGURE 65 COMPANY VALUATION OF PROMINENT PLAYERS
  • FIGURE 66 FINANCIAL METRICS OF PROMINENT PLAYERS
  • FIGURE 67 BRAND/PRODUCT COMPARISON
  • FIGURE 68 SAFRAN ELECTRONICS & DEFENSE: COMPANY SNAPSHOT
  • FIGURE 69 NORTHROP GRUMMAN: COMPANY SNAPSHOT
  • FIGURE 70 TELEDYNE TECHNOLOGIES INC.: COMPANY SNAPSHOT
  • FIGURE 71 COLLINS AEROSPACE: COMPANY SNAPSHOT
  • FIGURE 72 HONEYWELL INTERNATIONAL INC.: COMPANY SNAPSHOT
  • FIGURE 73 THALES: COMPANY SNAPSHOT
  • FIGURE 74 GENERAL ELECTRIC COMPANY: COMPANY SNAPSHOT
  • FIGURE 75 TRIMBLE INC.: COMPANY SNAPSHOT
  • FIGURE 76 L3HARRIS TECHNOLOGIES, INC.: COMPANY SNAPSHOT
  • FIGURE 77 EXAIL TECHNOLOGIES: COMPANY SNAPSHOT
  • FIGURE 78 ISRAEL AEROSPACE INDUSTRIES LTD.: COMPANY SNAPSHOT
  • FIGURE 79 EMCORE CORPORATION: COMPANY SNAPSHOT

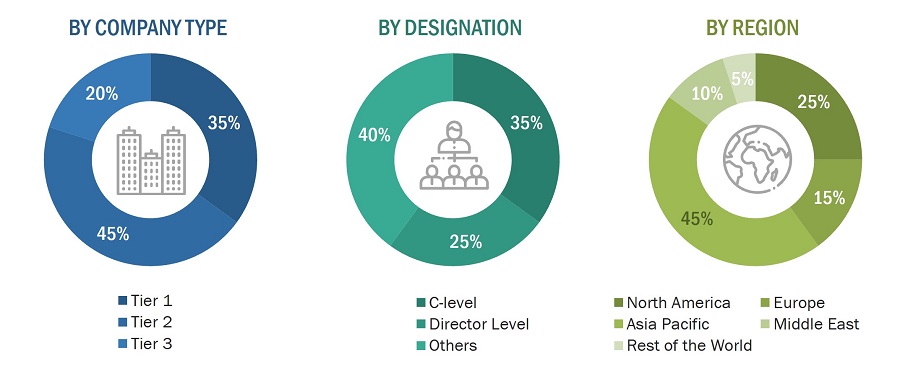
This research study on the inertial navigation systems market involved the extensive use of secondary sources, directories, and databases, such as TradeMap, lens.org, and UNCTAD, to identify and collect information on the relevant market. Primary sources included experts from core and related industries, as well as suppliers, manufacturers, solution providers, technology developers, alliances, and organizations related to all segments of the industry’s value chain. All primary sources were interviewed to obtain and verify critical qualitative and quantitative information, as well as assess the growth prospects of the market during the forecast period.

Secondary Research

The market share of companies offering inertial navigation systems was arrived at based on the secondary data available through paid and unpaid sources, as well as by analyzing the product portfolios of major companies and rating them based on their performance and quality.

In the secondary research process, corporate filings, such as annual reports, press releases, and investor presentations of companies; white papers, journals, and certified publications; articles by recognized authors; directories; and databases were used to identify and collect information for this study. Secondary research was mainly used to obtain key information about the industry’s current scenario and to identify the key players by various products, market classifications, and segmentation according to their offerings and industry trends related to platform, component, technology, grade, end-user, and region segments and key developments from both market and technology-oriented perspectives.

Primary Research

In the primary research process, various sources from the supply and demand sides were interviewed to obtain qualitative and quantitative information on the market. Primary sources from the supply side included industry experts such as vice presidents (VPs); directors from business development, marketing, and product development/innovation teams; industry experts; INS manufacturers; and key opinion leaders.
Inertial Navigation Systems Market
 Size, and Share

To know about the assumptions considered for the study, download the pdf brochure

Market Size Estimation

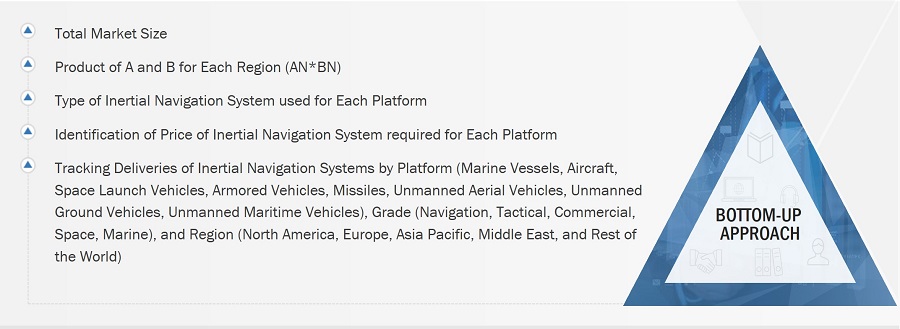
  • Both top-down and bottom-up approaches were used to estimate and validate the size of the inertial navigation systems market.
  • Key players in the inertial navigation system market were identified through secondary research, and their market share was determined through primary and secondary research. This included a study of the annual and financial reports of the top market players and extensive interviews with leaders such as directors, engineers, marketing executives, and other stakeholders of leading companies operating in the inertial navigation systems market.
  • All percentage shares, splits, and breakdowns were determined using secondary sources and verified through primary sources. All possible parameters that affect the markets covered in this research study were accounted for, viewed in extensive detail, verified through primary research, and analyzed to obtain the final quantitative and qualitative data on the inertial navigation systems market. This data was consolidated, enhanced with detailed inputs, analyzed by MarketsandMarkets, and presented in this report.

Market size estimation methodology: Bottom-Up Approach
Inertial Navigation Systems Market
 Size, and Bottom-Up Approach

Market size estimation methodology: Top-Down Approach

Inertial Navigation Systems Market
 Size, and Top-Down Approach

Data Triangulation

After arriving at the overall market size, the total market was split into several segments and subsegments. The data triangulation and market breakdown procedures explained below were implemented, wherever applicable, to complete the overall market engineering process and arrive at the estimated market numbers for the market segments and subsegments. The data was triangulated by studying various factors and trends from the demand and supply sides. The market size was also validated using the top-down and bottom-up approaches.

Market Definition

An inertial navigation system evaluates inputs from accelerometers and gyroscopes to track the position and orientation of an object relative to its starting point and velocity. These systems are utilized across airborne, ground, and naval platforms. Position, velocity, and orientation are essential parameters of navigation systems. Most navigation systems, such as the global positioning system (GPS), do not provide real-time details on the above-mentioned parameters. The deployment of GPS across various platforms depends on its signal strength and the equipment’s location. Additionally, precise, and reliable navigation inputs are required to ensure the efficient functioning of GPS and other satellite communication and airborne equipment. Inertial navigation systems provide these details with the desired accuracy and reliability.

Stakeholders

Various stakeholders of the market are listed below:

  • Inertial Navigation System Manufacturers
  • Inertial Navigation System Wholesalers, Retailers, and Distributors
  • System Integrators
  • Technology Providers
  • Sensor Manufacturers
  • Raw Material Suppliers
  • Aircraft Regulatory Bodies

Report Objectives

  • To define, describe, segment, and forecast the size of the inertial navigation systems market based on platform, component, technology, grade, end user, and region
  • To forecast the size of market segments with respect to five regions, namely North America, Europe, Asia Pacific, the Middle East, and Rest of the World, along with major countries in each region
  • To identify and analyze key drivers, restraints, opportunities, and challenges influencing the market growth
  • To analyze micromarkets1 with respect to individual growth trends, prospects, and their contribution to the overall market
  • To analyze opportunities in the market for stakeholders by identifying key market trends
  • To profile key market players and comprehensively analyze their market shares and core competencies
  • To identify detailed financial positions, key products, and unique selling points of leading companies in the market
  • To provide a detailed competitive landscape of the market, along with market ranking analysis, market share analysis, and revenue analysis of key players
  • To analyze the degree of competition in the market by identifying key growth strategies, such as product launches, contracts, and partnerships, adopted by leading market players

1. Micromarkets are defined as further segments and subsegments of the inertial navigation systems market included in the report.

2. Core competencies of the companies have been captured in terms of key developments and strategies adopted by them to sustain their position in the market.

Available customizations

Along with the market data, MarketsandMarkets offers customizations as per the specific needs of companies. The following customization options are available for the report:

Product Analysis

  • Product matrix, which gives a detailed comparison of the product portfolio of each company.

Regional Analysis

  • Further breakdown of the market segments at the country level

Company Information

  • Detailed analysis and profiling of additional market players (up to 5)

Previous Versions of this Report

Inertial Navigation System Market by Grade (Marine, Navigation, Tactical, Space, Commercial), Technology (Mechanical, Ring Laser, Fiber Optic, Mems), Application (Aircraft, Missile, Marine, UAV, UGV, UMV), Component, and Region - Global Forecast to 2022

Report Code AS 2417
Published in Sep, 2017, By MarketsandMarkets™

Inertial Navigation System Market by Product Grade (Marine, Navigation, Tactical, And Commercial), by Technology (RLG, Fog, MEMS, Mechanical, Vibrating GYRO, HRG), by Application (Defense and Commercial Platform) and by Geography - Global Forecast to 2020

Report Code AS 2417
Published in Dec, 2015, By MarketsandMarkets™

Inertial Navigation System Market by Product (Marine grade, Navigation grade, Tactical grade, and Commercial grade), Technology (Mechanical, Fiber optic gyro (FOG), Ring laser gyro (RLG), Micro-Electro-Mechanical Systems (MEMS), Hemispherical Resonator gyro (HRG), and Vibrating gyro), Application (Air, Land, and Naval Platforms), Geography (North America, Europe, Asia-Pacific, the Middle East, and ROW) - Forecast & Analysis to 2014 - 2019

Report Code AS 2417
Published in Apr, 2014, By MarketsandMarkets™
"Our USP is "providing game-changing business opportunities reports with free customization" - so please feel free to provide us with your specific areas of interest / business challenges in much greater detail !!"

We appreciate your interest in this report. Once you fill out the form, you'll be immediately directed to an exclusive solution tailored to your needs. This high-value offering can help boost your revenue by 30% - a must-see opportunity for anyone looking to maximize growth.


By clicking the "Submit" button, you are agreeing to the Terms of Use and Privacy Policy.

Custom Market Research Services

We Will Customise The Research For You, In Case The Report Listed Above Does Not Meet With Your Requirements

Get 10% Free Customisation

Growth opportunities and latent adjacency in Inertial Navigation Systems Market

User

Feb, 2020

Hi Team, I am interested in buying market research on inertial navigation and gyrocompass for a naval or maritime small carrier like UUV, UAV, USV. Thanks, Hortense BASTIE..

DMCA.com Protection Status