Graphic Film Market

Graphic Film Market by Product Type (Polyethylene, Polypropylene, Polyvinyl Chloride), Film Type (Opaque, Transparent, Translucent, Reflective), Manufacturing Process, Printing Technology, End-Use Industry, and Region - Global Forecast to 2028

Report Code: PK 5574 Nov, 2023, by marketsandmarkets.com

Updated on : August 22, 2024

Graphic Film Market

The global graphic film market was valued at USD 28.9 billion in 2023 and is projected to reach USD 36.2 billion by 2028, growing at 4.6% cagr from 2023 to 2028. The market growth of graphic film is driven by several factors such as rising urbanization, improving living standards, increasing construction and developmental activities, growing automotive industry, and others.

Global Graphic Film Market Trends

Graphic Film Market

To know about the assumptions considered for the study, Request for Free Sample Report

Graphic Film Market

Graphic Film Market Dynamics

Driver: Improving living standards and rising construction industry

The dynamic surge in construction and developmental initiatives, coupled with the elevation of living standards, stands as a pivotal catalyst propelling the graphic film market forward. Within the realm of construction, graphic films assume a central role in shaping architectural designs, signage, and branding applications. The escalating pace of global urbanization and infrastructure development has generated a heightened need for graphic films that are not only durable but also visually captivating, especially for embellishing building exteriors and interiors. The current emphasis on aesthetics and visual communication in architecture has spurred the widespread adoption of graphic films to elevate the overall aesthetic appeal of structures.

Restraint: Volatility in raw material prices

The graphic film market encounters a significant challenge attributed to the fluctuating costs of raw materials. Variations in the prices of crucial raw materials essential for graphic film production, such as petroleum-based products, exert a notable influence on the overall manufacturing expenses. These material costs are susceptible to unpredictable shifts, influenced by factors such as geopolitical events and global economic conditions. This volatility presents difficulties for manufacturers, creating challenges in accurately estimating production expenses and maintaining stable pricing for graphic film.

Opportunity: Increasing demand for bio-plastics

The graphic film market is experiencing promising opportunities driven by the escalating demand for bioplastic polymers. With a heightened focus on environmental sustainability, there is a notable shift towards eco-friendly materials across various industries. Bioplastic films are made from the biodegradable material—cellulose. Moreover, polymers such as PE, PP, and PVC—which are made from renewable resources such as bioethanol—can also be used as raw materials for graphic film.

Challenges:  Limited Recycling Options

The graphic film market encounters a notable challenge with limited recycling options, adversely affecting the sustainability of these materials. Unlike commonly recycled materials such as paper and cardboard, graphic films, particularly those composed of traditional plastics, often lack well-established recycling systems. The intricate nature of these films, incorporating multiple layers or coatings for specific functionalities, adds complexity to the recycling process.

Graphic Film Market Ecosystem

Graphic Film Market Ecosystem

“Dominance of Promotional and advertisement in the Graphic film end-use industry segment.”

In terms of the end-use industry, the promotional and advertisement industry is estimated to be the largest market during the forecast period, in terms of value. Graphic film offers a visually striking and versatile medium for conveying messages. In the promotional and advertising sector, where capturing attention is crucial, the ability of graphic films to deliver vibrant and creative visuals makes them highly sought after. Graphic film play a pivotal role in brand building and recognition. Advertisers and marketers leverage graphic film to create visually appealing logos, signage, and promotional materials that contribute to establishing a strong brand identity.

“Polyvinyl Chloride is the fastest growing product type segment of the graphic film market.”

In the graphic film market, the polyvinyl chloride segment is expected to hold the highest compound annual growth rate (CAGR) in terms of value during the forecast period. PVC graphic film offers a high level of versatility, making it suitable for a wide range of applications within the graphic arts industry. It can be used for signage, banners, vehicle wraps, and other promotional materials, contributing to their widespread adoption. Apart from this, PVC graphic film also offers several benefits such as durability, excellent printability, cost-effectiveness, availability in various sizes, good chemical resistant properties, and others.

“Transparent Film is the second fastest growing film type segment of the graphic film market.”

Transparent graphic films provide a visually appealing and sophisticated look. This aesthetic quality is particularly valued in applications where the underlying surface or design needs to remain visible, enhancing the overall appearance of the graphics. Transparent graphic films are commonly used in interior design applications, such as glass partitions, decorative panels, and window graphics. They enable designers to enhance spaces without obstructing natural light or views.

Calendered process is the most usable manufacturing process in the graphic film market.”

The calendered process stands out as the most widely utilized method for producing graphic films due to its unique combination of key advantages. These key advantages include controlled thickness, smooth surface finish, dimensional stability, good printability, enhanced strength & durability, optical clarity, strength, cost-effectiveness, and others. Due to such benefits of this process, the film is used in several application areas such as promotional banners, signage applications, POP displays, advertisement stickers, etc.

“Flexography is the fastest-growing market for graphic film market.”

End-use industries such as automotive, promotional & advertisement, industrial, and others show a preference for flexographic printing over alternative techniques. Flexography currently presents compelling advantages for both product marketing and purchasing management. Thanks to recent advancements, it now offers the capability to produce high-quality images and graphics, ensuring consistent and repeatable results from one job to another. Moreover, flexographic printing facilitates swift and cost-effective changeovers, particularly beneficial for supporting small-quantity production runs.

“APAC is the speediest-growing market for graphic film market.”

In terms of value, the Asia Pacific will be the fastest-growing region in the overall graphic film market.

This growth is attributed to rapid urbanization, increasing disposable income, and improving living standards, which drive the renovation, and decoration activities across the residential & non-residential complexes. Apart from this, the growing automotive industry also drives the demand for automotive wraps across the region. This fuelled the market of graphic films in the region during the forecast period.

Graphic Film Market by Region

To know about the assumptions considered for the study, download the pdf brochure

Graphic Film Market Players

Key stakeholders steering the trajectory of the graphic film market include 3M (US), Avery Dennison Corporation (US), DuPont de Nemours Inc. (US), CCL Industries (Canada), Fedrigoni S.P.A. (Italy), ORAFOL Europe GmbH (Germany), HEXIS S.A.S. (France), Arlon Graphics, LLC (US), Achilles USA Inc.(US), Dunmore (US), Drytac (US), LX Hausys (South Korea). To solidify their positions in this competitive market, these industry frontrunners have judiciously employed a range of growth strategies. This encompasses acquisitions, diversifying their product lineup, geographical expansions, and forging productive partnerships, collaborations, and agreements. Through these strategic maneuvers, they aim to cater to the escalating demand for graphic film, particularly from dynamic emerging markets.

Graphic Film Market Report Scope

Report Metric

Details

Years Considered

2021–2028

Base year

2022

Forecast period

2023–2028

Unit considered 

Value (USD Million/Billion), Volume (Million Square Meters)

Segments

Film Type, Manufacturing Process, Printing Technology, Product Type, End-Use Industry, and Region

Regions

Asia-Pacific, North America, Europe, South America, and Middle East & Africa.

Companies

The major players are 3M (US), Avery Dennison Corporation (US), DuPont de Nemours Inc. (US), CCL Industries (Canada), and Fedrigoni S.P.A. (Italy) and others are covered in the Graphic film market.

This research report categorizes the global Graphic film market on the basis of Type, Application, and Region.

Graphic Film Market by Film Type
  • Opaque Films
  • Transparent Films
  • Translucent Films
  • Reflective Films
Graphic Film Market by Product Type
  • Polyethylene
  • Polypropylene
  • Polyvinyl chloride
  • Others
Graphic Film Market by End-Use Industries
  • Automotive
  • Promotional & Advertisement
  • Industrial
  • Others
Graphic Film Market by Manufacturing Process
  • Calendered
  • Casting
  • Others
Graphic Film Market by Printing Technology
  • Flexography
  • Rotogravure
  • Offset
  • Digital
Graphic Film Market by Region
  • Asia Pacific (APAC)
  • North America
  • Europe
  • South America
  • Middle East & Africa

The market has been further analyzed for the key countries in each of these regions.

Recent Developments

  • In October 2023, Avery Dennison Corporation (US) partnered with Siser North America, to announce the retail launch of EasyPSV Starling, a pressure-sensitive vinyl film product.
  • In October 2023, DuPont de Nemours, Inc. (US) announced its collaboration with United States Steel Corporation, to launch COASTALUME, which combines the strength and self-healing characteristics of U. S. Steel’s GALVALUME material with DuPont Tedlar Polyvinyl Fluoride (PVF) film.
  • In October 2023, Drytac launched Polar Blockout UV opaque printable block-out film. It is the ideal solution for two-sided window graphics and other block-out layer requirements.
  • In September 2023, Drytac announced the launch of its new ReTac Clear PET film in North America.
  • In July 2023, Innovia (a subsidiary of CCL Industries (US)) invested in a new coating line to develop a new range of PVC-free films for the graphics sector at their site in Wigton, Great Britain.
  • In March 2023, ORAFOL Europe GmbH (Germany) launched a new Oracle 651 Matte PVC film. It is used for indoor and outdoor applications. It is available in 18 vibrant, luxurious matte colors.
  • In March 2023, HEXIS S.A.S (France) announced the acquisition of Stickittome, specializing in the supply of vinyl films for the printing and cutting process
  • In March 2023, Avery Dennison Corporation announced the expansion of its product line by adding two products DOL 1060 Max & DOL 1360 Max.
  • In November 2022, CCL Industries has launched a new generation of polypropylene, high gloss films, which are printable by both HP Latex and UV Inkjet systems.

Frequently Asked Questions (FAQ):

To speak to our analyst for a discussion on the above findings, click Speak to Analyst

Exclusive indicates content/data unique to MarketsandMarkets and not available with any competitors.

INTRODUCTION
23
RESEARCH METHODOLOGY
28
EXECUTIVE SUMMARY
36
PREMIUM INSIGHTS
39
MARKET OVERVIEW
43
  • 5.1 INTRODUCTION
  • 5.2 MARKET DYNAMICS
    DRIVERS
    - Rising construction industry and improved living standards
    - Low installation and maintenance costs
    - Rising demand for wrap advertisements
    RESTRAINTS
    - Volatile raw material costs
    - Stringent government regulations regarding raw materials used for graphic film manufacturing
    OPPORTUNITIES
    - Increase in demand for bioplastic polymers
    - Continuous advancements in digital printing techniques
    CHALLENGES
    - Technological obsolescence
    - Limited recycling options
INDUSTRY TRENDS
48
  • 6.1 PORTER’S FIVE FORCES ANALYSIS
    BARGAINING POWER OF SUPPLIERS
    THREAT OF NEW ENTRANTS
    THREAT OF SUBSTITUTES
    BARGAINING POWER OF BUYERS
    INTENSITY OF COMPETITIVE RIVALRY
  • 6.2 VALUE CHAIN ANALYSIS
  • 6.3 TRENDS /DISRUPTIONS IMPACTING CUSTOMER’S BUSINESS
    GRAPHIC FILMS MARKET - GLOBAL FORECAST TO 2028
    - Trends/Disruptions impacting customer’s business
  • 6.4 TARIFF AND REGULATORY LANDSCAPE
    GRAPHIC FILMS MARKET, GLOBAL FORECAST TO 2028
    TARIFF RELATED TO GRAPHIC FILMS
  • 6.5 REGULATORY BODIES AND GOVERNMENT AGENCIES
    REGULATORY BODIES, GOVERNMENT AGENCIES, AND OTHER ORGANIZATIONS
  • 6.6 PRICING ANALYSIS
    AVERAGE SELLING PRICE TREND OF KEY PLAYERS, BY END-USE INDUSTRY
    AVERAGE SELLING PRICE TREND, BY REGION
  • 6.7 TECHNOLOGY ANALYSIS
    GRAPHIC FILMS MARKET - FORECAST TO 2028
    - Technology analysis
GRAPHIC FILMS MARKET, BY PRINTING TECHNOLOGY
63
  • 7.1 INTRODUCTION
  • 7.2 FLEXOGRAPHY
    ADAPTABILITY AND COST-EFFECTIVENESS TO DRIVE MARKET
  • 7.3 ROTOGRAVURE
    VERSATILITY AND EFFICIENCY TO DRIVE MARKET
  • 7.4 OFFSET
    TECHNOLOGICAL ADVANCEMENTS AND INCREASED AUTOMATION TO ENHANCE EFFICIENCY
  • 7.5 DIGITAL
    COST-EFFECTIVENESS FOR SHORT PRINT RUNS MAKING IT ECONOMICALLY VIABLE TO DRIVE MARKET
GRAPHIC FILMS MARKET, BY FILM TYPE
67
  • 8.1 INTRODUCTION
  • 8.2 OPAQUE FILMS
    EFFECTIVE WAY TO ENHANCE PRIVACY TO DRIVE DEMAND
  • 8.3 REFLECTIVE FILMS
    REFLECTIVE PROPERTIES TO INCREASE DEMAND
  • 8.4 TRANSPARENT FILMS
    ABILITY TO ALLOW LIGHT TO PASS THROUGH TO DRIVE DEMAND
  • 8.5 TRANSLUCENT FILMS
    ABILITY TO SOFTEN TRANSMITTED LIGHT TO DRIVE DEMAND
GRAPHIC FILMS MARKET, BY END-USE INDUSTRY
70
  • 9.1 INTRODUCTION
  • 9.2 AUTOMOTIVE
    ABILITY TO TRANSFORM EXTERNAL APPEARANCE OF VEHICLES TO DRIVE DEMAND
  • 9.3 PROMOTIONAL & ADVERTISEMENT
    EFFECTIVE IN CAPTURING ATTENTION AND CONVEYING MESSAGE TO DRIVE DEMAND
  • 9.4 INDUSTRIAL
    DURABILITY TO DRIVE DEMAND
  • 9.5 OTHER END-USE INDUSTRIES
GRAPHIC FILMS MARKET, BY MANUFACTURING PROCESS
74
  • 10.1 INTRODUCTION
  • 10.2 CALENDERED
    PRECISE CONTROL OVER THICKNESS AND SURFACE CHARACTERISTICS TO DRIVE MARKET
  • 10.3 CASTING
    VERSATILITY OF CASTING TO EXTEND ACROSS INDUSTRIES
  • 10.4 OTHER MANUFACTURING PROCESSES
    ADVANCES IN COMPUTER-TO-PLATE SYSTEMS AND INCREASED AUTOMATION TO ENHANCE DEMAND
GRAPHIC FILMS MARKET, BY PRODUCT TYPE
76
  • 11.1 INTRODUCTION
  • 11.2 GRAPHIC FILMS MARKET, BY PRODUCT TYPE
  • 11.3 POLYVINYL CHLORIDE (PVC)
  • 11.4 POLYPROPYLENE (PP)
  • 11.5 POLYETHYLENE (PE)
  • 11.6 OTHER PRODUCT TYPES
GRAPHIC FILMS MARKET, BY REGION
81
  • 12.1 INTRODUCTION
  • 12.2 NORTH AMERICA
    RECESSION IMPACT
    US
    - Investment by automotive companies to drive demand
    CANADA
    - Rising automotive industry to drive demand
    MEXICO
    - Rising automotive industry to drive market
  • 12.3 EUROPE
    RECESSION IMPACT
    GERMANY
    - Growing automotive and advertising industries to increase demand
    UK
    - Increased spending on advertising sector to provide growth opportunities
    FRANCE
    - Government initiatives to boost demand
    ITALY
    - Government initiatives to drive market
    RUSSIA
    - Government initiatives to lead the market growth
    REST OF EUROPE
  • 12.4 ASIA PACIFIC
    RECESSION IMPACT
    CHINA
    - Expanding automotive industry to drive market
    INDIA
    - Rising advertising and automotive industries to drive demand
    JAPAN
    - Growing automotive industry to support market
    SOUTH KOREA
    - Growing electric vehicles market to drive demand
    AUSTRALIA
    - Increasing sales of automotive vehicles to drive market
    REST OF ASIA PACIFIC
  • 12.5 SOUTH AMERICA
    RECESSION IMPACT
    BRAZIL
    - Rising digital printing technology to drive market
    ARGENTINA
    - Automotive sector growth to drive market
    REST OF SOUTH AMERICA
  • 12.6 MIDDLE EAST & AFRICA
    RECESSION IMPACT
    GCC COUNTRIES
    - Growing electric vehicle demand to drive market
    UAE
    - Growing end-use industries to drive market
    REST OF GCC
    SOUTH AFRICA
    - Enhanced macroeconomic management to play vital role
    REST OF MIDDLE EAST & AFRICA
COMPETITIVE LANDSCAPE
158
  • 13.1 OVERVIEW
  • 13.2 MARKET SHARE ANALYSIS
  • 13.3 REVENUE ANALYSIS OF TOP MARKET PLAYERS
  • 13.4 COMPANY EVALUATION MATRIX
    STARS
    EMERGING LEADERS
    PERVASIVE PLAYERS
    PARTICIPANTS
    COMPANY FOOTPRINT
  • 13.5 START-UPS/SMES EVALUATION MATRIX, 2022
    PROGRESSIVE COMPANIES
    RESPONSIVE COMPANIES
    DYNAMIC COMPANIES
    STARTING BLOCKS
    COMPETITIVE BENCHMARKING
  • 13.6 COMPETITIVE SCENARIO AND TRENDS
    PRODUCT LAUNCHES
    DEALS
COMPANY PROFILES
177
  • 14.1 KEY PLAYERS
    AVERY DENNISON CORPORATION
    - Business overview
    - Products/Solutions/Services offered
    - Recent developments
    - MnM view
    3M
    - Business overview
    - Products/Solutions/Services Offered
    - Recent developments
    - MnM view
    DUPONT DE NEMOURS, INC.
    - Business overview
    - Products/Solutions/Services Offered
    - Recent developments
    - MnM view
    CCL INDUSTRIES
    - Business overview
    - Products/Solutions/Services offered
    - Recent developments
    - MnM view
    ORAFOL EUROPE GMBH
    - Business overview
    - Products/Solutions/Services Offered
    - Recent developments
    - MnM view
    HEXIS S.A.S.
    - Business overview
    - Products/Solutions/Services offered
    - Recent developments
    - MnM view
    ARLON GRAPHICS, LLC
    - Business overview
    - Products/Solutions/Services offered
    - Recent developments
    - MnM view
    ACHILLES USA INC.
    - Business overview
    - Products/Solutions/Services Offered
    - MnM view
    DUNMORE
    - Business overview
    - Products/Solutions/Services offered
    - Recent developments
    - MnM view
    DRYTAC
    - Business overview
    - Products/Solutions/Services offered
    - Recent developments
    - MnM view
    LX HAUSYS
    - Business overview
    - Products/Solutions/Services offered
    - MNM view
    FEDRIGONI S.P.A.
    - Business overview
    - Products/Solutions/Services offered
    - Recent developments
    - MNM view
  • 14.2 OTHER PLAYERS
    LINTEC CORPORATION
    CONTRA VISION LIMITED
    MATIV
    COSMO FILMS LIMITED
    TAGHLEEF INDUSTRIES
    ACCO BRANDS
    ULTRAFLEX SYSTEMS INC.
    THE GRIFF NETWORK
    BRIDGEHEAD CO., LTD.
    JESSUP MANUFACTURING COMPANY
    GARWARE HI-TECH FILMS LIMITED
    CELADON TECHNOLOGY COMPANY LTD.
    NEKOOSA
    CONTINENTAL GRAFIX USA, INC.
    JIANGSU AOLI NEW MATERIALS CO., LTD.
ADJACENT MARKET
220
  • 15.1 INTRODUCTION
  • 15.2 LIMITATIONS
  • 15.3 LARGE FORMAT PRINTER MARKET
APPENDIX
223
  • 16.1 DISCUSSION GUIDE
  • 16.2 KNOWLEDGESTORE: MARKETSANDMARKETS’ SUBSCRIPTION PORTAL
  • 16.3 CUSTOMIZATION OPTIONS
  • 16.4 RELATED REPORTS
  • 16.5 AUTHOR DETAILS
LIST OF TABLES
 
  • TABLE 1 GRAPHIC FILMS MARKET: PORTER’S FIVE FORCE ANALYSIS
  • TABLE 2 NORTH AMERICA: LIST OF REGULATORY BODIES, GOVERNMENT AGENCIES, AND OTHER ORGANIZATIONS
  • TABLE 3 EUROPE: LIST OF REGULATORY BODIES, GOVERNMENT AGENCIES, AND OTHER ORGANIZATIONS
  • TABLE 4 ASIA PACIFIC: LIST OF REGULATORY BODIES, GOVERNMENT AGENCIES, AND OTHER ORGANIZATIONS
  • TABLE 5 REST OF WORLD: LIST OF REGULATORY BODIES, GOVERNMENT AGENCIES, AND OTHER ORGANIZATIONS
  • TABLE 6 AVERAGE SELLING PRICE TREND OF KEY PLAYERS, BY TOP END-USE INDUSTRIES (USD/SQUARE METER)
  • TABLE 7 AVERAGE SELLING PRICE TREND, BY REGION (USD/SQUARE METER)
  • TABLE 8 GRAPHIC FILMS MARKET, BY PRINTING TECHNOLOGY, 2021–2028 (USD MILLION)
  • TABLE 9 GRAPHIC FILMS MARKET, BY PRINTING TECHNOLOGY, 2021–2028 (MILLION SQUARE METER)
  • TABLE 10 GRAPHIC FILMS MARKET, BY FILM TYPE, 2021–2028 (USD MILLION)
  • TABLE 11 GRAPHIC FILMS MARKET, BY FILM TYPE, 2021–2028 (MILLION SQUARE METERS)
  • TABLE 12 GRAPHIC FILMS MARKET, BY END-USE INDUSTRY, 2021–2028 (USD MILLION)
  • TABLE 13 GRAPHIC FILMS MARKET, BY END-USE INDUSTRY, 2021–2028 (MILLION SQUARE METERS)
  • TABLE 14 GRAPHIC FILMS MARKET, BY PRODUCT TYPE, 2021–2028 (USD MILLION)
  • TABLE 15 GRAPHIC FILMS MARKET, BY PRODUCT TYPE, 2021–2028 (MILLION SQUARE METERS)
  • TABLE 16 POLYVINYL CHLORIDE PROPERTIES
  • TABLE 17 POLYPROPYLENE PROPERTIES
  • TABLE 18 POLYETHYLENE PROPERTIES
  • TABLE 19 GRAPHIC FILMS MARKET, BY REGION, 2021–2028 (USD MILLION)
  • TABLE 20 GRAPHIC FILMS MARKET, BY REGION 2021–2028 (MILLION SQUARE METERS)
  • TABLE 21 NORTH AMERICA: GRAPHIC FILMS MARKET, BY COUNTRY, 2021–2028 (USD MILLION)
  • TABLE 22 NORTH AMERICA: GRAPHIC FILMS MARKET, BY COUNTRY, 2021–2028 (MILLION SQUARE METERS)
  • TABLE 23 NORTH AMERICA: GRAPHIC FILMS MARKET, BY PRODUCT TYPE, 2021–2028 (USD MILLION)
  • TABLE 24 NORTH AMERICA: GRAPHIC FILMS MARKET, BY PRODUCT TYPE, 2021–2028 (MILLION SQUARE METERS)
  • TABLE 25 NORTH AMERICA: GRAPHIC FILMS MARKET, BY END-USE INDUSTRY, 2021–2028 (USD MILLION)
  • TABLE 26 NORTH AMERICA: GRAPHIC FILMS MARKET, BY END-USE INDUSTRY, 2021–2028 (MILLION SQUARE METERS)
  • TABLE 27 NORTH AMERICA: GRAPHIC FILMS MARKET, BY FILM TYPE, 2021–2028 (USD MILLION)
  • TABLE 28 NORTH AMERICA: GRAPHIC FILMS MARKET, BY FILM TYPE, 2021–2028 (MILLION SQUARE METERS)
  • TABLE 29 US: GRAPHIC FILMS MARKET, BY PRODUCT TYPE, 2021–2028 (USD MILLION)
  • TABLE 30 US: GRAPHIC FILMS MARKET, BY PRODUCT TYPE, 2021–2028 (MILLION SQUARE METERS)
  • TABLE 31 US: GRAPHIC FILMS MARKET, BY END-USE INDUSTRY, 2021–2028 (USD MILLION)
  • TABLE 32 US: GRAPHIC FILMS MARKET, BY END-USE INDUSTRY, 2021–2028 (MILLION SQUARE METERS)
  • TABLE 33 US: GRAPHIC FILMS MARKET, BY FILM TYPE, 2021–2028 (USD MILLION)
  • TABLE 34 US: GRAPHIC FILMS MARKET, BY FILM TYPE, 2021–2028 (MILLION SQUARE METERS)
  • TABLE 35 CANADA: GRAPHIC FILMS MARKET, BY PRODUCT TYPE, 2021–2028 (USD MILLION)
  • TABLE 36 CANADA: GRAPHIC FILMS MARKET, BY PRODUCT TYPE, 2021–2028 (MILLION SQUARE METERS)
  • TABLE 37 CANADA: GRAPHIC FILMS MARKET, BY END-USE INDUSTRY, 2021–2028 (USD MILLION)
  • TABLE 38 CANADA: GRAPHIC FILMS MARKET, BY END-USE INDUSTRY, 2021–2028 (MILLION SQUARE METERS)
  • TABLE 39 CANADA: GRAPHIC FILMS MARKET, BY FILM TYPE, 2021–2028 (USD MILLION)
  • TABLE 40 CANADA: GRAPHIC FILMS MARKET, BY FILM TYPE, 2021–2028 (MILLION SQUARE METERS)
  • TABLE 41 MEXICO: GRAPHIC FILMS MARKET, BY PRODUCT TYPE, 2021–2028 (USD MILLION)
  • TABLE 42 MEXICO: GRAPHIC FILMS MARKET, BY PRODUCT TYPE, 2021–2028 (MILLION SQUARE METERS)
  • TABLE 43 MEXICO: GRAPHIC FILMS MARKET, BY END-USE INDUSTRY, 2021–2028 (USD MILLION)
  • TABLE 44 MEXICO: GRAPHIC FILMS MARKET, BY END-USE INDUSTRY, 2021–2028 (MILLION SQUARE METERS)
  • TABLE 45 MEXICO: GRAPHIC FILMS MARKET, BY FILM TYPE, 2021–2028 (USD MILLION)
  • TABLE 46 MEXICO: GRAPHIC FILMS MARKET, BY FILM TYPE, 2021–2028 (MILLION SQUARE METERS)
  • TABLE 47 EUROPE: GRAPHIC FILMS MARKET, BY COUNTRY, 2021–2028 (USD MILLION)
  • TABLE 48 EUROPE: GRAPHIC FILMS MARKET, BY COUNTRY, 2021–2028 (MILLION SQUARE METERS)
  • TABLE 49 EUROPE: GRAPHIC FILMS MARKET, BY PRODUCT TYPE, 2021–2028 (USD MILLION)
  • TABLE 50 EUROPE: GRAPHIC FILMS MARKET, BY PRODUCT TYPE, 2021–2028 (MILLION SQUARE METERS)
  • TABLE 51 EUROPE: GRAPHIC FILMS MARKET, BY END-USE INDUSTRY, 2021–2028 (USD MILLION)
  • TABLE 52 EUROPE: GRAPHIC FILMS MARKET, BY END-USE INDUSTRY, 2021–2028 (MILLION SQUARE METERS)
  • TABLE 53 EUROPE: GRAPHIC FILMS MARKET, BY FILM TYPE, 2021–2028 (USD MILLION)
  • TABLE 54 EUROPE: GRAPHIC FILMS MARKET, BY FILM TYPE, 2021–2028 (MILLION SQUARE METERS)
  • TABLE 55 EUROPE: GRAPHIC FILMS MARKET, BY PRINTING TECHNOLOGY, 2021–2028 (USD MILLION)
  • TABLE 56 EUROPE: GRAPHIC FILMS MARKET, PRINTING TECHNOLOGY, 2021–2028 (MILLION SQUARE METERS)
  • TABLE 57 GERMANY: GRAPHIC FILMS MARKET, BY PRODUCT TYPE, 2021–2028 (USD MILLION)
  • TABLE 58 GERMANY: GRAPHIC FILMS MARKET, BY PRODUCT TYPE, 2021–2028 (MILLION SQUARE METERS)
  • TABLE 59 GERMANY: GRAPHIC FILMS MARKET, BY END-USE INDUSTRY, 2021–2028 (USD MILLION)
  • TABLE 60 GERMANY: GRAPHIC FILMS MARKET, BY END-USE INDUSTRY, 2021–2028 (MILLION SQUARE METERS)
  • TABLE 61 GERMANY: GRAPHIC FILMS MARKET, BY FILM TYPE, 2021–2028 (USD MILLION)
  • TABLE 62 GERMANY: GRAPHIC FILMS MARKET, BY FILM TYPE, 2021–2028 (MILLION SQUARE METERS)
  • TABLE 63 UK: GRAPHIC FILMS MARKET, BY PRODUCT TYPE, 2021–2028 (USD MILLION)
  • TABLE 64 UK: GRAPHIC FILMS MARKET, BY PRODUCT TYPE, 2021–2028 (MILLION SQUARE METERS)
  • TABLE 65 UK: GRAPHIC FILMS MARKET, BY END-USE INDUSTRY, 2021–2028 (USD MILLION)
  • TABLE 66 UK: GRAPHIC FILMS MARKET, BY END-USE INDUSTRY, 2021–2028 (MILLION SQUARE METERS)
  • TABLE 67 UK: GRAPHIC FILMS MARKET, BY FILM TYPE, 2021–2028 (USD MILLION)
  • TABLE 68 UK: GRAPHIC FILMS MARKET, BY FILM TYPE, 2021–2028 (MILLION SQUARE METERS)
  • TABLE 69 FRANCE: GRAPHIC FILMS MARKET, BY PRODUCT TYPE, 2021–2028 (USD MILLION)
  • TABLE 70 FRANCE: GRAPHIC FILMS MARKET, BY PRODUCT TYPE, 2021–2028 (MILLION SQUARE METERS)
  • TABLE 71 FRANCE: GRAPHIC FILMS MARKET, BY END-USE INDUSTRY, 2021–2028 (USD MILLION)
  • TABLE 72 FRANCE: GRAPHIC FILMS MARKET, BY END-USE INDUSTRY, 2021–2028 (MILLION SQUARE METERS)
  • TABLE 73 FRANCE: GRAPHIC FILMS MARKET, BY FILM TYPE, 2021–2028 (USD MILLION)
  • TABLE 74 FRANCE: GRAPHIC FILMS MARKET, BY FILM TYPE, 2021–2028 (MILLION SQUARE METERS)
  • TABLE 75 ITALY: GRAPHIC FILMS MARKET, BY PRODUCT TYPE, 2021–2028 (USD MILLION)
  • TABLE 76 ITALY: GRAPHIC FILMS MARKET, BY PRODUCT TYPE, 2021–2028 (MILLION SQUARE METERS)
  • TABLE 77 ITALY: GRAPHIC FILMS MARKET, BY END-USE INDUSTRY, 2021–2028 (USD MILLION)
  • TABLE 78 ITALY: GRAPHIC FILMS MARKET, BY END-USE INDUSTRY, 2021–2028 (MILLION SQUARE METERS)
  • TABLE 79 ITALY: GRAPHIC FILMS MARKET, BY FILM TYPE, 2021–2028 (USD MILLION)
  • TABLE 80 ITALY: GRAPHIC FILMS MARKET, BY FILM TYPE, 2021–2028 (MILLION SQUARE METERS)
  • TABLE 81 RUSSIA: GRAPHIC FILMS MARKET, BY PRODUCT TYPE, 2021–2028 (USD MILLION)
  • TABLE 82 RUSSIA: GRAPHIC FILMS MARKET, BY PRODUCT TYPE, 2021–2028 (MILLION SQUARE METERS)
  • TABLE 83 RUSSIA: GRAPHIC FILMS MARKET, BY END-USE INDUSTRY, 2021–2028 (USD MILLION)
  • TABLE 84 RUSSIA: GRAPHIC FILMS MARKET, BY END-USE INDUSTRY, 2021–2028 (MILLION SQUARE METERS)
  • TABLE 85 RUSSIA: GRAPHIC FILMS MARKET, BY FILM TYPE, 2021–2028 (USD MILLION)
  • TABLE 86 RUSSIA: GRAPHIC FILMS MARKET, BY FILM TYPE, 2021–2028 (MILLION SQUARE METERS)
  • TABLE 87 REST OF EUROPE: GRAPHIC FILMS MARKET, BY PRODUCT TYPE, 2021–2028 (USD MILLION)
  • TABLE 88 REST OF EUROPE: GRAPHIC FILMS MARKET, BY PRODUCT TYPE, 2021–2028 (MILLION SQUARE METERS)
  • TABLE 89 REST OF EUROPE: GRAPHIC FILMS MARKET, BY END-USE INDUSTRY, 2021–2028 (USD MILLION)
  • TABLE 90 REST OF EUROPE: GRAPHIC FILMS MARKET, BY END-USE INDUSTRY, 2021–2028 (MILLION SQUARE METERS)
  • TABLE 91 REST OF EUROPE: GRAPHIC FILMS MARKET, BY FILM TYPE, 2021–2028 (USD MILLION)
  • TABLE 92 REST OF EUROPE: GRAPHIC FILMS MARKET, BY FILM TYPE, 2021–2028 (MILLION SQUARE METERS)
  • TABLE 93 ASIA PACIFIC: GRAPHIC FILMS MARKET, BY COUNTRY, 2021–2028 (USD MILLION)
  • TABLE 94 ASIA PACIFIC: GRAPHIC FILMS MARKET, BY COUNTRY, 2021–2028 (MILLION SQUARE METERS)
  • TABLE 95 ASIA PACIFIC: GRAPHIC FILMS MARKET, BY PRODUCT TYPE, 2021–2028 (USD MILLION)
  • TABLE 96 ASIA PACIFIC: GRAPHIC FILMS MARKET, BY PRODUCT TYPE, 2021–2028 (MILLION SQUARE METERS)
  • TABLE 97 ASIA PACIFIC: GRAPHIC FILMS MARKET, BY END-USE INDUSTRY, 2021–2028 (USD MILLION)
  • TABLE 98 ASIA PACIFIC: GRAPHIC FILMS MARKET, BY END-USE INDUSTRY, 2021–2028 (MILLION SQUARE METERS)
  • TABLE 99 ASIA PACIFIC: GRAPHIC FILMS MARKET, BY FILM TYPE, 2021–2028 (USD MILLION)
  • TABLE 100 ASIA PACIFIC: GRAPHIC FILMS MARKET, BY FILM TYPE, 2021–2028 (MILLION SQUARE METERS)
  • TABLE 101 ASIA PACIFIC: GRAPHIC FILMS MARKET, BY PRINTING TECHNOLOGY, 2021–2028 (USD MILLION)
  • TABLE 102 ASIA PACIFIC: GRAPHIC FILMS MARKET, BY PRINTING TECHNOLOGY, 2021–2028 (MILLION SQUARE METERS)
  • TABLE 103 CHINA: GRAPHIC FILMS MARKET, BY PRODUCT TYPE, 2021–2028 (USD MILLION)
  • TABLE 104 CHINA: GRAPHIC FILMS MARKET, BY PRODUCT TYPE, 2021–2028 (MILLION SQUARE METERS)
  • TABLE 105 CHINA: GRAPHIC FILMS MARKET, BY END-USE INDUSTRY, 2021–2028 (USD MILLION)
  • TABLE 106 CHINA: GRAPHIC FILMS MARKET, BY END-USE INDUSTRY, 2021–2028 (MILLION SQUARE METERS)
  • TABLE 107 CHINA: GRAPHIC FILMS MARKET, BY FILM TYPE, 2021–2028 (USD MILLION)
  • TABLE 108 CHINA: GRAPHIC FILMS MARKET, BY FILM TYPE, 2021–2028 (MILLION SQUARE METERS)
  • TABLE 109 INDIA: GRAPHIC FILMS MARKET, BY PRODUCT TYPE, 2021–2028 (USD MILLION)
  • TABLE 110 INDIA: GRAPHIC FILMS MARKET, BY PRODUCT TYPE, 2021–2028 (MILLION SQUARE METERS)
  • TABLE 111 INDIA: GRAPHIC FILMS MARKET, BY END-USE INDUSTRY, 2021–2028 (USD MILLION)
  • TABLE 112 INDIA: GRAPHIC FILMS MARKET, BY END-USE INDUSTRY, 2021–2028 (MILLION SQUARE METERS)
  • TABLE 113 INDIA: GRAPHIC FILMS MARKET, BY FILM TYPE, 2021–2028 (USD MILLION)
  • TABLE 114 INDIA: GRAPHIC FILMS MARKET, BY FILM TYPE, 2021–2028 (MILLION SQUARE METERS)
  • TABLE 115 JAPAN: GRAPHIC FILMS MARKET, BY PRODUCT TYPE, 2021–2028 (USD MILLION)
  • TABLE 116 JAPAN: GRAPHIC FILMS MARKET, BY PRODUCT TYPE, 2021–2028 (MILLION SQUARE METERS)
  • TABLE 117 JAPAN: GRAPHIC FILMS MARKET, BY END-USE INDUSTRY, 2021–2028 (USD MILLION)
  • TABLE 118 JAPAN: GRAPHIC FILMS MARKET, BY END-USE INDUSTRY, 2021–2028 (MILLION SQUARE METERS)
  • TABLE 119 JAPAN: GRAPHIC FILMS MARKET, BY FILM TYPE, 2021–2028 (USD MILLION)
  • TABLE 120 JAPAN: GRAPHIC FILMS MARKET, BY FILM TYPE, 2021–2028 (MILLION SQUARE METERS)
  • TABLE 121 SOUTH KOREA: GRAPHIC FILMS MARKET, BY PRODUCT TYPE, 2021–2028 (USD MILLION)
  • TABLE 122 SOUTH KOREA: GRAPHIC FILMS MARKET, BY PRODUCT TYPE, 2021–2028 (MILLION SQUARE METERS)
  • TABLE 123 SOUTH KOREA: GRAPHIC FILMS MARKET, BY END-USE INDUSTRY, 2021–2028 (USD MILLION)
  • TABLE 124 SOUTH KOREA: GRAPHIC FILMS MARKET, BY END-USE INDUSTRY, 2021–2028 (MILLION SQUARE METERS)
  • TABLE 125 SOUTH KOREA: GRAPHIC FILMS MARKET, BY FILM TYPE, 2021–2028 (USD MILLION)
  • TABLE 126 SOUTH KOREA: GRAPHIC FILMS MARKET, BY FILM TYPE, 2021–2028 (MILLION SQUARE METERS)
  • TABLE 127 AUSTRALIA: GRAPHIC FILMS MARKET, BY PRODUCT TYPE, 2021–2028 (USD MILLION)
  • TABLE 128 AUSTRALIA: GRAPHIC FILMS MARKET, BY PRODUCT TYPE, 2021–2028 (MILLION SQUARE METERS)
  • TABLE 129 AUSTRALIA: GRAPHIC FILMS MARKET, BY END-USE INDUSTRY, 2021–2028 (USD MILLION)
  • TABLE 130 AUSTRALIA: GRAPHIC FILMS MARKET, BY END-USE INDUSTRY, 2021–2028 (MILLION SQUARE METERS)
  • TABLE 131 AUSTRALIA: GRAPHIC FILMS MARKET, BY FILM TYPE, 2021–2028 (USD MILLION)
  • TABLE 132 AUSTRALIA: GRAPHIC FILMS MARKET, BY FILM TYPE, 2021–2028 (MILLION SQUARE METERS)
  • TABLE 133 REST OF ASIA PACIFIC: GRAPHIC FILMS MARKET, BY PRODUCT TYPE, 2021–2028 (USD MILLION)
  • TABLE 134 REST OF ASIA PACIFIC: GRAPHIC FILMS MARKET, BY PRODUCT TYPE, 2021–2028 (MILLION SQUARE METERS)
  • TABLE 135 REST OF ASIA PACIFIC: GRAPHIC FILMS MARKET, BY END-USE INDUSTRY, 2021–2028 (USD MILLION)
  • TABLE 136 REST OF ASIA PACIFIC: GRAPHIC FILMS MARKET, BY END-USE INDUSTRY, 2021–2028 (MILLION SQUARE METERS)
  • TABLE 137 REST OF ASIA PACIFIC: GRAPHIC FILMS MARKET, BY FILM TYPE, 2021–2028 (USD MILLION)
  • TABLE 138 REST OF ASIA PACIFIC: GRAPHIC FILMS MARKET, BY FILM TYPE, 2021–2028 (MILLION SQUARE METERS)
  • TABLE 139 SOUTH AMERICA: GRAPHIC FILMS MARKET, BY COUNTRY, 2021–2028 (USD MILLION)
  • TABLE 140 SOUTH AMERICA: GRAPHIC FILMS MARKET, BY COUNTRY, 2021–2028 (MILLION SQUARE METERS)
  • TABLE 141 SOUTH AMERICA: GRAPHIC FILMS MARKET, BY PRODUCT TYPE, 2021–2028 (USD MILLION)
  • TABLE 142 SOUTH AMERICA: GRAPHIC FILMS MARKET, BY PRODUCT TYPE, 2021–2028 (MILLION SQUARE METERS)
  • TABLE 143 SOUTH AMERICA: GRAPHIC FILMS MARKET, BY END-USE INDUSTRY, 2021–2028 (USD MILLION)
  • TABLE 144 SOUTH AMERICA: GRAPHIC FILMS MARKET, BY END-USE INDUSTRY, 2021–2028 (MILLION SQUARE METERS)
  • TABLE 145 SOUTH AMERICA: GRAPHIC FILMS MARKET, BY FILM TYPE, 2021–2028 (USD MILLION)
  • TABLE 146 SOUTH AMERICA: GRAPHIC FILMS MARKET, BY FILM TYPE, 2021–2028 (MILLION SQUARE METERS)
  • TABLE 147 SOUTH AMERICA: GRAPHIC FILMS MARKET, BY PRINTING TECHNOLOGY, 2021–2028 (USD MILLION)
  • TABLE 148 SOUTH AMERICA: GRAPHIC FILMS MARKET, BY PRINTING TECHNOLOGY, 2021–2028 (MILLION SQUARE METERS)
  • TABLE 149 BRAZIL: GRAPHIC FILMS MARKET, BY PRODUCT TYPE, 2021–2028 (USD MILLION)
  • TABLE 150 BRAZIL: GRAPHIC FILMS MARKET, BY PRODUCT TYPE, 2021–2028 (MILLION SQUARE METERS)
  • TABLE 151 BRAZIL: GRAPHIC FILMS MARKET, BY END-USE INDUSTRY, 2021–2028 (USD MILLION)
  • TABLE 152 BRAZIL: GRAPHIC FILMS MARKET, BY END-USE INDUSTRY, 2021–2028 (MILLION SQUARE METERS)
  • TABLE 153 BRAZIL: GRAPHIC FILMS MARKET, BY FILM TYPE, 2021–2028 (USD MILLION)
  • TABLE 154 BRAZIL: GRAPHIC FILMS MARKET, BY FILM TYPE, 2021–2028 (MILLION SQUARE METERS)
  • TABLE 155 ARGENTINA: GRAPHIC FILMS MARKET, BY PRODUCT TYPE, 2021–2028 (USD MILLION)
  • TABLE 156 ARGENTINA: GRAPHIC FILMS MARKET, BY PRODUCT TYPE, 2021–2028 (MILLION SQUARE METERS)
  • TABLE 157 ARGENTINA: GRAPHIC FILMS MARKET, BY END-USE INDUSTRY, 2021–2028 (USD MILLION)
  • TABLE 158 ARGENTINA: GRAPHIC FILMS MARKET, BY END-USE INDUSTRY, 2021–2028 (MILLION SQUARE METERS)
  • TABLE 159 ARGENTINA: GRAPHIC FILMS MARKET, BY FILM TYPE, 2021–2028 (USD MILLION)
  • TABLE 160 ARGENTINA: GRAPHIC FILMS MARKET, BY FILM TYPE, 2021–2028 (MILLION SQUARE METERS)
  • TABLE 161 REST OF SOUTH AMERICA: GRAPHIC FILMS MARKET, BY PRODUCT TYPE, 2021–2028 (USD MILLION)
  • TABLE 162 REST OF SOUTH AMERICA: GRAPHIC FILMS MARKET, BY PRODUCT TYPE, 2021–2028 (MILLION SQUARE METERS)
  • TABLE 163 REST OF SOUTH AMERICA: GRAPHIC FILMS MARKET, BY END-USE INDUSTRY, 2021–2028 (USD MILLION)
  • TABLE 164 REST OF SOUTH AMERICA: GRAPHIC FILMS MARKET, BY END-USE INDUSTRY, 2021–2028 (MILLION SQUARE METERS)
  • TABLE 165 REST OF SOUTH AMERICA: GRAPHIC FILMS MARKET, BY FILM TYPE, 2021–2028 (USD MILLION)
  • TABLE 166 REST OF SOUTH AMERICA: GRAPHIC FILMS MARKET, BY FILM TYPE, 2021–2028 (MILLION SQUARE METERS)
  • TABLE 167 MIDDLE EAST & AFRICA: GRAPHIC FILMS MARKET, BY COUNTRY, 2021–2028 (USD MILLION)
  • TABLE 168 MIDDLE EAST & AFRICA: GRAPHIC FILMS MARKET, BY COUNTRY, 2021–2028 (MILLION SQUARE METERS)
  • TABLE 169 MIDDLE EAST & AFRICA: GRAPHIC FILMS MARKET, BY PRODUCT TYPE, 2021–2028 (USD MILLION)
  • TABLE 170 MIDDLE EAST & AFRICA: GRAPHIC FILMS MARKET, BY PRODUCT TYPE, 2021–2028 (MILLION SQUARE METERS)
  • TABLE 171 MIDDLE EAST & AFRICA: GRAPHIC FILMS MARKET, BY END-USE INDUSTRY, 2021–2028 (USD MILLION)
  • TABLE 172 MIDDLE EAST & AFRICA: GRAPHIC FILMS MARKET, BY END-USE INDUSTRY, 2021–2028 (MILLION SQUARE METERS)
  • TABLE 173 MIDDLE EAST & AFRICA: GRAPHIC FILMS MARKET, BY FILM TYPE, 2021–2028 (USD MILLION)
  • TABLE 174 MIDDLE EAST & AFRICA: GRAPHIC FILMS MARKET, BY FILM TYPE, 2021–2028 (MILLION SQUARE METERS)
  • TABLE 175 MIDDLE EAST & AFRICA: GRAPHIC FILMS MARKET, BY PRINTING TECHNOLOGY, 2021–2028 (USD MILLION)
  • TABLE 176 MIDDLE EAST & AFRICA: GRAPHIC FILMS MARKET, BY PRINTING TECHNOLOGY, 2021–2028 (MILLION SQUARE METERS)
  • TABLE 177 GCC COUNTRIES: GRAPHIC FILMS MARKET, BY PRODUCT TYPE, 2021–2028 (USD MILLION)
  • TABLE 178 GCC COUNTRIES: GRAPHIC FILMS MARKET, BY PRODUCT TYPE, 2021–2028 (MILLION SQUARE METERS)
  • TABLE 179 GCC COUNTRIES: GRAPHIC FILMS MARKET, BY END-USE INDUSTRY, 2021–2028 (USD MILLION)
  • TABLE 180 GCC COUNTRIES: GRAPHIC FILMS MARKET, BY END-USE INDUSTRY, 2021–2028 (MILLION SQUARE METERS)
  • TABLE 181 GCC COUNTRIES: GRAPHIC FILMS MARKET, BY FILM TYPE, 2021–2028 (USD MILLION)
  • TABLE 182 GCC COUNTRIES: GRAPHIC FILMS MARKET, BY FILM TYPE, 2021–2028 (MILLION SQUARE METERS)
  • TABLE 183 UAE: GRAPHIC FILMS MARKET, BY PRODUCT TYPE, 2021–2028 (USD MILLION)
  • TABLE 184 UAE: GRAPHIC FILMS MARKET, BY PRODUCT TYPE, 2021–2028 (MILLION SQUARE METERS)
  • TABLE 185 UAE: GRAPHIC FILMS MARKET, BY END-USE INDUSTRY, 2021–2028 (USD MILLION)
  • TABLE 186 UAE: GRAPHIC FILMS MARKET, BY END-USE INDUSTRY, 2021–2028 (MILLION SQUARE METERS)
  • TABLE 187 UAE: GRAPHIC FILMS MARKET, BY FILM TYPE, 2021–2028 (USD MILLION)
  • TABLE 188 UAE: GRAPHIC FILMS MARKET, BY FILM TYPE, 2021–2028 (MILLION SQUARE METERS)
  • TABLE 189 REST OF GCC COUNTRIES: GRAPHIC FILMS MARKET, BY PRODUCT TYPE, 2021–2028 (USD MILLION)
  • TABLE 190 REST OF GCC COUNTRIES: GRAPHIC FILMS MARKET, BY PRODUCT TYPE, 2021–2028 (MILLION SQUARE METERS)
  • TABLE 191 REST OF GCC COUNTRIES: GRAPHIC FILMS MARKET, BY END-USE INDUSTRY, 2021–2028 (USD MILLION)
  • TABLE 192 REST OF GCC COUNTRIES: GRAPHIC FILMS MARKET, BY END-USE INDUSTRY, 2021–2028 (MILLION SQUARE METERS)
  • TABLE 193 REST OF GCC COUNTRIES: GRAPHIC FILMS MARKET, BY FILM TYPE, 2021–2028 (USD MILLION)
  • TABLE 194 REST OF GCC COUNTRIES: GRAPHIC FILMS MARKET, BY FILM TYPE, 2021–2028 (MILLION SQUARE METERS)
  • TABLE 195 SOUTH AFRICA: GRAPHIC FILMS MARKET, BY PRODUCT TYPE, 2021–2028 (USD MILLION)
  • TABLE 196 SOUTH AFRICA: GRAPHIC FILMS MARKET, BY PRODUCT TYPE, 2021–2028 (MILLION SQUARE METERS)
  • TABLE 197 SOUTH AFRICA: GRAPHIC FILMS MARKET, BY END-USE INDUSTRY, 2021–2028 (USD MILLION)
  • TABLE 198 SOUTH AFRICA: GRAPHIC FILMS MARKET, BY END-USE INDUSTRY, 2021–2028 (MILLION SQUARE METERS)
  • TABLE 199 SOUTH AFRICA: GRAPHIC FILMS MARKET, BY FILM TYPE, 2021–2028 (USD MILLION)
  • TABLE 200 SOUTH AFRICA: GRAPHIC FILMS MARKET, BY FILM TYPE, 2021–2028 (MILLION SQUARE METERS)
  • TABLE 201 REST OF MIDDLE EAST & AFRICA: GRAPHIC FILMS MARKET, BY PRODUCT TYPE, 2021–2028 (USD MILLION)
  • TABLE 202 REST OF MIDDLE EAST & AFRICA: GRAPHIC FILMS MARKET, BY PRODUCT TYPE, 2021–2028 (MILLION SQUARE METERS)
  • TABLE 203 REST OF MIDDLE EAST & AFRICA: GRAPHIC FILMS MARKET, BY END-USE INDUSTRY, 2021–2028 (USD MILLION)
  • TABLE 204 REST OF MIDDLE EAST & AFRICA: GRAPHIC FILMS MARKET, BY END-USE INDUSTRY, 2021–2028 (MILLION SQUARE METERS)
  • TABLE 205 REST OF MIDDLE EAST & AFRICA: GRAPHIC FILMS MARKET, BY FILM TYPE, 2021–2028 (USD MILLION)
  • TABLE 206 REST OF MIDDLE EAST & AFRICA: GRAPHIC FILMS MARKET, BY FILM TYPE, 2021–2028 (MILLION SQUARE METERS)
  • TABLE 207 OVERVIEW OF STRATEGIES ADOPTED BY KEY GRAPHIC FILM PLAYERS
  • TABLE 208 GRAPHIC FILMS MARKET: DEGREE OF COMPETITION
  • TABLE 209 GRAPHIC FILMS MARKET: END-USE INDUSTRY FOOTPRINT (27 COMPANIES)
  • TABLE 210 GRAPHIC FILMS MARKET: REGIONAL FOOTPRINT (25 COMPANIES)
  • TABLE 211 GRAPHIC FILMS MARKET: COMPANY FOOTPRINT (25 COMPANIES)
  • TABLE 212 GRAPHIC FILMS MARKET: DETAILED LIST OF KEY START-UP/SMES
  • TABLE 213 GRAPHIC FILMS MARKET: COMPETITIVE BENCHMARKING OF KEY START-UP/SMES
  • TABLE 214 PRODUCT LAUNCHES, 2019–2023
  • TABLE 215 DEALS, 2019–2023
  • TABLE 216 AVERY DENNISON CORPORATION: COMPANY OVERVIEW
  • TABLE 217 AVERY DENNISON CORPORATION: DEALS
  • TABLE 218 AVERY DENNISON CORPORATION: PRODUCT LAUNCHES
  • TABLE 219 3M: COMPANY OVERVIEW
  • TABLE 220 3M: DEALS
  • TABLE 221 3M: OTHERS
  • TABLE 222 DUPONT DE NEMOURS, INC.: COMPANY OVERVIEW
  • TABLE 223 DUPONT DE NEMOURS, INC.: DEALS
  • TABLE 224 DUPONT DE NEMOURS, INC.: PRODUCT LAUNCHES
  • TABLE 225 CCL INDUSTRIES.: COMPANY OVERVIEW
  • TABLE 226 CCL INDUSTRIES: PRODUCT LAUNCHES
  • TABLE 227 CCL INDUSTRIES: OTHERS
  • TABLE 228 ORAFOL EUROPE GMBH: COMPANY OVERVIEW
  • TABLE 229 ORAFOL EUROPE GMBH: DEALS
  • TABLE 230 ORAFOL EUROPE GMBH: PRODUCT LAUNCHES
  • TABLE 231 HEXIS S.A.S.: COMPANY OVERVIEW
  • TABLE 232 HEXIS S.A.S.: DEALS
  • TABLE 233 HEXIS S.A.S: PRODUCT LAUNCHES
  • TABLE 234 HEXIS S.A.S.: OTHERS
  • TABLE 235 ARLON GRAPHICS, LLC: COMPANY OVERVIEW
  • TABLE 236 ARLON GRAPHICS, LLC: DEALS
  • TABLE 237 ARLON GRAPHICS, LLC: PRODUCT LAUNCHES
  • TABLE 238 ACHILLES USA INC.: COMPANY OVERVIEW
  • TABLE 239 DUNMORE: COMPANY OVERVIEW
  • TABLE 240 DUNMORE: PRODUCT LAUNCHES
  • TABLE 241 DRYTAC: COMPANY OVERVIEW
  • TABLE 242 DRYTAC: PRODUCT LAUNCHES
  • TABLE 243 LX HAUSYS: COMPANY OVERVIEW
  • TABLE 244 FEDRIGONI S.P.A.: COMPANY OVERVIEW
  • TABLE 245 FEDRIGONI S.P.A.: DEALS
  • TABLE 246 FEDRIGONI S.P.A.: OTHERS
  • TABLE 247 LINTEC CORPORATION: COMPANY OVERVIEW
  • TABLE 248 CONTRA VISION LIMITED: COMPANY OVERVIEW
  • TABLE 249 MATIV: COMPANY OVERVIEW
  • TABLE 250 COSMO FILMS LIMITED: COMPANY OVERVIEW
  • TABLE 251 TAGHLEEF INDUSTRIES: COMPANY OVERVIEW
  • TABLE 252 ACCO BRANDS: COMPANY OVERVIEW
  • TABLE 253 ULTRAFLEX SYSTEMS INC.: COMPANY OVERVIEW
  • TABLE 254 THE GRIFF NETWORK: COMPANY OVERVIEW
  • TABLE 255 BRIDGEHEAD CO., LTD.: COMPANY OVERVIEW
  • TABLE 256 JESSUP MANUFACTURING COMPANY: COMPANY OVERVIEW
  • TABLE 257 GARWARE HI-TECH FILMS LIMITED: COMPANY OVERVIEW
  • TABLE 258 CELADON TECHNOLOGY COMPANY LTD.: COMPANY OVERVIEW
  • TABLE 259 NEKOOSA: COMPANY OVERVIEW
  • TABLE 260 CONTINENTAL GRAFIX USA, INC.: COMPANY OVERVIEW
  • TABLE 261 JIANGSU AOLI NEW MATERIALS CO., LTD.: COMPANY OVERVIEW
  • TABLE 262 LARGE FORMAT PRINTER MARKET, BY REGION, 2019–2022 (USD BILLION)
  • TABLE 263 LARGE FORMAT PRINTER MARKET, BY REGION, 2023–2028 (USD BILLION)
LIST OF FIGURES
 
  • FIGURE 1 GRAPHIC FILMS MARKET SEGMENTATION
  • FIGURE 2 GRAPHIC FILMS MARKET: RESEARCH DESIGN
  • FIGURE 3 GRAPHIC FILMS MARKET: DATA TRIANGULATION
  • FIGURE 4 POLYVINYL CHLORIDE LEAD GRAPHIC FILMS MARKET DURING FORECAST PERIOD
  • FIGURE 5 OPAQUE FILM SEGMENT TO BE LARGEST SEGMENT THROUGH 2028
  • FIGURE 6 PROMOTIONAL & ADVERTISEMENT TO DOMINATE GRAPHIC FILMS MARKET BY 2028
  • FIGURE 7 ASIA PACIFIC TO BE FASTEST-GROWING MARKET IN FORECAST PERIOD
  • FIGURE 8 DEVELOPING COUNTRIES OFFER ATTRACTIVE OPPORTUNITIES IN GRAPHIC FILMS MARKET
  • FIGURE 9 CHINA WAS LARGEST GRAPHIC FILMS MARKET IN 2022
  • FIGURE 10 OPAQUE SEGMENT TO LEAD GRAPHIC FILMS MARKET DURING FORECAST PERIOD
  • FIGURE 11 POLYVINYL CHLORIDE TO BE FASTEST-GROWING SEGMENT DURING FORECAST PERIOD
  • FIGURE 12 FLEXOGRAPHY TO BE FASTEST-GROWING SEGMENT DURING FORECAST PERIOD
  • FIGURE 13 PROMOTIONAL AND ADVERTISEMENT TO LEAD MARKET DURING FORECAST PERIOD
  • FIGURE 14 INDIA GRAPHIC FILMS MARKET TO RECORD HIGHEST CAGR FROM 2023 TO 2028
  • FIGURE 15 DRIVERS, RESTRAINTS, OPPORTUNITIES, AND CHALLENGES IN GRAPHIC FILMS MARKET
  • FIGURE 16 GRAPHIC FILMS MARKET: PORTER’S FIVE FORCES ANALYSIS
  • FIGURE 17 PRODUCTION PROCESS CONTRIBUTES MOST VALUE TO OVERALL PRICE OF GRAPHIC FILMS
  • FIGURE 18 TRENDS /DISRUPTIONS IMPACTING CUSTOMERS' BUSINESSES
  • FIGURE 19 AVERAGE SELLING PRICE TREND OF KEY PLAYERS, BY TOP 3 END-USE INDUSTRIES
  • FIGURE 20 AVERAGE SELLING PRICE TREND, BY REGION
  • FIGURE 21 FLEXOGRAPHY TO REMAIN LARGEST MARKET SEGMENT
  • FIGURE 22 OPAQUE FILMS TO DOMINATE GRAPHIC FILMS MARKET IN 2023
  • FIGURE 23 PROMOTIONAL & ADVERTISEMENT SEGMENT TO ACCOUNT FOR LARGEST MARKET SHARE IN 2023
  • FIGURE 24 POLYVINYL CHLORIDE TO DOMINATE MARKET DURING FORECAST PERIOD
  • FIGURE 25 GRAPHIC FILMS MARKET GROWTH RATE, BY COUNTRY, 2023–2028
  • FIGURE 26 EUROPE: MARKET SNAPSHOT
  • FIGURE 27 ASIA PACIFIC: MARKET SNAPSHOT
  • FIGURE 28 GRAPHIC FILMS MARKET: MARKET SHARE ANALYSIS
  • FIGURE 29 REVENUE ANALYSIS FOR KEY COMPANIES IN GRAPHIC FILMS MARKET IN PAST FIVE YEARS
  • FIGURE 30 COMPANY EVALUATION MATRIX, 2022
  • FIGURE 31 GRAPHIC FILMS MARKET: PRODUCT FOOTPRINT (27 COMPANIES)
  • FIGURE 32 START-UPS/SMES EVALUATION MATRIX: GRAPHIC FILMS MARKET, 2022
  • FIGURE 33 AVERY DENNISON CORPORATION: COMPANY SNAPSHOT
  • FIGURE 34 3M: COMPANY SNAPSHOT
  • FIGURE 35 DUPONT DE NEMOURS, INC.: COMPANY SNAPSHOT
  • FIGURE 36 CCL INDUSTRIES: COMPANY SNAPSHOT
  • FIGURE 37 FEDRIGONI S.P.A.: COMPANY SNAPSHOT

This research involved the use of extensive secondary sources and databases, such as Factiva and Bloomberg, to identify and collect information useful for a technical and market-oriented study of the Graphic film market. Primary sources included industry experts from related industries and preferred suppliers, manufacturers, distributors, technologists, standards & certification organizations, and organizations related to all segments of the value chain of this industry. In-depth interviews have been conducted with various primary respondents, such as key industry participants, subject matter experts (SMEs), executives of key companies, and industry consultants, to obtain and verify critical qualitative and quantitative information as well as to assess growth prospects.

Secondary Research

In the secondary research process, various sources such as annual reports, press releases, and investor presentations of companies; white papers; and publications from recognized websites and databases have been referred to for identifying and collecting information. Secondary research has been used to obtain key information about the industry's supply chain, the total pool of key players, market classification and segmentation according to the industry trends to the bottom-most level, regional markets, and key developments from both market- and technology-oriented perspectives.

Primary Research

The Graphic film market comprises several stakeholders in the supply chain, which include suppliers, processors, and end-product users. Various primary sources from the supply and demand sides of the markets have been interviewed to obtain qualitative and quantitative information. The primary participants from the demand side include key opinion leaders, executives, managers, directors, and CEOs of companies in the Graphic film market. Primary sources from the supply side include associations and institutions involved in the Graphic film industry, key opinion leaders, and processing players.

Following is the breakdown of primary respondents—
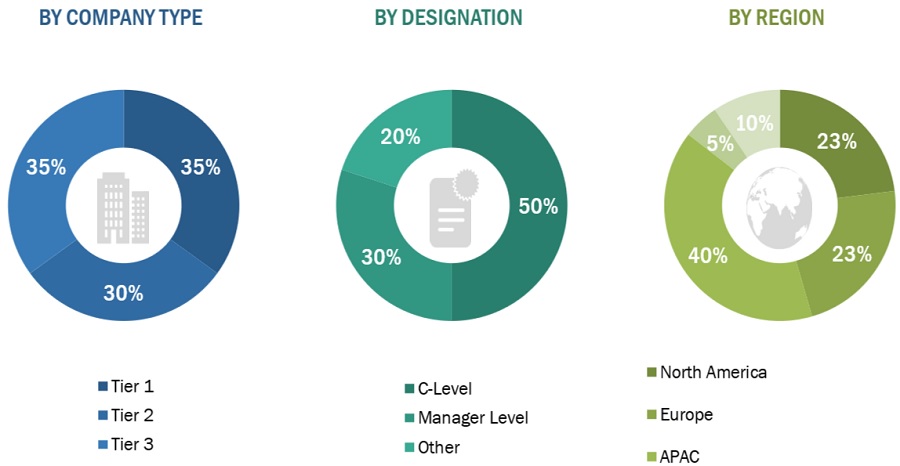
 

Graphic Film Market Size, and Share

To know about the assumptions considered for the study, download the pdf brochure

Market Size Estimation

Both top-down and bottom-up approaches were used to estimate and validate the size of the global Graphic film market. The research methodology used to estimate the market size includes the following:

  • The key players in the industry were identified through extensive secondary research.
  • The supply chain of the industry and market size, in terms of value, were determined through primary and secondary research.
  • All percentage shares split, and breakdowns were determined using secondary sources and verified through primary sources.
  • All possible parameters that affect the markets covered in this research study were accounted for, viewed in extensive detail, verified through primary research, and analyzed to obtain the final quantitative and qualitative data.
  • The research includes the study of reports, reviews, and newsletters of key industry players along with extensive interviews with key officials, such as directors and marketing executives.

Market Size Estimation: Bottom-Up Approach
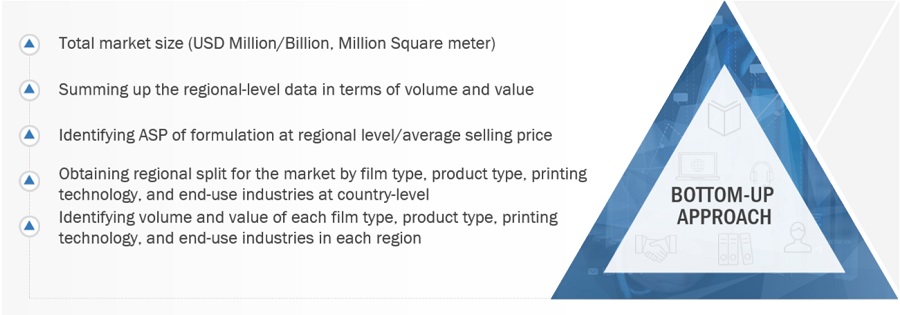
Graphic Film Market Size, and Share

To know about the assumptions considered for the study, Request for Free Sample Report

Market Size Estimation: Top-Down Approach
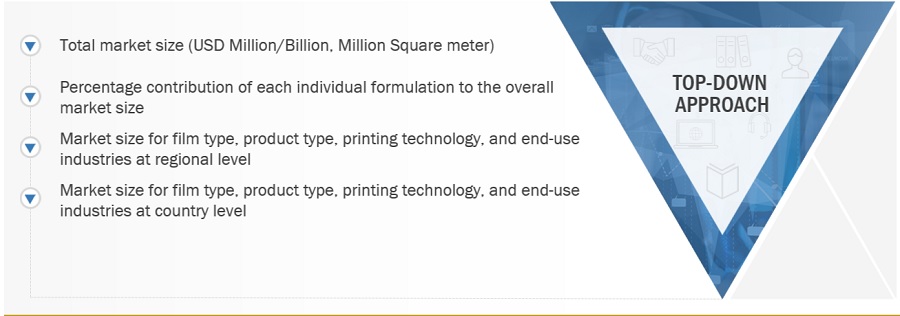
Graphic Film Market Size, and Share

Data Triangulation

After arriving at the total market size from the estimation process explained above, the overall market was split into several segments and subsegments. To complete the overall market size estimation process and arrive at the exact statistics for all segments and subsegments, the data triangulation and market breakdown procedures have been employed, wherever applicable. The data have been triangulated by studying various factors and trends from both the demand and supply sides. In addition, the market size has been validated by using both the top-down and bottom-up approaches.

Market Definition

A graphic film is a polymer-based sheet or layer designed for the efficient storage of diverse data, labels, and product security information. Functioning as a protective layer, it not only safeguards the content but also elevates the visual allure of the product. These films come in several product types like polypropylene, polyvinyl chloride, polyethylene, and others. There are several printing methods such as flexography and rotogravure, offset, and digital, which can be used to print the thunks or drawings over the surface of the film.

Key Stakeholders

  • Material Suppliers and Producers
  • Regulatory Bodies
  • End User
  • Research and Development Organizations
  • Industrial Associations
  • Graphic film manufacturers, dealers, traders, and suppliers.

Report Objectives

  • To define, describe, and forecast the global Graphic film market in terms of value and volume.
  • To provide insights regarding the significant factors influencing the growth of the market (drivers, restraints, opportunities, and challenges)
  • To analyze and forecast the market based on film type, product type, printing methods, manufacturing processes, end-use industries, and region
  • To forecast the market size, in terms of value and volume, with respect to five main regions: North America, Europe, Asia Pacific, South America, and Middle East & Africa.
  • To analyze the opportunities in the market for stakeholders and provide details of the competitive landscape.
  • To strategically profile key players in the market.
  • To analyze competitive developments in the market, such as new product launches, capacity expansions, and mergers & acquisitions.
  • To strategically profile the leading players and comprehensively analyze their key developments in the market.

Available Customizations:

Along with the given market data, MarketsandMarkets offers customizations as per the specific needs of the companies. The following customization options are available for the report:

Product Analysis:

  • Product Matrix which gives a detailed comparison of the product portfolio of each company

Regional Analysis:

  • Further breakdown of the Rest of the APAC Graphic film market
  • Further breakdown of the Rest of Europe’s Graphic film market

Company Information:

  • Detailed analysis and profiling of additional market players (up to 5)
Custom Market Research Services

We will customize the research for you, in case the report listed above does not meet with your exact requirements. Our custom research will comprehensively cover the business information you require to help you arrive at strategic and profitable business decisions.

Request Customization
Report Code
PK 5574
Published ON
Nov, 2023
Choose License Type
BUY NOW
  • SHARE
X
Request Customization
Speak to Analyst
Speak to Analyst
OR FACE-TO-FACE MEETING
PERSONALIZE THIS RESEARCH
  • Triangulate with your Own Data
  • Get Data as per your Format and Definition
  • Gain a Deeper Dive on a Specific Application, Geography, Customer or Competitor
  • Any level of Personalization
REQUEST A FREE CUSTOMIZATION
LET US HELP YOU!
  • What are the Known and Unknown Adjacencies Impacting the Graphic Film Market
  • What will your New Revenue Sources be?
  • Who will be your Top Customer; what will make them switch?
  • Defend your Market Share or Win Competitors
  • Get a Scorecard for Target Partners
CUSTOMIZED WORKSHOP REQUEST
knowledgestore logo

Want to explore hidden markets that can drive new revenue in Graphic Film Market?

Find Hidden Markets
  • Call Us
  • +1-888-600-6441 (Corporate office hours)
  • +1-888-600-6441 (US/Can toll free)
  • +44-800-368-9399 (UK office hours)
CONNECT WITH US
ABOUT TRUST ONLINE
©2024 MarketsandMarkets Research Private Ltd. All rights reserved
DMCA.com Protection Status
Website Feedback