Food Certification Market

Report Code FB 3386
Published in Nov, 2024, By MarketsandMarkets™
Download PDF

Choose License Type

Buy Report Now Inquire Before Buying

Food Certification Market by Certification Type (Safety & Quality Certifications, Dietary & Lifestyle Certification), Application, End-User, Certification Scope, Price Sensitivity and Region - Global Forecast to 2029


Overview

The global market for food certification has been estimated to be USD 5.85 billion in 2024 and is projected to grow USD 7.72 in 2029 at a rate of 5.7% between 2024 and 2029.

Food safety is becoming a critical focus throughout the supply chain, presenting significant business opportunities in the food certification market. As consumers increasingly prioritize safe food, the demand for certifications has surged. Food certification plays a vital role in food processing and production, enhancing consumer confidence by ensuring safety and quality standards. These certifications cover compliance across food safety, packaging, materials, storage, and distribution for producers, manufacturers, and distributors. Growing consumer awareness has prompted major global retailers to require supplier certifications like ISO 22000, SQF, BRC, IFS, USDA Organic, Halal, and Kosher. International trade has further fueled market growth, particularly in developing countries, as they need to comply with the food standards of importing nations. As food safety risks persist across the supply chain, certification demand continues to rise, driving market expansion.

Food manufacturers are increasingly investing in more resources for audit and certification of food products to gain a competitive advantage, which, in turn, is projected to drive the market growth. The global food certification market is also growing due to its presence in a wide range of applications and increased demand for food products that are organic, kosher certified, and halal certified. However, false labeling and certification remain a major concern in the food certification market.

Food Certification Market

Attractive Opportunities in the Food Certification Market

EUROPE

Europe accounted for the largest market share in 2023, while Germany is expected to dominate the Europe food certification market.

The market growth in Europe is attributed to the stringent regulations regarding food safety.

The increase in demand for organic and free-from certifications offers lucrative opportunities for market players in the next five years.

The growth of this market is attributed to the increase in instances of foodborne outbreaks.

The market growth in Europe is attributed to the increase in government initiatives to monitor food safety and quality.

Global Food Certification Market Dynamics

Drivers: Consumer demand for food transparency and credibility

Consumer demand for transparency is significantly shaping the food industry. Many consumers are opting for healthier ingredients, fresher products, and options that reduce environmental impact, both in food and packaging. Premium products are associated with specific sources of raw materials, high quality, good manufacturing practices, and natural ingredients. There is an increasing demand for premium, branded, and well-labeled products as consumers seek a healthier lifestyle. This trend of premiumization among manufacturers is expected to encourage consumer demand for certified food products.

Stakeholders are focusing on certifications to enhance product transparency and foster long-term customer loyalty. As consumer preference for ingredient traceability grows, there is a projected increase in demand for "free-from" certifications, including allergen-free, organic, and non-GMO labels. This rising interest in certification labels further encourages manufacturers and brands to adopt them, aligning with the needs of their target consumers. In a survey conducted by the International Food Information Council Foundation (IFICF) regarding food safety and low-calorie sweeteners, 30% of respondents believe that companies should be responsible for reviewing the safety of these products. While most respondents hold the government accountable, a notable percentage also believe that manufacturers and sellers should share this responsibility. Additionally, one-quarter of participants expressed uncertainty about who should ensure the safety of low-calorie sweeteners.

This perception that companies should oversee safety reviews could potentially influence the food certification market. If a significant number of consumers and stakeholders feel that companies should shoulder this responsibility, it may lead to an increased demand for certifications and regulatory standards focused specifically on the safety assessment of low-calorie sweeteners. This could create new opportunities for certification bodies and regulatory agencies to develop specialized certifications and guidelines to ensure the safety of these products. Furthermore, companies in the low-calorie sweetener market may seek these certifications to build consumer trust and differentiate themselves from competitors, thereby driving growth in the food certification market in this area..

Restraints: Lack of Harmonization in Food Certification Standards and Guidelines

Consumer demand for safe food products has been steadily increasing, leading to the development of numerous food safety standards. However, the rise in national food safety management standards has resulted in confusion and highlighted the urgent need for harmonization among them. Leading companies in the food sector have recognized the costs and inefficiencies associated with having multiple safety standards. Audits are conducted to ensure compliance with government regulations. However, neither ingredient suppliers nor retailers benefit from the duplication of standards and audits, which raises certification costs without enhancing food safety.

Industrial experts frequently recommend implementing uniform and harmonized food safety standards to streamline the existing laws and make them more efficient. To eliminate redundancy and overlap among various standards, collaboration between government and private-sector stakeholders is essential in creating transparent and uniform food certification standards. In both developed and developing countries, there remains a significant lack of harmony regarding regulations on GMOs, allergens, and other contaminants or labeling practices. There have been instances where food products from developed nations are banned in other developed or developing countries due to these inconsistencies..


Opportunities: Adoption of halal, organic, and ‘free-from’ food certifications

With the rise in awareness of food frauds, consumers prefer paying additional for certified organic food products. With the increase in consumer demand and the number of food frauds in organic food products, organic food certification is projected to offer key opportunities for manufacturers in the food certification market. A shift in consumer preference toward non-GMO, allergen-free, and dairy-free products is projected to drive the demand for ‘free-from’ certified food products, which further drives the growth of the market. The increase in disposable income in Muslim-based countries, such as the Middle East, is projected to drive the adoption of halal certifications. As consumer concerns regarding meat consumption are rising, the demand for halal-certified meat products is projected to increase. According to the World Halal Forum, the global halal market is presently worth 16% of the entire global food industry and accounts for 20% of global food products trade.

Organic Certification

According to the USDA, the US organic food industry was valued at USD 35 billion in 2014 and is projected to grow at a high rate till 2030. According to the USDA, a notable increase in certified organic operations was recorded in the US. The organic industry includes nearly 24,650 certified organic operations in the US and 37,032 operations around the world, as of 2017. A significant increase of 13% was recorded in certified organic farms and businesses in the US from 2015 to 2016. The increase in demand for organic products is projected to offer high-value opportunities for the growth of the food certification market. The US, Germany, France, China, Canada, Italy, and the UK are some of the largest markets for organic food.

Challenges: Instances of false labeling and certifications among companies

The increase in adulteration of food and food ingredients has led to a rise in the number of food fraud cases, false labeling, and certifications. Although most food fraud cases do not pose a public health risk, most food frauds involve the substitution of a high-value ingredient with a low-quality alternative. The concerns regarding frauds are increasing as certain incidents go undetected. According to the Grocery Manufacturers Association, the burden of frauds on the global food industry is between USD 10 billion to USD 15 billion and impacts nearly 10% of all commercially sold products. The FDA recognizes third-party audits and certifications to address food frauds. However, false labeling claims are still a major challenge for the food certification market.

With the increase in demand for commodities, false promises of certification have been a major concern. According to FoodNavigator Asia, many factories in Malaysia were found to be producing food products with fake halal logos. The standardization of logos of certified food products across all states would certainly help in overcoming the false certification cases. False organic and Protected Designation of Origin labels have continued to be a major problem for the European food industry, further challenging the growth of the food certification market.

Below are a few cases of false halal certifications:

  • In 2011, a lawsuit in the US alleged that McDonald’s (US) is advertising and selling non-Halal chicken as Halal-certified products.
  • In 2011, a case was exposed, according to which Super King Market in Anaheim (US) was allegedly selling misleading advertisements for generic and mixed meat as Halal-certified products.
  • In 2012, the Islamic Food and Nutrition Council of America (IFANCA) found that a company name on the Halal certificate was changed for a client in China.
  • In 2015, media reports in Malaysia claimed that halal certificates are available for sale in Malaysia at a price as low as USD 55–58.
  • On December 15, 2014, Iowa-based food supplier Midamar Corp was charged with falsely selling $4.9 million worth of beef as halal, exporting non-halal products to countries like Malaysia, Kuwait, and the UAE, leading to fraud indictments against its directors.
  • In 2016, the Halal Monitoring Committee of the UK claimed that a duplicate logo of their logo was used by a company in Romania for selling meat products in France.
  • On November 18, 2023, the Uttar Pradesh, India, police filed an FIR against several companies for selling products with fake halal certifications, as the Yogi Adityanath government considers a potential ban on halal certification in the state.

More News on Halal Certifications:

  • The April 24, 2023, legal action against USA Halal Foods for repeated food safety violations highlights the growing demand for certified halal products that comply with strict regulatory standards. As consumer interest in halal-certified meat and poultry continues to rise, particularly within diverse populations, the importance of transparency, proper labeling, and USDA inspections becomes paramount. This case emphasizes that halal certification alone is not sufficient; it must be backed by compliance with federal food safety laws to ensure both religious and safety standards are met, reinforcing consumer trust in the halal market.
  • The October 9, 2023, bribery scandal in the US halal certification industry underscores significant challenges in the market, including monopolistic practices and rising certification costs. The exclusive control by IS EG Halal over certifications for meat exports to Egypt disrupted long-established certifiers, resulting in a sharp increase in certification fees. This has created financial strain for both exporters and consumers, highlighting vulnerabilities in the halal certification process and the need for greater transparency and competition. These factors could impact market growth, pricing structures, and consumer confidence in certified halal products

Global Food Certification Market Ecosystem Analysis

The food certification market ecosystem involves a diverse group of stakeholders, including certification bodies (such as ISO, BRC, SQF, IFS and other certifications), regulatory authorities, providers of food safety testing equipment, government agencies, food and beverage manufacturers, retailers, and supply chain participants like growers, processors, and distributors. Government bodies and regulatory authorities are responsible for establishing and enforcing food safety and quality standards to ensure compliance with both national and international regulations. Certification bodies provide auditing services to verify that companies meet these standards. Meanwhile, food safety testing equipment providers supply essential tools for accurate testing throughout the supply chain. Manufacturers and retailers pursue certifications to build consumer trust and fulfill regulatory requirements. Logistics providers and suppliers play a key role in maintaining certified processes across the food supply chain. This collaborative ecosystem enables ongoing monitoring and certification of food products, driving growth in the market.

Top Companies in Food Certification Market
 

The meat, poultry & seafood segment accounted the largest during the forecast period.

Meat and meat products fall under high-risk food categories. They are highly susceptible to bacterial growth and microbial contamination. The significant increase in meat consumption over recent years underscores the necessity for stringent food certification standards to ensure the safety and authenticity of meat, including Halal and Kosher options. According to the FAO, global meat production in 2020 remained steady at approximately 328 million metric tons (Mt). Increased production of poultry and sheep meat balanced the decline in pig and bovine meat production. Poultry meat production reached an estimated 134 Mt, representing a 1.2% growth compared to 2019, driven largely by high demand in China. The outbreak of African Swine Fever (ASF) notably impacted pig meat production in East Asia, especially in China, leading to reduced output. Additionally, several major producing countries, including Australia, New Zealand, and the European Union, faced declines in bovine meat production due to limited availability of slaughter animals and regulations regarding animal welfare, purchasing, and transportation in countries like India.

In 2020, global meat imports are projected to have reached 36.3 Mt, reflecting a year-on-year growth of 6.3%, primarily propelled by increased imports from China due to ASF. However, when excluding China, global meat imports dropped by 1.4 Mt or 4.3%. Key exporting countries such as Brazil, Canada, the European Union, Russia, and the United States have met the rising demand for imported meat..

The ISO 22000 certification accounted the largest during the forecast period

ISO 22000 is a derivative of ISO 9001, which is part of a family of standards developed by the International Organization for Standardization (ISO). ISO certification is crucial in the food industry, as it ensures that food products and processes comply with internationally recognized standards. To achieve certification, businesses must meet specific guidelines and criteria outlined by ISO, such as ISO 22000 for food safety management systems. The significance of ISO certification in the food industry is immense. It establishes credibility and fosters trust among consumers and stakeholders. When a food company displays the ISO certification logo, it signals a commitment to producing safe, high-quality products. Consumers are more inclined to trust and choose products from certified companies, knowing that their health and safety are prioritized.

ISO certification also aids organizations in streamlining their processes and enhancing efficiency. By implementing ISO standards, companies develop effective food safety management systems, ensuring proper hazard control at every stage of the supply chain. This reduces the likelihood of contamination, recalls, or product defects, saving both time and resources. An ISO 22000-certified manufacturer ensures that products are produced in safe environments and comply with established standards. For example, as part of its approval process, Atlas Copco (Sweden) evaluates its sub-suppliers to eliminate potential hazards. This certification is among the most important in addressing food safety hazards in the food and beverage industry. ISO 22000 provides advantages to the food supply chain by identifying and managing safety risks, offering preventive and corrective measures for food safety management, and reducing or eliminating the risk of food recalls.

North America dominated the food certification market during the forecast period.

The market in the region is primarily driven by stringent food safety regulations imposed by governments in North American countries for imported goods. In 2022, the US dominated the North American market, holding an 86% share. Initiatives by the US government regarding certification and accreditation services provided by organizations such as the ANSI-ASQ National Accreditation Board (ANAB) and the American National Standards Institute (ANSI) are expected to boost the growth of the food certification market in the country. Additionally, the US government promotes various food certifications, including Safe Food Quality (SQF), GlobalGAP, British Retail Consortium (BRC), International Featured Standards (IFS), HACCP, and ISO 22000. This promotion is another key factor contributing to the growth of the food certification market in the US.

HIGHEST CAGR MARKET IN 2024-2029
US FASTEST GROWING MARKET IN THE REGION
Food Certification Market Size and Share

Recent Developments of Food Certification Market

  • April 2023, Acquisition, Intertek Group plc, Analitico Análises Técnicas Ltda (Brazil). The acquisition of Controle Analítico provides an appealing and complementary opportunity for Intertek Group plc to enhance its leading Food and Agri Total Quality Assurance (TQA) solutions in Brazil by broadening its presence and service offerings in the environmental testing market.
  • In July 2022, DNV has acquired The Registrar Company (TRC), a family-owned certification body providing certification and training services to SMEs in North America. The acquisition expands and strengthens DNV’s certification and training services to small and medium enterprises in North America.
  • In January 2022, Bureau Veritas has entered into an agreement with Avena Foods Limited to provide onsite laboratory testing services at their Avena Purity Protocol facility located in Regina, SK, Canada. This partnership will help Bureau Veritas in expanding its testing laboratories that service the agri-food market in North America.
  • In September 2020, ALS expanded its scope of accreditation to include its new food laboratory under the American Association for Laboratory Accreditation (A2LA) satellite program, which would help in the expansion of the company’s testing and certification services.

Key Market Players

List of Top Food Certification Market Companies

The Food Certification Market is dominated by a few major players that have a wide regional presence. The major players in the Food Certification Market are

Want to explore hidden markets that can drive new revenue in Food Certification Market?

Scope of the Report

Report Attribute Details
Market size available for years 2024–2029
Base year considered 2023
Forecast period 2024–2029
Forecast units USD Billion
Segments Covered By Certification Type, Application, End-user, Certification Scope, Price Sensitivity
Regions covered North America, Europe, Asia Pacific, South America and RoW


Key Questions Addressed by the Report

Which region is projected to account for the largest share in the food certification market?
Europe dominated the food certification market, worth USD 2.08 billion in 2023, and is projected to reach USD 2.82 billion by 2029, at a CAGR of 5.3% during the forecast period.
What is the current size of the global food certification market?
The global food certification market was valued at USD 5.85 billion in 2024. It is projected to reach USD 7.72 billion by 2029, recording a CAGR of 5.7% during the forecast period.
Who are the key players in the market?
The key players in this market include DEKRA (Germany), SGS (France), Intertek Group plc (UK), AsureQuality (New Zealand), and Bureau Veritas (France), LQRA (UK), DNV (Norway), TÜV SÜD (Germany), Kiwa (Netherlands), ALS (US), UL LLC (US), EAGLE Certification Group (US), INTL Certification Limited (UK), Assurecloud (Africa) and Control Union Certifications (Netherlands).
What are the factors driving the food certification market?
Increased Focus on Food Safety: As globalization continues to expand, ensuring food safety has become essential, leading to a greater need for certifications.
Consumer Demand for Transparency: Certifications like organic, non-GMO, and fair trade respond to consumers' desire for transparent and clean labels.
Regulatory Compliance: Governments around the world are implementing stricter food safety regulations, which is driving growth in the certification market..
Which segment accounted for the largest food certification market share?
ISO 22000 Cetification segment accounted for the largest market share in the certification type in forecast period.


Personalize This Research

  • Triangulate with your Own Data
  • Get Data as per your Format and Definition
  • Gain a Deeper Dive on a Specific Application, Geography, Customer or Competitor
  • Any level of Personalization
Request A Free Customisation

Let Us Help You

  • What are the Known and Unknown Adjacencies Impacting the Food Certification Market
  • What will your New Revenue Sources be?
  • Who will be your Top Customer; what will make them switch?
  • Defend your Market Share or Win Competitors
  • Get a Scorecard for Target Partners
Customized Workshop Request

Table of Contents

Exclusive indicates content/data unique to MarketsandMarkets and not available with any competitors.

TITLE
PAGE NO
INTRODUCTION
37
RESEARCH METHODOLOGY
42
EXECUTIVE SUMMARY
51
PREMIUM INSIGHTS
57
MARKET OVERVIEW
64
  • 5.1 INTRODUCTION
  • 5.2 MACROECONOMIC INDICATORS
    INCREASE IN INSTANCES OF FOODBORNE ILLNESS
    INCREASE IN FOOD RECALL CASES
  • 5.3 MARKET DYNAMICS
    DRIVERS
    - Increase in trade restriction due to food contamination in European countries
    - Rising demand for food safety assurances due to growing consumption of high-risk category food products
    - Increase in global trade of food products
    - Strict food industry standards and certification requirements
    - Consumer demand for food transparency and credibility
    - Food quality certification scheme
    - Ease of certification and auditing to drive market growth for outsourced certifications
    RESTRAINTS
    - Lack of infrastructure and financial support for food safety and security in developing countries
    - Lack of harmonization in food certification standards and guidelines
    OPPORTUNITIES
    - Growing popularity of various domestic foodservice and retail chains
    - Increase in budget allocation and spending to enhance food safety
    - Adoption of halal, organic, and "free-from" food certifications
    - Increasing trend of outsourcing certifications from third-party providers
    - Food processing industry focusing on mandating food safety management practices
    - Rise in food trade among developing countries
    CHALLENGES
    - Instances of false labeling and certifications among companies
    - Insufficient resources, limited awareness, and lack of financial support among small-scale manufacturers
  • 5.4 IMPACT OF GEN AI ON FOOD CERTIFICATION MARKET
    USE OF GEN AI IN FOOD CERTIFICATION MARKET
    CASE STUDY ANALYSIS
    - SGS harnessed AI for early warning detection
    - DEKRA conducted remote audits with AI to maintain safety standards
    IMPACT OF GEN AI ON ADJACENT ECOSYSTEM
INDUSTRY TRENDS
79
  • 6.1 INTRODUCTION
  • 6.2 TRENDS/DISRUPTIONS IMPACTING CUSTOMER BUSINESS
  • 6.3 PRICING ANALYSIS
    INDICATIVE PRICING ANALYSIS
  • 6.4 VALUE CHAIN ANALYSIS
    RAW MATERIAL SUPPLIERS
    FOOD PROCESSORS & MANUFACTURERS
    PACKAGING & LABELING
    DISTRIBUTION & LOGISTICS
    RETAILERS & FOODSERVICE PROVIDERS
    END CONSUMERS
  • 6.5 SUPPLY CHAIN ANALYSIS
  • 6.6 ECOSYSTEM/MARKET MAP
  • 6.7 TECHNOLOGY ANALYSIS
    DIGITAL CERTIFICATIONS
    THIRD-PARTY CERTIFICATIONS
    BLOCKCHAIN FOR CERTIFICATION VERIFICATION
    REGULATORY IMPOSITIONS ON GENETICALLY MODIFIED LABELS
    INTRODUCTION OF GLOBAL FOOD SAFETY INITIATIVES (GFSI)
    RAPID ALERT SYSTEMS FOR FOOD AND FEED (RASFF) TO REPORT FOOD SAFETY ISSUES
  • 6.8 KEY CONFERENCES AND EVENTS IN 2024–2025
  • 6.9 TARIFF AND REGULATORY LANDSCAPE
    REGULATORY BODIES, GOVERNMENT AGENCIES, AND OTHER ORGANIZATIONS
  • 6.10 PORTER’S FIVE FORCES ANALYSIS
    INTENSITY OF COMPETITIVE RIVALRY
    BARGAINING POWER OF SUPPLIERS
    BARGAINING POWER OF BUYERS
    THREAT OF SUBSTITUTES
    THREAT OF NEW ENTRANTS
  • 6.11 KEY STAKEHOLDERS AND BUYING CRITERIA
    KEY STAKEHOLDERS IN BUYING PROCESS
    BUYING CRITERIA
  • 6.12 INVESTMENT AND FUNDING SCENARIO
  • 6.13 CASE STUDY ANALYSIS
    EUROPEAN TESTING, INSPECTION, AND CERTIFICATION COMPANY PENETRATED NEW REVENUE POCKETS WORTH NEARLY USD 80–100 MILLION WITH FOOD CERTIFICATION
    - Title
    - Problem statement
    - MnM approach
    - Revenue Impact (RI)
    ENVIRONMENTAL TESTING LABORATORY ENHANCED ITS POTENTIAL REVENUE GENERATION WITH FOOD CERTIFICATION
    - Title
    - Problem statement
    - MnM approach
    - Revenue Impact (RI)
    FOOD SAFETY TESTING SERVICE PROVIDER EXPANDED IN AUSTRALIAN AND SOUTHEAST ASIAN MARKETS
    - Title
    - Problem statement
    - MnM approach
    - Revenue Impact (RI)
FOOD CERTIFICATION MARKET, BY TYPE
100
  • 7.1 INTRODUCTION
  • 7.2 SAFETY & QUALITY CERTIFICATIONS
    NEED FOR CONSUMER TRUST AND MAINTAINING FOOD SAFETY STANDARDS TO DRIVE GROWTH FOR SAFETY AND QUALITY CERTIFICATIONS
    ISO 22000
    - Growing adoption of ISO 22000 certifications to meet international safety and quality standards
    BRITISH RETAIL CONSORTIUM (BRC) GLOBAL STANDARDS
    - BRC certification to be considered as benchmark for best food safety practices
    INTERNATIONAL FEATURED STANDARDS (IFS)
    - Need for evaluation of supplier compliance with stringent food safety and quality requirements to propel market
    SAFE QUALITY FOOD (SQF) CERTIFICATIONS
    - Rising demand for SQF certification program to meet regulatory commercial food quality criteria
  • 7.3 DIETARY & LIFESTYLE CERTIFICATIONS
    RISING DEMAND FOR DIETARY AND LIFESTYLE CERTIFICATIONS TO MEET GLOBAL CONSUMER PREFERENCES FOR HALAL, KOSHER, AND 'FREE-FROM' FOODS
    HALAL
    - Concerns regarding safety and hygiene of halal products to fuel demand for food certification
    KOSHER
    - Globalization and expansion of multinational companies to promote growth of food certification market
    ‘‘FREE-FROM’ CERTIFICATIONS
    - Growing consumer preference for organic and natural products to boost demand for free-from certifications
  • 7.4 OTHER CERTIFICATION TYPES
FOOD CERTIFICATION MARKET, BY APPLICATION
113
  • 8.1 INTRODUCTION
  • 8.2 MEAT, POULTRY, AND SEAFOOD PRODUCTS
    RISING CONSUMPTION OF PROCESSED MEAT PRODUCTS TO DRIVE GROWTH
    FRESH
    - Rising demand for ensuring safety of fresh meat, poultry, and seafood products to fuel market growth
    FROZEN
    - Growing instances of microbial contamination to drive demand for ensuring product safety, quality, and compliance with international standards
    PROCESSED
    - Need to enhance consumer trust and minimize risk of contamination to foster market growth
  • 8.3 DAIRY PRODUCTS
    STRINGENT CERTIFICATION REQUIREMENTS FOR DAIRY PRODUCT EXPORTS TO PROPEL MARKET GROWTH
  • 8.4 INFANT FOOD PRODUCTS
    NEED TO SAFEGUARD YOUNG CHILDREN AND PROMOTE HEALTHY NUTRITION TO STIMULATE MARKET GROWTH
  • 8.5 BAKERY & CONFECTIONERY PRODUCTS
    NEED TO OBTAIN VOLUNTARY CERTIFICATIONS TO ENHANCE CONSUMER CONFIDENCE TO ACCELERATE MARKET GROWTH
  • 8.6 BEVERAGES
    GROWING BEVERAGE CERTIFICATIONS TO BOOST CONSUMER TRUST AND DRIVE MARKET EXPANSION
    ALCOHOLIC BEVERAGES
    - Need to avoid adulteration and inconsistent quality to drive demand for certifications in alcoholic beverages
    NON-ALCOHOLIC BEVERAGES
    - Certifications to provide traceability and validate authenticity of non-alcoholic beverages
  • 8.7 ‘FREE-FROM’ FOODS
    GROWING AWARENESS OF HEALTH BENEFITS ASSOCIATED WITH AVOIDING CERTAIN INGREDIENTS OR ADDITIVES TO PROPEL MARKET EXPANSION
    FRUITS & VEGETABLES
    - Need to ensure safety and quality of fruits and vegetables to expand market growth
    FRESH PRODUCE
    - Certification to play crucial role for ensuring compliance with strict farming practices
    DRIED FRUITS & NUTS
    - Certification to guarantee dried fruit manufacturers adhere to strict quality standards and ensure safe handling practices
  • 8.8 FROZEN FRUITS & VEGETABLES
    NEED FOR FROZEN FRUITS AND VEGETABLES CERTIFICATION TO VERIFY SAFE PROCESS AND STORE AND PRESERVE NUTRITIONAL QUALITY AND SAFETY
  • 8.9 NUTRACEUTICALS & SUPPLEMENTS
    INCREASING AWARENESS OF HEALTH AND WELLNESS TO BOOST MARKET GROWTH
  • 8.10 OTHER APPLICATIONS
FOOD CERTIFICATION MARKET, BY END USER
129
  • 9.1 INTRODUCTION
  • 9.2 FOOD & BEVERAGE MANUFACTURERS
    NEED TO BUILD CONSUMER TRUST BY PROVIDING CLEAR AND CREDIBLE PROOF THAT THEIR PRODUCTS ADHERE TO SPECIFIC, RECOGNIZED STANDARDS TO DRIVE MARKET
  • 9.3 RETAIL & SUPERMARKETS
    CERTIFICATIONS LIKE FAIR TRADE AND NON-GMO TO HELP PREVENT UNSAFE PRACTICES AND ENSURE PROPER LABELING TO PROPEL MARKET
  • 9.4 RESTAURANTS & FOODSERVICE CHAINS
    CERTIFICATIONS LIKE ALLERGEN-FREE AND ORGANIC LABELS TO UPHOLD HEALTH STANDARDS AND TRUST
  • 9.5 GROWERS
    CERTIFICATIONS TO DEMONSTRATE THAT PRODUCTS MEET SPECIFIC AGRICULTURAL, ENVIRONMENTAL, AND QUALITY STANDARDS
  • 9.6 OTHER END USERS
FOOD CERTIFICATION MARKET, BY CERTIFICATION SCOPE
137
  • 10.1 INTRODUCTION
  • 10.2 SINGLE PRODUCT CERTIFICATION
    SINGLE PRODUCT CERTIFICATION TO ENSURE IT MEETS INDUSTRY STANDARDS FOR SAFETY, QUALITY, AND REGULATORY COMPLIANCE
  • 10.3 MULTIPLE PRODUCT CERTIFICATION
    MULTIPLE PRODUCT CERTIFICATION TO PROVIDE DIVERSE ARRAY OF PRODUCTS ACROSS DIFFERENT CATEGORIES
  • 10.4 COMPANY-WIDE CERTIFICATION
    COMPANY-WIDE CERTIFICATION TO ENHANCE OVERALL OPERATIONS AND PROCESSES WITHIN ORGANIZATION
FOOD CERTIFICATION MARKET, BY PRICE SENSITIVITY
142
  • 11.1 INTRODUCTION
  • 11.2 PREMIUM CERTIFICATIONS
    PREMIUM CERTIFICATIONS TO ADDRESS MARKETS WITH STRICT QUALITY OR ETHICAL NEEDS
  • 11.3 COST-EFFECTIVE CERTIFICATIONS
    COST-EFFECTIVE CERTIFICATIONS TO ENSURE COMPLIANCE WITH INDUSTRY SAFETY AND QUALITY STANDARDS
FOOD CERTIFICATION MARKET, BY REGION
146
  • 12.1 INTRODUCTION
  • 12.2 NORTH AMERICA
    US
    - Robust framework for food certification and strict regulatory standards to drive market
    CANADA
    - US mandate requiring Canadian exporters to meet updated US food safety standards and growing demand for healthy, organic foods compliance to propel market
    MEXICO
    - Rising instances of foodborne illness and establishment of Good Agricultural Practices (GAP) framework to fuel market growth
  • 12.3 EUROPE
    UK
    - Consumer shift toward premium products to boost demand for food certification
    GERMANY
    - High purchasing power among consumers to enable them to opt high-quality food products
    FRANCE
    - High emphasis on quality standards and focus on food safety to foster market growth
    ITALY
    - High consumption of bakery and dairy products to bolster adoption of food safety measures
    SPAIN
    - Stringent quality control procedures for food products and rising consumer awareness regarding food quality and safety to propel market
    POLAND
    - Rise in processed food consumption and adherence to EU regulations for food and agricultural imports to drive market
    REST OF EUROPE
  • 12.4 ASIA PACIFIC
    CHINA
    - Increased food adulteration and fraud incidents in non-vegetarian products to drive growth
    INDIA
    - Growing need to comply with international standards for food products to implement strong food safety practices
    JAPAN
    - Growing demand to adopt food safety measures due to health benefits to boost market growth
    SOUTH KOREA
    - Increase in control over imported food safety hazards to foster market growth
    AUSTRALIA & NEW ZEALAND
    - Companies to adopt food safety measures due to enforced regulations
    REST OF ASIA PACIFIC
  • 12.5 REST OF THE WORLD (ROW)
    MIDDLE EAST
    - Significant increase in demand for halal food products driven by religious beliefs to fuel market growth
    SOUTH AFRICA
    - Growing demand for organic products to fuel market expansion
    REST OF AFRICA
  • 12.6 SOUTH AMERICA
    BRAZIL
    - Stringent regulations imposed by Animal and Plant Health Inspection Service (APHIS) to augment market growth
    ARGENTINA
    - Increased trade of food and agricultural products to fuel demand for food certifications
    REST OF SOUTH AMERICA
COMPETITIVE LANDSCAPE
243
  • 13.1 OVERVIEW
  • 13.2 KEY PLAYER STRATEGIES/RIGHT TO WIN
  • 13.3 REVENUE ANALYSIS
  • 13.4 KEY PLAYERS’ ANNUAL REVENUE VS. GROWTH
  • 13.5 MARKET SHARE ANALYSIS, 2023
  • 13.6 COMPANY VALUATION AND FINANCIAL METRICS
    COMPANY VALUATION
    KEY PLAYERS’ EBITDA FINANCIAL METRICS USING EV/EBIDTA
  • 13.7 GLOBAL SNAPSHOT OF KEY MARKET PARTICIPANTS
  • 13.8 COMPANY EVALUATION MATRIX: KEY PLAYERS, 2023
    STARS
    EMERGING LEADERS
    PERVASIVE PLAYERS
    PARTICIPANTS
    COMPANY FOOTPRINT: KEY PLAYERS
    - Company footprint
    - Type footprint
    - Application footprint
    - Regional footprint
  • 13.9 COMPANY EVALUATION MATRIX: START-UPS/SMES, 2023
    PROGRESSIVE COMPANIES
    RESPONSIVE COMPANIES
    DYNAMIC COMPANIES
    STARTING BLOCKS
    COMPETITIVE BENCHMARKING: STARTUPS/SMES, 2023
    - Detailed List of Key Startups/SME
    - Competitive benchmarking of key startups/SMEs
  • 13.10 BRAND/PRODUCT COMPARISON
  • 13.11 COMPETITIVE SCENARIO AND TRENDS
    PRODUCT LAUNCHES/DEVELOPMENTS/APPROVALS
    DEALS
    EXPANSIONS
COMPANY PROFILES
262
  • 14.1 KEY PLAYERS
    SGS
    - Business overview
    - Products/Solutions/Services offered
    - Recent developments
    - MnM view
    EUROFINS SCIENTIFIC
    - Business overview
    - Products/Solutions/Services offered
    - Recent developments
    - MnM view
    BUREAU VERITAS
    - Business overview
    - Products/Solutions/Services offered
    - Recent developments
    - MnM view
    DEKRA
    - Business overview
    - Products/Solutions/Services offered
    - Recent developments
    - MnM view
    INTERTEK GROUP PLC
    - Business overview
    - Products/Solutions/Services offered
    - Recent developments
    - MnM view
    DNV
    - Business overview
    - Products/Solutions/Services offered
    - Recent developments
    - MnM view
    ASUREQUALITY
    - Business overview
    - Products/Solutions/Services offered
    - Recent developments
    - MnM view
    TÜV SÜD
    - Business overview
    - Products/Solutions/Services offered
    - Recent developments
    - MnM view
    ALS
    - Business overview
    - Products/Solutions/Services offered
    - Recent developments
    - MnM view
    UL LLC
    - Business overview
    - Products/Solutions/Services offered
    - Recent developments
    - MnM view
    KIWA
    - Business overview
    - Products/Solutions/Services offered
    - Recent developments
    - MnM view
    CONTROL UNION CERTIFICATIONS
    - Business overview
    - Products/Solutions/Services offered
    - Recent developments
    - MnM view
    AIB INTERNATIONAL, INC.
    - Business overview
    - Products/Solutions/Services offered
    - Recent developments
    - MnM view
    NSF
    - Business overview
    - Products/Solutions/Services offered
    - Recent developments
    - MnM view
    SCS GLOBAL SERVICES
    - Business overview
    - Products/Solutions/Services offered
    - Recent developments
    - MnM view
  • 14.2 OTHER PLAYERS
    INTL CERTIFICATION LIMITED
    - Business overview
    - Products/Solutions/Services offered
    - Recent developments
    - MnM view
    INDOCERT
    - Business overview
    - Products/Solutions/Services offered
    - Recent developments
    - MnM view
    TQ CERT
    - Business overview
    - Products/Solutions/Services offered
    - Recent developments
    - MnM view
    MS CERTIFICATION SERVICES PVT. LTD.
    - Business overview
    - Products/Solutions/Services offered
    - Recent developments
    - MnM view
    SOCOTEC
    - Business overview
    - Products/Solutions/Services offered
    - Recent developments
    - MnM view
    SAFE FOOD ALLIANCE – FOOD CERTIFICATION MARKET
    CDG CERTIFICATION LIMITED – FOOD CERTIFICATION MARKET
    EAGLE CERTIFICATION GROUP – FOOD CERTIFICATION MARKET
    EQUALITAS CERTIFICATIONS LIMITED – FOOD CERTIFICATION MARKET
    OCEAN – FOOD CERTIFICATION MARKET
ADJACENT AND RELATED MARKETS
307
  • 15.1 INTRODUCTION
  • 15.2 LIMITATIONS
  • 15.3 CERTIFICATE AUTHORITY MARKET
    MARKET DEFINITION
    MARKET OVERVIEW
  • 15.4 FOOD CERTIFICATION MARKET
    MARKET DEFINITION
    MARKET OVERVIEW
APPENDIX
311
  • 16.1 DISCUSSION GUIDE
  • 16.2 KNOWLEDGESTORE: MARKETSANDMARKETS’ SUBSCRIPTION PORTAL
  • 16.3 CUSTOMIZATION OPTIONS
  • 16.4 RELATED REPORTS
  • 16.5 AUTHOR DETAILS
LIST OF TABLES
 
  • TABLE 1 USD EXCHANGE RATES CONSIDERED, 2020–2023
  • TABLE 2 FOOD CERTIFICATION MARKET SHARE SNAPSHOT, 2024 VS. 2029 (USD MILLION)
  • TABLE 3 RECENT FOODBORNE OUTBREAKS IN US
  • TABLE 4 LIST OF MAJOR FRAUDULENT ORGANIC CERTIFICATIONS
  • TABLE 5 FOOD CERTIFICATION MARKET: INDICATIVE PRICE RANGE FOR CERTIFICATION TYPE, 2023
  • TABLE 6 FOOD CERTIFICATION MARKET: INDICATIVE PRICE RANGE, BY PRICE SENSITIVITY, 2023
  • TABLE 7 FOOD CERTIFICATION MARKET: ECOSYSTEM
  • TABLE 8 FOOD SAFETY TESTING MARKET: DETAILED LIST OF CONFERENCES AND EVENTS, 2024–2025
  • TABLE 9 NORTH AMERICA: LIST OF REGULATORY BODIES, GOVERNMENT AGENCIES, AND OTHER ORGANIZATIONS
  • TABLE 10 EUROPE: LIST OF REGULATORY BODIES, GOVERNMENT AGENCIES, AND OTHER ORGANIZATIONS
  • TABLE 11 ASIA PACIFIC: LIST OF REGULATORY BODIES, GOVERNMENT AGENCIES, AND OTHER ORGANIZATIONS
  • TABLE 12 REST OF THE WORLD: LIST OF REGULATORY BODIES, GOVERNMENT AGENCIES, AND OTHER ORGANIZATIONS
  • TABLE 13 IMPACT OF PORTER’S FIVE FORCES’ ON FOOD CERTIFICATION MARKET
  • TABLE 14 INFLUENCE OF STAKEHOLDERS ON BUYING PROCESS FOR FOOD CERTIFICATION SERVICES (%)
  • TABLE 15 KEY BUYING CRITERIA FOR FOOD CERTIFICATION SERVICES
  • TABLE 16 FOOD CERTIFICATION MARKET, BY CERTIFICATION TYPE, 2020–2023 (USD MILLION)
  • TABLE 17 FOOD CERTIFICATION MARKET, BY CERTIFICATION TYPE, 2024–2029 (USD MILLION)
  • TABLE 18 SAFETY & QUALITY CERTIFICATIONS: FOOD CERTIFICATION MARKET, BY REGION, 2020–2023 (USD MILLION)
  • TABLE 19 SAFETY & QUALITY CERTIFICATIONS: FOOD CERTIFICATION MARKET, BY REGION, 2024–2029 (USD MILLION)
  • TABLE 20 ISO 22000: FOOD CERTIFICATION MARKET, BY REGION, 2020–2023 (USD MILLION)
  • TABLE 21 ISO 22000: FOOD CERTIFICATION MARKET, BY REGION, 2024–2029 (USD MILLION)
  • TABLE 22 BRITISH RETAIL CONSORTIUM (BRC) GLOBAL STANDARDS: FOOD CERTIFICATION MARKET, BY REGION, 2020–2023 (USD MILLION)
  • TABLE 23 BRITISH RETAIL CONSORTIUM (BRC) GLOBAL STANDARDS: FOOD CERTIFICATION MARKET, BY REGION, 2024–2029 (USD MILLION)
  • TABLE 24 INTERNATIONAL FEATURED STANDARDS (IFS): FOOD CERTIFICATION MARKET, BY REGION, 2020–2023 (USD MILLION)
  • TABLE 25 INTERNATIONAL FEATURED STANDARDS (IFS): FOOD CERTIFICATION MARKET, BY REGION, 2024–2029 (USD MILLION)
  • TABLE 26 SAFE QUALITY FOOD (SQF) CERTIFICATIONS: FOOD CERTIFICATION MARKET, BY REGION, 2020–2023 (USD MILLION)
  • TABLE 27 SAFE QUALITY FOOD (SQF) CERTIFICATIONS: FOOD CERTIFICATION MARKET, BY REGION, 2024–2029 (USD MILLION)
  • TABLE 28 DIETARY & LIFESTYLE CERTIFICATIONS: FOOD CERTIFICATION MARKET, BY REGION, 2020–2023 (USD MILLION)
  • TABLE 29 DIETARY & LIFESTYLE CERTIFICATIONS: FOOD CERTIFICATION MARKET, BY REGION, 2024–2029 (USD MILLION)
  • TABLE 30 HALAL: FOOD CERTIFICATION MARKET, BY REGION, 2020–2023 (USD MILLION)
  • TABLE 31 HALAL: FOOD CERTIFICATION MARKET, BY REGION, 2024–2029 (USD MILLION)
  • TABLE 32 KOSHER: FOOD CERTIFICATION MARKET, BY REGION, 2020–2023 (USD MILLION)
  • TABLE 33 KOSHER: FOOD CERTIFICATION MARKET, BY REGION, 2024–2029 (USD MILLION)
  • TABLE 34 ‘‘FREE-FROM’ CERTIFICATIONS: FOOD CERTIFICATION MARKET, BY REGION, 2020–2023 (USD MILLION)
  • TABLE 35 ‘‘FREE-FROM’ CERTIFICATIONS: FOOD CERTIFICATION MARKET, BY REGION, 2024–2029 (USD MILLION)
  • TABLE 36 ‘‘FREE-FROM’ CERTIFICATIONS: FOOD CERTIFICATION MARKET, BY SUBTYPE, 2020–2023 (USD MILLION)
  • TABLE 37 ‘‘FREE-FROM’ CERTIFICATIONS: FOOD CERTIFICATION MARKET, BY SUBTYPE, 2024–2029 (USD MILLION)
  • TABLE 38 OTHER CERTIFICATION TYPES: FOOD CERTIFICATION MARKET, BY REGION, 2020–2023 (USD MILLION)
  • TABLE 39 OTHER CERTIFICATION TYPES: FOOD CERTIFICATION MARKET, BY REGION, 2024–2029 (USD MILLION)
  • TABLE 40 FOOD CERTIFICATION MARKET, BY APPLICATION, 2020–2023 (USD MILLION)
  • TABLE 41 FOOD CERTIFICATION MARKET, BY APPLICATION, 2024–2029 (USD MILLION)
  • TABLE 42 MEAT, POULTRY, AND SEAFOOD PRODUCTS: FOOD CERTIFICATION MARKET, BY SUBAPPLICATION, 2020–2023 (USD MILLION)
  • TABLE 43 MEAT, POULTRY, AND SEAFOOD PRODUCTS: FOOD CERTIFICATION MARKET, BY SUBAPPLICATION, 2024–2029 (USD MILLION)
  • TABLE 44 MEAT, POULTRY, AND SEAFOOD PRODUCTS: FOOD CERTIFICATION MARKET, BY REGION, 2020–2023 (USD MILLION)
  • TABLE 45 MEAT, POULTRY, AND SEAFOOD PRODUCTS: FOOD CERTIFICATION MARKET, BY REGION, 2024–2029 (USD MILLION)
  • TABLE 46 DAIRY PRODUCTS: FOOD CERTIFICATION MARKET, BY REGION, 2020–2023 (USD MILLION)
  • TABLE 47 DAIRY PRODUCTS: FOOD CERTIFICATION MARKET, BY REGION, 2024–2029 (USD MILLION)
  • TABLE 48 INFANT FOOD PRODUCTS: FOOD CERTIFICATION MARKET, BY REGION, 2020–2023 (USD MILLION)
  • TABLE 49 INFANT FOOD PRODUCTS: FOOD CERTIFICATION MARKET, BY REGION, 2024–2029 (USD MILLION)
  • TABLE 50 BAKERY & CONFECTIONERY PRODUCTS: FOOD CERTIFICATION MARKET, BY REGION, 2020–2023 (USD MILLION)
  • TABLE 51 BAKERY & CONFECTIONERY PRODUCTS: FOOD CERTIFICATION MARKET, BY REGION, 2024–2029 (USD MILLION)
  • TABLE 52 BEVERAGES: FOOD CERTIFICATION MARKET, BY SUBAPPLICATION, 2020–2023 (USD MILLION)
  • TABLE 53 BEVERAGES: FOOD CERTIFICATION MARKET, BY SUBAPPLICATION, 2024–2029 (USD MILLION)
  • TABLE 54 BEVERAGES: FOOD CERTIFICATION MARKET, BY REGION, 2020–2023 (USD MILLION)
  • TABLE 55 BEVERAGES: FOOD CERTIFICATION MARKET, BY REGION, 2024–2029 (USD MILLION)
  • TABLE 56 ‘FREE-FROM’ FOODS: FOOD CERTIFICATION MARKET, BY REGION, 2020–2023 (USD MILLION)
  • TABLE 57 ‘FREE-FROM’ FOODS: FOOD CERTIFICATION MARKET, BY REGION, 2024–2029 (USD MILLION)
  • TABLE 58 FRUITS & VEGETABLES: FOOD CERTIFICATION MARKET, BY REGION, 2020–2023 (USD MILLION)
  • TABLE 59 FRUITS & VEGETABLES: FOOD CERTIFICATION MARKET, BY REGION, 2024–2029 (USD MILLION)
  • TABLE 60 NUTRACEUTICALS & SUPPLEMENTS: FOOD CERTIFICATION MARKET, BY REGION, 2020–2023 (USD MILLION)
  • TABLE 61 NUTRACEUTICALS & SUPPLEMENTS: FOOD CERTIFICATION MARKET, BY REGION, 2024–2029 (USD MILLION)
  • TABLE 62 OTHER APPLICATIONS: FOOD CERTIFICATION MARKET, BY REGION, 2020–2023 (USD MILLION)
  • TABLE 63 OTHER APPLICATIONS: FOOD CERTIFICATION MARKET, BY REGION, 2024–2029 (USD MILLION)
  • TABLE 64 FOOD CERTIFICATION MARKET, BY END USER, 2020–2023 (USD MILLION)
  • TABLE 65 FOOD CERTIFICATION MARKET, BY END USER, 2024–2029 (USD MILLION)
  • TABLE 66 FOOD & BEVERAGE MANUFACTURERS: FOOD CERTIFICATION MARKET, BY REGION, 2020–2023 (USD MILLION)
  • TABLE 67 FOOD & BEVERAGE MANUFACTURERS: FOOD CERTIFICATION MARKET, BY REGION, 2024–2029 (USD MILLION)
  • TABLE 68 RETAIL & SUPERMARKETS: FOOD CERTIFICATION MARKET, BY REGION, 2020–2023 (USD MILLION)
  • TABLE 69 RETAIL & SUPERMARKETS: FOOD CERTIFICATION MARKET, BY REGION, 2024–2029 (USD MILLION)
  • TABLE 70 RESTAURANTS & FOODSERVICE CHAINS: FOOD CERTIFICATION MARKET, BY REGION, 2020–2023 (USD MILLION)
  • TABLE 71 RESTAURANTS & FOODSERVICE CHAINS: FOOD CERTIFICATION MARKET, BY REGION, 2024–2029 (USD MILLION)
  • TABLE 72 GROWERS: FOOD CERTIFICATION MARKET, BY REGION, 2020–2023 (USD MILLION)
  • TABLE 73 GROWERS: FOOD CERTIFICATION MARKET, BY REGION, 2024–2029 (USD MILLION)
  • TABLE 74 OTHER END USERS: FOOD CERTIFICATION MARKET, BY REGION, 2020–2023 (USD MILLION)
  • TABLE 75 OTHER END USERS: FOOD CERTIFICATION MARKET, BY REGION, 2024–2029 (USD MILLION)
  • TABLE 76 FOOD CERTIFICATION MARKET, BY CERTIFICATION SCOPE, 2020–2023 (USD MILLION)
  • TABLE 77 FOOD CERTIFICATION MARKET, BY CERTIFICATION SCOPE, 2024–2029 (USD MILLION)
  • TABLE 78 SINGLE PRODUCT CERTIFICATION: FOOD CERTIFICATION MARKET, BY REGION, 2020–2023 (USD MILLION)
  • TABLE 79 SINGLE PRODUCT CERTIFICATION: FOOD CERTIFICATION MARKET, BY REGION, 2024–2029 (USD MILLION)
  • TABLE 80 MULTIPLE PRODUCT CERTIFICATION: FOOD CERTIFICATION MARKET, BY REGION, 2020–2023 (USD MILLION)
  • TABLE 81 MULTIPLE PRODUCT CERTIFICATION: FOOD CERTIFICATION MARKET, BY REGION, 2024–2029 (USD MILLION)
  • TABLE 82 COMPANY-WIDE CERTIFICATION: FOOD CERTIFICATION MARKET, BY REGION, 2020–2023 (USD MILLION)
  • TABLE 83 COMPANY-WIDE CERTIFICATION: FOOD CERTIFICATION MARKET, BY REGION, 2024–2029 (USD MILLION)
  • TABLE 84 FOOD CERTIFICATION MARKET, BY PRICE SENSITIVITY, 2020–2023 (USD MILLION)
  • TABLE 85 FOOD CERTIFICATION MARKET, BY PRICE SENSITIVITY, 2024–2029 (USD MILLION)
  • TABLE 86 PREMIUM CERTIFICATIONS: FOOD CERTIFICATION MARKET, BY REGION, 2020–2023 (USD MILLION)
  • TABLE 87 PREMIUM CERTIFICATIONS: FOOD CERTIFICATION MARKET, BY REGION, 2024–2029 (USD MILLION)
  • TABLE 88 COST-EFFECTIVE CERTIFICATIONS: FOOD CERTIFICATION MARKET, BY REGION, 2020–2023 (USD MILLION)
  • TABLE 89 COST-EFFECTIVE CERTIFICATIONS: FOOD CERTIFICATION MARKET, BY REGION, 2024–2029 (USD MILLION)
  • TABLE 90 FOOD CERTIFICATION MARKET, BY REGION, 2020–2023 (USD MILLION)
  • TABLE 91 FOOD CERTIFICATION MARKET, BY REGION, 2024–2029 (USD MILLION)
  • TABLE 92 NORTH AMERICA: FOOD CERTIFICATION MARKET, BY COUNTRY, 2020–2023 (USD MILLION)
  • TABLE 93 NORTH AMERICA: FOOD CERTIFICATION MARKET, BY COUNTRY, 2024–2029 (USD MILLION)
  • TABLE 94 NORTH AMERICA: FOOD CERTIFICATION MARKET, BY CERTIFICATION TYPE, 2020–2023 (USD MILLION)
  • TABLE 95 NORTH AMERICA: FOOD CERTIFICATION MARKET, BY CERTIFICATION TYPE, 2024–2029 (USD MILLION)
  • TABLE 96 NORTH AMERICA: FOOD CERTIFICATION MARKET, BY SAFETY & QUALITY CERTIFICATIONS SUBTYPE, 2020–2023 (USD MILLION)
  • TABLE 97 NORTH AMERICA: FOOD CERTIFICATION MARKET, BY SAFETY & QUALITY CERTIFICATIONS SUBTYPE, 2024–2029 (USD MILLION)
  • TABLE 98 NORTH AMERICA: FOOD CERTIFICATION MARKET, BY DIETARY & LIFESTYLE CERTIFICATIONS SUBTYPE, 2020–2023 (USD MILLION)
  • TABLE 99 NORTH AMERICA: FOOD CERTIFICATION MARKET, BY DIETARY & LIFESTYLE CERTIFICATIONS SUBTYPE, 2024–2029 (USD MILLION)
  • TABLE 100 NORTH AMERICA: FOOD CERTIFICATION MARKET, BY APPLICATION, 2020–2023 (USD MILLION)
  • TABLE 101 NORTH AMERICA: FOOD CERTIFICATION MARKET, BY APPLICATION, 2024–2029 (USD MILLION)
  • TABLE 102 NORTH AMERICA: FOOD CERTIFICATION MARKET, BY END USER, 2020–2023 (USD MILLION)
  • TABLE 103 NORTH AMERICA: FOOD CERTIFICATION MARKET, BY END USER, 2024–2029 (USD MILLION)
  • TABLE 104 NORTH AMERICA: FOOD CERTIFICATION MARKET, BY CERTIFICATION SCOPE, 2020–2023 (USD MILLION)
  • TABLE 105 NORTH AMERICA: FOOD CERTIFICATION MARKET, BY CERTIFICATION SCOPE, 2024–2029 (USD MILLION)
  • TABLE 106 NORTH AMERICA: FOOD CERTIFICATION MARKET, BY PRICE SENSITIVITY, 2020–2023 (USD MILLION)
  • TABLE 107 NORTH AMERICA: FOOD CERTIFICATION MARKET, BY PRICE SENSITIVITY, 2024–2029 (USD MILLION)
  • TABLE 108 US: FOOD CERTIFICATION MARKET, BY CERTIFICATION TYPE, 2020–2023 (USD MILLION)
  • TABLE 109 US: FOOD CERTIFICATION MARKET, BY CERTIFICATION TYPE, 2024–2029 (USD MILLION)
  • TABLE 110 US: FOOD CERTIFICATION MARKET, BY SAFETY & QUALITY CERTIFICATIONS SUBTYPE, 2020–2023 (USD MILLION)
  • TABLE 111 US: FOOD CERTIFICATION MARKET, BY SAFETY & QUALITY CERTIFICATIONS SUBTYPE, 2024–2029 (USD MILLION)
  • TABLE 112 US: FOOD CERTIFICATION MARKET, BY DIETARY & LIFESTYLE CERTIFICATIONS SUBTYPE, 2020–2023 (USD MILLION)
  • TABLE 113 US: FOOD CERTIFICATION MARKET, BY DIETARY & LIFESTYLE CERTIFICATIONS SUBTYPE, 2024–2029 (USD MILLION)
  • TABLE 114 US: FOOD CERTIFICATION MARKET, BY APPLICATION, 2020–2023 (USD MILLION)
  • TABLE 115 US: FOOD CERTIFICATION MARKET, BY APPLICATION, 2024–2029 (USD MILLION)
  • TABLE 116 CANADA: FOOD CERTIFICATION MARKET, BY CERTIFICATION TYPE, 2020–2023 (USD MILLION)
  • TABLE 117 CANADA: FOOD CERTIFICATION MARKET, BY CERTIFICATION TYPE, 2024–2029 (USD MILLION)
  • TABLE 118 CANADA: FOOD CERTIFICATION MARKET, BY SAFETY & QUALITY CERTIFICATIONS SUBTYPE, 2020–2023 (USD MILLION)
  • TABLE 119 CANADA: FOOD CERTIFICATION MARKET, BY SAFETY & QUALITY CERTIFICATIONS SUBTYPE, 2024–2029 (USD MILLION)
  • TABLE 120 CANADA: FOOD CERTIFICATION MARKET, BY DIETARY & LIFESTYLE CERTIFICATIONS SUBTYPE, 2020–2023 (USD MILLION)
  • TABLE 121 CANADA: FOOD CERTIFICATION MARKET, BY DIETARY & LIFESTYLE CERTIFICATIONS SUBTYPE, 2024–2029 (USD MILLION)
  • TABLE 122 CANADA: FOOD CERTIFICATION MARKET, BY APPLICATION, 2020–2023 (USD MILLION)
  • TABLE 123 CANADA: FOOD CERTIFICATION MARKET, BY APPLICATION, 2024–2029 (USD MILLION)
  • TABLE 124 MEXICO: FOOD CERTIFICATION MARKET, BY CERTIFICATION TYPE, 2020–2023 (USD MILLION)
  • TABLE 125 MEXICO: FOOD CERTIFICATION MARKET, BY CERTIFICATION TYPE, 2024–2029 (USD MILLION)
  • TABLE 126 MEXICO: FOOD CERTIFICATION MARKET, BY SAFETY & QUALITY CERTIFICATIONS SUBTYPE, 2020–2023 (USD MILLION)
  • TABLE 127 MEXICO: FOOD CERTIFICATION MARKET, BY SAFETY & QUALITY CERTIFICATIONS SUBTYPE, 2024–2029 (USD MILLION)
  • TABLE 128 MEXICO: FOOD CERTIFICATION MARKET, BY DIETARY & LIFESTYLE CERTIFICATIONS SUBTYPE, 2020–2023 (USD MILLION)
  • TABLE 129 MEXICO: FOOD CERTIFICATION MARKET, BY DIETARY & LIFESTYLE CERTIFICATIONS SUBTYPE, 2024–2029 (USD MILLION)
  • TABLE 130 MEXICO: FOOD CERTIFICATION MARKET, BY APPLICATION, 2020–2023 (USD MILLION)
  • TABLE 131 MEXICO: FOOD CERTIFICATION MARKET, BY APPLICATION, 2024–2029 (USD MILLION)
  • TABLE 132 EUROPE: FOOD CERTIFICATION MARKET, BY COUNTRY, 2020–2023 (USD MILLION)
  • TABLE 133 EUROPE: FOOD CERTIFICATION MARKET, BY COUNTRY, 2024–2029 (USD MILLION)
  • TABLE 134 EUROPE: FOOD CERTIFICATION MARKET, BY CERTIFICATION TYPE, 2020–2023 (USD MILLION)
  • TABLE 135 EUROPE: FOOD CERTIFICATION MARKET, BY CERTIFICATION TYPE, 2024–2029 (USD MILLION)
  • TABLE 136 EUROPE: FOOD CERTIFICATION MARKET, BY SAFETY & QUALITY CERTIFICATIONS SUBTYPE, 2020–2023 (USD MILLION)
  • TABLE 137 EUROPE: FOOD CERTIFICATION MARKET, BY SAFETY & QUALITY CERTIFICATIONS SUBTYPE, 2024–2029 (USD MILLION)
  • TABLE 138 EUROPE: FOOD CERTIFICATION MARKET, BY DIETARY & LIFESTYLE CERTIFICATIONS SUBTYPE, 2020–2023 (USD MILLION)
  • TABLE 139 EUROPE: FOOD CERTIFICATION MARKET, BY DIETARY & LIFESTYLE CERTIFICATIONS SUBTYPE, 2024–2029 (USD MILLION)
  • TABLE 140 EUROPE: FOOD CERTIFICATION MARKET, BY APPLICATION, 2020–2023 (USD MILLION)
  • TABLE 141 EUROPE: FOOD CERTIFICATION MARKET, BY APPLICATION, 2024–2029 (USD MILLION)
  • TABLE 142 EUROPE: FOOD CERTIFICATION MARKET, BY END USER, 2020–2023 (USD MILLION)
  • TABLE 143 EUROPE: FOOD CERTIFICATION MARKET, BY END USER, 2024–2029 (USD MILLION)
  • TABLE 144 EUROPE: FOOD CERTIFICATION MARKET, BY CERTIFICATION SCOPE, 2020–2023 (USD MILLION)
  • TABLE 145 EUROPE: FOOD CERTIFICATION MARKET, BY CERTIFICATION SCOPE, 2024–2029 (USD MILLION)
  • TABLE 146 EUROPE: FOOD CERTIFICATION MARKET, BY PRICE SENSITIVITY, 2020–2023 (USD MILLION)
  • TABLE 147 EUROPE: FOOD CERTIFICATION MARKET, BY PRICE SENSITIVITY, 2024–2029 (USD MILLION)
  • TABLE 148 UK: FOOD CERTIFICATION MARKET, BY CERTIFICATION TYPE, 2020–2023 (USD MILLION)
  • TABLE 149 UK: FOOD CERTIFICATION MARKET, BY CERTIFICATION TYPE, 2024–2029 (USD MILLION)
  • TABLE 150 UK: FOOD CERTIFICATION MARKET, BY SAFETY & QUALITY CERTIFICATIONS SUBTYPE, 2020–2023 (USD MILLION)
  • TABLE 151 UK: FOOD CERTIFICATION MARKET, BY SAFETY & QUALITY CERTIFICATIONS SUBTYPE, 2024–2029 (USD MILLION)
  • TABLE 152 UK: FOOD CERTIFICATION MARKET, BY DIETARY & LIFESTYLE CERTIFICATIONS SUBTYPE, 2020–2023 (USD MILLION)
  • TABLE 153 UK: FOOD CERTIFICATION MARKET, BY DIETARY & LIFESTYLE CERTIFICATIONS SUBTYPE, 2024–2029 (USD MILLION)
  • TABLE 154 UK: FOOD CERTIFICATION MARKET, BY APPLICATION, 2020–2023 (USD MILLION)
  • TABLE 155 UK: FOOD CERTIFICATION MARKET, BY APPLICATION, 2024–2029 (USD MILLION)
  • TABLE 156 GERMANY: FOOD CERTIFICATION MARKET, BY CERTIFICATION TYPE, 2020–2023 (USD MILLION)
  • TABLE 157 GERMANY: FOOD CERTIFICATION MARKET, BY CERTIFICATION TYPE, 2024–2029 (USD MILLION)
  • TABLE 158 GERMANY: FOOD CERTIFICATION MARKET, BY SAFETY & QUALITY CERTIFICATIONS SUBTYPE, 2020–2023 (USD MILLION)
  • TABLE 159 GERMANY: FOOD CERTIFICATION MARKET, BY SAFETY & QUALITY CERTIFICATIONS SUBTYPE, 2024–2029 (USD MILLION)
  • TABLE 160 GERMANY: FOOD CERTIFICATION MARKET, BY DIETARY & LIFESTYLE CERTIFICATIONS SUBTYPE, 2020–2023 (USD MILLION)
  • TABLE 161 GERMANY: FOOD CERTIFICATION MARKET, BY DIETARY & LIFESTYLE CERTIFICATIONS SUBTYPE, 2024–2029 (USD MILLION)
  • TABLE 162 GERMANY: FOOD CERTIFICATION MARKET, BY APPLICATION, 2020–2023 (USD MILLION)
  • TABLE 163 GERMANY: FOOD CERTIFICATION MARKET, BY APPLICATION, 2024–2029 (USD MILLION)
  • TABLE 164 FRANCE: FOOD CERTIFICATION MARKET, BY CERTIFICATION TYPE, 2020–2023 (USD MILLION)
  • TABLE 165 FRANCE: FOOD CERTIFICATION MARKET, BY CERTIFICATION TYPE, 2024–2029 (USD MILLION)
  • TABLE 166 FRANCE: FOOD CERTIFICATION MARKET, BY SAFETY & QUALITY CERTIFICATIONS SUBTYPE, 2020–2023 (USD MILLION)
  • TABLE 167 FRANCE: FOOD CERTIFICATION MARKET, BY SAFETY & QUALITY CERTIFICATIONS SUBTYPE, 2024–2029 (USD MILLION)
  • TABLE 168 FRANCE: FOOD CERTIFICATION MARKET, BY DIETARY & LIFESTYLE CERTIFICATIONS SUBTYPE, 2020–2023 (USD MILLION)
  • TABLE 169 FRANCE: FOOD CERTIFICATION MARKET, BY DIETARY & LIFESTYLE CERTIFICATIONS SUBTYPE, 2024–2029 (USD MILLION)
  • TABLE 170 FRANCE: FOOD CERTIFICATION MARKET, BY APPLICATION, 2020–2023 (USD MILLION)
  • TABLE 171 FRANCE: FOOD CERTIFICATION MARKET, BY APPLICATION, 2024–2029 (USD MILLION)
  • TABLE 172 ITALY: FOOD CERTIFICATION MARKET, BY CERTIFICATION TYPE, 2020–2023 (USD MILLION)
  • TABLE 173 ITALY: FOOD CERTIFICATION MARKET, BY CERTIFICATION TYPE, 2024–2029 (USD MILLION)
  • TABLE 174 ITALY: FOOD CERTIFICATION MARKET, BY SAFETY & QUALITY CERTIFICATIONS SUBTYPE, 2020–2023 (USD MILLION)
  • TABLE 175 ITALY: FOOD CERTIFICATION MARKET, BY SAFETY & QUALITY CERTIFICATIONS SUBTYPE, 2024–2029 (USD MILLION)
  • TABLE 176 ITALY: FOOD CERTIFICATION MARKET, BY DIETARY & LIFESTYLE CERTIFICATIONS SUBTYPE, 2020–2023 (USD MILLION)
  • TABLE 177 ITALY: FOOD CERTIFICATION MARKET, BY DIETARY & LIFESTYLE CERTIFICATIONS SUBTYPE, 2024–2029 (USD MILLION)
  • TABLE 178 ITALY: FOOD CERTIFICATION MARKET, BY APPLICATION, 2020–2023 (USD MILLION)
  • TABLE 179 ITALY: FOOD CERTIFICATION MARKET, BY APPLICATION, 2024–2029 (USD MILLION)
  • TABLE 180 SPAIN: FOOD CERTIFICATION MARKET, BY CERTIFICATION TYPE, 2020–2023 (USD MILLION)
  • TABLE 181 SPAIN: FOOD CERTIFICATION MARKET, BY CERTIFICATION TYPE, 2024–2029 (USD MILLION)
  • TABLE 182 SPAIN: FOOD CERTIFICATION MARKET, BY SAFETY & QUALITY CERTIFICATIONS SUBTYPE, 2020–2023 (USD MILLION)
  • TABLE 183 SPAIN: FOOD CERTIFICATION MARKET, BY SAFETY & QUALITY CERTIFICATIONS SUBTYPE, 2024–2029 (USD MILLION)
  • TABLE 184 SPAIN: FOOD CERTIFICATION MARKET, BY DIETARY & LIFESTYLE CERTIFICATIONS SUBTYPE, 2020–2023 (USD MILLION)
  • TABLE 185 SPAIN: FOOD CERTIFICATION MARKET, BY DIETARY & LIFESTYLE CERTIFICATIONS SUBTYPE, 2024–2029 (USD MILLION)
  • TABLE 186 SPAIN: FOOD CERTIFICATION MARKET, BY APPLICATION, 2020–2023 (USD MILLION)
  • TABLE 187 SPAIN: FOOD CERTIFICATION MARKET, BY APPLICATION, 2024–2029 (USD MILLION)
  • TABLE 188 POLAND: FOOD CERTIFICATION MARKET, BY CERTIFICATION TYPE, 2020–2023 (USD MILLION)
  • TABLE 189 POLAND: FOOD CERTIFICATION MARKET, BY CERTIFICATION TYPE, 2024–2029 (USD MILLION)
  • TABLE 190 POLAND: FOOD CERTIFICATION MARKET, BY SAFETY & QUALITY CERTIFICATIONS SUBTYPE, 2020–2023 (USD MILLION)
  • TABLE 191 POLAND: FOOD CERTIFICATION MARKET, BY SAFETY & QUALITY CERTIFICATIONS SUBTYPE, 2024–2029 (USD MILLION)
  • TABLE 192 POLAND: FOOD CERTIFICATION MARKET, BY DIETARY & LIFESTYLE CERTIFICATIONS SUBTYPE, 2020–2023 (USD MILLION)
  • TABLE 193 POLAND: FOOD CERTIFICATION MARKET, BY DIETARY & LIFESTYLE CERTIFICATIONS SUBTYPE, 2024–2029 (USD MILLION)
  • TABLE 194 POLAND: FOOD CERTIFICATION MARKET, BY APPLICATION, 2020–2023 (USD MILLION)
  • TABLE 195 POLAND: FOOD CERTIFICATION MARKET, BY APPLICATION, 2024–2029 (USD MILLION)
  • TABLE 196 REST OF EUROPE: FOOD CERTIFICATION MARKET, BY CERTIFICATION TYPE, 2020–2023 (USD MILLION)
  • TABLE 197 REST OF EUROPE: FOOD CERTIFICATION MARKET, BY CERTIFICATION TYPE, 2024–2029 (USD MILLION)
  • TABLE 198 REST OF EUROPE: FOOD CERTIFICATION MARKET, BY SAFETY & QUALITY CERTIFICATIONS SUBTYPE, 2020–2023 (USD MILLION)
  • TABLE 199 REST OF EUROPE: FOOD CERTIFICATION MARKET, BY SAFETY & QUALITY CERTIFICATIONS SUBTYPE, 2024–2029 (USD MILLION)
  • TABLE 200 REST OF EUROPE: FOOD CERTIFICATION MARKET, BY DIETARY & LIFESTYLE CERTIFICATIONS SUBTYPE, 2020–2023 (USD MILLION)
  • TABLE 201 REST OF EUROPE: FOOD CERTIFICATION MARKET, BY DIETARY & LIFESTYLE CERTIFICATIONS SUBTYPE, 2024–2029 (USD MILLION)
  • TABLE 202 REST OF EUROPE: FOOD CERTIFICATION MARKET, BY APPLICATION, 2020–2023 (USD MILLION)
  • TABLE 203 REST OF EUROPE: FOOD CERTIFICATION MARKET, BY APPLICATION, 2024–2029 (USD MILLION)
  • TABLE 204 ASIA PACIFIC: FOOD CERTIFICATION MARKET, BY COUNTRY, 2020–2023 (USD MILLION)
  • TABLE 205 ASIA PACIFIC: FOOD CERTIFICATION MARKET, BY COUNTRY, 2024–2029 (USD MILLION)
  • TABLE 206 ASIA PACIFIC: FOOD CERTIFICATION MARKET, BY CERTIFICATION TYPE, 2020–2023 (USD MILLION)
  • TABLE 207 ASIA PACIFIC: FOOD CERTIFICATION MARKET, BY CERTIFICATION TYPE, 2024–2029 (USD MILLION)
  • TABLE 208 ASIA PACIFIC: FOOD CERTIFICATION MARKET, BY SAFETY & QUALITY CERTIFICATIONS SUBTYPE, 2020–2023 (USD MILLION)
  • TABLE 209 ASIA PACIFIC: FOOD CERTIFICATION MARKET, BY SAFETY & QUALITY CERTIFICATIONS SUBTYPE, 2024–2029 (USD MILLION)
  • TABLE 210 ASIA PACIFIC: FOOD CERTIFICATION MARKET, BY DIETARY & LIFESTYLE CERTIFICATIONS SUBTYPE, 2020–2023 (USD MILLION)
  • TABLE 211 ASIA PACIFIC: FOOD CERTIFICATION MARKET, BY DIETARY & LIFESTYLE CERTIFICATIONS SUBTYPE, 2024–2029 (USD MILLION)
  • TABLE 212 ASIA PACIFIC: FOOD CERTIFICATION MARKET, BY APPLICATION, 2020–2023 (USD MILLION)
  • TABLE 213 ASIA PACIFIC: FOOD CERTIFICATION MARKET, BY APPLICATION, 2024–2029 (USD MILLION)
  • TABLE 214 ASIA PACIFIC: FOOD CERTIFICATION MARKET, BY END USER, 2020–2023 (USD MILLION)
  • TABLE 215 ASIA PACIFIC: FOOD CERTIFICATION MARKET, BY END USER, 2024–2029 (USD MILLION)
  • TABLE 216 ASIA PACIFIC: FOOD CERTIFICATION MARKET, BY CERTIFICATION SCOPE, 2020–2023 (USD MILLION)
  • TABLE 217 ASIA PACIFIC: FOOD CERTIFICATION MARKET, BY CERTIFICATION SCOPE, 2024–2029 (USD MILLION)
  • TABLE 218 ASIA PACIFIC: FOOD CERTIFICATION MARKET, BY PRICE SENSITIVITY, 2020–2023 (USD MILLION)
  • TABLE 219 ASIA PACIFIC: FOOD CERTIFICATION MARKET, BY PRICE SENSITIVITY, 2024–2029 (USD MILLION)
  • TABLE 220 CHINA: FOOD CERTIFICATION MARKET, BY CERTIFICATION TYPE, 2020–2023 (USD MILLION)
  • TABLE 221 CHINA: FOOD CERTIFICATION MARKET, BY CERTIFICATION TYPE, 2024–2029 (USD MILLION)
  • TABLE 222 CHINA: FOOD CERTIFICATION MARKET, BY SAFETY & QUALITY CERTIFICATIONS SUBTYPE, 2020–2023 (USD MILLION)
  • TABLE 223 CHINA: FOOD CERTIFICATION MARKET, BY SAFETY & QUALITY CERTIFICATIONS SUBTYPE, 2024–2029 (USD MILLION)
  • TABLE 224 CHINA: FOOD CERTIFICATION MARKET, BY DIETARY & LIFESTYLE CERTIFICATIONS SUBTYPE, 2020–2023 (USD MILLION)
  • TABLE 225 CHINA: FOOD CERTIFICATION MARKET, BY DIETARY & LIFESTYLE CERTIFICATIONS SUBTYPE, 2024–2029 (USD MILLION)
  • TABLE 226 CHINA: FOOD CERTIFICATION MARKET, BY APPLICATION, 2020–2023 (USD MILLION)
  • TABLE 227 CHINA: FOOD CERTIFICATION MARKET, BY APPLICATION, 2024–2029 (USD MILLION)
  • TABLE 228 INDIA: FOOD CERTIFICATION MARKET, BY CERTIFICATION TYPE, 2020–2023 (USD MILLION)
  • TABLE 229 INDIA: FOOD CERTIFICATION MARKET, BY CERTIFICATION TYPE, 2024–2029 (USD MILLION)
  • TABLE 230 INDIA: FOOD CERTIFICATION MARKET, BY SAFETY & QUALITY CERTIFICATIONS SUBTYPE, 2020–2023 (USD MILLION)
  • TABLE 231 INDIA: FOOD CERTIFICATION MARKET, BY SAFETY & QUALITY CERTIFICATIONS SUBTYPE, 2024–2029 (USD MILLION)
  • TABLE 232 INDIA: FOOD CERTIFICATION MARKET, BY DIETARY & LIFESTYLE CERTIFICATIONS SUBTYPE, 2020–2023 (USD MILLION)
  • TABLE 233 INDIA: FOOD CERTIFICATION MARKET, BY DIETARY & LIFESTYLE CERTIFICATIONS SUBTYPE, 2024–2029 (USD MILLION)
  • TABLE 234 INDIA: FOOD CERTIFICATION MARKET, BY APPLICATION, 2020–2023 (USD MILLION)
  • TABLE 235 INDIA: FOOD CERTIFICATION MARKET, BY APPLICATION, 2024–2029 (USD MILLION)
  • TABLE 236 JAPAN: FOOD CERTIFICATION MARKET, BY CERTIFICATION TYPE, 2020–2023 (USD MILLION)
  • TABLE 237 JAPAN: FOOD CERTIFICATION MARKET, BY CERTIFICATION TYPE, 2024–2029 (USD MILLION)
  • TABLE 238 JAPAN: FOOD CERTIFICATION MARKET, BY SAFETY & QUALITY CERTIFICATIONS SUBTYPE, 2020–2023 (USD MILLION)
  • TABLE 239 JAPAN: FOOD CERTIFICATION MARKET, BY SAFETY & QUALITY CERTIFICATIONS SUBTYPE, 2024–2029 (USD MILLION)
  • TABLE 240 JAPAN: FOOD CERTIFICATION MARKET, BY DIETARY & LIFESTYLE CERTIFICATIONS SUBTYPE, 2020–2023 (USD MILLION)
  • TABLE 241 JAPAN: FOOD CERTIFICATION MARKET, BY DIETARY & LIFESTYLE CERTIFICATIONS SUBTYPE, 2024–2029 (USD MILLION)
  • TABLE 242 JAPAN: FOOD CERTIFICATION MARKET, BY APPLICATION, 2020–2023 (USD MILLION)
  • TABLE 243 JAPAN: FOOD CERTIFICATION MARKET, BY APPLICATION, 2024–2029 (USD MILLION)
  • TABLE 244 SOUTH KOREA: FOOD CERTIFICATION MARKET, BY CERTIFICATION TYPE, 2020–2023 (USD MILLION)
  • TABLE 245 SOUTH KOREA: FOOD CERTIFICATION MARKET, BY CERTIFICATION TYPE, 2024–2029 (USD MILLION)
  • TABLE 246 SOUTH KOREA: FOOD CERTIFICATION MARKET, BY SAFETY & QUALITY CERTIFICATIONS SUBTYPE, 2020–2023 (USD MILLION)
  • TABLE 247 SOUTH KOREA: FOOD CERTIFICATION MARKET, BY SAFETY & QUALITY CERTIFICATIONS SUBTYPE, 2024–2029 (USD MILLION)
  • TABLE 248 SOUTH KOREA: FOOD CERTIFICATION MARKET, BY DIETARY & LIFESTYLE CERTIFICATIONS SUBTYPE, 2020–2023 (USD MILLION)
  • TABLE 249 SOUTH KOREA: FOOD CERTIFICATION MARKET, BY DIETARY & LIFESTYLE CERTIFICATIONS SUBTYPE, 2024–2029 (USD MILLION)
  • TABLE 250 SOUTH KOREA: FOOD CERTIFICATION MARKET, BY APPLICATION, 2020–2023 (USD MILLION)
  • TABLE 251 SOUTH KOREA: FOOD CERTIFICATION MARKET, BY APPLICATION, 2024–2029 (USD MILLION)
  • TABLE 252 AUSTRALIA & NEW ZEALAND: FOOD CERTIFICATION MARKET, BY CERTIFICATION TYPE, 2020–2023 (USD MILLION)
  • TABLE 253 AUSTRALIA & NEW ZEALAND: FOOD CERTIFICATION MARKET, BY CERTIFICATION TYPE, 2024–2029 (USD MILLION)
  • TABLE 254 AUSTRALIA & NEW ZEALAND: FOOD CERTIFICATION MARKET, BY SAFETY & QUALITY CERTIFICATIONS SUBTYPE, 2020–2023 (USD MILLION)
  • TABLE 255 AUSTRALIA & NEW ZEALAND: FOOD CERTIFICATION MARKET, BY SAFETY & QUALITY CERTIFICATIONS SUBTYPE, 2024–2029 (USD MILLION)
  • TABLE 256 AUSTRALIA & NEW ZEALAND: FOOD CERTIFICATION MARKET, BY DIETARY & LIFESTYLE CERTIFICATIONS SUBTYPE, 2020–2023 (USD MILLION)
  • TABLE 257 AUSTRALIA & NEW ZEALAND: FOOD CERTIFICATION MARKET, BY DIETARY & LIFESTYLE CERTIFICATIONS SUBTYPE, 2024–2029 (USD MILLION)
  • TABLE 258 AUSTRALIA & NEW ZEALAND: FOOD CERTIFICATION MARKET, BY APPLICATION, 2020–2023 (USD MILLION)
  • TABLE 259 AUSTRALIA & NEW ZEALAND: FOOD CERTIFICATION MARKET, BY APPLICATION, 2024–2029 (USD MILLION)
  • TABLE 260 REST OF ASIA PACIFIC: FOOD CERTIFICATION MARKET, BY CERTIFICATION TYPE, 2020–2023 (USD MILLION)
  • TABLE 261 REST OF ASIA PACIFIC: FOOD CERTIFICATION MARKET, BY CERTIFICATION TYPE, 2024–2029 (USD MILLION)
  • TABLE 262 REST OF ASIA PACIFIC: FOOD CERTIFICATION MARKET, BY SAFETY & QUALITY CERTIFICATIONS SUBTYPE, 2020–2023 (USD MILLION)
  • TABLE 263 REST OF ASIA PACIFIC: FOOD CERTIFICATION MARKET, BY SAFETY & QUALITY CERTIFICATIONS SUBTYPE, 2024–2029 (USD MILLION)
  • TABLE 264 REST OF ASIA PACIFIC: FOOD CERTIFICATION MARKET, BY DIETARY & LIFESTYLE CERTIFICATIONS SUBTYPE, 2020–2023 (USD MILLION)
  • TABLE 265 REST OF ASIA PACIFIC: FOOD CERTIFICATION MARKET, BY DIETARY & LIFESTYLE CERTIFICATIONS SUBTYPE, 2024–2029 (USD MILLION)
  • TABLE 266 REST OF ASIA PACIFIC: FOOD CERTIFICATION MARKET, BY APPLICATION, 2020–2023 (USD MILLION)
  • TABLE 267 REST OF ASIA PACIFIC: FOOD CERTIFICATION MARKET, BY APPLICATION, 2024–2029 (USD MILLION)
  • TABLE 268 REST OF THE WORLD: FOOD CERTIFICATION MARKET, BY COUNTRY, 2020–2023 (USD MILLION)
  • TABLE 269 REST OF THE WORLD: FOOD CERTIFICATION MARKET, BY COUNTRY, 2024–2029 (USD MILLION)
  • TABLE 270 REST OF THE WORLD: FOOD CERTIFICATION MARKET, BY CERTIFICATION TYPE, 2020–2023 (USD MILLION)
  • TABLE 271 REST OF THE WORLD: FOOD CERTIFICATION MARKET, BY CERTIFICATION TYPE, 2024–2029 (USD MILLION)
  • TABLE 272 REST OF THE WORLD: FOOD CERTIFICATION MARKET, BY SAFETY & QUALITY CERTIFICATIONS SUBTYPE, 2020–2023 (USD MILLION)
  • TABLE 273 REST OF THE WORLD: FOOD CERTIFICATION MARKET, BY SAFETY & QUALITY CERTIFICATIONS SUBTYPE, 2024–2029 (USD MILLION)
  • TABLE 274 REST OF THE WORLD: FOOD CERTIFICATION MARKET, BY DIETARY & LIFESTYLE CERTIFICATIONS SUBTYPE, 2020–2023 (USD MILLION)
  • TABLE 275 REST OF THE WORLD: FOOD CERTIFICATION MARKET, BY DIETARY & LIFESTYLE CERTIFICATIONS SUBTYPE, 2024–2029 (USD MILLION)
  • TABLE 276 REST OF THE WORLD: FOOD CERTIFICATION MARKET, BY APPLICATION, 2020–2023 (USD MILLION)
  • TABLE 277 REST OF THE WORLD: FOOD CERTIFICATION MARKET, BY APPLICATION, 2024–2029 (USD MILLION)
  • TABLE 278 REST OF THE WORLD: FOOD CERTIFICATION MARKET, BY END USER, 2020–2023 (USD MILLION)
  • TABLE 279 REST OF THE WORLD: FOOD CERTIFICATION MARKET, BY END USER, 2024–2029 (USD MILLION)
  • TABLE 280 REST OF THE WORLD: FOOD CERTIFICATION MARKET, BY CERTIFICATION SCOPE, 2020–2023 (USD MILLION)
  • TABLE 281 REST OF THE WORLD: FOOD CERTIFICATION MARKET, BY CERTIFICATION SCOPE, 2024–2029 (USD MILLION)
  • TABLE 282 REST OF THE WORLD: FOOD CERTIFICATION MARKET, BY PRICE SENSITIVITY, 2020–2023 (USD MILLION)
  • TABLE 283 REST OF THE WORLD: FOOD CERTIFICATION MARKET, BY PRICE SENSITIVITY, 2024–2029 (USD MILLION)
  • TABLE 284 MIDDLE EAST: FOOD CERTIFICATION MARKET, BY CERTIFICATION TYPE, 2020–2023 (USD MILLION)
  • TABLE 285 MIDDLE EAST: FOOD CERTIFICATION MARKET, BY CERTIFICATION TYPE, 2024–2029 (USD MILLION)
  • TABLE 286 MIDDLE EAST: FOOD CERTIFICATION MARKET, BY SAFETY & QUALITY CERTIFICATIONS SUBTYPE, 2020–2023 (USD MILLION)
  • TABLE 287 MIDDLE EAST: FOOD CERTIFICATION MARKET, BY SAFETY & QUALITY CERTIFICATIONS SUBTYPE, 2024–2029 (USD MILLION)
  • TABLE 288 MIDDLE EAST: FOOD CERTIFICATION MARKET, BY DIETARY & LIFESTYLE CERTIFICATIONS SUBTYPE, 2020–2023 (USD MILLION)
  • TABLE 289 MIDDLE EAST: FOOD CERTIFICATION MARKET, BY DIETARY & LIFESTYLE CERTIFICATIONS SUBTYPE, 2024–2029 (USD MILLION)
  • TABLE 290 MIDDLE EAST: FOOD CERTIFICATION MARKET, BY APPLICATION, 2020–2023 (USD MILLION)
  • TABLE 291 MIDDLE EAST: FOOD CERTIFICATION MARKET, BY APPLICATION, 2024–2029 (USD MILLION)
  • TABLE 292 SOUTH AFRICA: FOOD CERTIFICATION MARKET, BY CERTIFICATION TYPE, 2020–2023 (USD MILLION)
  • TABLE 293 SOUTH AFRICA: FOOD CERTIFICATION MARKET, BY CERTIFICATION TYPE, 2024–2029 (USD MILLION)
  • TABLE 294 SOUTH AFRICA: FOOD CERTIFICATION MARKET, BY SAFETY & QUALITY CERTIFICATIONS SUBTYPE, 2020–2023 (USD MILLION)
  • TABLE 295 SOUTH AFRICA: FOOD CERTIFICATION MARKET, BY SAFETY & QUALITY CERTIFICATIONS SUBTYPE, 2024–2029 (USD MILLION)
  • TABLE 296 SOUTH AFRICA: FOOD CERTIFICATION MARKET, BY DIETARY & LIFESTYLE CERTIFICATIONS SUBTYPE, 2020–2023 (USD MILLION)
  • TABLE 297 SOUTH AFRICA: FOOD CERTIFICATION MARKET, BY DIETARY & LIFESTYLE CERTIFICATIONS SUBTYPE, 2024–2029 (USD MILLION)
  • TABLE 298 SOUTH AFRICA: FOOD CERTIFICATION MARKET, BY APPLICATION, 2020–2023 (USD MILLION)
  • TABLE 299 SOUTH AFRICA: FOOD CERTIFICATION MARKET, BY APPLICATION, 2024–2029 (USD MILLION)
  • TABLE 300 REST OF AFRICA: FOOD CERTIFICATION MARKET, BY CERTIFICATION TYPE, 2020–2023 (USD MILLION)
  • TABLE 301 REST OF AFRICA: FOOD CERTIFICATION MARKET, BY CERTIFICATION TYPE, 2024–2029 (USD MILLION)
  • TABLE 302 REST OF AFRICA: FOOD CERTIFICATION MARKET, BY SAFETY & QUALITY CERTIFICATIONS SUBTYPE, 2020–2023 (USD MILLION)
  • TABLE 303 REST OF AFRICA: FOOD CERTIFICATION MARKET, BY SAFETY & QUALITY CERTIFICATIONS SUBTYPE, 2024–2029 (USD MILLION)
  • TABLE 304 REST OF AFRICA: FOOD CERTIFICATION MARKET, BY DIETARY & LIFESTYLE CERTIFICATIONS SUBTYPE, 2020–2023 (USD MILLION)
  • TABLE 305 REST OF AFRICA: FOOD CERTIFICATION MARKET, BY DIETARY & LIFESTYLE CERTIFICATIONS SUBTYPE, 2024–2029 (USD MILLION)
  • TABLE 306 REST OF AFRICA: FOOD CERTIFICATION MARKET, BY APPLICATION, 2020–2023 (USD MILLION)
  • TABLE 307 REST OF AFRICA: FOOD CERTIFICATION MARKET, BY APPLICATION, 2024–2029 (USD MILLION)
  • TABLE 308 SOUTH AMERICA: FOOD CERTIFICATION MARKET, BY COUNTRY, 2020–2023 (USD MILLION)
  • TABLE 309 SOUTH AMERICA: FOOD CERTIFICATION MARKET, BY COUNTRY, 2024–2029 (USD MILLION)
  • TABLE 310 SOUTH AMERICA: FOOD CERTIFICATION MARKET, BY CERTIFICATION TYPE, 2020–2023 (USD MILLION)
  • TABLE 311 SOUTH AMERICA: FOOD CERTIFICATION MARKET, BY CERTIFICATION TYPE, 2024–2029 (USD MILLION)
  • TABLE 312 SOUTH AMERICA: FOOD CERTIFICATION MARKET, BY SAFETY & QUALITY CERTIFICATIONS SUBTYPE, 2020–2023 (USD MILLION)
  • TABLE 313 SOUTH AMERICA: FOOD CERTIFICATION MARKET, BY SAFETY & QUALITY CERTIFICATIONS SUBTYPE, 2024–2029 (USD MILLION)
  • TABLE 314 SOUTH AMERICA: FOOD CERTIFICATION MARKET, BY DIETARY & LIFESTYLE CERTIFICATIONS SUBTYPE, 2020–2023 (USD MILLION)
  • TABLE 315 SOUTH AMERICA: FOOD CERTIFICATION MARKET, BY DIETARY & LIFESTYLE CERTIFICATIONS SUBTYPE, 2024–2029 (USD MILLION)
  • TABLE 316 SOUTH AMERICA: FOOD CERTIFICATION MARKET, BY APPLICATION, 2020–2023 (USD MILLION)
  • TABLE 317 SOUTH AMERICA: FOOD CERTIFICATION MARKET, BY APPLICATION, 2024–2029 (USD MILLION)
  • TABLE 318 SOUTH AMERICA: FOOD CERTIFICATION MARKET, BY END USER, 2020–2023 (USD MILLION)
  • TABLE 319 SOUTH AMERICA: FOOD CERTIFICATION MARKET, BY END USER, 2024–2029 (USD MILLION)
  • TABLE 320 SOUTH AMERICA: FOOD CERTIFICATION MARKET, BY CERTIFICATION SCOPE, 2020–2023 (USD MILLION)
  • TABLE 321 SOUTH AMERICA: FOOD CERTIFICATION MARKET, BY CERTIFICATION SCOPE, 2024–2029 (USD MILLION)
  • TABLE 322 SOUTH AMERICA: FOOD CERTIFICATION MARKET, BY PRICE SENSITIVITY, 2020–2023 (USD MILLION)
  • TABLE 323 SOUTH AMERICA: FOOD CERTIFICATION MARKET, BY PRICE SENSITIVITY, 2024–2029 (USD MILLION)
  • TABLE 324 BRAZIL: FOOD CERTIFICATION MARKET, BY CERTIFICATION TYPE, 2020–2023 (USD MILLION)
  • TABLE 325 BRAZIL: FOOD CERTIFICATION MARKET, BY CERTIFICATION TYPE, 2024–2029 (USD MILLION)
  • TABLE 326 BRAZIL: FOOD CERTIFICATION MARKET, BY SAFETY & QUALITY CERTIFICATIONS SUBTYPE, 2020–2023 (USD MILLION)
  • TABLE 327 BRAZIL: FOOD CERTIFICATION MARKET, BY SAFETY & QUALITY CERTIFICATIONS SUBTYPE, 2024–2029 (USD MILLION)
  • TABLE 328 BRAZIL: FOOD CERTIFICATION MARKET, BY DIETARY & LIFESTYLE CERTIFICATIONS SUBTYPE, 2020–2023 (USD MILLION)
  • TABLE 329 BRAZIL: FOOD CERTIFICATION MARKET, BY DIETARY & LIFESTYLE CERTIFICATIONS SUBTYPE, 2024–2029 (USD MILLION)
  • TABLE 330 BRAZIL: FOOD CERTIFICATION MARKET, BY APPLICATION, 2020–2023 (USD MILLION)
  • TABLE 331 BRAZIL: FOOD CERTIFICATION MARKET, BY APPLICATION, 2024–2029 (USD MILLION)
  • TABLE 332 ARGENTINA: FOOD CERTIFICATION MARKET, BY CERTIFICATION TYPE, 2020–2023 (USD MILLION)
  • TABLE 333 ARGENTINA: FOOD CERTIFICATION MARKET, BY CERTIFICATION TYPE, 2024–2029 (USD MILLION)
  • TABLE 334 ARGENTINA: FOOD CERTIFICATION MARKET, BY SAFETY & QUALITY CERTIFICATIONS SUBTYPE, 2020–2023 (USD MILLION)
  • TABLE 335 ARGENTINA: FOOD CERTIFICATION MARKET, BY SAFETY & QUALITY CERTIFICATIONS SUBTYPE, 2024–2029 (USD MILLION)
  • TABLE 336 ARGENTINA: FOOD CERTIFICATION MARKET, BY DIETARY & LIFESTYLE CERTIFICATIONS SUBTYPE, 2020–2023 (USD MILLION)
  • TABLE 337 ARGENTINA: FOOD CERTIFICATION MARKET, BY DIETARY & LIFESTYLE CERTIFICATIONS SUBTYPE, 2024–2029 (USD MILLION)
  • TABLE 338 ARGENTINA: FOOD CERTIFICATION MARKET, BY APPLICATION, 2020–2023 (USD MILLION)
  • TABLE 339 ARGENTINA: FOOD CERTIFICATION MARKET, BY APPLICATION, 2024–2029 (USD MILLION)
  • TABLE 340 REST OF SOUTH AMERICA: FOOD CERTIFICATION MARKET, BY CERTIFICATION TYPE, 2020–2023 (USD MILLION)
  • TABLE 341 REST OF SOUTH AMERICA: FOOD CERTIFICATION MARKET, BY CERTIFICATION TYPE, 2024–2029 (USD MILLION)
  • TABLE 342 REST OF SOUTH AMERICA: FOOD CERTIFICATION MARKET, BY SAFETY & QUALITY CERTIFICATIONS SUBTYPE, 2020–2023 (USD MILLION)
  • TABLE 343 REST OF SOUTH AMERICA: FOOD CERTIFICATION MARKET, BY SAFETY & QUALITY CERTIFICATIONS SUBTYPE, 2024–2029 (USD MILLION)
  • TABLE 344 REST OF SOUTH AMERICA: FOOD CERTIFICATION MARKET, BY DIETARY & LIFESTYLE CERTIFICATIONS SUBTYPE, 2020–2023 (USD MILLION)
  • TABLE 345 REST OF SOUTH AMERICA: FOOD CERTIFICATION MARKET, BY DIETARY & LIFESTYLE CERTIFICATIONS SUBTYPE, 2024–2029 (USD MILLION)
  • TABLE 346 REST OF SOUTH AMERICA: FOOD CERTIFICATION MARKET, BY APPLICATION, 2020–2023 (USD MILLION)
  • TABLE 347 REST OF SOUTH AMERICA: FOOD CERTIFICATION MARKET, BY APPLICATION, 2024–2029 (USD MILLION)
  • TABLE 348 OVERVIEW OF STRATEGIES ADOPTED BY KEY PLAYERS IN FOOD CERTIFICATION MARKET
  • TABLE 349 FOOD CERTIFICATION MARKET: DEGREE OF COMPETITION (COMPETITIVE)
  • TABLE 350 FOOD CERTIFICATION MARKET: TYPE FOOTPRINT
  • TABLE 351 FOOD CERTIFICATION MARKET: APPLICATION FOOTPRINT
  • TABLE 352 FOOD CERTIFICATION MARKET: REGIONAL FOOTPRINT
  • TABLE 353 FOOD CERTIFICATION MARKET: DETAILED LIST OF KEY STARTUPS/SMES
  • TABLE 354 FOOD CERTIFICATION MARKET: COMPETITIVE BENCHMARKING OF KEY STARTUPS/SMES
  • TABLE 355 FOOD CERTIFICATION MARKET: PRODUCT LAUNCHES/DEVELOPMENTS/APPROVALS, SEPTEMBER 2020–MARCH 2023
  • TABLE 356 FOOD CERTIFICATION MARKET: DEALS, SEPTEMBER 2020–MARCH 2023
  • TABLE 357 FOOD CERTIFICATION MARKET: EXPANSIONS, SEPTEMBER 2020–MARCH 2023
  • TABLE 358 SGS: COMPANY OVERVIEW
  • TABLE 359 SGS: PRODUCTS/SOLUTIONS/SERVICES OFFERED
  • TABLE 360 SGS: PRODUCT LAUNCHES
  • TABLE 361 SGS: DEALS
  • TABLE 362 SGS: OTHER DEALS/DEVELOPMENTS
  • TABLE 363 EUROFINS SCIENTIFIC: COMPANY OVERVIEW
  • TABLE 364 EUROFINS SCIENTIFIC: PRODUCTS/SOLUTIONS/SERVICES OFFERED
  • TABLE 365 BUREAU VERITAS: COMPANY OVERVIEW
  • TABLE 366 BUREAU VERITAS: PRODUCTS/SOLUTIONS/SERVICES OFFERED
  • TABLE 367 BUREAU VERITAS: DEALS
  • TABLE 368 DEKRA: COMPANY OVERVIEW
  • TABLE 369 DEKRA: PRODUCTS/SOLUTIONS/SERVICES OFFERED
  • TABLE 370 DEKRA: DEALS
  • TABLE 371 INTERTEK GROUP PLC: COMPANY OVERVIEW
  • TABLE 372 INTERTEK GROUP PLC: PRODUCTS/SOLUTIONS/SERVICES OFFERED
  • TABLE 373 INTERTEK GROUP PLC: PRODUCT LAUNCHES
  • TABLE 374 INTERTEK GROUP PLC: DEALS
  • TABLE 375 DNV: COMPANY OVERVIEW
  • TABLE 376 DNV: PRODUCTS/SOLUTIONS/SERVICES OFFERED
  • TABLE 377 DNV: DEALS
  • TABLE 378 ASUREQUALITY: COMPANY OVERVIEW
  • TABLE 379 ASUREQUALITY: PRODUCTS/SOLUTIONS/SERVICES OFFERED
  • TABLE 380 TÜV SÜD: COMPANY OVERVIEW
  • TABLE 381 TÜV SÜD: PRODUCTS/SOLUTIONS/SERVICES OFFERED
  • TABLE 382 ALS: COMPANY OVERVIEW
  • TABLE 383 ALS: PRODUCTS/SOLUTIONS/SERVICES OFFERED
  • TABLE 384 ALS: DEALS
  • TABLE 385 ALS: EXPANSIONS
  • TABLE 386 UL LLC: COMPANY OVERVIEW
  • TABLE 387 UL LLC: PRODUCTS/SOLUTIONS/SERVICES OFFERED
  • TABLE 388 KIWA: COMPANY OVERVIEW
  • TABLE 389 KIWA: PRODUCTS/SOLUTIONS/SERVICES OFFERED
  • TABLE 390 KIWA: DEALS
  • TABLE 391 CONTROL UNION CERTIFICATIONS: COMPANY OVERVIEW
  • TABLE 392 CONTROL UNION CERTIFICATIONS: PRODUCTS/SOLUTIONS/SERVICES OFFERED
  • TABLE 393 CONTROL UNION CERTIFICATIONS: DEALS
  • TABLE 394 AIB INTERNATIONAL, INC.: COMPANY OVERVIEW
  • TABLE 395 AIB INTERNATIONAL, INC.: PRODUCTS/SOLUTIONS/SERVICES OFFERED
  • TABLE 396 AIB INTERNATIONAL, INC.: DEALS
  • TABLE 397 NSF: COMPANY OVERVIEW
  • TABLE 398 NSF: PRODUCTS/SOLUTIONS/SERVICES OFFERED
  • TABLE 399 SCS GLOBAL SERVICES: COMPANY OVERVIEW
  • TABLE 400 SCS GLOBAL SERVICES: PRODUCTS/SOLUTIONS/SERVICES OFFERED
  • TABLE 401 SGS GLOBAL SERVICES: DEALS
  • TABLE 402 INTL CERTIFICATION LIMITED: COMPANY OVERVIEW
  • TABLE 403 INTL CERTIFICATION LIMITED: PRODUCTS/SOLUTIONS/SERVICES OFFERED
  • TABLE 404 INDOCERT: COMPANY OVERVIEW
  • TABLE 405 INDOCERT: PRODUCTS/SOLUTIONS/SERVICES OFFERED
  • TABLE 406 TQ CERT: COMPANY OVERVIEW
  • TABLE 407 TQ CERT: PRODUCTS/SOLUTIONS/SERVICES OFFERED
  • TABLE 408 MS CERTIFICATION SERVICES PVT. LTD.: COMPANY OVERVIEW
  • TABLE 409 MS CERTIFICATION SERVICES PVT. LTD.: PRODUCTS/SOLUTIONS/SERVICES OFFERED
  • TABLE 410 SOCOTEC: COMPANY OVERVIEW
  • TABLE 411 SOCOTEC: PRODUCTS/SOLUTIONS/SERVICES OFFERED
  • TABLE 412 SAFE FOOD ALLIANCE: COMPANY OVERVIEW
  • TABLE 413 CDG CERTIFICATION LIMITED: COMPANY OVERVIEW
  • TABLE 414 EAGLE CERTIFICATION GROUP: COMPANY OVERVIEW
  • TABLE 415 EQUALITAS CERTIFICATIONS LIMITED: COMPANY OVERVIEW
  • TABLE 416 OCEAN: COMPANY OVERVIEW
  • TABLE 417 ADJACENT MARKETS TO FOOD CERTIFICATION MARKET
  • TABLE 418 CERTIFICATE AUTHORITY MARKET, BY OFFERING, 2017–2022 (USD MILLION)
  • TABLE 419 CERTIFICATE AUTHORITY MARKET, BY OFFERING, 2023–2028 (USD MILLION)
  • TABLE 420 FOOD CERTIFICATION MARKET, BY RISK CATEGORY, 2018–2022 (USD MILLION)
  • TABLE 421 FOOD CERTIFICATION MARKET, BY RISK CATEGORY, 2023–2028 (USD MILLION)
LIST OF FIGURES
 
  • FIGURE 1 FOOD CERTIFICATION MARKET: RESEARCH DESIGN
  • FIGURE 2 BREAKDOWN OF PRIMARY INTERVIEWS: BY COMPANY TYPE, DESIGNATION, AND REGION
  • FIGURE 3 FOOD CERTIFICATION MARKET SIZE ESTIMATION: BOTTOM-UP APPROACH
  • FIGURE 4 FOOD CERTIFICATION MARKET SIZE ESTIMATION: TOP-DOWN APPROACH
  • FIGURE 5 DATA TRIANGULATION
  • FIGURE 6 FOOD CERTIFICATION MARKET, BY CERTIFICATION TYPE, 2024 VS. 2029 (USD MILLION)
  • FIGURE 7 FOOD CERTIFICATION MARKET, BY APPLICATION, 2024 VS. 2029 (USD MILLION)
  • FIGURE 8 FOOD CERTIFICATION MARKET, END USER, 2024 VS. 2029 (USD MILLION)
  • FIGURE 9 FOOD CERTIFICATION MARKET, BY CERTIFICATION SCOPE, 2024 VS. 2029 (USD MILLION)
  • FIGURE 10 FOOD CERTIFICATION MARKET, BY PRICE SENSITIVITY, 2024 VS. 2029 (USD MILLION)
  • FIGURE 11 FOOD CERTIFICATION MARKET SHARE AND GROWTH RATE, BY REGION
  • FIGURE 12 INCREASE IN INSTANCES OF FOODBORNE OUTBREAKS TO DRIVE DEMAND FOR FOOD CERTIFICATION
  • FIGURE 13 US TO ACCOUNT FOR LARGEST MARKET SHARE IN 2024
  • FIGURE 14 SAFETY & QUALITY CERTIFICATIONS SEGMENT AND GERMANY TO ACCOUNT FOR LARGEST MARKET SHARE IN 2024
  • FIGURE 15 SAFETY & QUALITY CERTIFICATIONS SEGMENT TO HOLD LARGEST MARKET DURING FORECAST PERIOD
  • FIGURE 16 MEAT, POULTRY, AND SEAFOOD PRODUCTS SEGMENT TO ACCOUNT FOR LARGEST MARKET DURING FORECAST PERIOD
  • FIGURE 17 FOOD & BEVERAGE MANUFACTURERS SEGMENT TO DOMINATE MARKET DURING FORECAST PERIOD
  • FIGURE 18 MULTIPLE PRODUCT CERTIFICATIONS SEGMENT TO HOLD LARGEST MARKET DURING FORECAST PERIOD
  • FIGURE 19 COST-EFFECTIVE CERTIFICATIONS SEGMENT TO DOMINATE MARKET DURING FORECAST PERIOD
  • FIGURE 20 DRIVERS, RESTRAINTS, OPPORTUNITIES, AND CHALLENGES: FOOD CERTIFICATION MARKET
  • FIGURE 21 FOOD AND DRUG ADMINISTRATION BUDGET BY PROGRAM, 2023
  • FIGURE 22 ADOPTION OF GEN AI IN FOOD CERTIFICATION MARKET
  • FIGURE 23 FOOD SAFETY MANAGEMENT SYSTEM (FSMS)
  • FIGURE 24 TRENDS/DISRUPTIONS IMPACTING CUSTOMER BUSINESS
  • FIGURE 25 FOOD CERTIFICATION MARKET: VALUE CHAIN ANALYSIS
  • FIGURE 26 FOOD CERTIFICATION MARKET: SUPPLY CHAIN ANALYSIS
  • FIGURE 27 FOOD CERTIFICATION MARKET: ECOSYSTEM
  • FIGURE 28 FOOD CERTIFICATION MARKET: MARKET MAP
  • FIGURE 29 FOOD CERTIFICATION MARKET: PORTER’S FIVE FORCES ANALYSIS
  • FIGURE 30 KEY CRITERIA FOR BUYING FOOD CERTIFICATION
  • FIGURE 31 INVESTMENT AND FUNDING SCENARIO
  • FIGURE 32 FOOD CERTIFICATION MARKET, BY CERTIFICATION TYPE, 2024 VS. 2029 (USD MILLION)
  • FIGURE 33 FOOD CERTIFICATION MARKET, BY APPLICATION, 2024 VS. 2029 (USD MILLION)
  • FIGURE 34 FOOD CERTIFICATION MARKET, BY END USER, 2024 VS. 2029 (USD MILLION)
  • FIGURE 35 FOOD CERTIFICATION MARKET, BY CERTIFICATION SCOPE, 2024 VS. 2029 (USD MILLION)
  • FIGURE 36 FOOD CERTIFICATION MARKET, BY PRICE SENSITIVITY, 2024 VS. 2029 (USD MILLION)
  • FIGURE 37 CANADA TO RECORD HIGHEST CAGR IN FOOD CERTIFICATION MARKET
  • FIGURE 38 NORTH AMERICA: MARKET SNAPSHOT
  • FIGURE 39 ASIA PACIFIC: MARKET SNAPSHOT
  • FIGURE 40 REVENUE ANALYSIS OF KEY COMPANIES IN LAST THREE YEARS, 2021–2023 (USD BILLION)
  • FIGURE 41 ANNUAL REVENUE, 2023 (USD BILLION) VS. REVENUE GROWTH, 2021–2023
  • FIGURE 42 FOOD CERTIFICATION MARKET: COMPANY VALUATION (USD BILLION)
  • FIGURE 43 EBITDA, 2023 (USD BILLION)
  • FIGURE 44 FOOD CERTIFICATION MARKET: GLOBAL SNAPSHOT OF KEY PARTICIPANTS, 2023
  • FIGURE 45 FOOD CERTIFICATION MARKET: COMPANY EVALUATION MATRIX (KEY PLAYERS), 2023
  • FIGURE 46 FOOD CERTIFICATION MARKET: COMPANY FOOTPRINT
  • FIGURE 47 FOOD CERTIFICATION MARKET: COMPANY EVALUATION MATRIX (START-UPS/SMES), 2023
  • FIGURE 48 BRAND/PRODUCT COMPARISON
  • FIGURE 49 SGS: COMPANY SNAPSHOT
  • FIGURE 50 EUROFINS SCIENTIFIC: COMPANY SNAPSHOT
  • FIGURE 51 BUREAU VERITAS: COMPANY SNAPSHOT
  • FIGURE 52 DEKRA: COMPANY SNAPSHOT
  • FIGURE 53 INTERTEK GROUP PLC: COMPANY SNAPSHOT
  • FIGURE 54 DNV: COMPANY SNAPSHOT
  • FIGURE 55 ASUREQUALITY: COMPANY SNAPSHOT
  • FIGURE 56 TÜV SÜD: COMPANY SNAPSHOT
  • FIGURE 57 ALS: COMPANY SNAPSHOT


This research study involved the extensive use of secondary sources—directories and databases such as Bloomberg Businessweek and Factiva—to identify and collect information useful for a technical, market-oriented, and commercial study of the food certification market. In-depth interviews were conducted with various primary respondents—such as key industry participants, subject matter experts (SMEs), C-level executives of key market players, and industry consultants—to obtain and verify critical qualitative and quantitative information as well as to assess prospects.

Secondary Research

In the secondary research process, various sources, such as the International Organization for Standardization, The Global Food Safety Initiative (GFSI), Food and Drug Administration (FDA), United States Department of Agriculture (USDA), The Institute of Food Technologists (IFT), Centers for Disease Control and Prevention (CDC), European Food Safety Authority (EFSA), European Federation of National Associations of Measurement, Testing and Analytical Laboratories (EUROLAB), Food Safety and Standards Authority of India (FSSAI), and Food Standards Australia New Zealand (FSANZ) were referred to identify and collect information for this study. The secondary sources also include clinical studies and medical journals, press releases, investor presentations of companies, white papers, certified publications, articles by recognized authors and regulatory bodies, trade directories, and paid databases.

Secondary research was mainly conducted to obtain critical information about the industry’s supply chain, the total pool of key players, and market classification & segmentation according to the industry trends to the bottom-most level and geographical markets. It was also used to obtain information about the key developments from a market-oriented perspective.

Primary Research

The market comprises several stakeholders in the supply chain, which include raw material suppliers, equipment suppliers, and food certification systems, kits, and consumables manufacturers. Various primary sources from both the supply and demand sides of the market were interviewed to obtain qualitative and quantitative information. The primary interviewees from the supply-side include food certification manufacturers. The primary sources from the demand-side include distributors, importers, exporters, and end consumers.
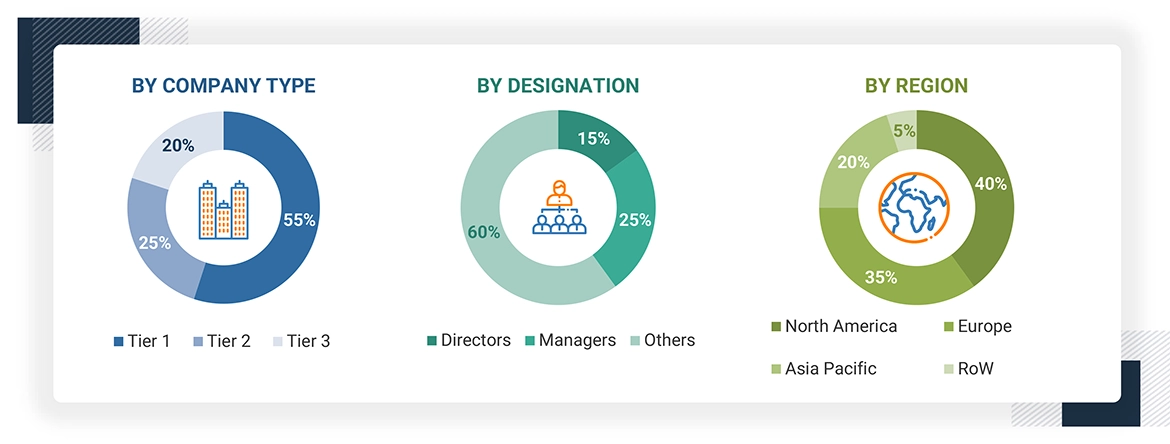
Food Certification Market Size, and Share

*RoW includes the South America Middle East and Africa.

To know about the assumptions considered for the study, download the pdf brochure

Market Size Estimation

Both the top-down and bottom-up approaches have been used to estimate and validate the total size of the food certification market. These approaches were extensively to determine the size of the subsegments in the market. The research methodology used to estimate the market size includes the following details:

Food Certification Market : Top-Down and Bottom-Up Approach

Food Certification Market Top Down and Bottom Up Approach

Data Triangulation

After arriving at the overall market size from the estimation process explained above, the total market was split into several segments and subsegments. The data triangulation and market breakdown procedures were employed, wherever applicable, to estimate the overall food certification market and arrive at the exact statistics for all segments and subsegments. The data was triangulated by studying various factors and trends from the demand and supply sides. Along with this, the market size was validated using both the top-down and bottom-up approaches.

Market Definition

The food certification market involves the certification of food products, production processes, and supply chains to ensure compliance with standards related to safety, quality, sustainability, and regulatory requirements. Certification bodies like ISO, BRC, and SQF provide independent assessments, covering food safety, product quality, sustainability practices, religious compliance (Halal, Kosher), and "free-from" standards (e.g., gluten-free). Key end-users include food and beverage manufacturers, retailers, restaurants, growers, and logistics providers. This market is driven by rising consumer demand for safe, sustainable food, stringent regulatory frameworks, and the need for compliance in global food trade. Certifications help businesses ensure product credibility, enhance consumer trust, and facilitate market differentiation.

Stakeholders

  • Food certification service providers
  • Food technologists
  • Food product manufacturers
  • Raw material suppliers

Report Objectives

MARKET INTELLIGENCE

  • To determine and project the size of the food certification market with respect to the certification type, application, end-user, certification scope, price sensitivity  and region, over five years, ranging from 2024 to 2029.
  • To identify the attractive opportunities in the market by determining the largest and fastest-growing segments across the key regions
  • To analyze the demand-side factors based on the following:
    • Impact of macro-and micro-economic factors on the market
    • Shifts in demand patterns across different subsegments and regions.

COMPETITIVE INTELLIGENCE

  • To identify and profile the key market players in the food certification market.
  • To determine the market share of key players operating in the food certification market
  • To provide a comparative analysis of the market leaders based on the following:
    • Service offerings
    • Business strategies
    • Strengths and weaknesses
    • Key financials
  • To understand the competitive landscape and identify the major growth strategies adopted by players across the key regions.

Available Customizations

With the given market data, MarketsandMarkets offers customizations according to company-specific scientific needs.

The following customization options are available for the report:

Product Analysis

  • Product Matrix, which gives a detailed comparison of the product portfolio of each company

Geographic Analysis as per Feasibility

  • Further breakdown of the Rest of Europe market for food certification into the Czech Republic, The Netherlands, Belgium, Hungary, Romania, and Ireland
  • Further breakdown of the Rest of South America market for food certification into Chile, Colombia, Paraguay, and Peru
  • Further breakdown of other countries in the RoW market for food certification into the Middle East & Africa

Company Information

  • Detailed analyses and profiling of additional market players (up to five)

Previous Versions of this Report

Food Certification Market by Type (Iso 22000, Brc, Sqf, Ifs, Halal, Kosher, Free-Form Certifications), Application(Meat, Poultry, and Seafood, Dairy, Infant Food, Beverages, Bakery & Confectionery), Risk Category and Region - Global Forecast to 2028

Report Code FB 3386
Published in Jul, 2023, By MarketsandMarkets™

Food Certification Market by Type (ISO 22000, BRC, SQF, IFS, Halal, Kosher, Free-From Certification), Application (Meat, Poultry, and Seafood, Dairy, Infant Food, Beverages, Bakery & Confectionery), Risk Category, and Region - Global Forecast to 2025

Report Code FB 3386
Published in Nov, 2020, By MarketsandMarkets™

Food Certification Market by Type (ISO 22000, BRC, SQF, IFS, Halal, Kosher, Free-From Certification), Application (Meat, Poultry, and Seafood, Dairy, Infant Food, Beverages, Bakery & Confectionery), Risk Category, and Region - Global Forecast to 2023

Report Code FB 3386
Published in May, 2018, By MarketsandMarkets™

Food Certification Market by Type (ISO 22000, BRC, SQF, IFS, Halal, Kosher, Free-From Certification), Application (Meat, Poultry, and Seafood, Dairy, Infant Food, Beverages, Bakery & Confectionery), Risk Category, and Region - Global Forecast to 2023

Report Code FB 3386
Published in May, 2015, By MarketsandMarkets™
"Our USP is "providing game-changing business opportunities reports with free customization" - so please feel free to provide us with your specific areas of interest / business challenges in much greater detail !!"

We appreciate your interest in this report. Once you fill out the form, you'll be immediately directed to an exclusive solution tailored to your needs. This high-value offering can help boost your revenue by 30% - a must-see opportunity for anyone looking to maximize growth.


By clicking the "Submit" button, you are agreeing to the Terms of Use and Privacy Policy.

Custom Market Research Services

We Will Customise The Research For You, In Case The Report Listed Above Does Not Meet With Your Requirements

Get 10% Free Customisation

Growth opportunities and latent adjacency in Food Certification Market

DMCA.com Protection Status