Rapid Test Market (Services) by Technology (PCR, Immunoassay, HPLC, GC-MS, LC-MS/MS), Contaminant (Pathogens, Meat speciation, GMO, Allergens, Pesticides, Mycotoxin, Heavy Metals), Food Tested (Processed, Crops), and Region - Global Forecast to 2022


[225 Pages Report] The rapid test market, in terms of value, was valued at USD 10.14 Billion in 2016. It is projected to reach USD 15.71 Billion by 2022, at a CAGR of 7.7% from 2017. Rapid test includes the testing of food products for various contaminants such as pathogens, meat speciation, GMOs, allergens, pesticides, mycotoxins, heavy metals, and others. The growing demand for faster as well as quantitative test results to ensure food safety is driving the market for rapid test. The market players are responding to these new opportunities by expanding their global presence and service offerings.
The objectives of the study are:
- To define, segment, and forecast the size of the rapid test market with respect to contaminant, technology, food tested, and region
- To analyze the market structure by identifying various subsegments of the rapid test market
- To forecast the size of the market and its various submarkets with respect to four main regions, namely, North America, Asia Pacific, Europe, and the Rest of the World (RoW)
- To provide detailed information about crucial factors that are influencing the growth of the market (drivers, restraints, opportunities, and challenges)
- To analyze opportunities in the market for stakeholders and provide details of the competitive landscape for market leaders
- To strategically profile key players and comprehensively analyze their market share and core competencies
- To analyze competitive developments such as expansions & investments, acquisitions, new product/service & technology launches, agreements, collaborations, and partnerships in the rapid test market
The years considered for the study are as follows:
- Base Year: 2016
- Estimated Year: 2017
- Projected Year: 2022
- Forecast Period: 2017 to 2022
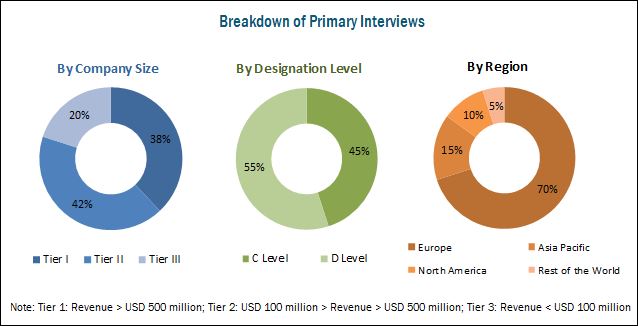
This report includes estimations of the market size in terms of value (USD million). Both, top-down and bottom-up approaches have been used to estimate and validate the size of the rapid test market and to estimate the size of various other dependent submarkets in the overall market. Key players in the market have been identified through secondary research through various sources such as the Centers for Disease Control and Prevention (CDC), The European Federation of National Associations of Measurement, Testing and Analytical Laboratories (EUROLAB), The World Health Organization (WHO), I.E. Canada (Canadian Association of Importers and Exporters), Food and Agricultural Organization (FAO), Food Safety Council (FSC), and Statistics Canada, and their market share in the respective regions have been determined through primary and secondary research. All percentage shares, splits, and breakdowns have been determined using secondary sources and were verified through primary sources.
To know about the assumptions considered for the study, download the pdf brochure
The rapid test ecosystem comprises rapid test service providers such as SGS, Bureau Veritas, Intertek, Eurofins, TUV SUD, and Merieux NutriSciences as the major players. Other players such as ALS Limited, AsureQuality, Microbac Laboratories, Genetic ID, and Romer Labs also have a significant presence in this market.
Target Audience:
- R&D institutes
- Technology providers
- Rapid test service providers
- Intermediary suppliers
- Wholesalers
- Dealers
- Consumers
- End users
- Retailers
“The study answers several questions for stakeholders, primarily which market segments to focus on in the next two to five years for prioritizing efforts and investments.”
Scope of the report
This research report categorizes the rapid test market based on contaminant, technology, food tested, and region.
Based on Contaminant, the market has been segmented as follows:
- Pathogens
- Meat speciation
- GMOs
- Allergens
- Pesticides
- Mycotoxins
- Heavy metals
- Others
Based on Technology, the market has been segmented as follows:
- PCR-based
- Immunoassay-based
- Chromatography-based
- Spectroscopy-based
Based on Food Tested, the market has been segmented as follows:
- Meat & seafood products
- Dairy & dairy products
- Processed foods
- Fruits & vegetables
- Cereals & grains
- Nuts, seeds, and spices
- Crops
- Others
Based on Region, the market has been segmented as follows:
- North America
- Europe
- Asia Pacific
- RoW (South America and the Middle East & Africa)
Available Customizations
With the given market data, MarketsandMarkets offers customizations according to client-specific scientific needs.
The following customization options are available for the report:
Segmental Analysis
- Segmental analysis, which provides further breakdown of the in the pathogens, meat speciation, GMOs, allergens, pesticides, mycotoxins, and heavy metals in contaminant segment.
Geographic Analysis
- Further breakdown of the Rest of Asia-Pacific rapid test market, by country
- Further breakdown of other countries in the Rest of the World rapid test market, by key country
Company Information
- Detailed analyses and profiling of additional market players (up to five)
The rapid test market has grown exponentially in the last few years. The market size is projected to reach USD 15.71 Billion by 2022, growing at a CAGR of around 7.7% from 2017. Emerging countries such as India, China, India, Brazil, and Argentina are the potential primary markets of the industry. Factors such as rising demand for rapid test result to enhance productivity, increasing food recalls to ensure consumer safety, stringent regulatory environment, and the emergence of new technologies are the major driving factors for this market. Moreover, the increasing international trade activities helps to drive the growth of the rapid test industry.
The global market, based on contaminant, is segmented into pathogens, meat speciation, GMOs, allergens, pesticides, mycotoxins, heavy metals, and others which include residues such as veterinary drugs, processing induced chemicals, and dioxins & PCBs. The pathogens segment dominated the market with the largest share in 2016 since the foodborne outbreaks due to pathogens contaminated food products are increasing in the developing as well as developed countries. This is followed by GMO testing of food which is conducted because the seeds have been modified to improve the resistance of plants against insecticides and herbicides. Due to stringent regulations in various regions, several types of foods are tested for GMO content before their introduction in the market.
The rapid test market, based on technology, is segmented into PCR-based, immunoassay-based, chromatography-based, and spectroscopy-based. The PCR-based tests segment dominated the market in 2016 and is projected to grow at the highest CAGR from 2017 to 2022. PCR-based technologies assure reliable and faster test results by automation and use of DNA as a testing basis.
The global market, based on food tested, is segmented into meat & seafood products, dairy & dairy products, processed foods, fruits & vegetables, cereals & grains, nuts, seeds, & spices, crops, and others which include food additives, and sauces. The meat & seafood products segment dominated the market in 2016 and is projected to grow at the highest CAGR due to an increase in foodborne illness due to contaminated meat and regulatory mandates in various regions.
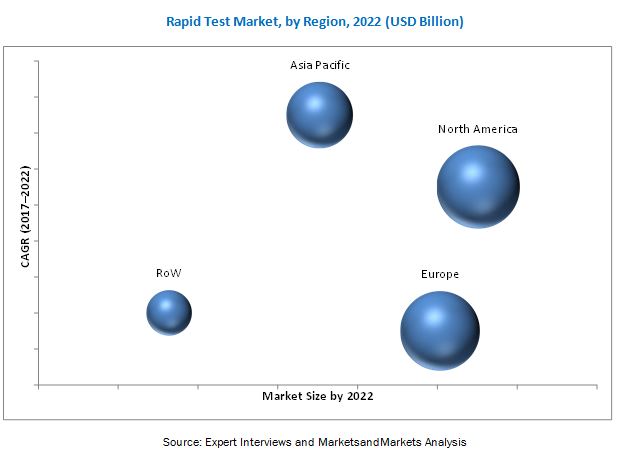
The North American region is projected to dominate the rapid test market in 2022. The Asia-Pacific region is projected to be the fastest-growing market during the forecast period since the demand the countries such as China and India is increasing due to growing international trade from the countries. Other factors responsible for the growth of the Asia-Pacific market are the emerging countries and growing R&D activities for launching new technologies
The cost of rapid test is very high due to the high cost of testing equipment. Automated instruments provide reliable and faster test results. However, due to the high cost of instruments, the testing cost also increases.
Expansions & investments, acquisitions, new products/service & technology launches, agreements, collaborations, and are the key strategies adopted by market players to ensure their growth in the market. The market is dominated by players such as SGS (Switzerland), Bureau Veritas (France), Intertek (UK), Eurofins (Luxembourg), TUV SUD (Germany) and ALS Limited (Australia). Other major players in the market include Merieux NutriSciences (US), AsureQuality (New Zealand), Microbac Laboratories (US), Genetic ID (US), Romer Labs (Austria), and OMIC USA.
Frequently Asked Questions (FAQ):
What is market potential Across Product categories in Agri commodities (such as Rice, Oil Seeds, Dairy, Animal Feed etc.?
- Meat, poultry, & Seafood
- Dairy Products
- Processed Food
- Fruits & Vegetables
- Cereals & Grains
- Nuts, Seeds, and Spices
- Feed
Do you cover an assessment of the technologies prevalent in Rapid Portable Industry?
- PCR-Based
- Immunoassay-Based
- Enzyme Substrate-Based & Others
What can be other feasible segmentation?
-
Rapid test equipment market size, by type (USD Million)
- Hybridization-Based
- Chromatography-Based
- Spectrometry-Based
- Immunoassay-Based
- Biosensors
- Other technologies
-
Food test kits market size, by targets tested (USD Million)
- Allergens
- Mycotoxins
- Pathogens
- GMOs
- Meat Species
- Others
Does this report cover a detailed Competitor Analysis – Integrated Solution Providers?
Industry wide analysis on drivers and restraints.
To speak to our analyst for a discussion on the above findings, click Speak to Analyst
 Exclusive indicates content/data unique to MarketsandMarkets and not available with any competitors.
Table of Contents
1 Introduction (Page No. - 20)
1.1 Objectives of the Study
1.2 Market Definition
1.3 Study Scope
1.4 Periodization Considered
1.5 Currency Considered
1.6 Stakeholders
2 Research Methodology (Page No. - 24)
2.1 Research Data
2.1.1 Secondary Data
2.1.2 Primary Data
2.1.2.1 Breakdown of Primaries
2.2 Market Size Estimation
2.3 Data Triangulation
2.4 Research Assumptions and Limitations
2.4.1 Research Limitations
2.4.2 Research Assumptions
3 Executive Summary (Page No. - 31)
4 Premium Insights (Page No. - 38)
4.1 Opportunities in this Market
4.2 Rapid Test Market: Key Country
4.3 Market, By Contaminant & Region
4.4 Developed vs Developing Markets for Rapid Test
4.5 Market, By Contaminant & Technology
4.6 Market, By Food Tested
4.7 North America: Rapid Test Market, By Contaminant & Country, 2016
5 Market Overview (Page No. - 45)
5.1 Introduction
5.2 Industry Trends
5.2.1 Real Time PCR Technique
5.2.2 Immunoassay-Based
5.2.3 Next Generation Sequencing (NGS)
5.2.4 Chromatography-Based
5.2.5 Mass Spectroscopy-Based
5.2.6 Substrate Technology
5.2.7 Microfluidics
5.2.8 Biosensor
5.3 Market Dynamics
5.3.1 Drivers
5.3.1.1 Growth in Demand for Faster and Reliable Test Results
5.3.1.2 Increase in R&D Activities
5.3.1.3 Increase in the Number of Foodborne Illness
5.3.1.4 Increase in Food Recalls
5.3.1.5 Globalization of Food Trade
5.3.1.5.1 Increase in Demand for Processed Food
5.3.1.5.2 Complexity of the Supply Chain
5.3.1.6 Implementation of Stringent Food Safety Regulations in Developed Countries
5.3.2 Restraints
5.3.2.1 Lack of Food Control Infrastructure & Resources in Developing Countries
5.3.2.2 Complexity in Testing Techniques
5.3.2.2.1 Varying Test Results With Different Test Methods
5.3.2.3 Lack of Harmonization of Food Safety Regulations
5.3.3 Opportunities
5.3.3.1 Active Involvement of Government, Non-Government, and Regulatory Bodies for Food Safety
5.3.3.2 Growth in Awareness Among Consumers About Food Safety
5.3.3.3 Emerging Markets in Asian, African, and Other Developing Countries
5.3.4 Challenges
5.3.4.1 High Cost Associated With Technologies
5.3.4.1.1 Upgradation of New Technologies By Service Providers
5.3.4.2 Difficulty in Sample Collection
6 Regulations (Page No. - 62)
6.1 Introduction
6.2 International Body for Food Safety Standards and Regulations
6.2.1 Codex Alimentarius Commission (CAC)
6.3 Global Food Safety Initiative (GFSI)
6.4 North America
6.4.1 US Regulations
6.4.1.1 Federal Legislation
6.4.1.1.1 State Legislation
6.4.1.1.2 Food Safety in Retail Food
6.4.1.1.3 Food Safety in Trade
6.4.1.1.4 Haccp Regulation in the US
6.4.1.1.5 US Regulation for Foodborne Pathogens in Poultry
6.4.1.1.6 Food Safety Regulations for Fruit & Vegetable Growers
6.4.1.1.7 GMOS Regulation in US
6.4.1.1.8 FDA Food Safety Modernization Act (FSMA)
6.4.1.1.9 Labeling of Gm Foods
6.4.1.1.10 Regulatory Guidance By FDA for Aflatoxins
6.4.1.1.11 Pesticide Regulation in the US
6.4.2 Canada
6.4.3 Mexico
6.5 Europe
6.5.1 European Union Regulations
6.5.1.1 The Microbiological Criteria Regulation
6.5.1.2 Melamine Legislation
6.5.1.3 General Food Law for Food Safety
6.5.1.4 GMOS Regulation
6.5.1.5 Toxins Regulation
6.5.1.5.1 Ochratoxin A
6.5.1.5.2 Dioxin and PBCS
6.5.1.5.3 Fusarium Toxins
6.5.1.5.4 Aflatoxins
6.5.1.5.5 Polycyclic Aromatic Hydrocarbons (PAH)
6.5.2 Germany
6.5.3 UK
6.5.4 France
6.5.5 Italy
6.5.6 Poland
6.6 Asia Pacific
6.6.1 China
6.6.1.1 The Regulating Bodies for Food Safety in China Are:
6.6.1.2 Major Efforts of China Have Been to Standardize Its Food Safety System That Includes:
6.6.2 Japan
6.6.3 India
6.6.3.1 Food Safety Standards Amendment Regulations, 2012
6.6.3.2 Food Safety Standards Amendment Regulations, 2011
6.6.3.3 Food Safety and Standards Act, 2006
6.6.4 Australia
6.6.4.1 Food Standards Australia New Zealand
6.6.5 New Zealand
6.6.5.1 GMOS Labeling Regulation in the Asia Pacific
6.6.6 Indonesia
6.6.6.1 General Law for Food Safety
6.6.7 Regulation on Pesticides
6.6.8 Regulations on Mycotoxins in Food
6.6.9 Chemical Contaminants
6.6.10 Genetically Engineered Foods
6.6.11 Allergen: Regulation on Allergen Labeling in Food
6.7 Rest of the World
6.7.1 South Africa
6.7.1.1 International vs Local Standards & Legislations
6.7.1.2 Private Standards in South Africa & the Requirements for Product Testing
6.7.1.3 The Ministry of Agriculture, Livestock, and Food Supply (MAPA)
6.7.1.4 Ministry of Health (MS)
6.7.2 Argentina
7 Rapid Test Market, By Contaminant (Page No. - 86)
7.1 Introduction
7.2 Pathogens
7.3 Meat Speciation
7.4 GMOS
7.5 Allergens
7.6 Pesticides
7.7 Mycotoxins
7.8 Heavy Metals
7.9 Others
8 Rapid Test Market, By Technology (Page No. - 110)
8.1 Introduction
8.2 PCR-Based
8.3 Immunoassay-Based
8.4 Chromatography-Based
8.4.1 LC-MS
8.4.2 GC-MS
8.4.3 LC-MS/MS
8.5 Spectroscopy-Based
9 Rapid Test Market, By Food Tested (Page No. - 120)
9.1 Introduction
9.2 Meat & Seafood Products
9.3 Dairy Products
9.4 Processed Food
9.5 Fruits & Vegetables
9.6 Cereals & Grains
9.7 Nuts, Seeds, and Spices
9.8 Crops
9.9 Others
10 Rapid Test Market, By Region (Page No. - 131)
10.1 Introduction
10.2 North America
10.2.1 US
10.2.2 Canada
10.2.3 Mexico
10.3 Europe
10.3.1 Germany
10.3.2 UK
10.3.3 France
10.3.4 Italy
10.3.5 Spain
10.3.6 Rest of Europe
10.4 Asia Pacific
10.4.1 China
10.4.2 Japan
10.4.3 India
10.4.4 Australia & New Zealand
10.4.5 Rest of Asia Pacific
10.5 Rest of the World (RoW)
10.5.1 Brazil
10.5.2 Argentina
10.5.3 Others in RoW
11 Company Profiles (Page No. - 165)
(Company Overview, Strength of Product Portfolio, Product Offerings, Business Strategy Excellence, Recent Developments)*
11.1 SGS
11.2 Eurofins
11.3 Intertek
11.4 Bureau Veritas
11.5 ALS Limited
11.6 Merieux Nutrisciences
11.7 TUV SUD
11.8 Asurequality
11.9 Microbac Laboratories
11.10 Genetic ID
11.11 Romer Labs
11.12 OMIC USA
*Details on Company Overview, Strength of Product Portfolio, Product Offerings, Business Strategy Excellence, Recent Developments Might Not Be Captured in Case of Unlisted Companies.
12 Appendix (Page No. - 210)
12.1 Discussion Guide
12.2 More Company Developments
12.2.1 New Services/Products and Technology Launches
12.2.2 Expansions & Investments
12.2.3 Acquisitions
12.2.4 Agreements, Collaborations, and Partnerships
12.3 Knowledge Store: Marketsandmarkets’ Subscription Portal
12.4 Introducing RT: Real-Time Market Intelligence
12.5 Available Customizations
12.6 Related Reports
12.7 Author Details
List of Tables (99 Tables)
Table 1 Food Recalls in Australia & New Zealand, 2010–2015
Table 2 Allergen Recalls in the US, 2015
Table 3 Chemical Outbreaks in the World, 2011–2015
Table 4 Number of Certification Agencies and Laboratories
Table 5 Food Products From the US Banned in Other Countries
Table 6 Federal Food, Drug, and Cosmetic Act, By Tolerances of Raw & Processed Food
Table 7 Maximum Level for Melamine & Its Structural Analogs
Table 8 GMOS: Labeling Requirement
Table 9 Commission Regulation for Ochratoxin A
Table 10 Maximum Levels of Various Types of Mycotoxins in Different Foods
Table 11 GMOS Labeling in Asia Pacific Countries
Table 12 Rapid Test Market Size, By Contaminant, 2015–2022 (USD Million)
Table 13 Foodborne Disease-Causing Organisms
Table 14 Food Pathogens: Inspection Rate & Incidence of Foodborne Illness, (Per 100,000 Population), 2013
Table 15 Pathogens: Market Size for Rapid Test, By Region, 2015–2022 (USD Million)
Table 16 Pathogens: Market Size, By Technology, 2015–2022 (USD Million)
Table 17 Pathogens: Market Size, By Food Tested, 2015–2022 (USD Million)
Table 18 Meat Speciation: Rapid Test Market Size, By Region, 2015–2022 (USD Million)
Table 19 Meat Speciation: Market Size, By Technology, 2015–2022 (USD Million)
Table 20 GMOS: Market Size for Rapid Test, By Region, 2015–2022 (USD Million)
Table 21 GMOS: Market Size, By Technology, 2015–2022 (USD Million)
Table 22 GMOS: Market Size, By Food Tested, 2015–2022 (USD Million)
Table 23 Allergens: Rapid Test Market Size, By Region, 2015–2022 (USD Million)
Table 24 Allergens: Market Size, By Technology, 2015–2022 (USD Million)
Table 25 Allergens: Market Size, By Food Tested, 2015–2022 (USD Million)
Table 26 Pesticides: Market Size for Rapid Test, By Region, 2015–2022 (USD Million)
Table 27 Pesticides: Market Size, By Technology, 2015–2022 (USD Million)
Table 28 Pesticides: Market Size, By Food Tested, 2015–2022 (USD Million)
Table 29 Mycotoxins: Occurrence, Source, and Health Effects
Table 30 Mycotoxins: Market Size for Rapid Test, By Region, 2015–2022 (USD Million)
Table 31 Mycotoxins: Market Size, By Technology, 2015–2022 (USD Million)
Table 32 Mycotoxins: Market Size, By Food Tested, 2015–2022 (USD Million)
Table 33 Specified Limits for Metal Contaminants in Food By Fssai
Table 34 Heavy Metals: Market Size for Rapid Test, By Region, 2015–2022 (USD Million)
Table 35 Heavy Metals: Market Size, By Technology, 2015–2022 (USD Million)
Table 36 Heavy Metals: Market Size, By Food Tested, 2015–2022 (USD Million)
Table 37 Others: Rapid Test Market Size, By Region, 2015–2022 (USD Million)
Table 38 Others: Market Size, By Technology, 2015–2022 (USD Million)
Table 39 Others: Market Size, By Food Tested, 2015–2022 (USD Million)
Table 40 Market Size for Rapid Test, By Technology, 2015–2022 (USD Million)
Table 41 Chromatography-Based Rapid Test Market Size, By Technology, 2015–2022 (USD Million)
Table 42 PCR-Based Rapid Test Market Size, By Contaminant, 2015–2022 (USD Million)
Table 43 Immunoassay-Based Rapid Test Market Size, By Contaminant, 2015–2022 (USD Million)
Table 44 Chromatography-Based Rapid Test Market Size, By Contaminant, 2015–2022 (USD Million)
Table 45 LC-MS: Market Size for Rapid Test, By Contaminant, 2015–2022 (USD Million)
Table 46 GC-MS: Market Size, By Contaminant, 2015–2022 (USD Million)
Table 47 LC-MS/MS: Market Size, By Contaminant, 2015–2022 (USD Million)
Table 48 Spectroscopy-Based: Market Size for Rapid Test, By Contaminant, 2015–2022 (USD Million)
Table 49 Rapid Test Market Size, By Food Tested, 2015–2022 (USD Million)
Table 50 Meat & Seafood Products: Market Size for Rapid Test, By Contaminant, 2015–2022 (USD Million)
Table 51 Dairy Products: Market Size for Rapid Test, By Contaminant, 2015–2022 (USD Million)
Table 52 Processed Food: Market Size for Rapid Test, By Contaminant, 2015–2022 (USD Million)
Table 53 Fruits & Vegetables: Market Size for Rapid Test, By Contaminant, 2015–2022 (USD Million)
Table 54 Cereals & Grans: Rapid Test Market Size, By Contaminant, 2015–2022 (USD Million)
Table 55 Nuts, Seeds, and Spices: Market Size for Rapid Test, By Contaminant, 2015–2022 (USD Million)
Table 56 Others: Market Size for Rapid Test, By Contaminant, 2015–2022 (USD Million)
Table 57 Market Size for Rapid Test, By Region, 2015–2022 (USD Million)
Table 58 North America: Market Size for Rapid Test, By Country, 2015–2022 (USD Million)
Table 59 North America: Market Size, By Contaminant, 2015–2022 (USD Million)
Table 60 US: Food Fraud Details
Table 61 US: Market Size, By Contaminant, 2015–2022 (USD Million)
Table 62 Canada: Food Fraud Details
Table 63 Canada: Market Size, By Contaminant, 2015–2022 (USD Million)
Table 64 Mexico: Market Size, By Contaminant, 2015–2022 (USD Million)
Table 65 Europe: Rapid Test Market Size, By Country, 2015–2022 (USD Million)
Table 66 Europe: Market Size, By Contaminant, 2015–2022 (USD Million)
Table 67 Germany: Food Fraud Details
Table 68 Germany: Market Size, By Contaminant, 2015–2022 (USD Million)
Table 69 UK: Food Fraud Details
Table 70 UK: Market Size, By Contaminant, 2015–2022 (USD Million)
Table 71 France: Food Fraud Details
Table 72 France: Market Size, By Contaminant, 2015–2022 (USD Million)
Table 73 Italy: Food Fraud Details
Table 74 Italy: Market Size, By Contaminant, 2015–2022 (USD Million)
Table 75 Spain: Market Size, By Contaminant, 2015–2022 (USD Million)
Table 76 Rest of Europe: Food Fraud Details
Table 77 Rest of Europe: Rapid Test Market Size, By Contaminant, 2015–2022 (USD Million)
Table 78 Asia Pacific: Market Size for Rapid Test, By Country, 2015–2022 (USD Million)
Table 79 Asia Pacific: Market Size, By Contaminant, 2015–2022 (USD Million)
Table 80 China: Food Fraud Details
Table 81 China: Market Size for Rapid Test, By Contaminant, 2015–2022 (USD Million)
Table 82 Japan: Market Size for Rapid Test, By Contaminant, 2015–2022 (USD Million)
Table 83 India: Food Fraud Details
Table 84 India: Market Size, By Contaminant, 2015–2022 (USD Million)
Table 85 Australia & New Zealand: Food Fraud Details
Table 86 Australia & New Zealand: Market Size for Rapid Test, By Contaminant, 2015–2022 (USD Million)
Table 87 Rest of Asia Pacific: Food Fraud Details
Table 88 Rest of Asia Pacific: Rapid Test Market Size, By Contaminant, 2015–2022 (USD Million)
Table 89 RoW: Market Size for Rapid Test, By Country, 2015–2022 (USD Million)
Table 90 RoW: Market Size, By Contaminant, 2015–2022 (USD Million)
Table 91 Brazil: Food Fraud Details
Table 92 Brazil: Market Size, By Contaminant, 2015–2022 (USD Million)
Table 93 Argentina: Market Size, By Contaminant, 2015–2022 (USD Million)
Table 94 Others in RoW: Food Fraud Details
Table 95 Others in RoW: Rapid Test Market Size, By Contaminant, 2015–2022 (USD Million)
Table 96 New Services/Products and Technology Launches, 2012–2017
Table 97 Expansions & Investments, 2013–2015
Table 98 Acquisitions, 2012–2017
Table 99 Agreements, Collaborations, and Partnerships, 2013–2016
List of Figures (48 Figures)
Figure 1 Market Segmentation
Figure 2 Regional Segmentation: Rapid Test Market
Figure 3 Research Design: Rapid Test
Figure 4 Market Size Estimation Methodology: Bottom-Up Approach
Figure 5 Market Size Estimation Methodology: Top-Down Approach
Figure 6 Data Triangulation Methodology
Figure 7 Rapid Test Market Snapshot, By Contaminant, 2017 vs 2022
Figure 8 Market Size, By Technology, 2017–2022
Figure 9 Market Size, By Food Tested, 2017–2022
Figure 10 Asia Pacific is the Fastest-Growing Region for this Market, 2017–2022
Figure 11 Rapid Test Market Share, By Region
Figure 12 Increase in Demand for Faster and Reliable Test Results to Drive the Growth of this Market
Figure 13 China to Be the Fastest-Growing Country in the Rapid Test Market By 2022
Figure 14 Pathogens Segment to Dominate the Market in 2016
Figure 15 Developing Countries to Emerge at the Highest Growth Rates During the Forecast Period
Figure 16 Share of Technologies in the Rapid Test Market, By Contaminant, 2016
Figure 17 Meat & Seafood Products Segment Projected to Be the Largest By 2022
Figure 18 US Accounted for the Largest Share in 2016
Figure 19 Market Dynamics: Rapid Test Market
Figure 20 US Federal R&D Expenditure Across All Major Agencies, 2016
Figure 21 Estimated Annual Cost of Foodborne Illness Caused By Salmonella in the US, 2013 (USD Million)
Figure 22 Estimated Annual Cost of Foodborne Illness Caused By Listeria in the US, 2013 (USD Million)
Figure 23 US Food Recalls, 2012–2014
Figure 24 Australian Government Investment in R&D, 2015–2016 (USD Billion)
Figure 25 Food Safety Improvements & Increased Budget Allocation By the FDA, 2015
Figure 26 Legislation Process in the EU
Figure 27 Role of EFSA to Reduce Campylobacteriosis
Figure 28 Food Commodities Associated With Salmonella Outbreaks, 2004–2008
Figure 29 Rapid Test Market Size, By Contaminant, 2017 vs 2022 (USD Million)
Figure 30 Pathogens: Market Size for Rapid Test, By Region, 2017 vs 2022
Figure 31 Meat Speciation: Market Size for Rapid Test, By Food Tested, 2015–2022 (USD Million)
Figure 32 Market Size, By Technology, 2017 vs 2022
Figure 33 PCR-Based: Market Size for Rapid Test, By Contaminant, 2017 vs 2022
Figure 34 Market Size, By Food Tested, 2017–2022 (USD Million)
Figure 35 Meat & Seafood Products: Rapid Test Market Size, By Contaminant, 2017 vs 2022 (USD Million)
Figure 36 Crops: Market Size, By Contaminant, 2015–2022 (USD Million)
Figure 37 US Held the Largest Share in this Market, 2016
Figure 38 North American: Market Snapshot
Figure 39 US: Number of Cases, Hospitalizations, and Deaths Caused By Pathogens, 2015
Figure 40 Europe: Market Snapshot
Figure 41 Asia Pacific: Market Snapshot
Figure 42 SGS: Company Snapshot
Figure 43 Eurofins: Company Snapshot
Figure 44 Intertek: Company Snapshot
Figure 45 Bureau Veritas: Company Snapshot
Figure 46 ALS Limited: Company Snapshot
Figure 47 TUV SUD: Company Snapshot
Figure 48 Asurequality: Company Snapshot


Growth opportunities and latent adjacency in Rapid Test Market