This research study involved the extensive use of secondary sources, directories, and databases, such as Dun & Bradstreet (D&B) Hoovers and Bloomberg BusinessWeek, to identify and collect information useful for a technical, market-oriented, and commercial study of the BYOD and Enterprise Mobility market. The primary sources have been mainly industry experts from the core and related industries and preferred suppliers, manufacturers, distributors, service providers, technology developers, alliances, and organizations related to all segments of the value chain of this market. In-depth interviews have been conducted with various primary respondents, including key industry participants, subject matter experts, C-level executives of key players, and industry consultants, to obtain and verify critical qualitative and quantitative information.
Secondary Research
The market for companies offering BYOD and Enterprise Mobility solutions and services to different verticals has been estimated and projected based on the secondary data made available through paid and unpaid sources and by analyzing their product portfolios in the ecosystem of the BYOD and Enterprise Mobility market. It also involved rating company products based on their performance and quality. In the secondary research process, various sources such as academic journals, Enterprise Mobility Expert Alliance, Enterprise Mobility Exchange, Cloud Security Alliance, Journal of Strategic Information Systems, and International Journal of Communication Systems (IJCS) have been referred to for identifying and collecting information for this study on the BYOD and Enterprise Mobility market. The secondary sources included annual reports, press releases, investor presentations of companies, white papers, journals, and certified publications and articles by recognized authors, directories, and databases. Secondary research has been mainly used to obtain key information about the supply chain of the market, the total pool of key players, market classification, segmentation according to industry trends to the bottommost level, regional markets, and key developments from both market- and technology-oriented perspectives that have been further validated by primary sources.
Primary Research
In the primary research process, various primary sources from both the supply and demand sides were interviewed to obtain qualitative and quantitative information on the market. The primary sources from the supply side included various industry experts, including Chief Experience Officers (CXOs); Vice Presidents (VPs); directors from business development, marketing, and product development/innovation teams; related key executives from BYOD and Enterprise Mobility solution vendors, SIs, professional service providers, and industry associations; and key opinion leaders. Primary interviews were conducted to gather insights, such as market statistics, revenue data collected from solutions and services, market breakups, market size estimations, market forecasts, and data triangulation. Primary research also helped in understanding various trends related to technologies, applications, deployments, and regions. Stakeholders from the demand side, such as Chief Information Officers (CIOs), Chief Technology Officers (CTOs), Chief Strategy Officers (CSOs), and end users using BYOD and Enterprise Mobility solutions, were interviewed to understand the buyer’s perspective on suppliers, products, service providers, and their current usage of BYOD and Enterprise Mobility solutions which would impact the overall BYOD and Enterprise Mobility market.

To know about the assumptions considered for the study, download the pdf brochure
Market Size Estimation
Multiple approaches were adopted to estimate and forecast the size of the BYOD and Enterprise Mobility market. The first approach involves estimating market size by summing up the revenue generated by companies through the sale of BYOD and Enterprise Mobility offerings.
Both top-down and bottom-up approaches were used to estimate and validate the total size of the BYOD and Enterprise Mobility market. These methods were extensively used to estimate the size of various segments in the market. The research methodology used to estimate the market size includes the following:
-
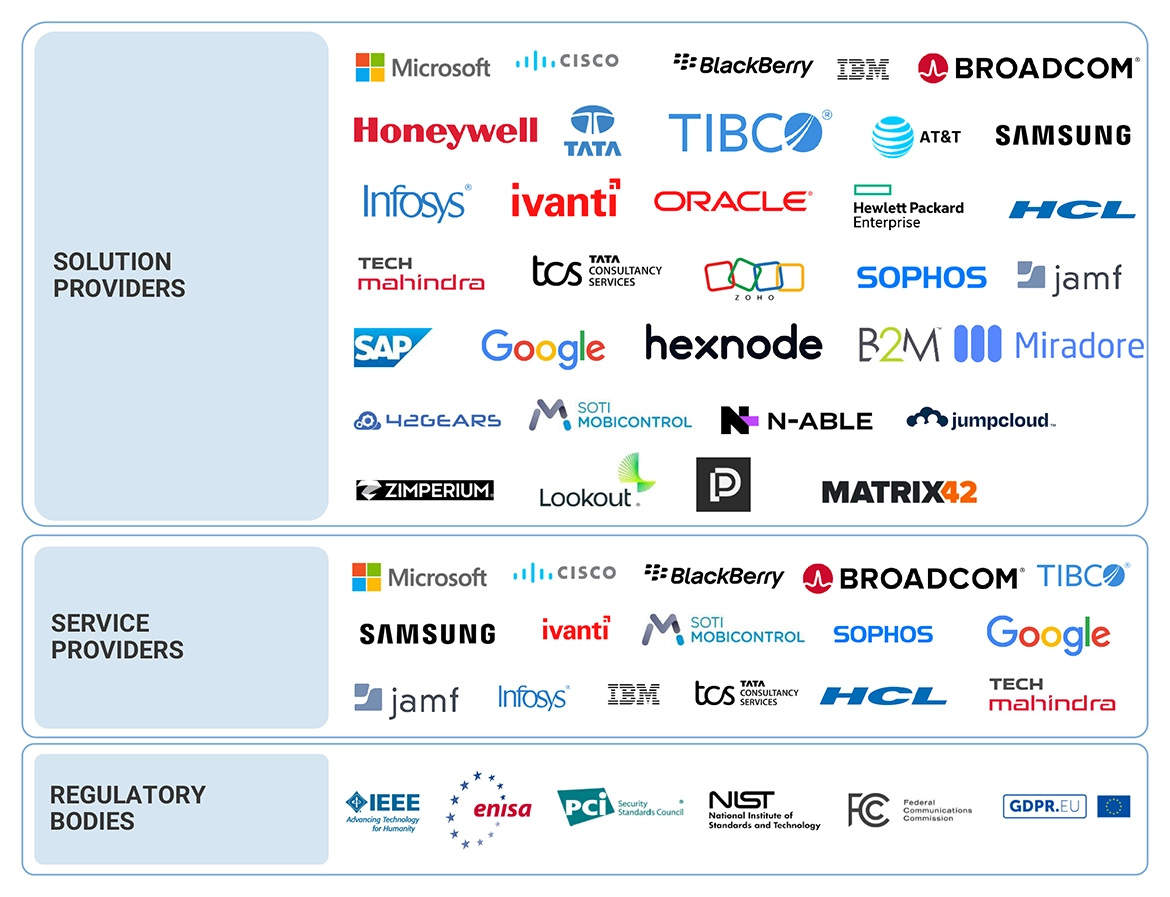
Key players in the market have been identified through extensive secondary research.
-
In terms of value, the industry’s supply chain and market size have been determined through primary and secondary research processes.
-
All percentage shares, splits, and breakups have been determined using secondary sources and verified through primary sources.
BYOD and Enterprise Mobility Market Size: Bottom-Up Approach

To know about the assumptions considered for the study, Request for Free Sample Report
BYOD and Enterprise Mobility Market Size: Top-Down Approach

Data Triangulation
After arriving at the overall market size, the BYOD and Enterprise Mobility market was divided into several segments and subsegments. A data triangulation procedure was used to complete the overall market engineering process and arrive at the exact statistics for all segments and subsegments, wherever applicable. The data was triangulated by studying various factors and trends from the demand and supply sides. Along with data triangulation and market breakdown, the market size was validated by the top-down and bottom-up approaches.
Market Definition
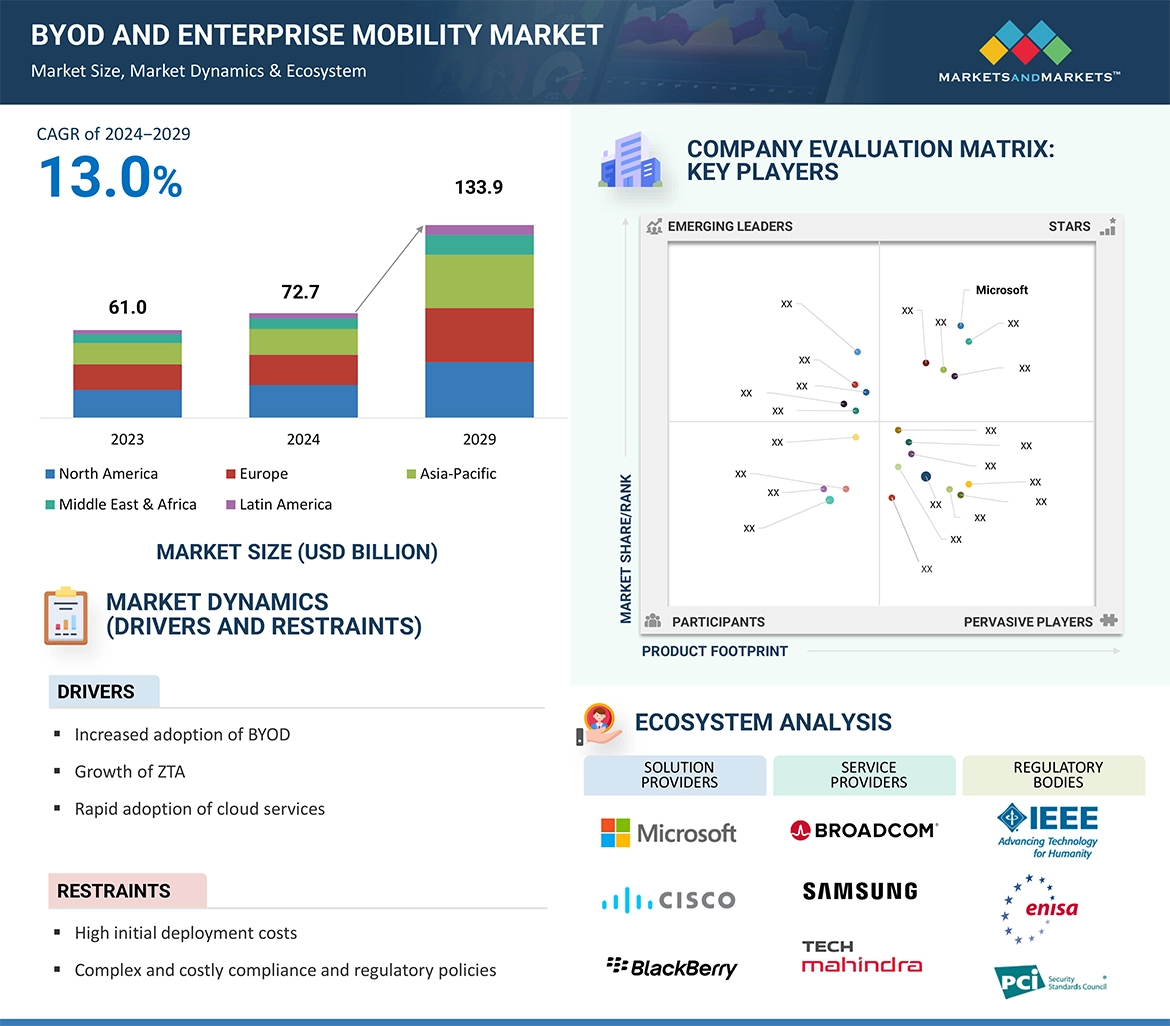
BYOD, or Bring Your Own Device, is a policy allowing employees to use their personal devices, such as smartphones, tablets, and laptops, for work purposes. This approach enables employees to access company resources, applications, and data on their own devices, promoting flexibility and potentially improving productivity
Enterprise mobility refers to the trend of businesses adopting mobile solutions and strategies to enable employees to work from various locations using mobile devices. This concept encompasses the use of smartphones, tablets, and laptops, as well as the integration of mobile applications and services into business processes. Enterprise mobility aims to enhance workforce productivity, improve communication, and streamline operations by providing employees with access to company resources and data from anywhere. It also involves addressing security, management, and support challenges to ensure a secure and efficient mobile work environment.
Key Stakeholders
-
Network Server Providers
-
Technology Vendors
-
Mobile Network Operators (MNOs)
-
Independent Software Vendors (ISVs)
-
System Integrators (SIs)
-
Resellers
-
Value-added Resellers (VARs)
-
Managed Service Providers (MSPs)
-
Compliance Regulatory Authorities
-
Government Authorities
-
Investment Firms
-
BYOD and Enterprise Mobility Alliances/Groups
-
Cloud Service Providers
-
IT Professionals
-
Enterprises/Businesses
Report Objectives
-
To determine and forecast the global BYOD and Enterprise Mobility market by offerings (solutions, services), verticals, and region from 2024 to 2029, and analyze the various macroeconomic and microeconomic factors affecting market growth.
-
To forecast the size of the market segments with respect to five main regions: North America, Europe, Asia Pacific, Latin America, and Middle East & Africa.
-
To provide detailed information about the major factors (drivers, restraints, opportunities, and challenges) influencing the growth of the BYOD and Enterprise Mobility market.
-
To analyze each submarket with respect to individual growth trends, prospects, and contributions to the overall BYOD and Enterprise Mobility market.
-
To analyze the opportunities in the market for stakeholders by identifying the high-growth segments of the BYOD and Enterprise Mobility market.
-
To profile the key players; provide a comparative analysis based on business overviews, regional presence, product offerings, business strategies, and key financials; and illustrate the market's competitive landscape.
-
Track and analyze competitive developments in the market, such as mergers and acquisitions, product developments, partnerships and collaborations, and research and development (R&D) activities.
Available Customizations
With the given market data, MarketsandMarkets offers customizations as per the company’s specific needs. The following customization options are available for the report:
Country-wise Information
-
Analysis for additional countries (up to five)
Company Information
-
Detailed analysis and profiling of additional market players (up to 5)


Growth opportunities and latent adjacency in BYOD and Enterprise Mobility Market