Dental Equipment Market: Growth, Size, Share, and Trends

Dental Equipment Market by Product (Therapeutic (Dental chairs, Dental Units, CAD/CAM, Casting Machines, Dental Lasers, Nd:YAG lasers, Carbon dioxide Lasers), Diagnostic (Dental Imaging, CBCT)), End User (Hospitals & Clinics) & Region - Global Forecast to 2029

Report Code: MD 2666 Jul, 2024, by marketsandmarkets.com

Market Growth Outlook Summary

The global dental equipment market growth forecasted to transform from USD 6.9 billion in 2024 to USD 9.3 billion by 2029, driven by a CAGR of 6.2%. The rising incidences of dental conditions such as cavities, periodontal diseases, and oral cancer are significantly propelling the growth of the dental equipment market. Cavities, the most common chronic disease in children and adults, necessitate regular dental visits for fillings, crowns, and root canals, driving demand for a wide range of dental tools and materials. Periodontal diseases, affecting nearly half of adults over 30, require ongoing treatment and maintenance, including scaling, root planing, and periodontal surgery, all of which rely on specialized dental equipment. Oral cancer, with increasing prevalence globally, demands comprehensive diagnostic and therapeutic equipment for early detection, biopsies, and surgical interventions. The surge in these dental conditions underscores the importance of preventive and restorative dental care, leading to a higher frequency of dental procedures. This trend is further exacerbated by lifestyle factors such as poor diet, tobacco use, and inadequate oral hygiene, which contribute to the incidence of dental diseases. Consequently, dental practices and clinics are investing in advanced diagnostic tools, treatment technologies, and surgical instruments to effectively manage these conditions. The growing burden of dental diseases is thus a major driver for the dental equipment market, as healthcare providers strive to meet the rising demand for dental care and improve patient outcomes. High costs associated with research and development (R&D) for advanced dental technologies could impede market growth.

Dental Equipment Market Trends

Dental Equipment Market

To know about the assumptions considered for the study, Request for Free Sample Report

Dental Equipment Market

Dental Equipment Market Dynamics

DRIVER: Development of technologically advanced solutions

The dental industry has undergone significant evolution through the development of advanced dental materials and technologies. Concurrently, patient compliance has risen alongside a growing preference for minimally invasive procedures. Dental lasers, for instance, are increasingly utilized in surgical treatments such as gum lifting and teeth whitening to minimize blood loss and enhance patient comfort. Adhesive dentistry has also gained prominence, employing composite materials that improve both aesthetic appeal and tooth strength with minimal damage to tooth structures, thereby attracting a rising number of patients seeking such procedures.

In cosmetic dentistry, the integration of advanced technologies like intraoral cameras for capturing smile images has emerged as a pivotal trend. These images assist patients in making informed decisions about cosmetic treatments aimed at enhancing their smiles. Additionally, there is a growing emphasis on utilizing 3D imaging scanners to monitor jaw movements, exemplified by Elanmasa, US, Inc.'s Elaprossa 4D Jaw Motion system, which integrates Cone Beam Computed Tomography (CBCT) for tracking, visualizing, and analyzing jaw movements.

Furthermore, advancements in dental materials and procedures have facilitated the replication of natural tooth properties, with cosmetic tooth whitening emerging as a preferred in-office procedure. The focus on developing new technologies and dental materials is anticipated to unlock fresh opportunities for stakeholders in the dental equipment market. Moreover, digital innovations in dental diagnostics and treatments, such as digital radiology and CAD/CAM systems, have revolutionized workflows by providing precise, high-quality images that streamline diagnosis, treatment planning, and communication between practitioners and dental laboratories. This digitalization trend is poised to drive further growth in the dental equipment market, supported by enhanced efficiency, reduced costs, and improved patient outcomes.

RESTRAINT: High cost of dental imaging systems and lack of reimbursement for dental procedures

In recent years, dental care costs have outpaced overall medical care expenses. Dental implants are increasingly favored over veneers or crowns due to their superior longevity and functionality. However, the cost associated with dental implant treatments remains significantly high, primarily due to expensive equipment and surgical procedures. While a single implant can be priced as low as USD 418 in some regions, the cost escalates to between USD 3,000 and USD 5,000 in the United States, far exceeding prices found in dental tourism destinations. For instance, the same implant brand can be obtained from qualified dentists in Mexico for less than USD 800.

In developed regions like North America and Europe, most insurance providers categorize dental implants as cosmetic procedures, offering minimal or no reimbursement. As a result, patients are largely responsible for covering the majority of the treatment costs, influencing their decision to proceed based on financial feasibility. This lack of substantial insurance support acts as a significant barrier to the widespread adoption of dental implants in these countries.

Similar challenges are observed in developing markets across Asia Pacific and Latin America. Countries such as Japan, China, India, South Korea, and Mexico often lack robust dental reimbursement frameworks, exacerbating the financial burden on patients. Moreover, many solo practitioners in these regions face challenges in affording expensive implants and prosthetics, further limiting access to advanced dental treatments.

Despite the benefits of digital dental imaging systems like digital X-rays and dental Cone Beam Computed Tomography (CBCT), which enable precise diagnosis and treatment planning with high-quality images, their adoption is hindered by their substantial costs alongside expensive treatment fees.

OPPORTUNITY: Growing focus on emerging markets

Rapidly advancing countries in Asia and Latin America, such as India, China, and Brazil, exhibit strong demand for restorative dental products and equipment. This demand is driven by rising incidences of dental diseases, ongoing development of oral healthcare infrastructure, increased willingness to invest in dental restoration due to growing disposable incomes, and heightened awareness of oral hygiene. These factors are expected to stimulate the market for dental prosthetics, restoration materials, and equipment in these regions.

The adoption rate of dental implants remains notably low in many developing countries and certain developed nations like the UK and Germany. Countries such as China and India face challenges such as high procedural costs for dental implants and a shortage of qualified dental professionals. According to a report by the Institut Straumann, only 15-20% of the 1.2 million active dentists worldwide perform implant procedures, with South Korea and Italy leading in implant penetration rates. The untapped market potential in these regions presents significant opportunities for industry players operating in this sector.

Furthermore, favorable government policies and initiatives are attracting multiple stakeholders to these markets. For example, India's reduction of customs duties on dental products from 16% to 8% has opened doors for international players. Similarly, in China, government deregulation and relaxed norms for establishing private healthcare facilities have spurred growth in privately owned dental clinics. These initiatives are expected to drive adoption of advanced technologies like CAD/CAM systems and high-quality restoration products and materials. Training workshops for dental practitioners and laboratory professionals will further enhance the efficient utilization of these advanced tools and products, offering substantial growth prospects in these countries.

The increasing income levels in developing nations such as India, China, and Brazil, coupled with relatively high rates of decayed, missing, and filled teeth (DMFT) indices, are anticipated to further boost the demand for restorative dental products. According to a study by the International Monetary Fund, China has notably seen significant growth in per capita national income, underlining the expanding market potential for dental healthcare products and services.

CHALLENGE: Dearth of trained dental practitioners

Globally, the demand for dental care services is projected to increase due to shifting demographics, heightened awareness of dental health, sedentary lifestyles, and a rising prevalence of dental diseases. However, many countries face a significant challenge due to shortages of dental professionals. According to the Health Resources and Services Administration (HRSA), there were 198,517 active dentists in the US in 2017, a number expected to grow to 202,600 by 2025. Despite this growth, based on 2012 data on dental workforce trends, the anticipated increase in demand for dental services is expected to outpace the supply of dentists, leading to a projected national shortage of dental professionals in the US. For example, the HRSA predicts a deficit of over 4,000 general dentists by 2030.

Similarly, regions like Africa, Asia, and Latin America also experience shortages of oral health personnel. In Africa, for instance, the dentist-to-population ratio is approximately 1:150,000, a stark contrast to developed countries where this ratio is around 1:2,000. This scarcity of dentists in these regions presents a significant challenge that is expected to hinder the widespread adoption of dental equipment and technologies, despite a large target patient population needing dental care.

Dental Equipment Market Ecosystem

Leading players in this market include well-established and financially stable service providers of dental equipments. These companies have been operating in the market for several years and possess a diversified product portfolio, advanced technologies, and strong global presence. Prominent companies in this market include DENTSPLY SIRONA Inc. (US), Planmeca Group (Finland), Envista Holdings Corporation (US), Align Technology Inc. (US), A-dec Inc (US).

Dental Equipment Market Ecosystem

Therapeutic dental equipment segment holds largest share in the dental equipment industry in 2023

The therapeutic dental equipment segment secured the largest share of the global dental equipment market in 2023, propelled significantly by increasing demand for cosmetic dental procedures. Procedures like teeth whitening, orthodontics, and dental implants have surged in popularity due to rising consumer awareness and the growing emphasis on dental aesthetics. This trend is driven by societal factors such as the influence of social media, where enhanced smiles are highly valued. Consequently, dental practices worldwide are investing in advanced therapeutic equipment, including laser systems, CAD/CAM technology, and specialized instruments, to meet the demand for these cosmetic procedures effectively and efficiently. These technologies not only enhance treatment precision and efficacy but also improve patient comfort and recovery times, making them increasingly appealing to both patients and practitioners. Moreover, as more people prioritize oral health and seek comprehensive dental solutions, the therapeutic segment continues to expand, supported by innovations that cater to a diverse range of dental needs, from essential treatments to advanced cosmetic enhancements. Thus, the convergence of aesthetic preferences and technological advancements is driving sustained growth in the therapeutic dental equipment market globally.

Dental hospitals and clinics is expected to grow at the highest CAGR during the forecast period of the global dental equipment industry

The dental hospitals and clinics segment is anticipated to achieve the highest compound annual growth rate (CAGR) in the global dental equipment market during the forecast period, driven significantly by increasing disposable incomes worldwide. As disposable incomes rise across various regions, more individuals are allocating resources toward healthcare, including advanced dental treatments provided by specialized clinics and hospitals. These facilities offer a wide range of services, from routine dental check-ups to complex procedures such as dental implants, orthodontics, and cosmetic dentistry. The ability to afford these services is not only expanding access to comprehensive dental care but also fueling demand for state-of-the-art dental equipment that enhances treatment outcomes and patient satisfaction. This convergence of rising incomes, increasing healthcare expenditures, and technological advancements in dental care collectively supports the projected growth trajectory of the dental hospitals and clinics segment in the global market.

APAC is estimated to be the fastest-growing regional market for dental equipment industry

The expanding middle-class population in the Asia Pacific region is a pivotal driver behind the growing demand for enhanced healthcare services, particularly in dental care, thereby boosting the dental equipment market. As economies in countries like China, India, and Southeast Asian nations experience rapid economic growth, there is a notable rise in disposable incomes and living standards among the middle class. This demographic shift is accompanied by increased awareness of health and well-being, leading to greater spending on preventive and corrective dental treatments.

Middle-class families in these regions prioritize healthcare expenditures, including dental care, as part of their improved quality of life aspirations. This trend fuels the demand for advanced dental equipment, such as digital imaging systems, CAD/CAM technology, and laser dentistry tools, which enable more precise diagnostics and treatments. Moreover, the expansion of healthcare infrastructure to cater to the growing population further supports the accessibility and availability of dental services.

Governments and private healthcare providers are also investing in upgrading dental facilities and training healthcare professionals to meet the rising demand for quality dental care. Overall, the burgeoning middle class in Asia Pacific is driving a fundamental shift towards comprehensive dental care, thereby propelling growth in the dental equipment market across the region.

Geographic Snapshot: Dental Equipment Market

Dental Equipment Market by Region

To know about the assumptions considered for the study, download the pdf brochure

Key players in this market are adopting several organic and inorganic growth strategies (such as product launches, agreements, collaborations, acquisitions, and expansions). Prominent players in this market include DENTSPLY SIRONA Inc. (US), Planmeca Group (Finland), Envista Holdings Corporation (US), Align Technology Inc. (US), A-dec Inc. (US), J. MORITA CORP. (Japan), Ivoclar Vivadent AG (Germany), GC Corporation (Japan), Midmark Corporation (US), Straumann Group (Switzerland), 3M Company (US), BIOLASE, Inc. (US), 3Shape (Denmark), BEGO GmbH & Co. KG (Germany), Ultradent Products, Inc. (US), Yoshida Dental MFG. Co., Ltd. (Japan), Nakanishi Inc. (Japan), DentalEZ, Inc. (US), Carestream Dental LLC (US), Takara Belmont Corporation (Japan), Nova Instruments (UK), NewTom (Italy), Millennium Dental Technologies, Inc. (US), PreXion, Inc. (Japan), Brasseler USA (US), AMD Lasers (US), Aseptico (US), and Bien-Air Dental (US).

Dental Equipment Market Report Scope

Report Metric

Details

Market Revenue in 2024

$6.9 Billion

Projected Revenue by 2029

$9.3 Billion

Revenue Rate

Poised to Grow at a CAGR of 6.2%

Market Driver

Development of technologically advanced solutions

Market Opportunity

Growing focus on emerging markets

This research report categorizes the global dental equipment market to forecast revenue and analyze trends in each of the following submarkets:

By Type

  • Therapeutic Dental Equipment
    • Dental Operatory & Treatment Center Equipment
      • Dental Units
        • Instrument Delivery Systems
        • Dental Chairs
      • Dental handpieces
      • Dental light-curing equipment
      • Electrosurgical systems
      • Other Dental Operatory & Treatment Center Equipment
    • Dental Laboratory Equipment
      • CAD/CAM systems
      • Milling Equipment
      • 3D Printing Equipment
      • Casting machines
      • Ceramic furnaces
      • Other dental laboratory equipment
    • Dental Lasers
      • Soft-tissue lasers
        • Diode Lasers
        • Carbon-dioxide lasers
        • Nd:YAG lasers
      • All-tissue lasers
        • Er:YAG lasers
        • Er,Cr:YSGG lasers
  • Diagnostic Dental Equipment
    • Extraoral Imaging Systems
      • Panoramic systems
      • 3D CBCT systems
      • Panoramic & cephalometric systems
    • Intraoral Imaging Systems
      • Intraoral X-ray systems
      • Intraoral sensors
      • Intraoral photostimulable phospor systems
      • Intraoral cameras
    • Dental Imaging Software

By End User

  • Hospitals and Clinics
  • Research and Academic Institutes
  • Other End Users

By Region

  • North America
    • US
    • Canada
  • Europe
    • Germany
    • France
    • UK
    • Italy
    • Spain
    • Rest of Europe
  • Asia Pacific
    • China
    • Japan
    • India
    • Australia
    • South Korea
    • Rest of APAC
  • Latin America
    • Brazil
    • Mexico
    • Argentina
    • Rest of LATAM
  • Middle East Africa
  • GCC Countries

Recent Developments of Dental Equipment Market

  • In May 2024, Dentsply Sirona Inc. (US) has partnered with Google LLC (US), to launch medical-grade 3D printing solution integrated with end-to-end workflow offerings for dental practices and labs.
  • In January 2024, Planmeca Group (Finland) launched Planmeca Viso G3 (3D Imaging Equipment). It is a multifunctional CBCT device, covers all extraoral imaging needs from 2D to 3D imaging.
  • In January 2024, Align Technology, Inc. (US) acquired Cubicure GmbH (Austria). The acquisition of Cubicure will extend and scale Align’s printing, materials, and manufacturing capabilities for 3D printed product portfolio.
  • In February 2022, Envista Holdings Corporation (US) partnered with Vitaldent Group (Spain). This extended agreement positions Envista as the preferred supplier of implants (Nobel Biocare) and clear aligners (Spark).

Frequently Asked Questions (FAQ):

To speak to our analyst for a discussion on the above findings, click Speak to Analyst

TABLE OF CONTENTS
 
1 INTRODUCTION 
2 RESEARCH METHODOLOGY
3 EXECUTIVE SUMMARY
 
4 PREMIUM INSIGHTS (Page No. - 54)
    4.1 DENTAL EQUIPMENT MARKET OVERVIEW 
    4.2 ASIA PACIFIC: DENTAL EQUIPMENT MARKET, BY END USER AND COUNTRY (2023) 
    4.3 DENTAL EQUIPMENT MARKET: GEOGRAPHIC GROWTH OPPORTUNITIES 
    4.4 REGIONAL MIX: DENTAL EQUIPMENT MARKET (2024−2029) 
    4.5 DENTAL EQUIPMENT MARKET: DEVELOPED VS. EMERGING ECONOMIES 
 
5 MARKET OVERVIEW (Page No. - 58)
    5.1 INTRODUCTION 
    5.2 MARKET DYNAMICS 
           5.2.1 DRIVERS
                    5.2.1.1 Development of technologically advanced solutions
                    5.2.1.2 Rising prevalence of oral health disorders
                    5.2.1.3 Rising demand for advanced cosmetic dental procedures
                    5.2.1.4 Growing market for dental tourism in emerging countries
           5.2.2 RESTRAINTS
                    5.2.2.1 High cost of dental imaging systems and lack of reimbursement for dental procedures
           5.2.3 OPPORTUNITIES
                    5.2.3.1 Impact of DSOs on dental industry
                    5.2.3.2 Increasing number of dental laboratories investing in  CAD/CAM technologies
                    5.2.3.3 Growing focus on emerging markets
           5.2.4 CHALLENGES
                    5.2.4.1 Dearth of trained dental practitioners
    5.3 INDUSTRY TRENDS 
           5.3.1 RISING NUMBER OF MINIMALLY INVASIVE DENTAL PROCEDURES
           5.3.2 MARKET CONSOLIDATION
           5.3.3 FOCUS ON PRODUCT DEVELOPMENT
           5.3.4 GROWING TREND OF DENTAL INSURANCE IN US
    5.4 TECHNOLOGY ANALYSIS 
           5.4.1 KEY TECHNOLOGIES
                    5.4.1.1 3D printers
                    5.4.1.2 Artificial intelligence
           5.4.2 ADJACENT TECHNOLOGIES
                    5.4.2.1 Virtual reality
                    5.4.2.2 Laser dentistry
    5.5 VALUE CHAIN ANALYSIS 
    5.6 ECOSYSTEM ANALYSIS 
    5.7 SUPPLY CHAIN ANALYSIS 
    5.8 REGULATORY LANDSCAPE 
           5.8.1 US
           5.8.2 EUROPEAN UNION
           5.8.3 CHINA
           5.8.4 REGULATORY BODIES, GOVERNMENT AGENCIES,  AND OTHER ORGANIZATIONS
    5.9 PATENT ANALYSIS 
           5.9.1 PATENT PUBLICATION TRENDS FOR DENTAL EQUIPMENT
           5.9.2 INSIGHTS: JURISDICTION AND TOP APPLICANT ANALYSIS
    5.10 TRADE ANALYSIS 
    5.11 TRENDS/DISRUPTIONS IMPACTING CUSTOMERS’ BUSINESSES 
    5.12 ADJACENT MARKETS FOR DENTAL EQUIPMENT 
    5.13 CASE STUDY ANALYSIS 
    5.14 PORTER’S FIVE FORCES ANALYSIS 
           5.14.1 THREAT OF NEW ENTRANTS
           5.14.2 THREAT OF SUBSTITUTES
           5.14.3 BARGAINING POWER OF SUPPLIERS
           5.14.4 BARGAINING POWER OF BUYERS
           5.14.5 INTENSITY OF COMPETITIVE RIVALRY
    5.15 KEY CONFERENCES & EVENTS, 2024–2025 
    5.16 PRICING ANALYSIS 
           5.16.1 AVERAGE SELLING PRICE OF DENTAL EQUIPMENT, BY PRODUCT TYPE
           5.16.2 AVERAGE SELLING PRICE TREND
    5.17 KEY STAKEHOLDERS & BUYING CRITERIA 
           5.17.1 KEY STAKEHOLDERS IN BUYING PROCESS
           5.17.2 BUYING CRITERIA
    5.18 UNMET NEEDS/END-USER EXPECTATIONS 
    5.19 ARTIFICIAL INTELLIGENCE (AI) IN DENTAL EQUIPMENT MARKET 
    5.2 INVESTMENT & FUNDING SCENARIO 
 
6 DENTAL EQUIPMENT MARKET, BY TYPE (Page No. - 95)
    6.1 INTRODUCTION 
    6.2 THERAPEUTIC DENTAL EQUIPMENT 
           6.2.1 DENTAL OPERATORY & TREATMENT CENTER EQUIPMENT
                    6.2.1.1 Dental units
                               6.2.1.1.1 Instrument delivery systems
                                             6.2.1.1.1.1 Rising need for easy handling of instruments to  boost adoption
                               6.2.1.1.2 Dental chairs
                                             6.2.1.1.2.1 Advancements in dental practices to support  market growth
                    6.2.1.2 Dental handpieces
                               6.2.1.2.1 Rising demand for high-tech dental handpieces to favor market growth
                    6.2.1.3 Dental light-curing equipment
                               6.2.1.3.1 Growing demand for in-office teeth whitening procedures to boost market
                    6.2.1.4 Electrosurgical systems
                               6.2.1.4.1 Rising need for minimally invasive procedures to propel demand for electrosurgical systems
                    6.2.1.5 Other dental operatory & treatment center equipment
           6.2.2 DENTAL LABORATORY EQUIPMENT
                    6.2.2.1 CAD/CAM systems
                               6.2.2.1.1 Increasing adoption of single-tooth implants, veneers, and crowns to drive market growth
                    6.2.2.2 Milling equipment
                               6.2.2.2.1 Increasing use of milling machines in creating and modifying dental prostheses to boost growth
                    6.2.2.3 3D printing equipment
                               6.2.2.3.1 Rising adoption of 3D printers in dental industry to  support growth
                    6.2.2.4 Casting machines
                               6.2.2.4.1 Rising adoption of casting machines for custom dental restorations to fuel market growth
                    6.2.2.5 Ceramic furnaces
                               6.2.2.5.1 Ability of ceramic furnaces to use high pressures and temperatures to process ceramic materials to fuel growth
                    6.2.2.6 Other dental laboratory equipment
           6.2.3 DENTAL LASERS
                    6.2.3.1 Soft-tissue lasers
                               6.2.3.1.1 Diode lasers
                                             6.2.3.1.1.1 Low costs associated with diode lasers to boost demand
                               6.2.3.1.2 Carbon-dioxide lasers
                                             6.2.3.1.2.1 Increasing adoption of carbon-dioxide lasers among dentists to support market growth
                               6.2.3.1.3 Nd:YAG lasers
                                             6.2.3.1.3.1 Rising number of soft-tissue surgeries to propel demand
                    6.2.3.2 All-tissue lasers
                               6.2.3.2.1 Er:YAG lasers
                                             6.2.3.2.1.1 Growing demand for painless dental treatment to aid market growth
                               6.2.3.2.2 Er,Cr:YSGG lasers
                                             6.2.3.2.2.1 High demand for alternatives to high-speed dental drills to propel growth
    6.3 DIAGNOSTIC DENTAL EQUIPMENT 
           6.3.1 EXTRAORAL IMAGING SYSTEMS
                    6.3.1.1 Panoramic systems
                               6.3.1.1.1 Rise in dental disorders to boost demand
                    6.3.1.2 3D CBCT systems
                               6.3.1.2.1 Growth in dental implants and increase in number of vendors offering CBCT units to drive growth
                    6.3.1.3 Panoramic & cephalometric systems
                               6.3.1.3.1 Rising need for single digital platform for dental treatments to aid growth
           6.3.2 INTRAORAL IMAGING SYSTEMS
                    6.3.2.1 Intraoral X-ray systems
                               6.3.2.1.1 Growing demand for efficient and faster intraoral diagnostics to propel growth
                    6.3.2.2 Intraoral sensors
                               6.3.2.2.1 Increasing need for reduced operating time to  boost demand
                    6.3.2.3 Intraoral photostimulable phosphor systems
                               6.3.2.3.1 Rising preference for economical options for intraoral imaging to fuel growth
                    6.3.2.4 Intraoral cameras
                               6.3.2.4.1 Early detection and accurate representation of dental conditions to fuel demand for intraoral cameras
           6.3.3 DENTAL IMAGING SOFTWARE
                    6.3.3.1 Sophisticated workflow offered by dental imaging software to favor market growth
 
7 DENTAL EQUIPMENT MARKET, BY END USER (Page No. - 149)
    7.1 INTRODUCTION 
    7.2 HOSPITALS & CLINICS 
           7.2.1 INCREASING NUMBER OF DENTAL HOSPITALS & CLINICS IN EMERGING MARKETS TO DRIVE GROWTH
    7.3 ACADEMIC & RESEARCH INSTITUTES 
           7.3.1 INCREASING NUMBER OF INDUSTRY-ACADEMIC AGREEMENTS AND RISING FUNDING FOR DENTAL RESEARCH TO PROPEL GROWTH
    7.4 OTHER END USERS 
 
8 DENTAL EQUIPMENT MARKET, BY REGION (Page No. - 157)
    8.1 INTRODUCTION 
    8.2 EUROPE 
           8.2.1 GERMANY
                    8.2.1.1 Favorable government policies to drive demand for dental equipment
           8.2.2 FRANCE
                    8.2.2.1 Favorable government healthcare strategies to fuel  market growth in France
           8.2.3 UK
                    8.2.3.1 Increasing incidence of dental disorders to drive demand for  dental equipment
           8.2.4 ITALY
                    8.2.4.1 Low-cost treatments and growing penetration of dental products to drive market for dental equipment
           8.2.5 SPAIN
                    8.2.5.1 Increasing demand for cosmetic dentistry and growing medical tourism to boost market growth
           8.2.6 REST OF EUROPE
    8.3 NORTH AMERICA 
           8.3.1 US
                    8.3.1.1 US to dominate North American dental equipment market  during forecast period
           8.3.2 CANADA
                    8.3.2.1 Rising incidence of dental caries to further fuel market growth
    8.4 ASIA PACIFIC 
           8.4.1 CHINA
                    8.4.1.1 Growing prevalence of dental diseases to drive market growth
           8.4.2 JAPAN
                    8.4.2.1 Rising geriatric population and favorable reimbursement scenario to support market growth in Japan
           8.4.3 INDIA
                    8.4.3.1 Growth in dental care sector and rising foreign investment in India to drive dental equipment market
           8.4.4 AUSTRALIA
                    8.4.4.1 Favorable government initiatives and growing dental diseases to support market growth
           8.4.5 SOUTH KOREA
                    8.4.5.1 Significant growth opportunities to boost market
           8.4.6 REST OF ASIA PACIFIC
    8.5 LATIN AMERICA 
           8.5.1 MEXICO
                    8.5.1.1 Improving healthcare infrastructure and availability of skilled dentists to support market growth
           8.5.2 BRAZIL
                    8.5.2.1 Growing trend in cosmetic dentistry to drive dental equipment market
           8.5.3 ARGENTINA
                    8.5.3.1 Increasing dental disorders to drive dental equipment market
           8.5.4 REST OF LATIN AMERICA
    8.6 MIDDLE EAST &AND AFRICA 
           8.6.1 GROWING AWARENESS ABOUT DENTAL HYGIENE TO DRIVE MARKET GROWTH
    8.7 GCC COUNTRIES 
           8.7.1 GROWING DEMAND FOR PERSONALIZED DENTISTRY TO DRIVE MARKET
 
9 COMPETITIVE LANDSCAPE (Page No. - 279)
    9.1 OVERVIEW 
    9.2 KEY PLAYER STRATEGIES/RIGHT TO WIN 
           9.2.1 OVERVIEW OF STRATEGIES ADOPTED BY PLAYERS IN  DENTAL EQUIPMENT MARKET
    9.3 REVENUE ANALYSIS 
    9.4 MARKET SHARE ANALYSIS 
    9.5 COMPANY EVALUATION MATRIX: KEY PLAYERS, 2023 
           9.5.1 STARS
           9.5.2 EMERGING LEADERS
           9.5.3 PERVASIVE PLAYERS
           9.5.4 PARTICIPANTS
           9.5.5 COMPANY FOOTPRINT: KEY PLAYERS, 2023
    9.6 COMPANY EVALUATION MATRIX: START-UPS/SMES, 2023 
           9.6.1 PROGRESSIVE COMPANIES
           9.6.2 RESPONSIVE COMPANIES
           9.6.3 DYNAMIC COMPANIES
           9.6.4 STARTING BLOCKS
           9.6.5 COMPETITIVE BENCHMARKING: START-UPS/SMES, 2023
    9.7 COMPETITIVE SCENARIO 
           9.7.1 PRODUCT LAUNCHES
           9.7.2 DEALS
           9.7.3 EXPANSIONS
    9.8 COMPANY VALUATION & FINANCIAL METRICS 
    9.9 BRAND/PRODUCT COMPARISON 
    9.10 DENTAL EQUIPMENT MARKET: R&D EXPENDITURE 
 
10 COMPANY PROFILES (Page No. - 299)
     10.1 KEY PLAYERS 
             10.1.1 DENTSPLY SIRONA INC.
                        10.1.1.1 Business overview
                        10.1.1.2 Products offered
                        10.1.1.3 Recent developments
                                     10.1.1.3.1 Product launches
                                     10.1.1.3.2 Deals
                        10.1.1.4 MnM view
                                     10.1.1.4.1 Right to win
                                     10.1.1.4.2 Strategic choices
                                     10.1.1.4.3 Weaknesses & competitive threats
             10.1.2 PLANMECA GROUP
                        10.1.2.1 Business overview
                        10.1.2.2 Products offered
                        10.1.2.3 Recent developments
                                     10.1.2.3.1 Product launches
                                     10.1.2.3.2 Deals
                        10.1.2.4 MnM view
                                     10.1.2.4.1 Right to win
                                     10.1.2.4.2 Strategic choices
                                     10.1.2.4.3 Weaknesses & competitive threats
             10.1.3 ALIGN TECHNOLOGY INC.
                        10.1.3.1 Business overview
                        10.1.3.2 Products offered
                        10.1.3.3 Recent developments
                                     10.1.3.3.1 Product launches
                                     10.1.3.3.2 Deals
                                     10.1.3.3.3 Expansions
                        10.1.3.4 MnM view
                                     10.1.3.4.1 Right to win
                                     10.1.3.4.2 Strategic choices
                                     10.1.3.4.3 Weaknesses & competitive threats
             10.1.4 ENVISTA HOLDINGS CORPORATION
                        10.1.4.1 Business overview
                        10.1.4.2 Products offered
                        10.1.4.3 Recent developments
                                     10.1.4.3.1 Deals
                                     10.1.4.3.2 Other developments
                        10.1.4.4 MnM view
                                     10.1.4.4.1 Right to win
                                     10.1.4.4.2 Strategic choices
                                     10.1.4.4.3 Weaknesses & competitive threats
             10.1.5 CARESTREAM DENTAL LLC
                        10.1.5.1 Business overview
                        10.1.5.2 Products offered
                        10.1.5.3 Recent developments
                                     10.1.5.3.1 Deals
                        10.1.5.4 MnM view
                                     10.1.5.4.1 Right to win
                                     10.1.5.4.2 Strategic choices
                                     10.1.5.4.3 Weaknesses & competitive threats
             10.1.6 NAKANISHI INC.
                        10.1.6.1 Business overview
                        10.1.6.2 Products offered
             10.1.7 A-DEC
                        10.1.7.1 Business overview
                        10.1.7.2 Products offered
                        10.1.7.3 Recent developments
                                     10.1.7.3.1 Product launches
                                     10.1.7.3.2 Deals
             10.1.8 J. MORITA CORP
                        10.1.8.1 Business overview
                        10.1.8.2 Products offered
                        10.1.8.3 Recent developments
                                     10.1.8.3.1 Product launches
                                     10.1.8.3.2 Deals
                        10.1.8.4 MnM view
                                     10.1.8.4.1 Right to win
                                     10.1.8.4.2 Strategic choices
                                     10.1.8.4.3 Weaknesses & competitive threats
             10.1.9 IVOCLAR VIVADENT
                        10.1.9.1 Business overview
                        10.1.9.2 Products offered
             10.1.10 GC CORPORATION
                        10.1.10.1 Business overview
                        10.1.10.2 Products offered
                        10.1.10.3 Recent developments
                                     10.1.10.3.1 Deals
             10.1.11 MIDMARK CORPORATION
                        10.1.11.1 Business overview
                        10.1.11.2 Products offered
                        10.1.11.3 Recent developments
                                     10.1.11.3.1 Deals
                                     10.1.11.3.2 Expansions
             10.1.12 3SHAPE
                        10.1.12.1 Business overview
                        10.1.12.2 Products offered
                        10.1.12.3 Recent developments
                                     10.1.12.3.1 Product launches
                                     10.1.12.3.2 Deals
     10.2 OTHER PLAYERS 
             10.2.1 INSTITUT STRAUMANN AG
                        10.2.1.1 Business overview
                        10.2.1.2 Products offered
                        10.2.1.3 Recent developments
                                     10.2.1.3.1 Deals
             10.2.2 ULTRADENT PRODUCTS, INC.
                        10.2.2.1 Business overview
                        10.2.2.2 Products offered
             10.2.3 BIOLASE, INC.
                        10.2.3.1 Business overview
                        10.2.3.2 Products offered
                        10.2.3.3 Recent developments
                                     10.2.3.3.1 Product launches
             10.2.4 3M COMPANY
                        10.2.4.1 Business overview
                        10.2.4.2 Products offered
             10.2.5 BEGO GMBH & CO.KG
                        10.2.5.1 Business overview
                        10.2.5.2 Products offered
             10.2.6 YOSHIDA DENTAL MFG.CO. LTD.
                        10.2.6.1 Business overview
                        10.2.6.2 Products offered
             10.2.7 DENTALEZ INC.
                        10.2.7.1 Business overview
                        10.2.7.2 Products offered
                        10.2.7.3 Recent developments
                                     10.2.7.3.1 Product launches
             10.2.8 TAKARA BELMONT CORPORATION
                        10.2.8.1 Business overview
                        10.2.8.2 Products offered
             10.2.9 NOVA INSTRUMENTS
             10.2.10 NEWTOM
             10.2.11 MILLENNIUM DENTAL TECHNOLOGIES INC.
             10.2.12 PREXION INC.
             10.2.13 BRASSELER USA
             10.2.14 AMD LASERS
             10.2.15 ASEPTICO
             10.2.16 BIEN-AIR DENTAL
 
11 APPENDIX (Page No. - 356)
     11.1 DISCUSSION GUIDE 
     11.2 KNOWLEDGESTORE: MARKETSANDMARKETS’ SUBSCRIPTION PORTAL 
     11.3 CUSTOMIZATION OPTIONS 
     11.4 RELATED REPORTS 
     11.5 AUTHOR DETAILS 
 
 
LIST OF TABLES (468 TABLES)
 
TABLE 1 CURRENCY CONVERSION RATE, 2019–2023 (UNIT OF USD)
TABLE 2 RISK ASSESSMENT: DENTAL EQUIPMENT MARKET
TABLE 3 TECHNOLOGICAL ADVANCEMENTS IN DENTISTRY
TABLE 4 PROJECTED INCREASE IN ABOVE-65 AGE GROUP, BY REGION,  2019 VS. 2050 (MILLION)
TABLE 5 AVERAGE PROCEDURAL COSTS IN TOP TEN DENTAL  TOURISM DESTINATIONS (USD)
TABLE 6 AVERAGE COST OF DENTAL TREATMENT, BY COUNTRY (2022)
TABLE 7 RECENT DEALS BACKED BY PRIVATE EQUITY IN US, 2020–2023
TABLE 8 PER CAPITA NATIONAL INCOME, 2000–2020 (USD)
TABLE 9 MAJOR ACQUISITIONS (2019–2022)
TABLE 10 NORTH AMERICA: REGULATORY BODIES, GOVERNMENT AGENCIES,  AND OTHER ORGANIZATIONS
TABLE 11 EUROPE: REGULATORY BODIES, GOVERNMENT AGENCIES,  AND OTHER ORGANIZATIONS
TABLE 12 ASIA PACIFIC: REGULATORY BODIES, GOVERNMENT AGENCIES,  AND OTHER ORGANIZATIONS
TABLE 13 LATIN AMERICA: REGULATORY BODIES, GOVERNMENT AGENCIES,  AND OTHER ORGANIZATIONS
TABLE 14 MIDDLE EAST & AFRICA: REGULATORY BODIES, GOVERNMENT AGENCIES,  AND OTHER ORGANIZATIONS
TABLE 15 DENTAL EQUIPMENT: LIST OF MAJOR PATENTS
TABLE 16 US DENTAL EQUIPMENT AND SUPPLIES: EXPORT SCENARIO,  2015–2022 (THOUSAND)
TABLE 17 US INSTRUMENTS AND APPLIANCES USED IN MEDICAL, SURGICAL, DENTAL,  OR VETERINARY SCIENCES: EXPORT SCENARIO, 2019–2022 (THOUSAND)
TABLE 18 INNOVATION TRACKING, TECHNOLOGY ASSESSMENT, AND PRODUCT  LAUNCHES RELATED TO ANTIMICROBIAL AGENTS AND COATING SUBSTANCES  FOR DENTAL IMPLANTS
TABLE 19 CUSTOMIZED STUDY FOR MIDDLE EAST & AFRICA DENTAL EQUIPMENT MARKET
TABLE 20 CUSTOMIZED STUDY FOR LATIN AMERICAN DENTAL EQUIPMENT AND CONSUMABLES MARKET
TABLE 21 PORTER’S FIVE FORCES ANALYSIS: DENTAL EQUIPMENT MARKET
TABLE 22 KEY CONFERENCES & EVENTS, 2024–2025
TABLE 23 AVERAGE COST OF DENTAL EQUIPMENT SYSTEMS, 2021–2023
TABLE 24 AVERAGE COST RANGE OF DENTAL EQUIPMENT, BY REGION, 2021–2023 (USD)
TABLE 25 INFLUENCE OF STAKEHOLDERS ON BUYING PROCESS FOR DENTAL EQUIPMENT
TABLE 26 KEY BUYING CRITERIA FOR DENTAL EQUIPMENT
TABLE 27 DENTAL EQUIPMENT MARKET, BY PRODUCT, 2022–2029 (USD MILLION)
TABLE 28 THERAPEUTIC DENTAL EQUIPMENT MARKET, BY TYPE, 2022–2029 (USD MILLION)
TABLE 29 THERAPEUTIC DENTAL EQUIPMENT MARKET, BY COUNTRY,  2022–2029 (USD MILLION)
TABLE 30 DENTAL OPERATORY & TREATMENT CENTER EQUIPMENT MARKET, BY TYPE, 2022–2029 (USD MILLION)
TABLE 31 DENTAL OPERATORY & TREATMENT CENTER EQUIPMENT MARKET, BY COUNTRY, 2022–2029 (USD MILLION)
TABLE 32 DENTAL UNITS MARKET, BY TYPE, 2022–2029 (USD MILLION)
TABLE 33 DENTAL UNITS MARKET, BY COUNTRY, 2022–2029 (USD MILLION)
TABLE 34 INSTRUMENT DELIVERY SYSTEMS MARKET, BY COUNTRY,  2022–2029 (USD MILLION)
TABLE 35 DENTAL CHAIRS MARKET, BY COUNTRY, 2022–2029 (USD MILLION)
TABLE 36 DENTAL HANDPIECES MARKET, BY COUNTRY, 2022–2029 (USD MILLION)
TABLE 37 DENTAL LIGHT-CURING EQUIPMENT MARKET, BY COUNTRY,  2022–2029 (USD MILLION)
TABLE 38 ELECTROSURGICAL SYSTEMS MARKET, BY COUNTRY, 2022–2029 (USD MILLION)
TABLE 39 OTHER DENTAL OPERATORY & TREATMENT CENTER EQUIPMENT MARKET,  BY COUNTRY, 2022–2029 (USD MILLION)
TABLE 40 DENTAL LABORATORY EQUIPMENT MARKET, BY TYPE, 2022–2029 (USD MILLION)
TABLE 41 DENTAL LABORATORY EQUIPMENT MARKET, BY COUNTRY,  2022–2029 (USD MILLION)
TABLE 42 CAD/CAM SYSTEMS MARKET, BY REGION, 2022–2029 (USD THOUSAND)
TABLE 43 CAD/CAM SYSTEMS MARKET, BY COUNTRY, 2022–2029 (USD MILLION)
TABLE 44 MILLING EQUIPMENT MARKET, BY REGION, 2022–2029 (USD THOUSAND)
TABLE 45 MILLING EQUIPMENT MARKET, BY COUNTRY, 2022–2029 (USD MILLION)
TABLE 46 3D PRINTING EQUIPMENT MARKET, BY REGION, 2022–2029 (USD THOUSAND)
TABLE 47 3D PRINTING EQUIPMENT MARKET, BY COUNTRY, 2022–2029 (USD MILLION)
TABLE 48 CASTING MACHINES MARKET, BY REGION, 2022–2029 (USD THOUSAND)
TABLE 49 CASTING MACHINES MARKET, BY COUNTRY, 2022–2029 (USD MILLION)
TABLE 50 CERAMIC FURNACES MARKET, BY REGION, 2022–2029 (USD THOUSAND)
TABLE 51 CERAMIC FURNACES MARKET, BY COUNTRY, 2022–2029 (USD MILLION)
TABLE 52 OTHER DENTAL LABORATORY EQUIPMENT MARKET, BY REGION,  2022–2029 (USD THOUSAND)
TABLE 53 OTHER DENTAL LABORATORY EQUIPMENT MARKET, BY COUNTRY,  2022–2029 (USD MILLION)
TABLE 54 DENTAL LASERS MARKET, BY TYPE, 2022–2029 (USD MILLION)
TABLE 55 DENTAL LASERS MARKET, BY COUNTRY, 2022–2029 (USD MILLION)
TABLE 56 SOFT-TISSUE LASERS MARKET, BY TYPE, 2022–2029 (USD MILLION)
TABLE 57 SOFT-TISSUE LASERS MARKET, BY COUNTRY, 2022–2029 (USD MILLION)
TABLE 58 DIODE LASERS MARKET, BY COUNTRY, 2022–2029 (USD MILLION)
TABLE 59 CARBON-DIOXIDE LASERS MARKET, BY COUNTRY, 2022–2029 (USD MILLION)
TABLE 60 ND:YAG LASERS MARKET, BY COUNTRY, 2022–2029 (USD MILLION)
TABLE 61 ALL-TISSUE LASERS MARKET, BY TYPE, 2022–2029 (USD MILLION)
TABLE 62 ALL-TISSUE LASERS MARKET, BY COUNTRY, 2022–2029 (USD MILLION)
TABLE 63 ER:YAG LASERS MARKET, BY COUNTRY, 2022–2029 (USD MILLION)
TABLE 64 ER,CR:YSGG LASERS MARKET, BY COUNTRY, 2022–2029 (USD MILLION)
TABLE 65 DIAGNOSTIC DENTAL EQUIPMENT MARKET, BY TYPE, 2022–2029 (USD MILLION)
TABLE 66 DIAGNOSTIC DENTAL EQUIPMENT MARKET, BY COUNTRY,  2022–2029 (USD MILLION)
TABLE 67 EXTRAORAL IMAGING SYSTEMS MARKET, BY TYPE, 2022–2029 (USD MILLION)
TABLE 68 EXTRAORAL IMAGING SYSTEMS MARKET, BY COUNTRY,  2022–2029 (USD MILLION)
TABLE 69 KEY PANORAMIC SYSTEMS AVAILABLE IN MARKET
TABLE 70 PANORAMIC SYSTEMS MARKET, BY COUNTRY, 2022–2029 (USD MILLION)
TABLE 71 KEY 3D CBCT SYSTEMS AVAILABLE IN MARKET
TABLE 72 3D CBCT SYSTEMS MARKET, BY COUNTRY, 2022–2029 (USD MILLION)
TABLE 73 KEY PANORAMIC & CEPHALOMETRIC SYSTEMS AVAILABLE IN MARKET
TABLE 74 PANORAMIC & CEPHALOMETRIC SYSTEMS MARKET, BY COUNTRY,  2022–2029 (USD MILLION)
TABLE 75 INTRAORAL IMAGING SYSTEMS MARKET, BY TYPE, 2022–2029 (USD MILLION)
TABLE 76 INTRAORAL IMAGING SYSTEMS MARKET, BY COUNTRY,  2022–2029 (USD MILLION)
TABLE 77 KEY INTRAORAL X-RAY UNITS AVAILABLE IN MARKET
TABLE 78 INTRAORAL X-RAY SYSTEMS MARKET, BY COUNTRY, 2022–2029 (USD MILLION)
TABLE 79 KEY INTRAORAL SENSORS AVAILABLE IN MARKET
TABLE 80 INTRAORAL SENSORS MARKET, BY COUNTRY, 2022–2029 (USD MILLION)
TABLE 81 KEY PSP SYSTEMS AVAILABLE IN MARKET
TABLE 82 INTRAORAL PHOTOSTIMULABLE PHOSPHOR SYSTEMS MARKET, BY COUNTRY, 2022–2029 (USD MILLION)
TABLE 83 KEY INTRAORAL CAMERAS AVAILABLE IN MARKET
TABLE 84 INTRAORAL CAMERAS MARKET, BY COUNTRY, 2022–2029 (USD MILLION)
TABLE 85 DENTAL IMAGING SOFTWARE MARKET, BY COUNTRY, 2022–2029 (USD MILLION)
TABLE 86 DENTAL EQUIPMENT MARKET, BY END USER, 2022–2029 (USD MILLION)
TABLE 87 TOP DESTINATIONS FOR COST-EFFECTIVE DENTAL TREATMENT
TABLE 88 DENTAL EQUIPMENT MARKET FOR HOSPITALS & CLINICS, BY COUNTRY,  2022–2029 (USD MILLION)
TABLE 89 TOP 10 NIDCR GRANTS TO US DENTAL INSTITUTIONS
TABLE 90 DENTAL EQUIPMENT MARKET FOR ACADEMIC & RESEARCH INSTITUTES,  BY COUNTRY, 2022–2029 (USD MILLION)
TABLE 91 DENTAL EQUIPMENT MARKET FOR OTHER END USERS, BY COUNTRY,  2022–2029 (USD MILLION)
TABLE 92 EUROPE: DENTAL EQUIPMENT MARKET, BY COUNTRY, 2022–2029 (USD MILLION)
TABLE 93 EUROPE: DENTAL EQUIPMENT MARKET, BY PRODUCT, 2022–2029 (USD MILLION)
TABLE 94 EUROPE: THERAPEUTIC DENTAL EQUIPMENT MARKET, BY TYPE,  2022–2029 (USD MILLION)
TABLE 95 EUROPE: DENTAL OPERATORY & TREATMENT CENTER EQUIPMENT MARKET,  BY TYPE, 2022–2029 (USD MILLION)
TABLE 96 EUROPE: DENTAL UNITS MARKET, BY TYPE, 2022–2029 (USD MILLION)
TABLE 97 EUROPE: DENTAL LABORATORY EQUIPMENT MARKET, BY TYPE,  2022–2029 (USD MILLION)
TABLE 98 EUROPE: DENTAL LASERS MARKET, BY TYPE, 2022–2029 (USD MILLION)
TABLE 99 EUROPE: SOFT-TISSUE LASERS MARKET, BY TYPE, 2022–2029 (USD MILLION)
TABLE 100 EUROPE: ALL-TISSUE LASERS MARKET, BY TYPE, 2022–2029 (USD MILLION)
TABLE 101 EUROPE: DIAGNOSTIC DENTAL EQUIPMENT MARKET, BY TYPE,  2022–2029 (USD MILLION)
TABLE 102 EUROPE: EXTRAORAL IMAGING SYSTEMS MARKET, BY TYPE,  2022–2029 (USD MILLION)
TABLE 103 EUROPE: INTRAORAL IMAGING SYSTEMS MARKET, BY TYPE,  2022–2029 (USD MILLION)
TABLE 104 EUROPE: DENTAL EQUIPMENT MARKET, BY END USER,  2022–2029 (USD MILLION)
TABLE 105 GERMANY: MACROECONOMIC INDICATORS
TABLE 106 GERMANY: DENTAL EQUIPMENT MARKET, BY PRODUCT,  2022–2029 (USD MILLION)
TABLE 107 GERMANY: THERAPEUTIC DENTAL EQUIPMENT MARKET, BY TYPE,  2022–2029 (USD MILLION)
TABLE 108 GERMANY: DENTAL OPERATORY & TREATMENT CENTER EQUIPMENT MARKET,  BY TYPE, 2022–2029 (USD MILLION)
TABLE 109 GERMANY: DENTAL UNITS MARKET, BY TYPE, 2022–2029 (USD MILLION)
TABLE 110 GERMANY: DENTAL LABORATORY EQUIPMENT MARKET, BY TYPE,  2022–2029 (USD MILLION)
TABLE 111 GERMANY: DENTAL LASERS MARKET, BY TYPE, 2022–2029 (USD MILLION)
TABLE 112 GERMANY: SOFT-TISSUE LASERS MARKET, BY TYPE, 2022–2029 (USD MILLION)
TABLE 113 GERMANY: ALL-TISSUE LASERS MARKET, BY TYPE, 2022–2029 (USD MILLION)
TABLE 114 GERMANY: DIAGNOSTIC DENTAL EQUIPMENT MARKET, BY TYPE,  2022–2029 (USD MILLION)
TABLE 115 GERMANY: EXTRAORAL IMAGING SYSTEMS MARKET, BY TYPE,  2022–2029 (USD MILLION)
TABLE 116 GERMANY: INTRAORAL IMAGING SYSTEMS MARKET, BY TYPE,  2022–2029 (USD MILLION)
TABLE 117 GERMANY: DENTAL EQUIPMENT MARKET, BY END USER,  2022–2029 (USD MILLION)
TABLE 118 FRANCE: MACROECONOMIC INDICATORS
TABLE 119 FRANCE: DENTAL EQUIPMENT MARKET, BY PRODUCT, 2022–2029 (USD MILLION)
TABLE 120 FRANCE: THERAPEUTIC DENTAL EQUIPMENT MARKET, BY TYPE,  2022–2029 (USD MILLION)
TABLE 121 FRANCE: DENTAL OPERATORY & TREATMENT CENTER EQUIPMENT MARKET,  BY TYPE, 2022–2029 (USD MILLION)
TABLE 122 FRANCE: DENTAL UNITS MARKET, BY TYPE, 2022–2029 (USD MILLION)
TABLE 123 FRANCE: DENTAL LABORATORY EQUIPMENT MARKET, BY TYPE,  2022–2029 (USD MILLION)
TABLE 124 FRANCE: DENTAL LASERS MARKET, BY TYPE, 2022–2029 (USD MILLION)
TABLE 125 FRANCE: SOFT-TISSUE LASERS MARKET, BY TYPE, 2022–2029 (USD MILLION)
TABLE 126 FRANCE: ALL-TISSUE LASERS MARKET, BY TYPE, 2022–2029 (USD MILLION)
TABLE 127 FRANCE: DIAGNOSTIC DENTAL EQUIPMENT MARKET, BY TYPE,  2022–2029 (USD MILLION)
TABLE 128 FRANCE: EXTRAORAL IMAGING SYSTEMS MARKET, BY TYPE,  2022–2029 (USD MILLION)
TABLE 129 FRANCE: INTRAORAL IMAGING SYSTEMS MARKET, BY TYPE,  2022–2029 (USD MILLION)
TABLE 130 FRANCE: DENTAL EQUIPMENT MARKET, BY END USER,  2022–2029 (USD MILLION)
TABLE 131 UK: MACROECONOMIC INDICATORS
TABLE 132 UK: DENTAL EQUIPMENT MARKET, BY PRODUCT, 2022–2029 (USD MILLION)
TABLE 133 UK: THERAPEUTIC DENTAL EQUIPMENT MARKET, BY TYPE,  2022–2029 (USD MILLION)
TABLE 134 UK: DENTAL OPERATORY & TREATMENT CENTER EQUIPMENT MARKET, BY TYPE, 2022–2029 (USD MILLION)
TABLE 135 UK: DENTAL UNITS MARKET, BY TYPE, 2022–2029 (USD MILLION)
TABLE 136 UK: DENTAL LABORATORY EQUIPMENT MARKET, BY TYPE,  2022–2029 (USD MILLION)
TABLE 137 UK: DENTAL LASERS MARKET, BY TYPE, 2022–2029 (USD MILLION)
TABLE 138 UK: SOFT-TISSUE LASERS MARKET, BY TYPE, 2022–2029 (USD MILLION)
TABLE 139 UK: ALL-TISSUE LASERS MARKET, BY TYPE, 2022–2029 (USD MILLION)
TABLE 140 UK: DIAGNOSTIC DENTAL EQUIPMENT MARKET, BY TYPE,  2022–2029 (USD MILLION)
TABLE 141 UK: EXTRAORAL IMAGING SYSTEMS MARKET, BY TYPE,  2022–2029 (USD MILLION)
TABLE 142 UK: INTRAORAL IMAGING SYSTEMS MARKET, BY TYPE, 2022–2029 (USD MILLION)
TABLE 143 UK: DENTAL EQUIPMENT MARKET, BY END USER, 2022–2029 (USD MILLION)
TABLE 144 ITALY: MACROECONOMIC INDICATORS
TABLE 145 ITALY: DENTAL EQUIPMENT MARKET, BY PRODUCT, 2022–2029 (USD MILLION)
TABLE 146 ITALY: THERAPEUTIC DENTAL EQUIPMENT MARKET, BY TYPE,  2022–2029 (USD MILLION)
TABLE 147 ITALY: DENTAL OPERATORY & TREATMENT CENTER EQUIPMENT MARKET, BY TYPE, 2022–2029 (USD MILLION)
TABLE 148 ITALY: DENTAL UNITS MARKET, BY TYPE, 2022–2029 USD MILLION)
TABLE 149 ITALY: DENTAL LABORATORY EQUIPMENT MARKET, BY TYPE,  2022–2029 (USD MILLION)
TABLE 150 ITALY: DENTAL LASERS MARKET, BY TYPE, 2022–2029 (USD MILLION)
TABLE 151 ITALY: SOFT-TISSUE LASERS MARKET, BY TYPE, 2022–2029 (USD MILLION)
TABLE 152 ITALY: ALL-TISSUE LASERS MARKET, BY TYPE, 2022–2029 (USD MILLION)
TABLE 153 ITALY: DIAGNOSTIC DENTAL EQUIPMENT MARKET, BY TYPE,  2022–2029 (USD MILLION)
TABLE 154 ITALY: EXTRAORAL IMAGING SYSTEMS MARKET, BY TYPE,  2022–2029 (USD MILLION)
TABLE 155 ITALY: INTRAORAL IMAGING SYSTEMS MARKET, BY TYPE,  2022–2029 (USD MILLION)
TABLE 156 ITALY: DENTAL EQUIPMENT MARKET, BY END USER, 2022–2029 (USD MILLION)
TABLE 157 SPAIN: MACROECONOMIC INDICATORS
TABLE 158 SPAIN: DENTAL EQUIPMENT MARKET, BY PRODUCT, 2022–2029 (USD MILLION)
TABLE 159 SPAIN: THERAPEUTIC DENTAL EQUIPMENT MARKET, BY TYPE,  2022–2029 (USD MILLION)
TABLE 160 SPAIN: DENTAL OPERATORY & TREATMENT CENTER EQUIPMENT MARKET,  BY TYPE, 2022–2029 (USD MILLION)
TABLE 161 SPAIN: DENTAL UNITS MARKET, BY TYPE, 2022–2029 (USD MILLION)
TABLE 162 SPAIN: DENTAL LABORATORY EQUIPMENT MARKET, BY TYPE,  2022–2029 (USD MILLION)
TABLE 163 SPAIN: DENTAL LASERS MARKET, BY TYPE, 2022–2029 (USD MILLION)
TABLE 164 SPAIN: SOFT-TISSUE LASERS MARKET, BY TYPE, 2022–2029 (USD MILLION)
TABLE 165 SPAIN: ALL-TISSUE LASERS MARKET, BY TYPE, 2022–2029 (USD MILLION)
TABLE 166 SPAIN: DIAGNOSTIC DENTAL EQUIPMENT MARKET, BY TYPE,  2022–2029 (USD MILLION)
TABLE 167 SPAIN: EXTRAORAL IMAGING SYSTEMS MARKET, BY TYPE,  2022–2029 (USD MILLION)
TABLE 168 SPAIN: INTRAORAL IMAGING SYSTEMS MARKET, BY TYPE,  2022–2029 (USD MILLION)
TABLE 169 SPAIN: DENTAL EQUIPMENT MARKET, BY END USER, 2022–2029 (USD MILLION)
TABLE 170 REST OF EUROPE: DENTAL EQUIPMENT MARKET, BY PRODUCT,  2022–2029 (USD MILLION)
TABLE 171 REST OF EUROPE: THERAPEUTIC DENTAL EQUIPMENT MARKET, BY TYPE,  2022–2029 (USD MILLION)
TABLE 172 REST OF EUROPE: DENTAL OPERATORY & TREATMENT CENTER EQUIPMENT MARKET, BY TYPE, 2022–2029 (USD MILLION)
TABLE 173 REST OF EUROPE: DENTAL UNITS MARKET, BY TYPE, 2022–2029 (USD MILLION)
TABLE 174 REST OF EUROPE: DENTAL LABORATORY EQUIPMENT MARKET, BY TYPE,  2022–2029 (USD MILLION)
TABLE 175 REST OF EUROPE: DENTAL LASERS MARKET, BY TYPE, 2022–2029 (USD MILLION)
TABLE 176 REST OF EUROPE: SOFT-TISSUE LASERS MARKET, BY TYPE,  2022–2029 (USD MILLION)
TABLE 177 REST OF EUROPE: ALL-TISSUE LASERS MARKET, BY TYPE,  2022–2029 (USD MILLION)
TABLE 178 REST OF EUROPE: DIAGNOSTIC DENTAL EQUIPMENT MARKET, BY TYPE,  2022–2029 (USD MILLION)
TABLE 179 REST OF EUROPE: EXTRAORAL IMAGING SYSTEMS MARKET, BY TYPE,  2022–2029 (USD MILLION)
TABLE 180 REST OF EUROPE: INTRAORAL IMAGING SYSTEMS MARKET, BY TYPE,  2022–2029 (USD MILLION)
TABLE 181 REST OF EUROPE: DENTAL EQUIPMENT MARKET, BY END USER,  2022–2029 (USD MILLION)
TABLE 182 NORTH AMERICA: DENTAL EQUIPMENT MARKET, BY COUNTRY,  2022–2029 (USD MILLION)
TABLE 183 NORTH AMERICA: DENTAL EQUIPMENT MARKET, BY PRODUCT,  2022–2029 (USD MILLION)
TABLE 184 NORTH AMERICA: THERAPEUTIC DENTAL EQUIPMENT MARKET, BY TYPE,  2022–2029 (USD MILLION)
TABLE 185 NORTH AMERICA: DENTAL OPERATORY & TREATMENT CENTER EQUIPMENT MARKET, BY TYPE, 2022–2029 (USD MILLION)
TABLE 186 NORTH AMERICA: DENTAL UNITS MARKET, BY TYPE, 2022–2029 (USD MILLION)
TABLE 187 NORTH AMERICA: DENTAL LABORATORY EQUIPMENT MARKET, BY TYPE,  2022–2029 (USD MILLION)
TABLE 188 NORTH AMERICA: DENTAL LASERS MARKET, BY TYPE, 2022–2029 (USD MILLION)
TABLE 189 NORTH AMERICA: SOFT-TISSUE LASERS MARKET, BY TYPE,  2022–2029 (USD MILLION)
TABLE 190 NORTH AMERICA: ALL-TISSUE LASERS MARKET, BY TYPE,  2022–2029 (USD MILLION)
TABLE 191 NORTH AMERICA: DIAGNOSTIC DENTAL EQUIPMENT MARKET, BY TYPE,  2022–2029 (USD MILLION)
TABLE 192 NORTH AMERICA: EXTRAORAL IMAGING SYSTEMS MARKET, BY TYPE,  2022–2029 (USD MILLION)
TABLE 193 NORTH AMERICA: INTRAORAL IMAGING SYSTEMS MARKET, BY TYPE,  2022–2029 (USD MILLION)
TABLE 194 NORTH AMERICA: DENTAL EQUIPMENT MARKET, BY END USER,  2022–2029 (USD MILLION)
TABLE 195 US: MACROECONOMIC INDICATORS
TABLE 196 US: DENTAL EQUIPMENT MARKET, BY PRODUCT, 2022–2029 (USD MILLION)
TABLE 197 US: THERAPEUTIC DENTAL EQUIPMENT MARKET, BY TYPE,  2022–2029 (USD MILLION)
TABLE 198 US: DENTAL OPERATORY & TREATMENT CENTER EQUIPMENT MARKET, BY TYPE, 2022–2029 (USD MILLION)
TABLE 199 US: DENTAL UNITS MARKET, BY TYPE, 2022–2029 (USD MILLION)
TABLE 200 US: DENTAL LABORATORY EQUIPMENT MARKET, BY TYPE,  2022–2029 (USD MILLION)
TABLE 201 US: DENTAL LASERS MARKET, BY TYPE, 2022–2029 (USD MILLION)
TABLE 202 US: SOFT-TISSUE LASERS MARKET, BY TYPE, 2022–2029 (USD MILLION)
TABLE 203 US: ALL-TISSUE LASERS MARKET, BY TYPE, 2022–2029 (USD MILLION)
TABLE 204 US: DIAGNOSTIC DENTAL EQUIPMENT MARKET, BY TYPE,  2022–2029 (USD MILLION)
TABLE 205 US: EXTRAORAL IMAGING SYSTEMS MARKET, BY TYPE,  2022–2029 (USD MILLION)
TABLE 206 US: INTRAORAL IMAGING SYSTEMS MARKET, BY TYPE, 2022–2029 (USD MILLION)
TABLE 207 US: DENTAL EQUIPMENT MARKET, BY END USER, 2022–2029 (USD MILLION)
TABLE 208 CANADA: MACROECONOMIC INDICATORS
TABLE 209 CANADA: DENTAL EQUIPMENT MARKET, BY PRODUCT, 2022–2029 (USD MILLION)
TABLE 210 CANADA: THERAPEUTIC DENTAL EQUIPMENT MARKET, BY TYPE,  2022–2029 (USD MILLION)
TABLE 211 CANADA: DENTAL OPERATORY & TREATMENT CENTER EQUIPMENT MARKET,  BY TYPE, 2022–2029 (USD MILLION)
TABLE 212 CANADA: DENTAL UNITS MARKET, BY TYPE, 2022–2029 (USD MILLION)
TABLE 213 CANADA: DENTAL LABORATORY EQUIPMENT MARKET, BY TYPE,  2022–2029 (USD MILLION)
TABLE 214 CANADA: DENTAL LASERS MARKET, BY TYPE, 2022–2029 (USD MILLION)
TABLE 215 CANADA: SOFT-TISSUE LASERS MARKET, BY TYPE, 2022–2029 (USD MILLION)
TABLE 216 CANADA: ALL-TISSUE LASERS MARKET, BY TYPE, 2022–2029 (USD MILLION)
TABLE 217 CANADA: DIAGNOSTIC DENTAL EQUIPMENT MARKET, BY TYPE,  2022–2029 (USD MILLION)
TABLE 218 CANADA: EXTRAORAL IMAGING SYSTEMS MARKET, BY TYPE,  2022–2029 (USD MILLION)
TABLE 219 CANADA: INTRAORAL IMAGING SYSTEMS MARKET, BY TYPE,  2022–2029 (USD MILLION)
TABLE 220 CANADA: DENTAL EQUIPMENT MARKET, BY END USER,  2022–2029 (USD MILLION)
TABLE 221 ASIA PACIFIC: DENTAL EQUIPMENT MARKET, BY COUNTRY,  2022–2029 (USD MILLION)
TABLE 222 ASIA PACIFIC: DENTAL EQUIPMENT MARKET, BY PRODUCT,  2022–2029 (USD MILLION)
TABLE 223 ASIA PACIFIC: THERAPEUTIC DENTAL EQUIPMENT MARKET, BY TYPE,  2022–2029 (USD MILLION)
TABLE 224 ASIA PACIFIC: DENTAL OPERATORY & TREATMENT CENTER EQUIPMENT MARKET, BY TYPE, 2022–2029 (USD MILLION)
TABLE 225 ASIA PACIFIC: DENTAL UNITS MARKET, BY TYPE, 2022–2029 (USD MILLION)
TABLE 226 ASIA PACIFIC: DENTAL LABORATORY EQUIPMENT MARKET, BY TYPE,  2022–2029 (USD MILLION)
TABLE 227 ASIA PACIFIC: DENTAL LASERS MARKET, BY TYPE, 2022–2029 (USD MILLION)
TABLE 228 ASIA PACIFIC: SOFT-TISSUE LASERS MARKET, BY TYPE, 2022–2029 (USD MILLION)
TABLE 229 ASIA PACIFIC: ALL-TISSUE LASERS MARKET, BY TYPE, 2022–2029 (USD MILLION)
TABLE 230 ASIA PACIFIC: DIAGNOSTIC DENTAL EQUIPMENT MARKET, BY TYPE,  2022–2029 (USD MILLION)
TABLE 231 ASIA PACIFIC: EXTRAORAL IMAGING SYSTEMS MARKET, BY TYPE,  2022–2029 (USD MILLION)
TABLE 232 ASIA PACIFIC: INTRAORAL IMAGING SYSTEMS MARKET, BY TYPE,  2022–2029 (USD MILLION)
TABLE 233 ASIA PACIFIC: DENTAL EQUIPMENT MARKET, BY END USER,  2022–2029 (USD MILLION)
TABLE 234 CHINA: MACROECONOMIC INDICATORS
TABLE 235 CHINA: DENTAL EQUIPMENT MARKET, BY PRODUCT, 2022–2029 (USD MILLION)
TABLE 236 CHINA: THERAPEUTIC DENTAL EQUIPMENT MARKET, BY TYPE,  2022–2029 (USD MILLION)
TABLE 237 CHINA: DENTAL OPERATORY & TREATMENT CENTER EQUIPMENT MARKET,  BY TYPE, 2022–2029 (USD MILLION)
TABLE 238 CHINA: DENTAL UNITS MARKET, BY TYPE, 2022–2029 (USD MILLION)
TABLE 239 CHINA: DENTAL LABORATORY EQUIPMENT MARKET, BY TYPE,  2022–2029 (USD MILLION)
TABLE 240 CHINA: DENTAL LASERS MARKET, BY TYPE, 2022–2029 (USD MILLION)
TABLE 241 CHINA: SOFT-TISSUE LASERS MARKET, BY TYPE 2022–2029 (USD MILLION)
TABLE 242 CHINA: ALL-TISSUE LASERS MARKET, BY TYPE, 2022–2029 (USD MILLION)
TABLE 243 CHINA: DIAGNOSTIC DENTAL EQUIPMENT MARKET, BY TYPE,  2022–2029 (USD MILLION)
TABLE 244 CHINA: EXTRAORAL IMAGING SYSTEMS MARKET, BY TYPE,  2022–2029 (USD MILLION)
TABLE 245 CHINA: INTRAORAL IMAGING SYSTEMS MARKET, BY TYPE,  2022–2029 (USD MILLION)
TABLE 246 CHINA: DENTAL EQUIPMENT MARKET, BY END USER, 2022–2029 (USD MILLION)
TABLE 247 JAPAN: MACROECONOMIC INDICATORS
TABLE 248 JAPAN: DENTAL EQUIPMENT MARKET, BY PRODUCT, 2022–2029 (USD MILLION)
TABLE 249 JAPAN: THERAPEUTIC DENTAL EQUIPMENT MARKET, BY TYPE,  2022–2029 (USD MILLION)
TABLE 250 JAPAN: DENTAL OPERATORY & TREATMENT CENTER EQUIPMENT MARKET,  BY TYPE, 2022–2029 (USD MILLION)
TABLE 251 JAPAN: DENTAL UNITS MARKET, BY TYPE, 2022–2029 (USD MILLION)
TABLE 252 JAPAN: DENTAL LABORATORY EQUIPMENT MARKET, BY TYPE,  2022–2029 (USD MILLION)
TABLE 253 JAPAN: DENTAL LASERS MARKET, BY TYPE, 2022–2029 (USD MILLION)
TABLE 254 JAPAN: SOFT-TISSUE LASERS MARKET, BY TYPE, 2022–2029 (USD MILLION)
TABLE 255 JAPAN: ALL-TISSUE LASERS MARKET, BY TYPE, 2022–2029 (USD MILLION)
TABLE 256 JAPAN: DIAGNOSTIC DENTAL EQUIPMENT MARKET, BY TYPE,  2022–2029 (USD MILLION)
TABLE 257 JAPAN: EXTRAORAL IMAGING SYSTEMS MARKET, BY TYPE,  2022–2029 (USD MILLION)
TABLE 258 JAPAN: INTRAORAL IMAGING SYSTEMS MARKET, BY TYPE,  2022–2029 (USD MILLION)
TABLE 259 JAPAN: DENTAL EQUIPMENT MARKET, BY END USER, 2022–2029 (USD MILLION)
TABLE 260 INDIA: MACROECONOMIC INDICATORS
TABLE 261 INDIA: DENTAL EQUIPMENT MARKET, BY PRODUCT, 2022–2029 (USD MILLION)
TABLE 262 INDIA: THERAPEUTIC DENTAL EQUIPMENT MARKET, BY TYPE,  2022–2029 (USD MILLION)
TABLE 263 INDIA: DENTAL OPERATORY & TREATMENT CENTER EQUIPMENT MARKET, BY TYPE, 2022–2029 (USD MILLION)
TABLE 264 INDIA: DENTAL UNITS MARKET, BY TYPE, 2022–2029 (USD MILLION)
TABLE 265 INDIA: DENTAL LABORATORY EQUIPMENT MARKET, BY TYPE,  2022–2029 (USD MILLION)
TABLE 266 INDIA: DENTAL LASERS MARKET, BY TYPE, 2022–2029 (USD MILLION)
TABLE 267 INDIA: SOFT-TISSUE LASERS MARKET, BY TYPE, 2022–2029 (USD MILLION)
TABLE 268 INDIA: ALL-TISSUE LASERS MARKET, BY TYPE, 2022–2029 (USD MILLION)
TABLE 269 INDIA: DIAGNOSTIC DENTAL EQUIPMENT MARKET, BY TYPE,  2022–2029 (USD MILLION)
TABLE 270 INDIA: EXTRAORAL IMAGING SYSTEMS MARKET, BY TYPE,  2022–2029 (USD MILLION)
TABLE 271 INDIA: INTRAORAL IMAGING SYSTEMS MARKET, BY TYPE,  2022–2029 (USD MILLION)
TABLE 272 INDIA: DENTAL EQUIPMENT MARKET, BY END USER, 2022–2029 (USD MILLION)
TABLE 273 AUSTRALIA: MACROECONOMIC INDICATORS
TABLE 274 AUSTRALIA: DENTAL EQUIPMENT MARKET, BY PRODUCT,  2022–2029 (USD MILLION)
TABLE 275 AUSTRALIA: THERAPEUTIC DENTAL EQUIPMENT MARKET, BY TYPE,  2022–2029 (USD MILLION)
TABLE 276 AUSTRALIA: DENTAL OPERATORY & TREATMENT CENTER EQUIPMENT MARKET,  BY TYPE, 2022–2029 (USD MILLION)
TABLE 277 AUSTRALIA: DENTAL UNITS MARKET, BY TYPE, 2022–2029 (USD MILLION)
TABLE 278 AUSTRALIA: DENTAL LABORATORY EQUIPMENT MARKET, BY TYPE,  2022–2029 (USD MILLION)
TABLE 279 AUSTRALIA: DENTAL LASERS MARKET, BY TYPE, 2022–2029 (USD MILLION)
TABLE 280 AUSTRALIA: SOFT TISSUE LASERS MARKET, BY TYPE, 2022–2029 (USD MILLION)
TABLE 281 AUSTRALIA: ALL-TISSUE LASERS MARKET, BY TYPE, 2022–2029 (USD MILLION)
TABLE 282 AUSTRALIA: DIAGNOSTIC DENTAL EQUIPMENT MARKET, BY TYPE,  2022–2029 (USD MILLION)
TABLE 283 AUSTRALIA: EXTRAORAL IMAGING SYSTEMS MARKET, BY TYPE,  2022–2029 (USD MILLION)
TABLE 284 AUSTRALIA: INTRAORAL IMAGING SYSTEMS MARKET, BY TYPE,  2022–2029 (USD MILLION)
TABLE 285 AUSTRALIA: DENTAL EQUIPMENT MARKET, BY END USER,  2022–2029 (USD MILLION)
TABLE 286 SOUTH KOREA: MACROECONOMIC INDICATORS
TABLE 287 SOUTH KOREA: DENTAL EQUIPMENT MARKET, BY PRODUCT,  2022–2029 (USD MILLION)
TABLE 288 SOUTH KOREA: THERAPEUTIC DENTAL EQUIPMENT MARKET, BY TYPE,  2022–2029 (USD MILLION)
TABLE 289 SOUTH KOREA: DENTAL OPERATORY & TREATMENT CENTER EQUIPMENT MARKET, BY TYPE, 2022–2029 (USD MILLION)
TABLE 290 SOUTH KOREA: DENTAL UNITS MARKET, BY TYPE, 2022–2029 (USD MILLION)
TABLE 291 SOUTH KOREA: DENTAL LABORATORY EQUIPMENT MARKET, BY TYPE,  2022–2029 (USD MILLION)
TABLE 292 SOUTH KOREA: DENTAL LASERS MARKET, BY TYPE, 2022–2029 (USD MILLION)
TABLE 293 SOUTH KOREA: SOFT-TISSUE LASERS MARKET, BY TYPE,  2022–2029 (USD MILLION)
TABLE 294 SOUTH KOREA: ALL-TISSUE LASERS MARKET, BY TYPE,  2022–2029 (USD MILLION)
TABLE 295 SOUTH KOREA: DIAGNOSTIC DENTAL EQUIPMENT MARKET, BY TYPE,  2022–2029 (USD MILLION)
TABLE 296 SOUTH KOREA: EXTRAORAL IMAGING SYSTEMS MARKET, BY TYPE,  2022–2029 (USD MILLION)
TABLE 297 SOUTH KOREA: INTRAORAL IMAGING SYSTEMS MARKET, BY TYPE,  2022–2029 (USD MILLION)
TABLE 298 SOUTH KOREA: DENTAL EQUIPMENT MARKET, BY END USER,  2022–2029 (USD MILLION)
TABLE 299 REST OF ASIA PACIFIC: DENTAL EQUIPMENT MARKET, BY PRODUCT,  2022–2029 (USD MILLION)
TABLE 300 REST OF ASIA PACIFIC: THERAPEUTIC DENTAL EQUIPMENT MARKET, BY TYPE, 2022–2029 (USD MILLION)
TABLE 301 REST OF ASIA PACIFIC: DENTAL OPERATORY & TREATMENT CENTER EQUIPMENT MARKET, BY TYPE, 2022–2029 (USD MILLION)
TABLE 302 REST OF ASIA PACIFIC: DENTAL UNITS MARKET, BY TYPE,  2022–2029 (USD MILLION)
TABLE 303 REST OF ASIA PACIFIC: DENTAL LABORATORY EQUIPMENT MARKET, BY TYPE, 2022–2029 (USD MILLION)
TABLE 304 REST OF ASIA PACIFIC: DENTAL LASERS MARKET, BY TYPE,  2022–2029 (USD MILLION)
TABLE 305 REST OF ASIA PACIFIC: SOFT-TISSUE LASERS MARKET, BY TYPE,  2022–2029 (USD MILLION)
TABLE 306 REST OF ASIA PACIFIC: ALL-TISSUE LASERS MARKET, BY TYPE,  2022–2029 (USD MILLION)
TABLE 307 REST OF ASIA PACIFIC: DIAGNOSTIC DENTAL EQUIPMENT MARKET, BY TYPE, 2022–2029 (USD MILLION)
TABLE 308 REST OF ASIA PACIFIC: EXTRAORAL IMAGING SYSTEMS MARKET, BY TYPE,  2022–2029 (USD MILLION)
TABLE 309 REST OF ASIA PACIFIC: INTRAORAL IMAGING SYSTEMS MARKET, BY TYPE,  2022–2029 (USD MILLION)
TABLE 310 REST OF ASIA PACIFIC: DENTAL EQUIPMENT MARKET, BY END USER,  2022–2029 (USD MILLION)
TABLE 311 LATIN AMERICA: DENTAL EQUIPMENT MARKET, BY COUNTRY,  2022–2029 (USD MILLION)
TABLE 312 LATIN AMERICA: DENTAL EQUIPMENT MARKET, BY PRODUCT,  2022–2029 (USD MILLION)
TABLE 313 LATIN AMERICA: THERAPEUTIC DENTAL EQUIPMENT MARKET, BY TYPE,  2022–2029 (USD MILLION)
TABLE 314 LATIN AMERICA: DENTAL OPERATORY & TREATMENT CENTER EQUIPMENT MARKET, BY TYPE, 2022–2029 (USD MILLION)
TABLE 315 LATIN AMERICA: DENTAL UNITS MARKET, BY TYPE, 2022–2029 (USD MILLION)
TABLE 316 LATIN AMERICA: DENTAL LABORATORY EQUIPMENT MARKET, BY TYPE,  2022–2029 (USD MILLION)
TABLE 317 LATIN AMERICA: DENTAL LASERS MARKET, BY TYPE, 2022–2029 (USD MILLION)
TABLE 318 LATIN AMERICA: SOFT-TISSUE LASERS MARKET, BY TYPE,  2022–2029 (USD MILLION)
TABLE 319 LATIN AMERICA: ALL-TISSUE LASERS MARKET, BY TYPE,  2022–2029 (USD MILLION)
TABLE 320 LATIN AMERICA: DIAGNOSTIC DENTAL EQUIPMENT MARKET, BY TYPE,  2022–2029 (USD MILLION)
TABLE 321 LATIN AMERICA: EXTRAORAL IMAGING SYSTEMS MARKET, BY TYPE,  2022–2029 (USD MILLION)
TABLE 322 LATIN AMERICA: INTRAORAL IMAGING SYSTEMS MARKET, BY TYPE,  2022–2029 (USD MILLION)
TABLE 323 LATIN AMERICA: DENTAL LABORATORY EQUIPMENT MARKET, BY END USER, 2022–2029 (USD MILLION)
TABLE 324 MEXICO: MACROECONOMIC INDICATORS
TABLE 325 MEXICO: DENTAL EQUIPMENT MARKET, BY PRODUCT, 2022–2029 (USD MILLION)
TABLE 326 MEXICO: THERAPEUTIC DENTAL EQUIPMENT MARKET, BY TYPE,  2022–2029 (USD MILLION)
TABLE 327 MEXICO: DENTAL OPERATORY & TREATMENT CENTER EQUIPMENT MARKET,  BY TYPE, 2022–2029 (USD MILLION)
TABLE 328 MEXICO: DENTAL UNITS MARKET, BY TYPE, 2022–2029 (USD MILLION)
TABLE 329 MEXICO: DENTAL LABORATORY EQUIPMENT MARKET, BY TYPE,  2022–2029 (USD MILLION)
TABLE 330 MEXICO: DENTAL LASERS MARKET, BY TYPE, 2022–2029 (USD MILLION)
TABLE 331 MEXICO: SOFT-TISSUE LASERS MARKET, BY TYPE, 2022–2029 (USD MILLION)
TABLE 332 MEXICO: ALL-TISSUE LASERS MARKET, BY TYPE, 2022–2029 (USD MILLION)
TABLE 333 MEXICO: DIAGNOSTIC DENTAL EQUIPMENT MARKET, BY TYPE,  2022–2029 (USD MILLION)
TABLE 334 MEXICO: EXTRAORAL IMAGING SYSTEMS MARKET, BY TYPE,  2022–2029 (USD MILLION)
TABLE 335 MEXICO: INTRAORAL IMAGING SYSTEMS MARKET, BY TYPE,  2022–2029 (USD MILLION)
TABLE 336 MEXICO: DENTAL EQUIPMENT MARKET, BY END USER, 2022–2029 (USD MILLION)
TABLE 337 BRAZIL: MACROECONOMIC INDICATORS
TABLE 338 BRAZIL: DENTAL EQUIPMENT MARKET, BY PRODUCT, 2022–2029 (USD MILLION)
TABLE 339 BRAZIL: THERAPEUTIC DENTAL EQUIPMENT MARKET, BY TYPE,  2022–2029 (USD MILLION)
TABLE 340 BRAZIL: DENTAL OPERATORY & TREATMENT CENTER EQUIPMENT MARKET,  BY TYPE, 2022–2029 (USD MILLION)
TABLE 341 BRAZIL: DENTAL UNITS MARKET, BY TYPE, 2022–2029 (USD MILLION)
TABLE 342 BRAZIL: DENTAL LABORATORY EQUIPMENT MARKET, BY TYPE,  2022–2029 (USD MILLION)
TABLE 343 BRAZIL: DENTAL LASERS MARKET, BY TYPE, 2022–2029 (USD MILLION)
TABLE 344 BRAZIL: SOFT-TISSUE LASERS MARKET, BY TYPE, 2022–2029 (USD MILLION)
TABLE 345 BRAZIL: ALL-TISSUE LASERS MARKET, BY TYPE, 2022–2029 (USD MILLION)
TABLE 346 BRAZIL: DIAGNOSTIC DENTAL EQUIPMENT MARKET, BY TYPE,  2022–2029 (USD MILLION)
TABLE 347 BRAZIL: EXTRAORAL IMAGING SYSTEMS MARKET, BY TYPE,  2022–2029 (USD MILLION)
TABLE 348 BRAZIL: INTRAORAL IMAGING SYSTEMS MARKET, BY TYPE,  2022–2029 (USD MILLION)
TABLE 349 BRAZIL: DENTAL LABORATORY EQUIPMENT MARKET, BY END USER,  2022–2029 (USD MILLION)
TABLE 350 ARGENTINA: MACROECONOMIC INDICATORS
TABLE 351 ARGENTINA: DENTAL EQUIPMENT MARKET, BY PRODUCT,  2022–2029 (USD MILLION)
TABLE 352 ARGENTINA: THERAPEUTIC DENTAL EQUIPMENT MARKET, BY TYPE,  2022–2029 (USD MILLION)
TABLE 353 ARGENTINA: DENTAL OPERATORY & TREATMENT CENTER EQUIPMENT MARKET,  BY TYPE, 2022–2029 (USD MILLION)
TABLE 354 ARGENTINA: DENTAL UNITS MARKET, BY TYPE, 2022–2029 (USD MILLION)
TABLE 355 ARGENTINA: DENTAL LABORATORY EQUIPMENT MARKET, BY TYPE,  2022–2029 (USD MILLION)
TABLE 356 ARGENTINA: DENTAL LASERS MARKET, BY TYPE, 2022–2029 (USD MILLION)
TABLE 357 ARGENTINA: SOFT-TISSUE LASERS MARKET, BY TYPE, 2022–2029 (USD MILLION)
TABLE 358 ARGENTINA: ALL-TISSUE LASERS MARKET, BY TYPE, 2022–2029 (USD MILLION)
TABLE 359 ARGENTINA: DIAGNOSTIC DENTAL EQUIPMENT MARKET, BY TYPE,  2022–2029 (USD MILLION)
TABLE 360 ARGENTINA: EXTRAORAL IMAGING SYSTEMS MARKET, BY TYPE,  2022–2029 (USD MILLION)
TABLE 361 ARGENTINA: INTRAORAL IMAGING SYSTEMS MARKET, BY TYPE,  2022–2029 (USD MILLION)
TABLE 362 ARGENTINA: DENTAL LABORATORY EQUIPMENT MARKET, BY END USER,  2022–2029 (USD MILLION)
TABLE 363 REST OF LATIN AMERICA: DENTAL EQUIPMENT MARKET, BY PRODUCT,  2022–2029 (USD MILLION)
TABLE 364 REST OF LATIN AMERICA: THERAPEUTIC DENTAL EQUIPMENT MARKET, BY TYPE, 2022–2029 (USD MILLION)
TABLE 365 REST OF LATIN AMERICA: DENTAL OPERATORY & TREATMENT CENTER EQUIPMENT MARKET, BY TYPE, 2022–2029 (USD MILLION)
TABLE 366 REST OF LATIN AMERICA: DENTAL UNITS MARKET, BY TYPE,  2022–2029 (USD MILLION)
TABLE 367 REST OF LATIN AMERICA: DENTAL LABORATORY EQUIPMENT MARKET, BY TYPE, 2022–2029 (USD MILLION)
TABLE 368 REST OF LATIN AMERICA: DENTAL LASERS MARKET, BY TYPE,  2022–2029 (USD MILLION)
TABLE 369 REST OF LATIN AMERICA: SOFT-TISSUE LASERS MARKET, BY TYPE,  2022–2029 (USD MILLION)
TABLE 370 REST OF LATIN AMERICA: ALL-TISSUE LASERS MARKET, BY TYPE,  2022–2029 (USD MILLION)
TABLE 371 REST OF LATIN AMERICA: DIAGNOSTIC DENTAL EQUIPMENT MARKET, BY TYPE, 2022–2029 (USD MILLION)
TABLE 372 REST OF LATIN AMERICA: EXTRAORAL IMAGING SYSTEMS MARKET, BY TYPE, 2022–2029 (USD MILLION)
TABLE 373 REST OF LATIN AMERICA: INTRAORAL IMAGING SYSTEMS MARKET, BY TYPE, 2022–2029 (USD MILLION)
TABLE 374 REST OF LATIN AMERICA: DENTAL EQUIPMENT MARKET, BY END USER,  2022–2029 (USD MILLION)
TABLE 375 MIDDLE EAST & AFRICA: DENTAL EQUIPMENT MARKET, BY PRODUCT,  2022–2029 (USD MILLION)
TABLE 376 MIDDLE EAST & AFRICA: THERAPEUTIC DENTAL EQUIPMENT MARKET, BY TYPE, 2022–2029 (USD MILLION)
TABLE 377 MIDDLE EAST & AFRICA: DENTAL OPERATORY & TREATMENT CENTER EQUIPMENT MARKET, BY TYPE, 2022–2029 (USD MILLION)
TABLE 378 MIDDLE EAST & AFRICA: DENTAL UNITS MARKET, BY TYPE,  2022–2029 (USD MILLION)
TABLE 379 MIDDLE EAST & AFRICA: DENTAL LASERS MARKET, BY TYPE,  2022–2029 (USD MILLION)
TABLE 380 MIDDLE EAST & AFRICA: SOFT-TISSUE LASERS MARKET, BY TYPE,  2022–2029 (USD MILLION)
TABLE 381 MIDDLE EAST & AFRICA: ALL-TISSUE LASERS MARKET, BY TYPE,  2022–2029 (USD MILLION)
TABLE 382 MIDDLE EAST & AFRICA: DENTAL LABORATORY EQUIPMENT MARKET, BY TYPE, 2022–2029 (USD MILLION)
TABLE 383 MIDDLE EAST & AFRICA: EXTRAORAL IMAGING SYSTEMS MARKET, BY TYPE, 2022–2029 (USD MILLION)
TABLE 384 MIDDLE EAST & AFRICA: INTRAORAL IMAGING SYSTEMS MARKET, BY TYPE,  2022–2029 (USD MILLION)
TABLE 385 MIDDLE EAST & AFRICA: DENTAL EQUIPMENT MARKET, BY END USER,  2022–2029 (USD MILLION)
TABLE 386 GCC COUNTRIES: DENTAL EQUIPMENT MARKET, BY PRODUCT,  2022–2029 (USD MILLION)
TABLE 387 GCC COUNTRIES: THERAPEUTIC DENTAL EQUIPMENT MARKET, BY TYPE,  2022–2029 (USD MILLION)
TABLE 388 GCC COUNTRIES: DENTAL OPERATORY & TREATMENT CENTER EQUIPMENT MARKET, BY TYPE, 2022–2029 (USD MILLION)
TABLE 389 GCC COUNTRIES: DENTAL UNITS MARKET, BY TYPE, 2022–2029 (USD MILLION)
TABLE 390 GCC COUNTRIES: DENTAL LABORATORIES EQUIPMENT BY TYPE,  2022–2029 (USD MILLION)
TABLE 391 GCC COUNTRIES: DENTAL LASERS MARKET, BY TYPE, 2022–2029 (USD MILLION)
TABLE 392 GCC COUNTRIES: SOFT-TISSUE LASERS MARKET, BY TYPE,  2022–2029 (USD MILLION)
TABLE 393 GCC COUNTRIES: ALL-TISSUE LASERS MARKET, BY TYPE,  2022–2029 (USD MILLION)
TABLE 394 GCC COUNTRIES: DIAGNOSTIC DENTAL EQUIPMENT MARKET, BY TYPE,  2022–2029 (USD MILLION)
TABLE 395 GCC COUNTRIES: EXTRAORAL IMAGING SYSTEMS MARKET, BY TYPE,  2022–2029 (USD MILLION)
TABLE 396 GCC COUNTRIES: INTRAORAL IMAGING SYSTEMS MARKET, BY TYPE,  2022–2029 (USD MILLION)
TABLE 397 GCC COUNTRIES: DENTAL EQUIPMENT MARKET, BY END USER,  2022–2029 (USD MILLION)
TABLE 398 DENTAL EQUIPMENT MARKET: DEGREE OF COMPETITION
TABLE 399 DENTAL EQUIPMENT MARKET: PRODUCT FOOTPRINT
TABLE 400 DENTAL EQUIPMENT MARKET: END-USER FOOTPRINT
TABLE 401 DENTAL EQUIPMENT MARKET: REGION FOOTPRINT
TABLE 402 DENTAL EQUIPMENT MARKET: DETAILED LIST OF KEY START-UP/SME PLAYERS
TABLE 403 DENTAL EQUIPMENT MARKET: COMPETITIVE BENCHMARKING OF  KEY START-UP/SME PLAYERS, BY REGION
TABLE 404 DENTAL EQUIPMENT MARKET: PRODUCT LAUNCHES, JANUARY 2021–JUNE 2024
TABLE 405 DENTAL EQUIPMENT MARKET: DEALS, JANUARY 2021–JUNE 2024
TABLE 406 DENTAL EQUIPMENT MARKET: EXPANSIONS, JANUARY 2021–JUNE 2024
TABLE 407 DENTSPLY SIRONA INC.: COMPANY OVERVIEW
TABLE 408 DENTSPLY SIRONA INC.: PRODUCTS OFFERED
TABLE 409 DENTSPLY SIRONA INC.: PRODUCT LAUNCHES
TABLE 410 DENTSPLY SIRONA INC.: DEALS
TABLE 411 PLANMECA GROUP: COMPANY OVERVIEW
TABLE 412 PLANMECA GROUP: PRODUCTS OFFERED
TABLE 413 PLANMECA GROUP: PRODUCT LAUNCHES
TABLE 414 PLANMECA GROUP: DEALS
TABLE 415 ALIGN TECHNOLOGY INC.: COMPANY OVERVIEW
TABLE 416 ALIGN TECHNOLOGY INC.: PRODUCTS OFFERED
TABLE 417 ALIGN TECHNOLOGY INC.: PRODUCT LAUNCHES
TABLE 418 ALIGN TECHNOLOGY INC.: DEALS
TABLE 419 ALIGN TECHNOLOGY INC.: EXPANSIONS
TABLE 420 ENVISTA HOLDINGS CORPORATION: COMPANY OVERVIEW
TABLE 421 ENVISTA HOLDINGS CORPORATION: PRODUCTS OFFERED
TABLE 422 ENVISTA HOLDINGS CORPORATION: DEALS
TABLE 423 ENVISTA HOLDINGS CORPORATION: OTHER DEVELOPMENTS
TABLE 424 CARESTREAM DENTAL LLC: COMPANY OVERVIEW
TABLE 425 CARESTREAM DENTAL LLC: PRODUCTS OFFERED
TABLE 426 CARESTREAM DENTAL LLC: DEALS
TABLE 427 NAKANISHI INC.: COMPANY OVERVIEW
TABLE 428 NAKANISHI INC.: PRODUCTS OFFERED
TABLE 429 A-DEC: COMPANY OVERVIEW
TABLE 430 A-DEC: PRODUCTS OFFERED
TABLE 431 A-DEC: PRODUCT LAUNCHES
TABLE 432 A-DEC: DEALS
TABLE 433 J. MORITA CORP.: COMPANY OVERVIEW
TABLE 434 J. MORITA CORP.: PRODUCTS OFFERED
TABLE 435 J. MORITA CORP.: PRODUCT LAUNCHES
TABLE 436 J. MORITA CORP.: DEALS
TABLE 437 IVOCLAR VIVADENT: COMPANY OVERVIEW
TABLE 438 IVOCLAR VIVADENT: PRODUCTS OFFERED
TABLE 439 GC CORPORATION: COMPANY OVERVIEW
TABLE 440 GC CORPORATION: PRODUCTS OFFERED
TABLE 441 GC CORPORATION: DEALS
TABLE 442 MIDMARK CORPORATION: COMPANY OVERVIEW
TABLE 443 MIDMARK CORPORATION: PRODUCTS OFFERED
TABLE 444 MIDMARK CORPORATION: DEALS
TABLE 445 MIDMARK CORPORATION: EXPANSIONS
TABLE 446 3SHAPE: COMPANY OVERVIEW
TABLE 447 3SHAPE: PRODUCTS OFFERED
TABLE 448 3SHAPE: PRODUCT LAUNCHES
TABLE 449 3SHAPE: DEALS
TABLE 450 INSTITUT STRAUMANN AG: COMPANY OVERVIEW
TABLE 451 INSTITUT STRAUMANN AG: PRODUCTS OFFERED
TABLE 452 INSTITUT STRAUMANN AG: DEALS
TABLE 453 ULTRADENT PRODUCTS, INC.: COMPANY OVERVIEW
TABLE 454 ULTRADENT PRODUCTS, INC.: PRODUCTS OFFERED
TABLE 455 BIOLASE INC.: COMPANY OVERVIEW
TABLE 456 BIOLASE INC.: PRODUCTS OFFERED
TABLE 457 BIOLASE INC.: PRODUCT LAUNCHES
TABLE 458 3M COMPANY: COMPANY OVERVIEW
TABLE 459 3M COMPANY: PRODUCTS OFFERED
TABLE 460 BEGO GMBH & CO. KG: COMPANY OVERVIEW
TABLE 461 BEGO GMBH & CO. KG: PRODUCTS OFFERED
TABLE 462 YOSHIDA DENTAL MFG.CO. LTD.: COMPANY OVERVIEW
TABLE 463 YOSHIDA DENTAL MFG.CO. LTD.: PRODUCTS OFFERED
TABLE 464 DENTALEZ INC.: COMPANY OVERVIEW
TABLE 465 DENTALEZ INC.: PRODUCTS OFFERED
TABLE 466 DENTALEZ INC.: PRODUCT LAUNCHES
TABLE 467 TAKARA BELMONT CORPORATION: COMPANY OVERVIEW
TABLE 468 TAKARA BELMONT CORPORATION: PRODUCTS OFFERED
 
 
LIST OF FIGURES (59 FIGURES)
 
FIGURE 1 DENTAL EQUIPMENT MARKET SEGMENTATION & GEOGRAPHICAL SPREAD
FIGURE 2 RESEARCH DESIGN
FIGURE 3 PRIMARY SOURCES
FIGURE 4 BREAKDOWN OF PRIMARY INTERVIEWS: SUPPLY-SIDE AND  DEMAND-SIDE PARTICIPANTS
FIGURE 5 BREAKDOWN OF PRIMARY INTERVIEWS: BY COMPANY TYPE,  DESIGNATION, AND REGION
FIGURE 6 BREAKDOWN OF PRIMARY INTERVIEWS (DEMAND SIDE): BY END USER, DESIGNATION, AND REGION
FIGURE 7 SUPPLY-SIDE MARKET SIZE ESTIMATION: REVENUE SHARE ANALYSIS
FIGURE 8 REVENUE SHARE ANALYSIS ILLUSTRATION: ENVISTA HOLDINGS  CORPORATION, 2023
FIGURE 9 SUPPLY-SIDE ANALYSIS: DENTAL EQUIPMENT MARKET (2023)
FIGURE 10 CAGR PROJECTIONS FROM ANALYSIS OF DRIVERS, RESTRAINTS, OPPORTUNITIES, AND CHALLENGES IN DENTAL EQUIPMENT MARKET (2024–2029)
FIGURE 11 CAGR PROJECTIONS: SUPPLY-SIDE ANALYSIS
FIGURE 12 TOP-DOWN APPROACH
FIGURE 13 MARKET DATA TRIANGULATION METHODOLOGY
FIGURE 14 STUDY ASSUMPTIONS
FIGURE 15 DENTAL EQUIPMENT MARKET, BY PRODUCT, 2024 VS. 2029 (USD MILLION)
FIGURE 16 THERAPEUTIC DENTAL EQUIPMENT MARKET, BY TYPE,  2024 VS. 2029 (USD MILLION)
FIGURE 17 DIAGNOSTIC DENTAL EQUIPMENT MARKET, BY TYPE,  2024 VS. 2029 (USD MILLION)
FIGURE 18 DENTAL EQUIPMENT MARKET, BY END USER, 2024 VS. 2029 (USD MILLION)
FIGURE 19 GEOGRAPHIC SNAPSHOT: DENTAL EQUIPMENT MARKET
FIGURE 20 INCREASING PREVALENCE OF ORAL HEALTH DISORDERS TO  DRIVE MARKET GROWTH
FIGURE 21 CHINA ACCOUNTED FOR LARGEST SHARE OF ASIA PACIFIC MARKET IN 2023
FIGURE 22 INDIA TO REGISTER HIGHEST GROWTH RATE DURING FORECAST PERIOD
FIGURE 23 EUROPE TO CONTINUE TO DOMINATE DENTAL EQUIPMENT MARKET DURING FORECAST PERIOD
FIGURE 24 EMERGING ECONOMIES TO REGISTER HIGHER GROWTH RATES  DURING FORECAST PERIOD
FIGURE 25 DENTAL EQUIPMENT MARKET: DRIVERS, RESTRAINTS,  OPPORTUNITIES, AND CHALLENGES
FIGURE 26 TOTAL DENTAL ENROLMENT (2011–2020)
FIGURE 27 DENTAL EQUIPMENT MARKET: VALUE CHAIN ANALYSIS
FIGURE 28 DENTAL EQUIPMENT MARKET: ECOSYSTEM ANALYSIS
FIGURE 29 DENTAL EQUIPMENT MARKET: SUPPLY CHAIN ANALYSIS
FIGURE 30 PATENT PUBLICATION TRENDS (2013–2024)
FIGURE 31 TOP APPLICANTS AND OWNERS (COMPANIES/INSTITUTES) FOR  DENTAL EQUIPMENT PATENTS (2013–2024)
FIGURE 32 TOP 10 APPLICANT COUNTRIES/REGIONS FOR DENTAL EQUIPMENT  PATENTS (2013–2024)
FIGURE 33 TRENDS/DISRUPTIONS IMPACTING CUSTOMERS’ BUSINESSES IN  DENTAL EQUIPMENT MARKET
FIGURE 34 ADJACENT MARKETS FOR DENTAL EQUIPMENT
FIGURE 35 PORTER’S FIVE FORCES ANALYSIS
FIGURE 36 AVERAGE SELLING PRICE OF DENTAL EQUIPMENT, BY PRODUCT TYPE
FIGURE 37 INFLUENCE OF STAKEHOLDERS ON BUYING PROCESS FOR DENTAL EQUIPMENT
FIGURE 38 KEY BUYING CRITERIA FOR DENTAL EQUIPMENT
FIGURE 39 DENTAL EQUIPMENT MARKET: INVESTMENT & FUNDING SCENARIO
FIGURE 40 DENTAL EQUIPMENT MARKET: GEOGRAPHIC SNAPSHOT
FIGURE 41 EUROPE: DENTAL EQUIPMENT MARKET SNAPSHOT
FIGURE 42 ASIA PACIFIC: DENTAL EQUIPMENT MARKET SNAPSHOT
FIGURE 43 OVERVIEW OF STRATEGIES DEPLOYED BY KEY MANUFACTURING COMPANIES
FIGURE 44 REVENUE ANALYSIS OF TOP THREE PLAYERS IN DENTAL EQUIPMENT  MARKET (2019–2023)
FIGURE 45 MARKET SHARE ANALYSIS OF KEY PLAYERS (2023)
FIGURE 46 DENTAL EQUIPMENT MARKET: COMPANY EVALUATION MATRIX  (KEY PLAYERS), 2023
FIGURE 47 DENTAL EQUIPMENT MARKET: COMPANY FOOTPRINT
FIGURE 48 DENTAL EQUIPMENT MARKET: COMPANY EVALUATION MATRIX  (START-UPS/SMES), 2023
FIGURE 49 EV/EBITDA OF KEY VENDORS
FIGURE 50 YEAR-TO-DATE (YTD) PRICE TOTAL RETURN AND 5-YEAR STOCK BETA  OF KEY VENDORS
FIGURE 51 BRAND/PRODUCT COMPARATIVE ANALYSIS, BY MODEL
FIGURE 52 R&D EXPENDITURE OF KEY PLAYERS (2022 VS. 2023)
FIGURE 53 DENTSPLY SIRONA INC.: COMPANY SNAPSHOT (2023)
FIGURE 54 ALIGN TECHNOLOGY INC.: COMPANY SNAPSHOT (2023)
FIGURE 55 ENVISTA HOLDINGS CORPORATION: COMPANY SNAPSHOT (2023)
FIGURE 56 NAKANISHI INC.: COMPANY SNAPSHOT (2023)
FIGURE 57 INSTITUT STRAUMANN AG: COMPANY SNAPSHOT (2023)
FIGURE 58 BIOLASE INC.: COMPANY SNAPSHOT (2023)
FIGURE 59 3M COMPANY: COMPANY SNAPSHOT (2023)

This research study involved the extensive use of both primary and secondary sources. It involved the study of various factors affecting the industry to identify the segmentation types, industry trends, key players, the competitive landscape of market players, and key market dynamics such as drivers, opportunities, challenges, restraints, and key player strategies.

Secondary Research

This research study involved the wide use of secondary sources, directories, databases such as Dun & Bradstreet, Bloomberg Businessweek, and Factiva, white papers, and companies’ house documents. Secondary research was undertaken to identify and collect information for this extensive, technical, market-oriented, and commercial study of the dental equipment market. It was also used to obtain important information about the top players, market classification, and segmentation according to industry trends to the bottom-most level, geographic markets, and key developments related to the market. A database of the key industry leaders was also prepared using secondary research.

Primary Research

In the primary research process, various supply side and demand side sources were interviewed to obtain qualitative and quantitative information for this report. Primary sources from the supply side included industry experts such as CEOs, vice presidents, marketing and sales directors, technology & innovation directors, engineers, and related key executives from various companies and organizations operating in the dental equipment market. Primary sources from the demand side included hospitals, clinics, researchers, lab technicians, purchase managers etc, and stakeholders in corporate & government bodies.

Breakdown of Primary Interviews

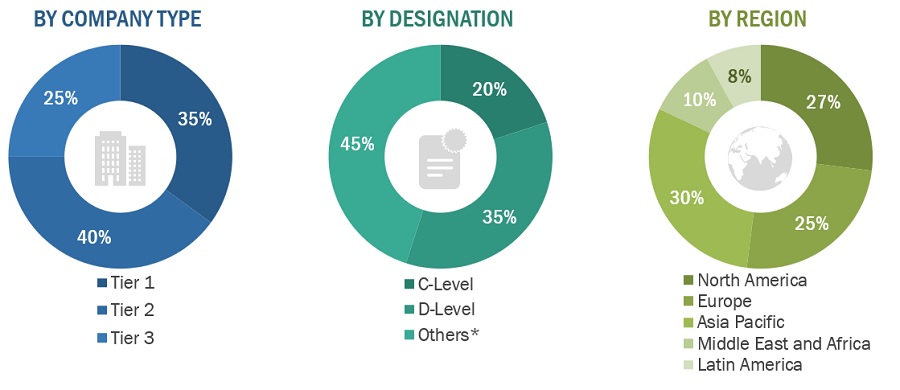
A breakdown of the primary respondents for dental equipment market (supply side) market is provided below:
Dental Equipment Market Size, and Share

Note 1: Companies are classified into tiers based on their total revenue. As of 2023: Tier 1 = >USD 1 billion, Tier 2 = USD 500 million to USD 1 billion, and Tier 3 = <USD 500 million.

Note 2: C-level executives include CEOs, COOs, CTOs, and VPs.

Note 3: Other primaries include sales managers, marketing managers, and product managers.

To know about the assumptions considered for the study, download the pdf brochure

Market Size Estimation

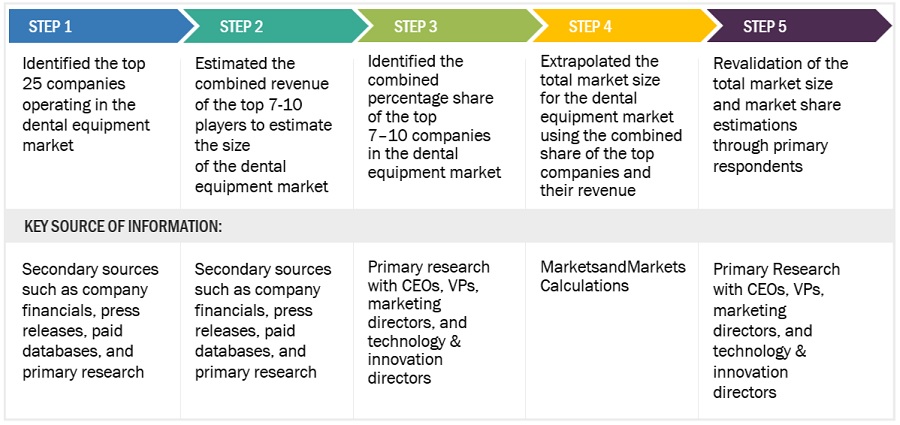
The market size for dental equipment market was calculated using data from four different sources, as will be discussed below. Each technique concluded and a weighted average of the four ways was calculated based on the number of assumptions each approach made. The market size for dental equipment market was calculated using data from four distinct sources, as will be discussed below:

Dental Equipment Market: Supply-Side Analysis - Revenue Share Analysis
Dental Equipment Market Size, and Share

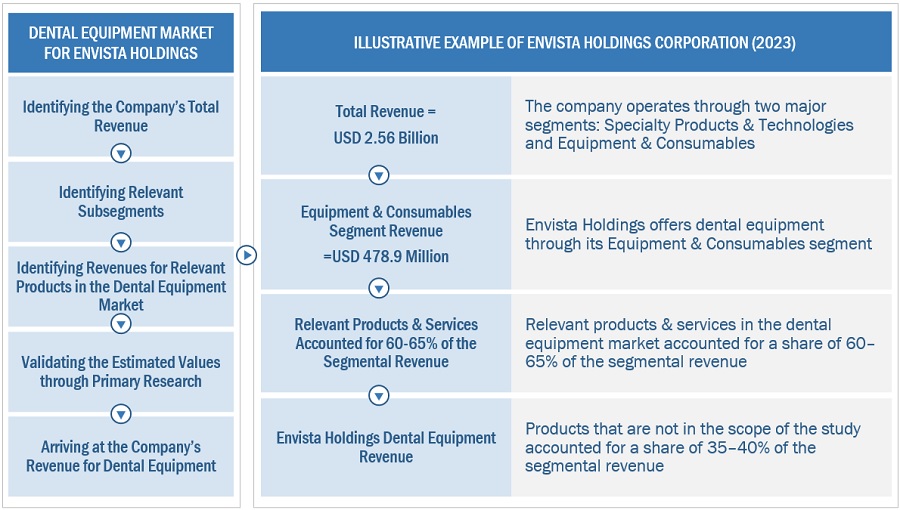
Dental Equipment Market: Revenue Share Analysis Illustration Of Envista Holdings Corporation
Dental Equipment Market Size, and Share

To know about the assumptions considered for the study, Request for Free Sample Report

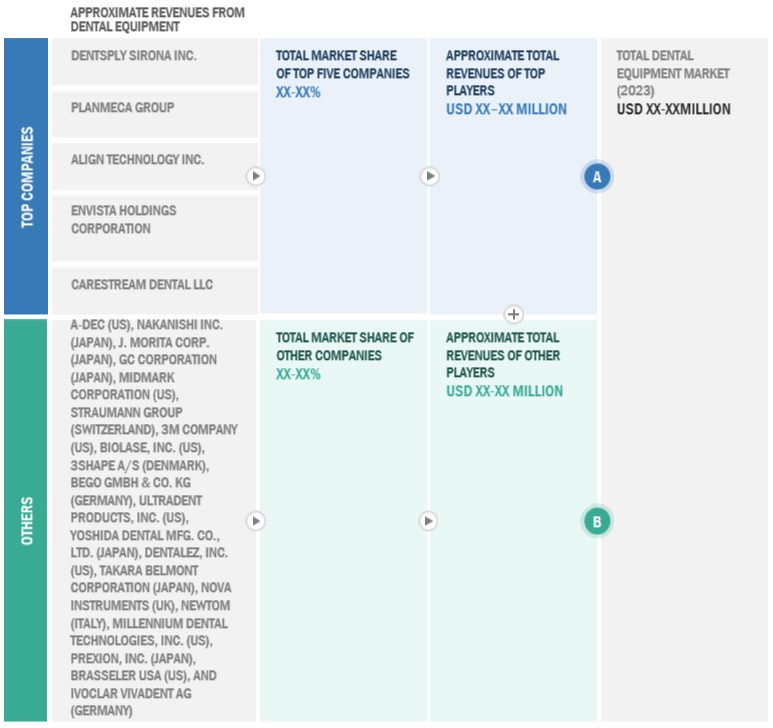
Dental Equipment Market: Supply Side Analysis: Dental Equipment Market (2023)
Dental Equipment Market Size, and Share

Data Triangulation

The entire market was split up into several segments when the market size was determined. Data triangulation and market breakdown processes were used where necessary to complete the entire market engineering process and arrive at the precise statistics for all segments.

Approach to derive the market size and estimate market growth.

Using secondary data from both paid and unpaid sources, the market rankings for the major players were determined following a thorough analysis of their sales of dental equipments. Due to data restrictions, the revenue share in certain cases was determined after a thorough analysis of the product portfolio of big corporations and their individual sales performance. This information was verified at each stage by in-depth interviews with professionals in the field.

Market Definition

Dental equipment encompasses the tools and instruments used to diagnose and treat a range of dental diseases and disorders. These supplies are utilized by dentists, dental hygienists, and dental laboratories. The category includes a variety of dental equipment, such as diagnostic tools and therapeutic instruments.

Key Stakeholders

  • Manufacturers and distributors of medical devices
  • Dental equipment manufacturers
  • Contract manufacturers of dental equipment
  • Distributors of dental equipment
  • Research and consulting firms
  • Raw material suppliers of dental equipment
  • Dental hospitals and clinics
  • Dental laboratories and associations
  • Dental practitioners
  • Dental laboratory technicians
  • Healthcare institutions
  • Diagnostic laboratories
  • Hospitals and clinics
  • Academic institutions
  • Research institutions
  • Government associations
  • Market research and consulting firms
  • Venture capitalists and investors

Objectives of the Study

  • To define, describe, and forecast the dental equipment market based on by type, end user, and region
  • To provide detailed information about the major factors influencing the market growth (such as drivers, restraints, challenges, and opportunities)
  • To strategically analyze micromarkets1 with respect to individual growth trends, prospects, and contributions to the overall dental equipment market
  • To analyze market opportunities for stakeholders and provide details of the competitive landscape for key players
  • To forecast the size of the dental equipment market in North America, Europe, the Asia Pacific, Latin America, Middle East & Africa and GCC Countries
  • To profile the key players and comprehensively analyze their market shares and core competencies in the dental equipment market
  • To track and analyze competitive developments such as partnerships, expansions, acquisitions, collaborations, service launches, agreements, and other developments in the dental equipment market
  • To benchmark players within the dental equipment market using the Company Evaluation Quadrant framework, which analyzes market players on various parameters within the broad categories of business strategy, market share, and service offerings

Available Customizations:

With the given market data, MarketsandMarkets offers customizations as per your company’s specific needs. The following customization options are available for the report:

Company Information

  • Detailed analysis and profiling of additional market players (up to 5)

Geographic Analysis

  • Further breakdown of the Rest of Europe Dental Equipment Market into Denmark, Norway, and others
  • Further breakdown of the Rest of Asia Pacific Dental Equipment Market into Vietnam, New Zealand, and others
Custom Market Research Services

We will customize the research for you, in case the report listed above does not meet with your exact requirements. Our custom research will comprehensively cover the business information you require to help you arrive at strategic and profitable business decisions.

Request Customization

Instant Answers with GPT - Ask Now!

Ask real questions. Get complete answers !
Report Code
MD 2666
Published ON
Jul, 2024
Choose License Type
BUY NOW
  • SHARE
X
Request Customization
Speak to Analyst
Speak to Analyst
OR FACE-TO-FACE MEETING
PERSONALIZE THIS RESEARCH
  • Triangulate with your Own Data
  • Get Data as per your Format and Definition
  • Gain a Deeper Dive on a Specific Application, Geography, Customer or Competitor
  • Any level of Personalization
REQUEST A FREE CUSTOMIZATION
LET US HELP YOU!
  • What are the Known and Unknown Adjacencies Impacting the Dental Equipment Market
  • What will your New Revenue Sources be?
  • Who will be your Top Customer; what will make them switch?
  • Defend your Market Share or Win Competitors
  • Get a Scorecard for Target Partners
CUSTOMIZED WORKSHOP REQUEST
  • Call Us
  • +1-888-600-6441 (Corporate office hours)
  • +1-888-600-6441 (US/Can toll free)
  • +44-800-368-9399 (UK office hours)
CONNECT WITH US
ABOUT TRUST ONLINE
©2024 MarketsandMarkets Research Private Ltd. All rights reserved
DMCA.com Protection Status
Website Feedback