Dental Bone Graft Substitute Market

Dental Bone Graft Substitute Market Size, Share & Trends by Type ( Xenograft, Allograft, Synthetic Bone Grafts, Alloplast), Application (sinus Lift, Ridge Augumentation, Socket Preservation), Product (BioOss, Osteograf, Grafton), End User, Region- Global Forecast to 2029

Report Code: MD 4392 Apr, 2024, by marketsandmarkets.com

Dental Bone Graft Substitute Market Size, Share & Trends

The size of global dental bone graft substitute market in terms of revenue was estimated to be worth $1.3 billion in 2024 and is poised to reach $1.8 billion by 2029, growing at a CAGR of 7.7% from 2024 to 2029. The comprehensive research encompasses an exhaustive examination of industry trends, meticulous pricing analysis, patent scrutiny, insights derived from conferences and webinars, identification of key stakeholders, and a nuanced understanding of market purchasing dynamics.

The increasing popularity of dental implants as a tooth replacement option creates a direct need for bone graft substitutes. Implants require sufficient jawbone density for successful placement and long-term stability. When natural bone is insufficient, bone grafts provide the necessary foundation for implants which is expected drive the dental bone graft substitute.

In this report, the dental bone graft substitute is segmented into – type, application, mechanism, product, end user and region.

Dental Bone Graft Substitute Market Trends

Dental Bone Graft Substitute Market

To know about the assumptions considered for the study, Request for Free Sample Report

Dental Bone Graft Substitute Market

Dental Bone Graft Substitute Dynamics

Driver: Rising aging population

Life expectancy is increasing globally, while birth rates are declining in many countries. This leads to a larger proportion of older adults in the population pyramid, the United Nations reports that the global population aged 60 years or over is projected to nearly double from 1 billion in 2020 to 2.1 billion by 2050 an aging population creates a higher demand for healthcare services, particularly those related to age-related conditions like dental disorders which is expected to drive the market growth.

Restraint: Stringent regulatory guidelines for medical devices.

Meeting all regulatory requirements can lead to a lengthy and expensive approval process for new bone graft substitutes, potentially delaying patient access to innovative technologies also complying with stringent regulations can be costly for manufacturers, impacting the affordability of these materials which is expected to restrain the market growth. Regulations imposed by regulatory agencies, such as the European Medicines Agency (EMA) in the European Union or the Food and Drug Administration (FDA) in the United States, must be followed by medical devices. The guidelines and procedures for the creation, production, labeling, and promotion of medical devices are outlined in these regulations.

Opportunity: Growing Prevalence of Dental Disorders

Tooth loss can result from dental problems like trauma, gum disease, and decay. Because the tooth root isn't stimulating the jawbone as much as teeth fall out, this might happen over time. In order to provide a strong basis for dental implants or other restorative procedures, dental bone grafting can aid in the regeneration of missing bone.

Bone graft substitutes play a crucial role in jawbone regeneration and reconstruction, enabling dentists to perform implant procedures and other dental treatments requiring a strong bone base which is expected to create opportunities for the growth of the market.

Challenge: High Surgical Procedures Costs

Bone grafting procedures, while minimally invasive in some cases, still incur surgical costs associated with hospital or clinic fees, surgeon fees, and anesthesia. Procedures for dental bone grafting can be expensive, especially when paired with other medical interventions like implant insertion. The cost of these procedures out of pocket may be too high for a lot of individuals, particularly those without sufficient dental insurance. These combined costs can be a barrier for some patients which is expected to challenge the market growth.

DENTAL BONE GRAFT SUBSTITUTE INDUSTRY ECOSYSTEM

The dental bone graft substitute is becoming increasingly competitive, with new players entering the market and established players vying for market share. This competition drives down prices as companies try to undercut each other. The cost of materials, equipment, and labor is increasing, putting pressure on dental businesses to maintain profitability while keeping prices competitive. Consolidation within the dental industry, particularly the rise of dental laboratories creates larger entities with greater purchasing power. This can lead to lower prices for supplies and equipment, further pressuring smaller players also government regulations and changes in insurance coverage can impact reimbursement rates for dental procedures, forcing providers to adjust their pricing strategies

Dental Bone Graft Substitute Market Ecosystem

By type, synthetic bone graft is expected to show the highest CAGR of the dental bone graft substitute industry from 2024 to 2029.

The type segment is segmented into synthetic bone graft, xenograft, allograft, autograft, alloplastic, demineralized allograft, others.

Synthetic bone grafts are a vital segment of the growing dental bone graft substitute market. They offer a readily available, safe, and versatile alternative to traditional bone graft options. As technology advances and costs decrease, synthetic bone grafts are expected to play an increasingly prominent role in jawbone reconstruction and implant placement procedures. which is expected to drive the segment growth.

By application, ridge augmentation is expected to show the second highest CAGR of the dental bone graft substitute industry from 2024 to 2029.

The dental bone graft substitute market plays a vital role in facilitating successful ridge augmentation procedures, ultimately enabling the placement and stability of dental implants. As the market evolves, advancements in materials, minimally invasive techniques, and potentially regenerative technologies are expected to further improve patient outcomes and drive continued growth in the ridge augmentation segment which is expected to drive the market growth.

Europe accounted for the second largest CAGR of the global dental bone graft substitute industry, by region in the forecast period.

The dental bone graft substitute in Europe is expected to grow at the second largest CAGR due to a combination of factors that highlight the region's changing healthcare landscape. Some European governments are promoting diagnostic health awareness and offering subsidies for several treatments, further stimulating market growth. The aging population in Europe is increasing the demand for dental bone graft  substitutes to address several oral diseases. Increasing wealth in European countries is leading to higher spending on healthcare, including dental bone graft substitute.

Dental Bone Graft Substitute Market by Region

To know about the assumptions considered for the study, download the pdf brochure

The key players in the dental bone graft substitute include Dentsply Sirona Inc. (US), Envista Holdings Corporation (US), JOHNSON & JOHNSON (US), Stryker Corporation (US), Medtronic, Plc (Ireland), Institut Straumann AG (Switzerland),  Zimvie Inc. (US), Henry Schein Inc. (US), RTI Surgical Holdings Inc. (US), Lifenet Health (US), Dentium (US), Geistlich Pharma AG (Switzerland), Integra Lifesciences Holdings Corporation (US), Tissue Regenix Group (UK), Kuraray Co. Ltd. (Japan), BEGO GmbH & Co. KG (Germany), Young Innovations (US), Keystone Dental (US), Novabone LLC. (US), Biotiss Biomaterials LLC (US), Collagen Matrix Inc.(US), Osteogenics Biomedical (US), Hannox International Corp.(Taiwan), Meyer Haake GMBH (Germany) and  Arora Biosurgery Ltd. (New Zealand).

Scope of the Dental Bone Graft Substitute Industry

Report Metric

Details

Market Revenue Size in 2024

$1.3 billion

Projected Revenue Size by 2029

$1.8 billion

Industry Growth Rate

Poised to Grow at a CAGR of 7.7%

Market Driver

Rising aging population

Market Opportunity

Growing Prevalence of Dental Disorders

The study categorizes the dental bone graft substitute market to forecast revenue and analyze trends in each of the following submarkets:

By Type
  • Synthetic Bone Graft
  • Xenograft
  • Allograft
  • Autograft
  • Alloplast
  • Deminerlized Allograft
  • Others
By Application
  • Socket Preservation
  • Ridge Augmentation
  • Periodontal Defect Regeneration
  • Implant Bone Regeneration
  • Sinus Lift
By Mechanism
  • Osteoconduction
  • Osteoinduction
  • Osteopromotion
  • Osteogenesis
By Product
  • Bio OSS
  • Osteograf
  • Grafton
  • Others
By End User
  • Hospitals
  • Dental Clinics
  • Others (Ortho Clinics, Research)
By Region
  • North America
    • US
    • Canada
  • Europe
    • Germany
    • UK
    • France
    • Italy
    • Spain
    • Rest of Europe
  • Asia Pacific
    • Japan
    • China
    • India
    • Australia
    • South Korea
    • Rest of APAC
  • Latin America
    • Brazil
    • Mexico
    • Argentina
    • Rest of Latin America
  • Middle East & Africa
  • GCC Countries

Recent Developments of Dental Bone Graft Substitute Industry:

  • In April 2023, Henry Schein acquired a majority ownership position in Biotech Dental, aiming to create a digital workflow that provides a seamless journey for customers to increase case acceptance and improve clinical outcomes for practitioners
  • In March 2022, Dentsply Sirona Inc. partnered with Platform for Better Oral Health in Europe. The goal is to improve oral health and the prevention of oral diseases - as well as address oral health inequalities and challenges.
  • In February 2022, Envista Holdings Corporation (US) partnered with Vitaldent Group (Spain). This extended agreement positions Envista as the preferred supplier of implants (Nobel Biocare) and clear aligners (Spark).
  • In January 2022, Johnson & Johnson partnered with Microsoft Corporation, Inc. The Johnson & Johnson Medical Devices Companies (JJMDC) collaborated with Microsoft Corporation Inc, (US) to enable and expand JJMDC’s secure and compliant digital surgery ecosystem.

Frequently Asked Questions (FAQ):

To speak to our analyst for a discussion on the above findings, click Speak to Analyst

Exclusive indicates content/data unique to MarketsandMarkets and not available with any competitors.

INTRODUCTION
25
RESEARCH METHODOLOGY
30
EXECUTIVE SUMMARY
47
PREMIUM INSIGHTS
51
MARKET OVERVIEW
55
  • 5.1 INTRODUCTION
  • 5.2 MARKET DYNAMICS
    DRIVERS
    - Growing market for dental tourism in emerging countries
    - Increasing disposable income in developing countries
    - Rising cases of dental caries and subsequent increase in tooth repair procedures
    - Changing demographics
    RESTRAINTS
    - Lack of proper reimbursement scenario
    - Stringent regulations pertaining to medical devices used in dentistry
    - Dearth of trained dental practitioners
    OPPORTUNITIES
    - Increasing demand from customers and rising inclination toward cosmetic dentistry
    - Low penetration rates for dental bone graft substitutes
    - Consolidation of dental practices and rising DSO activity
    - Growing demand for bone graft substitutes from emerging markets
    CHALLENGES
    - Pricing pressure faced by prominent market players
INDUSTRY TRENDS
61
  • 6.1 RISING NUMBER OF INDUSTRY-ACADEMIA COLLABORATIONS
  • 6.2 HIGH INVESTMENT ACTIVITY IN DENTAL PRACTICES IN US AND UK
  • 6.3 TECHNOLOGY ANALYSIS
    GASLESS SPRAY TIP TECHNOLOGY
  • 6.4 BIO CERAMICS
  • 6.5 PRICING ANALYSIS
  • 6.6 TARIFF AND REGULATORY LANDSCAPE
    REGULATORY ANALYSIS
    - US
    - European Union
    - China
  • 6.7 REGULATORY BODIES, GOVERNMENT AGENCIES, AND OTHER ORGANIZATIONS
  • 6.8 VALUE CHAIN ANALYSIS
  • 6.9 PORTER’S FIVE FORCES ANALYSIS
    THREAT OF NEW ENTRANTS
    THREAT OF SUBSTITUTES
    BARGAINING POWER OF SUPPLIERS
    BARGAINING POWER OF BUYERS
    INTENSITY OF COMPETITIVE RIVALRY
  • 6.10 SUPPLY CHAIN ANALYSIS
  • 6.11 TRADE ANALYSIS
  • 6.12 PATENT ANALYSIS
  • 6.13 PATENT PUBLICATION TRENDS FOR DENTAL BONE GRAFT SUBSTITUTES
  • 6.14 JURISDICTION ANALYSIS: TOP APPLICANTS FOR PATENTS IN DENTAL BONE GRAFT SUBSTITUTES MARKET
  • 6.15 CASE STUDIES
    IDENTIFYING PREFERRED ANTIMICROBIAL AGENTS AND COATING SUBSTANCES USED FOR IMPLANT COATINGS
    ANALYZING SHARE OF RADIOGRAPHY SYSTEMS IN DENTISTRY MARKET
  • 6.16 KEY CONFERENCES & EVENTS
  • 6.17 KEY STAKEHOLDERS & BUYING CRITERIA
    KEY STAKEHOLDERS IN BUYING PROCESS
    BUYING CRITERIA
  • 6.18 ECOSYSTEM/MARKET MAP
    ROLE OF PLAYERS IN MARKET ECOSYSTEM
  • 6.19 ADJACENT MARKET ANALYSIS
  • 6.20 TRENDS/DISRUPTIONS IMPACTING CUSTOMERS’ BUSINESSES
  • 6.21 DENTAL BONE GRAFT SUBSTITUTES MARKET: UNMET NEEDS
  • 6.22 ROLE OF ARTIFICIAL INTELLIGENCE (AI) IN DENTAL BONE GRAFT SUBSTITUTES MARKET
  • 6.23 INVESTMENT/VENTURE CAPITAL
DENTAL BONE GRAFT SUBSTITUTES MARKET, BY APPLICATION
85
  • 7.1 INTRODUCTION
  • 7.2 SOCKET PRESERVATION
    SOCKET PRESERVATION REDUCES BONE LOSS AFTER TOOTH EXTRACTION
  • 7.3 RIDGE AUGMENTATION
    RIDGE AUGMENTATION RECREATES NATURAL CONTOUR OF GUMS AND JAW
  • 7.4 PERIODONTAL DEFECT REGENERATION
    CHANGES IN LIFESTYLE AND EATING HABITS TO LEAD TO USE OF DENTAL BONE GRAFT SUBSTITUTES FOR PERIODONTAL DEFECT REGENERATION
  • 7.5 IMPLANT BONE REGENERATION
    UTILIZATION OF GUIDED BONE REGENERATION MEMBRANES FACILITATES HEALING OF GRAFTED MATERIAL
  • 7.6 SINUS LIFT
    SINUS AUGMENTATION RAISES SINUS FLOOR AND DEVELOPS BONE FOR PLACEMENT OF DENTAL IMPLANTS
DENTAL BONE GRAFT SUBSTITUTES MARKET, BY END USER
92
  • 8.1 INTRODUCTION
  • 8.2 HOSPITALS
    INCREASING NUMBER OF COSMETIC DENTISTRY PROCEDURES ACROSS HOSPITALS TO DRIVE MARKET GROWTH
  • 8.3 DENTAL CLINICS
    HIGH-QUALITY SERVICES RENDERED BY DENTAL CLINICS’ STAFF TO DRIVE MARKET GROWTH
  • 8.4 OTHER END USERS
DENTAL BONE GRAFT SUBSTITUTES MARKET, BY MECHANISM
98
  • 9.1 INTRODUCTION
  • 9.2 OSTEOCONDUCTION
    OSTEOCONDUCTION SERVES AS SCAFFOLD FOR BONE CELLS TO ATTACH, MIGRATE, GROW, AND DIVIDE
  • 9.3 OSTEOINDUCTION
    OSTEOINDUCTION FACILITATES BONE HEALING PROCESS
  • 9.4 OSTEOPROMOTION
    OSTEOPROMOTION INVOLVES ENHANCEMENT OF OSTEOINDUCTION WITHOUT POSSESSION OF OSTEOINDUCTIVE PROPERTIES
  • 9.5 OSTEOGENESIS
    OSTEOGENESIS PLAYS CRUCIAL ROLE IN FACILITATING SUCCESSFUL BONE REGENERATION AND REPAIR
DENTAL BONE GRAFT SUBSTITUTES MARKET, BY PRODUCT
104
  • 10.1 INTRODUCTION
  • 10.2 BIO-OSS
    HIGH IMPLANT SURVIVAL RATES ASSOCIATED WITH BIO-OSS PRODUCTS TO DRIVE MARKET GROWTH
  • 10.3 OSTEOGRAF
    NON-POROUS AND RESORBABLE NATURE OF OSTEOGRAF TO DRIVE MARKET GROWTH
  • 10.4 GRAFTON
    INCREASED SAFETY AND LIMITED POSSIBILITY OF DISEASE TRANSMISSION TO BOOST DEMAND FOR GRAFTON
  • 10.5 OTHER PRODUCTS
DENTAL BONE GRAFT SUBSTITUTES MARKET, BY TYPE
110
  • 11.1 INTRODUCTION
  • 11.2 SYNTHETIC BONE GRAFT
    INCREASING TECHNOLOGICAL ADVANCEMENTS TO INCREASE ADOPTION OF SYNTHETIC BONE GRAFT
  • 11.3 XENOGRAFT
    TECHNOLOGICAL ADVANCEMENTS IN USE OF XENOGRAFT MATERIALS AND SCARCITY OF ALLOGRAFT MATERIALS TO DRIVE MARKET
  • 11.4 ALLOGRAFT
    INCREASED OPERATING TIMELINES AND POTENTIAL COMPLICATIONS AND MORBIDITY OF HARVEST SITE TO BOOST USE OF ALLOGRAFT
  • 11.5 AUTOGRAFT
    LITTLE SCOPE FOR DISEASE TRANSMISSION FROM GRAFT MATERIALS TO DRIVE ADOPTION OF AUTOGRAFT
  • 11.6 ALLOPLAST
    ALLOPLAST MATERIALS PROMOTE BONE HEALING THROUGH OSTEOCONDUCTION
  • 11.7 DEMINERALIZED ALLOGRAFT
    DEMINERALIZED ALLOGRAFT POSSESSES MORE OSTEOINDUCTIVE PROPERTIES THAN REGULAR ALLOGRAFT
  • 11.8 OTHER TYPES
DENTAL BONE GRAFT SUBSTITUTES MARKET, BY REGION
121
  • 12.1 INTRODUCTION
  • 12.2 NORTH AMERICA
    NORTH AMERICA: RECESSION IMPACT ANALYSIS
    US
    - Increasing patient awareness about advantages of dental bone graft substitutes over traditional treatments to boost growth
    CANADA
    - Rising geriatric population to propel market expansion
  • 12.3 EUROPE
    EUROPE: RECESSION IMPACT ANALYSIS
    GERMANY
    - Country’s robust health insurance system to drive popularity of dental bone graft substitutes
    UK
    - Preference for costly procedures due to availability of reimbursement facilities to lead to potential growth
    FRANCE
    - Rising awareness among people regarding benefits of dental bone graft substitutes and presence of major players to drive growth
    ITALY
    - Intensive R&D and use of sophisticated materials to manufacture advanced products to propel market
    SPAIN
    - Government initiatives to provide dental cover to people to boost market
    REST OF EUROPE
  • 12.4 ASIA PACIFIC
    ASIA PACIFIC: RECESSION IMPACT ANALYSIS
    JAPAN
    - Increasing awareness, availability of reimbursement, and growing income levels to offer growth opportunities for market players
    CHINA
    - Growing geriatric population, economic boom, and increasing per capita income to propel growth
    INDIA
    - Diverse, lucrative opportunities offered to dental product and service providers to ensure adequate market progress
    AUSTRALIA
    - Popularity of xenograft and allograft to open new opportunities for growth of market players
    SOUTH KOREA
    - Rising geriatric population and medical tourism to drive market
    REST OF ASIA PACIFIC
  • 12.5 LATIN AMERICA
    LATIN AMERICA: RECESSION IMPACT ANALYSIS
    BRAZIL
    - Improving healthcare infrastructure and rising investments by leading players to spur demand
    MEXICO
    - Rising medical tourism to support market growth
    ARGENTINA
    - Growing demand for personalized dentistry to spur market demand
    REST OF LATIN AMERICA
  • 12.6 MIDDLE EAST & AFRICA
    GROWING INVESTMENTS IN DIGITAL HEALTHCARE INDUSTRY TO BOOST DEMAND FOR DENTAL BONE GRAFT SUBSTITUTES
    MIDDLE EAST & AFRICA: RECESSION IMPACT ANALYSIS
  • 12.7 GCC COUNTRIES
    INCREASING DEMAND FOR HEALTH SERVICES DUE TO POPULATION GROWTH TO DRIVE MARKET FOR DENTAL BONE GRAFT SUBSTITUTES
    GCC COUNTRIES: RECESSION IMPACT ANALYSIS
COMPETITIVE LANDSCAPE
194
  • 13.1 INTRODUCTION
  • 13.2 KEY MARKET DEVELOPMENTS
  • 13.3 KEY PLAYERS’ STRATEGIES
  • 13.4 REVENUE ANALYSIS OF KEY MARKET PLAYERS
  • 13.5 MARKET SHARE ANALYSIS
  • 13.6 COMPETITIVE SITUATION AND TRENDS
    PRODUCT LAUNCHES & APPROVALS
    DEALS
    EXPANSIONS
  • 13.7 COMPANY EVALUATION MATRIX: KEY PLAYERS
    STARS
    EMERGING LEADERS
    PERVASIVE PLAYERS
    EMERGING PLAYERS
    FOOTPRINT ANALYSIS
  • 13.8 COMPANY EVALUATION MATRIX: START-UPS/SMES
    PROGRESSIVE COMPANIES
    STARTING BLOCKS
    RESPONSIVE COMPANIES
    DYNAMIC COMPANIES
    COMPETITIVE BENCHMARKING
  • 13.9 BRAND/PRODUCT COMPARATIVE ANALYSIS
  • 13.10 R&D EXPENDITURE OF KEY PLAYERS
  • 13.11 INVESTMENT LANDSCAPE
  • 13.12 VALUATION AND FINANCIAL MATRICES OF DENTAL BONE GRAFT SUBSTITUTES MARKET
COMPANY PROFILES
215
  • 14.1 KEY PLAYERS
    DENTSPLY SIRONA INC.
    - Business overview
    - Products/Services/Solutions offered
    - Recent developments
    - MnM view
    ENVISTA HOLDINGS CORPORATION
    - Business overview
    - Products/Services/Solutions offered
    - Recent developments
    - MnM view
    JOHNSON & JOHNSON
    - Business overview
    - Products/Services/Solutions offered
    - Recent developments
    - MnM view
    INSTITUT STRAUMANN AG
    - Business overview
    - Products/Services/Solutions offered
    - Recent developments
    - MnM view
    MEDTRONIC, PLC
    - Business overview
    - Products/Services/Solutions offered
    - Recent developments
    ZIMVIE INC.
    - Business overview
    - Products/Services/Solutions offered
    - Recent developments
    HENRY SCHEIN, INC.
    - Business overview
    - Products/Services/Solutions offered
    - Recent developments
    - MnM view
    RTI SURGICAL
    - Business overview
    - Products/Services/Solutions offered
    - Recent developments
    LIFENET HEALTH
    - Business overview
    - Products/Services/Solutions offered
    DENTIUM CO., LTD.
    - Business overview
    - Products/Services/Solutions offered
    GEISTLICH PHARMA AG
    - Business overview
    - Products/Services/Solutions offered
    STRYKER CORPORATION
    - Business overview
    - Products/Services/Solutions offered
    - Recent developments
    INTEGRA LIFESCIENCES HOLDINGS CORPORATION
    - Business overview
    - Products/Services/Solutions offered
    - Recent developments
    TISSUE REGENIX GROUP PLC
    - Business overview
    - Products/Services/Solutions offered
    - Recent developments
    KURARAY CO., LTD.
    - Business overview
    - Products/Services/Solutions offered
    - Recent developments
    BEGO GMBH & CO. KG
    - Business overview
    - Products/Services/Solutions offered
    - Recent developments
    YOUNG INNOVATIONS
    - Business overview
    - Products/Services/Solutions offered
    - Recent developments
    KEYSTONE DENTAL
    - Business overview
    - Products/Services/Solutions offered
    - Recent developments
  • 14.2 OTHER PLAYERS
    NOVABONE
    BOTISS BIOMATERIALS GMBH
    REGENITY
    OSTEOGENICS BIOMEDICAL
    HANNOX INTERNATIONAL CORP.
    MEYER-HAAKE GMBH
    AROA BIOSURGERY LTD.
APPENDIX
266
  • 15.1 DISCUSSION GUIDE
  • 15.2 KNOWLEDGESTORE: MARKETSANDMARKETS’ SUBSCRIPTION PORTAL
  • 15.3 CUSTOMIZATION OPTIONS
  • 15.4 RELATED REPORTS
  • 15.5 AUTHOR DETAILS
LIST OF TABLES
 
  • TABLE 1 STANDARD CURRENCY CONVERSION RATES, 2018–2022
  • TABLE 2 EXAMPLES OF RECENT DEALS BACKED BY PRIVATE EQUITY IN US, 2020–2023
  • TABLE 3 AVERAGE SELLING PRICE TREND FOR KEY TYPES OF DENTAL BONE GRAFT SUBSTITUTES, BY REGION, 2021 (USD)
  • TABLE 4 AVERAGE SELLING PRICE TREND FOR KEY TYPES OF DENTAL BONE GRAFT SUBSTITUTES, BY REGION, 2022 (USD)
  • TABLE 5 NORTH AMERICA: LIST OF REGULATORY BODIES, GOVERNMENT AGENCIES, AND OTHER ORGANIZATIONS
  • TABLE 6 EUROPE: LIST OF REGULATORY BODIES, GOVERNMENT AGENCIES, AND OTHER ORGANIZATIONS
  • TABLE 7 ASIA PACIFIC: LIST OF REGULATORY BODIES, GOVERNMENT AGENCIES, AND OTHER ORGANIZATIONS
  • TABLE 8 PORTER’S FIVE FORCES ANALYSIS
  • TABLE 9 VALUE OF INSTRUMENTS AND APPLIANCES USED IN MEDICAL, SURGICAL, DENTAL, OR VETERINARY SCIENCES EXPORTED FROM US, 2019–2022 (000’)
  • TABLE 10 DETAILED LIST OF CONFERENCES & EVENTS
  • TABLE 11 INFLUENCE OF STAKEHOLDERS ON BUYING PROCESS FOR TOP THREE APPLICATIONS
  • TABLE 12 DENTAL BONE GRAFT SUBSTITUTES MARKET, BY APPLICATION, 2022–2029 (USD MILLION)
  • TABLE 13 SOCKET PRESERVATION: DENTAL BONE GRAFT SUBSTITUTES MARKET, BY COUNTRY/REGION, 2022–2029 (USD MILLION)
  • TABLE 14 RIDGE AUGMENTATION: DENTAL BONE GRAFT SUBSTITUTES MARKET, BY COUNTRY/REGION, 2022–2029 (USD MILLION)
  • TABLE 15 PERIODONTAL DEFECT REGENERATION: DENTAL BONE GRAFT SUBSTITUTES MARKET, BY COUNTRY/REGION, 2022–2029 (USD MILLION)
  • TABLE 16 IMPLANT BONE REGENERATION: DENTAL BONE GRAFT SUBSTITUTES MARKET, BY COUNTRY/REGION, 2022–2029 (USD MILLION)
  • TABLE 17 SINUS LIFT: DENTAL BONE GRAFT SUBSTITUTES MARKET, BY COUNTRY/REGION, 2022–2029 (USD MILLION)
  • TABLE 18 DENTAL BONE GRAFT SUBSTITUTES MARKET, BY END USER, 2022–2029 (USD MILLION)
  • TABLE 19 HOSPITALS: DENTAL BONE GRAFT SUBSTITUTES MARKET, BY COUNTRY/REGION, 2022–2029 (USD MILLION)
  • TABLE 20 NUMBER OF DENTAL CLINICS, BY COUNTRY, 2020 VS. 2022
  • TABLE 21 DENTAL CLINICS: DENTAL BONE GRAFT SUBSTITUTES MARKET, BY COUNTRY/REGION, 2022–2029 (USD MILLION)
  • TABLE 22 OTHER END USERS: DENTAL BONE GRAFT SUBSTITUTES MARKET, BY COUNTRY/REGION, 2022–2029 (USD MILLION)
  • TABLE 23 DENTAL BONE GRAFT SUBSTITUTES MARKET, BY MECHANISM, 2022–2029 (USD MILLION)
  • TABLE 24 OSTEOCONDUCTION: DENTAL BONE GRAFT SUBSTITUTES MARKET, BY COUNTRY/REGION, 2022–2029 (USD MILLION)
  • TABLE 25 OSTEOINDUCTION: DENTAL BONE GRAFT SUBSTITUTES MARKET, BY COUNTRY/REGION, 2022–2029 (USD MILLION)
  • TABLE 26 OSTEOPROMOTION: DENTAL BONE GRAFT SUBSTITUTES MARKET, BY COUNTRY/REGION, 2022–2029 (USD MILLION)
  • TABLE 27 OSTEOGENESIS: DENTAL BONE GRAFT SUBSTITUTES MARKET, BY COUNTRY/REGION, 2022–2029 (USD MILLION)
  • TABLE 28 DENTAL BONE GRAFT SUBSTITUTES MARKET, BY PRODUCT, 2022–2029 (USD MILLION)
  • TABLE 29 BIO-OSS: DENTAL BONE GRAFT SUBSTITUTES MARKET, BY COUNTRY/REGION, 2022–2029 (USD MILLION)
  • TABLE 30 OSTEOGRAF: DENTAL BONE GRAFT SUBSTITUTES MARKET, BY COUNTRY/REGION, 2022–2029 (USD MILLION)
  • TABLE 31 GRAFTON: DENTAL BONE GRAFT SUBSTITUTES MARKET, BY COUNTRY/REGION, 2022–2029 (USD MILLION)
  • TABLE 32 OTHER PRODUCTS: DENTAL BONE GRAFT SUBSTITUTES MARKET, BY COUNTRY/REGION, 2022–2029 (USD MILLION)
  • TABLE 33 DENTAL BONE GRAFT SUBSTITUTES MARKET, BY TYPE, 2022–2029 (USD MILLION)
  • TABLE 34 SYNTHETIC BONE GRAFT: DENTAL BONE GRAFT SUBSTITUTES MARKET, BY COUNTRY/REGION, 2022–2029 (USD MILLION)
  • TABLE 35 XENOGRAFT: DENTAL BONE GRAFT SUBSTITUTES MARKET, BY COUNTRY/REGION, 2022–2029 (USD MILLION)
  • TABLE 36 ALLOGRAFT: DENTAL BONE GRAFT SUBSTITUTES MARKET, BY COUNTRY/REGION, 2022–2029 (USD MILLION)
  • TABLE 37 AUTOGRAFT: DENTAL BONE GRAFT SUBSTITUTES MARKET, BY COUNTRY/REGION, 2022–2029 (USD MILLION)
  • TABLE 38 ALLOPLAST: DENTAL BONE GRAFT SUBSTITUTES MARKET, BY COUNTRY/REGION, 2022–2029 (USD MILLION)
  • TABLE 39 DEMINERALIZED ALLOGRAFT: DENTAL BONE GRAFT SUBSTITUTES MARKET, BY COUNTRY/REGION, 2022–2029 (USD MILLION)
  • TABLE 40 OTHER TYPES: DENTAL BONE GRAFT SUBSTITUTES MARKET, BY COUNTRY/REGION, 2022–2029 (USD MILLION)
  • TABLE 41 DENTAL BONE GRAFT SUBSTITUTES MARKET, BY COUNTRY/REGION, 2022–2029 (USD MILLION)
  • TABLE 42 US: DENTAL EXPENDITURE, 2011–2020
  • TABLE 43 NORTH AMERICA: DENTAL BONE GRAFT SUBSTITUTES MARKET, BY COUNTRY/REGION, 2022–2029 (USD MILLION)
  • TABLE 44 NORTH AMERICA: DENTAL BONE GRAFT SUBSTITUTES MARKET, BY TYPE, 2022–2029 (USD MILLION)
  • TABLE 45 NORTH AMERICA: DENTAL BONE GRAFT SUBSTITUTES MARKET, BY APPLICATION, 2022–2029 (USD MILLION)
  • TABLE 46 NORTH AMERICA: DENTAL BONE GRAFT SUBSTITUTES MARKET, BY PRODUCT, 2022–2029 (USD MILLION)
  • TABLE 47 NORTH AMERICA: DENTAL BONE GRAFT SUBSTITUTES MARKET, BY MECHANISM, 2022–2029 (USD MILLION)
  • TABLE 48 NORTH AMERICA: DENTAL BONE GRAFT SUBSTITUTES MARKET, BY END USER, 2022–2029 (USD MILLION)
  • TABLE 49 US: MACROECONOMIC INDICATORS
  • TABLE 50 US: DENTAL BONE GRAFT SUBSTITUTES MARKET, BY TYPE, 2022–2029 (USD MILLION)
  • TABLE 51 US: DENTAL BONE GRAFT SUBSTITUTES MARKET, BY APPLICATION, 2022–2029 (USD MILLION)
  • TABLE 52 US: DENTAL BONE GRAFT SUBSTITUTES MARKET, BY PRODUCT, 2022–2029 (USD MILLION)
  • TABLE 53 US: DENTAL BONE GRAFT SUBSTITUTES MARKET, BY MECHANISM, 2022–2029 (USD MILLION)
  • TABLE 54 US: DENTAL BONE GRAFT SUBSTITUTES MARKET, BY END USER, 2022–2029 (USD MILLION)
  • TABLE 55 CANADA: MACROECONOMIC INDICATORS
  • TABLE 56 CANADA: DENTAL BONE GRAFT SUBSTITUTES MARKET, BY TYPE, 2022–2029 (USD MILLION)
  • TABLE 57 CANADA: DENTAL BONE GRAFT SUBSTITUTES MARKET, BY APPLICATION, 2022–2029 (USD MILLION)
  • TABLE 58 CANADA: DENTAL BONE GRAFT SUBSTITUTES MARKET, BY PRODUCT, 2022–2029 (USD MILLION)
  • TABLE 59 CANADA: DENTAL BONE GRAFT SUBSTITUTES MARKET, BY MECHANISM, 2022–2029 (USD MILLION)
  • TABLE 60 CANADA: DENTAL BONE GRAFT SUBSTITUTES MARKET, BY END USER, 2022–2029 (USD MILLION)
  • TABLE 61 EUROPE: DENTAL BONE GRAFT SUBSTITUTES MARKET, BY COUNTRY/REGION, 2022–2029 (USD MILLION)
  • TABLE 62 EUROPE: DENTAL BONE GRAFT SUBSTITUTES MARKET, BY TYPE, 2022–2029 (USD MILLION)
  • TABLE 63 EUROPE: DENTAL BONE GRAFT SUBSTITUTES MARKET, BY APPLICATION, 2022–2029 (USD MILLION)
  • TABLE 64 EUROPE: DENTAL BONE GRAFT SUBSTITUTES MARKET, BY PRODUCT, 2022–2029 (USD MILLION)
  • TABLE 65 EUROPE: DENTAL BONE GRAFT SUBSTITUTES MARKET, BY MECHANISM, 2022–2029 (USD MILLION)
  • TABLE 66 EUROPE: DENTAL BONE GRAFT SUBSTITUTES MARKET, BY END USER, 2022–2029 (USD MILLION)
  • TABLE 67 GERMANY: MACROECONOMIC INDICATORS
  • TABLE 68 GERMANY: DENTAL BONE GRAFT SUBSTITUTES MARKET, BY TYPE, 2022–2029 (USD MILLION)
  • TABLE 69 GERMANY: DENTAL BONE GRAFT SUBSTITUTES MARKET, BY APPLICATION, 2022–2029 (USD MILLION)
  • TABLE 70 GERMANY: DENTAL BONE GRAFT SUBSTITUTES MARKET, BY PRODUCT, 2022–2029 (USD MILLION)
  • TABLE 71 GERMANY: DENTAL BONE GRAFT SUBSTITUTES MARKET, BY MECHANISM, 2022–2029 (USD MILLION)
  • TABLE 72 GERMANY: DENTAL BONE GRAFT SUBSTITUTES MARKET, BY END USER, 2022–2029 (USD MILLION)
  • TABLE 73 UK: MACROECONOMIC INDICATORS
  • TABLE 74 UK: DENTAL BONE GRAFT SUBSTITUTES MARKET, BY TYPE, 2022–2029 (USD MILLION)
  • TABLE 75 UK: DENTAL BONE GRAFT SUBSTITUTES MARKET, BY APPLICATION, 2022–2029 (USD MILLION)
  • TABLE 76 UK: DENTAL BONE GRAFT SUBSTITUTES MARKET, BY PRODUCT, 2022–2029 (USD MILLION)
  • TABLE 77 UK: DENTAL BONE GRAFT SUBSTITUTES MARKET, BY MECHANISM, 2022–2029 (USD MILLION)
  • TABLE 78 UK: DENTAL BONE GRAFT SUBSTITUTES MARKET, BY END USER, 2022–2029 (USD MILLION)
  • TABLE 79 FRANCE: MACROECONOMIC INDICATORS
  • TABLE 80 FRANCE: DENTAL BONE GRAFT SUBSTITUTES MARKET, BY TYPE, 2022–2029 (USD MILLION)
  • TABLE 81 FRANCE: DENTAL BONE GRAFT SUBSTITUTES MARKET, BY APPLICATION, 2022–2029 (USD MILLION)
  • TABLE 82 FRANCE: DENTAL BONE GRAFT SUBSTITUTES MARKET, BY PRODUCT, 2022–2029 (USD MILLION)
  • TABLE 83 FRANCE: DENTAL BONE GRAFT SUBSTITUTES MARKET, BY MECHANISM, 2022–2029 (USD MILLION)
  • TABLE 84 FRANCE: DENTAL BONE GRAFT SUBSTITUTES MARKET, BY END USER, 2022–2029 (USD MILLION)
  • TABLE 85 ITALY: DENTAL BONE GRAFT SUBSTITUTES MARKET, BY TYPE, 2022–2029 (USD MILLION)
  • TABLE 86 ITALY: DENTAL BONE GRAFT SUBSTITUTES MARKET, BY APPLICATION, 2022–2029 (USD MILLION)
  • TABLE 87 ITALY: DENTAL BONE GRAFT SUBSTITUTES MARKET, BY PRODUCT, 2022–2029 (USD MILLION)
  • TABLE 88 ITALY: DENTAL BONE GRAFT SUBSTITUTES MARKET, BY MECHANISM, 2022–2029 (USD MILLION)
  • TABLE 89 ITALY: DENTAL BONE GRAFT SUBSTITUTES MARKET, BY END USER, 2022–2029 (USD MILLION)
  • TABLE 90 SPAIN: MACROECONOMIC INDICATORS
  • TABLE 91 SPAIN: DENTAL BONE GRAFT SUBSTITUTES MARKET, BY TYPE, 2022–2029 (USD MILLION)
  • TABLE 92 SPAIN: DENTAL BONE GRAFT SUBSTITUTES MARKET, BY APPLICATION, 2022–2029 (USD MILLION)
  • TABLE 93 SPAIN: DENTAL BONE GRAFT SUBSTITUTES MARKET, BY PRODUCT, 2022–2029 (USD MILLION)
  • TABLE 94 SPAIN: DENTAL BONE GRAFT SUBSTITUTES MARKET, BY MECHANISM, 2022–2029 (USD MILLION)
  • TABLE 95 SPAIN: DENTAL BONE GRAFT SUBSTITUTES MARKET, BY END USER, 2022–2029 (USD MILLION)
  • TABLE 96 REST OF EUROPE: DENTAL BONE GRAFT SUBSTITUTES MARKET, BY TYPE, 2022–2029 (USD MILLION)
  • TABLE 97 REST OF EUROPE: DENTAL BONE GRAFT SUBSTITUTES MARKET, BY APPLICATION, 2022–2029 (USD MILLION)
  • TABLE 98 REST OF EUROPE: DENTAL BONE GRAFT SUBSTITUTES MARKET, BY PRODUCT, 2022–2029 (USD MILLION)
  • TABLE 99 REST OF EUROPE: DENTAL BONE GRAFT SUBSTITUTES MARKET, BY MECHANISM, 2022–2029 (USD MILLION)
  • TABLE 100 REST OF EUROPE: DENTAL BONE GRAFT SUBSTITUTES MARKET, BY END USER, 2022–2029 (USD MILLION)
  • TABLE 101 DENTAL IMPLANTS PER 10,000 PEOPLE AND AVERAGE NUMBER OF IMPLANTS PLACED PER DENTIST, 2020
  • TABLE 102 ASIA PACIFIC: DENTAL BONE GRAFT SUBSTITUTES MARKET, BY COUNTRY/REGION, 2022–2029 (USD MILLION)
  • TABLE 103 ASIA PACIFIC: DENTAL BONE GRAFT SUBSTITUTES MARKET, BY TYPE, 2022–2029 (USD MILLION)
  • TABLE 104 ASIA PACIFIC: DENTAL BONE GRAFT SUBSTITUTES MARKET, BY APPLICATION, 2022–2029 (USD MILLION)
  • TABLE 105 ASIA PACIFIC: DENTAL BONE GRAFT SUBSTITUTES MARKET, BY PRODUCT, 2022–2029 (USD MILLION)
  • TABLE 106 ASIA PACIFIC: DENTAL BONE GRAFT SUBSTITUTES MARKET, BY MECHANISM, 2022–2029 (USD MILLION)
  • TABLE 107 ASIA PACIFIC: DENTAL BONE GRAFT SUBSTITUTES MARKET, BY END USER, 2022–2029 (USD MILLION)
  • TABLE 108 JAPAN: MACROECONOMIC INDICATORS
  • TABLE 109 JAPAN: DENTAL BONE GRAFT SUBSTITUTES MARKET, BY TYPE, 2022–2029 (USD MILLION)
  • TABLE 110 JAPAN: DENTAL BONE GRAFT SUBSTITUTES MARKET, BY APPLICATION, 2022–2029 (USD MILLION)
  • TABLE 111 JAPAN: DENTAL BONE GRAFT SUBSTITUTES MARKET, BY PRODUCT, 2022–2029 (USD MILLION)
  • TABLE 112 JAPAN: DENTAL BONE GRAFT SUBSTITUTES MARKET, BY MECHANISM, 2022–2029 (USD MILLION)
  • TABLE 113 JAPAN: DENTAL BONE GRAFT SUBSTITUTES MARKET, BY END USER, 2022–2029 (USD MILLION
  • TABLE 114 CHINA: MACROECONOMIC INDICATORS
  • TABLE 115 CHINA: DENTAL BONE GRAFT SUBSTITUTES MARKET, BY TYPE, 2022–2029 (USD MILLION)
  • TABLE 116 CHINA: DENTAL BONE GRAFT SUBSTITUTES MARKET, BY APPLICATION, 2022–2029 (USD MILLION)
  • TABLE 117 CHINA: DENTAL BONE GRAFT SUBSTITUTES MARKET, BY PRODUCT, 2022–2029 (USD MILLION)
  • TABLE 118 CHINA: DENTAL BONE GRAFT SUBSTITUTES MARKET, BY MECHANISM, 2022–2029 (USD MILLION)
  • TABLE 119 CHINA: DENTAL BONE GRAFT SUBSTITUTES MARKET, BY END USER, 2022–2029 (USD MILLION
  • TABLE 120 INDIA: MACROECONOMIC INDICATORS
  • TABLE 121 INDIA: DENTAL BONE GRAFT SUBSTITUTES MARKET, BY TYPE, 2022–2029 (USD MILLION)
  • TABLE 122 INDIA: DENTAL BONE GRAFT SUBSTITUTES MARKET, BY APPLICATION, 2022–2029 (USD MILLION)
  • TABLE 123 INDIA: DENTAL BONE GRAFT SUBSTITUTES MARKET, BY PRODUCT, 2022–2029 (USD MILLION)
  • TABLE 124 INDIA: DENTAL BONE GRAFT SUBSTITUTES MARKET, BY MECHANISM, 2022–2029 (USD MILLION)
  • TABLE 125 INDIA: DENTAL BONE GRAFT SUBSTITUTES MARKET, BY END USER, 2022–2029 (USD MILLION
  • TABLE 126 AUSTRALIA: ORAL HEALTH STATUS OF CHILDREN AND ADULTS
  • TABLE 127 AUSTRALIA: DENTAL BONE GRAFT SUBSTITUTES MARKET, BY TYPE, 2022–2029 (USD MILLION)
  • TABLE 128 AUSTRALIA: DENTAL BONE GRAFT SUBSTITUTES MARKET, BY APPLICATION, 2022–2029 (USD MILLION)
  • TABLE 129 AUSTRALIA: DENTAL BONE GRAFT SUBSTITUTES MARKET, BY PRODUCT, 2022–2029 (USD MILLION)
  • TABLE 130 AUSTRALIA: DENTAL BONE GRAFT SUBSTITUTES MARKET, BY MECHANISM, 2022–2029 (USD MILLION)
  • TABLE 131 AUSTRALIA: DENTAL BONE GRAFT SUBSTITUTES MARKET, BY END USER, 2022–2029 (USD MILLION)
  • TABLE 132 NUMBER OF FOREIGN PATIENTS VISITING DENTAL FACILITIES IN SOUTH KOREA
  • TABLE 133 SOUTH KOREA: MACROECONOMIC INDICATORS
  • TABLE 134 SOUTH KOREA: DENTAL BONE GRAFT SUBSTITUTES MARKET, BY TYPE, 2022–2029 (USD MILLION)
  • TABLE 135 SOUTH KOREA: DENTAL BONE GRAFT SUBSTITUTES MARKET, BY APPLICATION, 2022–2029 (USD MILLION)
  • TABLE 136 SOUTH KOREA: DENTAL BONE GRAFT SUBSTITUTES MARKET, BY PRODUCT, 2022–2029 (USD MILLION)
  • TABLE 137 SOUTH KOREA: DENTAL BONE GRAFT SUBSTITUTES MARKET, BY MECHANISM, 2022–2029 (USD MILLION)
  • TABLE 138 SOUTH KOREA: DENTAL BONE GRAFT SUBSTITUTES MARKET, BY END USER, 2022–2029 (USD MILLION
  • TABLE 139 REST OF ASIA PACIFIC: DENTAL BONE GRAFT SUBSTITUTES MARKET, BY TYPE, 2022–2029 (USD MILLION)
  • TABLE 140 REST OF ASIA PACIFIC: DENTAL BONE GRAFT SUBSTITUTES MARKET, BY APPLICATION, 2022–2029 (USD MILLION)
  • TABLE 141 REST OF ASIA PACIFIC: DENTAL BONE GRAFT SUBSTITUTES MARKET, BY PRODUCT, 2022–2029 (USD MILLION)
  • TABLE 142 REST OF ASIA PACIFIC: DENTAL BONE GRAFT SUBSTITUTES MARKET, BY MECHANISM, 2022–2029 (USD MILLION)
  • TABLE 143 REST OF ASIA PACIFIC: DENTAL BONE GRAFT SUBSTITUTES MARKET, BY END USER, 2022–2029 (USD MILLION
  • TABLE 144 LATIN AMERICA: DENTAL BONE GRAFT SUBSTITUTES MARKET, BY COUNTRY/REGION, 2022–2029 (USD MILLION)
  • TABLE 145 LATIN AMERICA: DENTAL BONE GRAFT SUBSTITUTES MARKET, BY TYPE, 2022–2029 (USD MILLION)
  • TABLE 146 LATIN AMERICA: DENTAL BONE GRAFT SUBSTITUTES MARKET, BY APPLICATION, 2022–2029 (USD MILLION)
  • TABLE 147 LATIN AMERICA: DENTAL BONE GRAFT SUBSTITUTES MARKET, BY PRODUCT, 2022–2029 (USD MILLION)
  • TABLE 148 LATIN AMERICA: DENTAL BONE GRAFT SUBSTITUTES MARKET, BY MECHANISM, 2022–2029 (USD MILLION)
  • TABLE 149 LATIN AMERICA: DENTAL BONE GRAFT SUBSTITUTES MARKET, BY END USER, 2022–2029 (USD MILLION)
  • TABLE 150 BRAZIL: MACROECONOMIC INDICATORS
  • TABLE 151 BRAZIL: DENTAL BONE GRAFT SUBSTITUTES MARKET, BY TYPE, 2022–2029 (USD MILLION)
  • TABLE 152 BRAZIL: DENTAL BONE GRAFT SUBSTITUTES MARKET, BY APPLICATION, 2022–2029 (USD MILLION)
  • TABLE 153 BRAZIL: DENTAL BONE GRAFT SUBSTITUTES MARKET, BY PRODUCT, 2022–2029 (USD MILLION)
  • TABLE 154 BRAZIL: DENTAL BONE GRAFT SUBSTITUTES MARKET, BY MECHANISM, 2022–2029 (USD MILLION)
  • TABLE 155 BRAZIL: DENTAL BONE GRAFT SUBSTITUTES MARKET, BY END USER, 2022–2029 (USD MILLION)
  • TABLE 156 MEXICO: MACROECONOMIC INDICATORS
  • TABLE 157 MEXICO: DENTAL BONE GRAFT SUBSTITUTES MARKET, BY TYPE, 2022–2029 (USD MILLION)
  • TABLE 158 MEXICO: DENTAL BONE GRAFT SUBSTITUTES MARKET, BY APPLICATION, 2022–2029 (USD MILLION)
  • TABLE 159 MEXICO: DENTAL BONE GRAFT SUBSTITUTES MARKET, BY PRODUCT, 2022–2029 (USD MILLION)
  • TABLE 160 MEXICO: DENTAL BONE GRAFT SUBSTITUTES MARKET, BY MECHANISM, 2022–2029 (USD MILLION)
  • TABLE 161 MEXICO: DENTAL BONE GRAFT SUBSTITUTES MARKET, BY END USER, 2022–2029 (USD MILLION)
  • TABLE 162 ARGENTINA: MACROECONOMIC INDICATORS
  • TABLE 163 ARGENTINA: DENTAL BONE GRAFT SUBSTITUTES MARKET, BY TYPE, 2022–2029 (USD MILLION)
  • TABLE 164 ARGENTINA: DENTAL BONE GRAFT SUBSTITUTES MARKET, BY APPLICATION, 2022–2029 (USD MILLION)
  • TABLE 165 ARGENTINA: DENTAL BONE GRAFT SUBSTITUTES MARKET, BY PRODUCT, 2022–2029 (USD MILLION)
  • TABLE 166 ARGENTINA: DENTAL BONE GRAFT SUBSTITUTES MARKET, BY MECHANISM, 2022–2029 (USD MILLION)
  • TABLE 167 ARGENTINA: DENTAL BONE GRAFT SUBSTITUTES MARKET, BY END USER, 2022–2029 (USD MILLION)
  • TABLE 168 REST OF LATIN AMERICA: DENTAL BONE GRAFT SUBSTITUTES MARKET, BY TYPE, 2022–2029 (USD MILLION)
  • TABLE 169 REST OF LATIN AMERICA: DENTAL BONE GRAFT SUBSTITUTES MARKET, BY APPLICATION, 2022–2029 (USD MILLION)
  • TABLE 170 REST OF LATIN AMERICA: DENTAL BONE GRAFT SUBSTITUTES MARKET, BY PRODUCT, 2022–2029 (USD MILLION)
  • TABLE 171 REST OF LATIN AMERICA: DENTAL BONE GRAFT SUBSTITUTES MARKET, BY MECHANISM, 2022–2029 (USD MILLION)
  • TABLE 172 REST OF LATIN AMERICA: DENTAL BONE GRAFT SUBSTITUTES MARKET, BY END USER, 2022–2029 (USD MILLION)
  • TABLE 173 MIDDLE EAST & AFRICA: DENTAL BONE GRAFT SUBSTITUTES MARKET, BY TYPE, 2022–2029 (USD MILLION)
  • TABLE 174 MIDDLE EAST & AFRICA: DENTAL BONE GRAFT SUBSTITUTES MARKET, BY APPLICATION, 2022–2029 (USD MILLION)
  • TABLE 175 MIDDLE EAST & AFRICA: DENTAL BONE GRAFT SUBSTITUTES MARKET, BY PRODUCT, 2022–2029 (USD MILLION)
  • TABLE 176 MIDDLE EAST & AFRICA: DENTAL BONE GRAFT SUBSTITUTES MARKET, BY MECHANISM, 2022–2029 (USD MILLION)
  • TABLE 177 MIDDLE EAST & AFRICA: DENTAL BONE GRAFT SUBSTITUTES MARKET, BY END USER, 2022–2029 (USD MILLION)
  • TABLE 178 GCC COUNTRIES: DENTAL BONE GRAFT SUBSTITUTES MARKET, BY TYPE, 2022–2029 (USD MILLION)
  • TABLE 179 GCC COUNTRIES: DENTAL BONE GRAFT SUBSTITUTES MARKET, BY APPLICATION, 2022–2029 (USD MILLION)
  • TABLE 180 GCC COUNTRIES: DENTAL BONE GRAFT SUBSTITUTES MARKET, BY PRODUCT, 2022–2029 (USD MILLION)
  • TABLE 181 GCC COUNTRIES: DENTAL BONE GRAFT SUBSTITUTES MARKET, BY MECHANISM, 2022–2029 (USD MILLION)
  • TABLE 182 GCC COUNTRIES: DENTAL BONE GRAFT SUBSTITUTES MARKET, BY END USER, 2022–2029 (USD MILLION)
  • TABLE 183 DENTAL BONE GRAFT SUBSTITUTES MARKET: DEGREE OF COMPETITION
  • TABLE 184 DENTAL BONE GRAFT SUBSTITUTES MARKET: PRODUCT LAUNCHES & APPROVALS, MAY 2020–DECEMBER 2021
  • TABLE 185 DENTAL BONE GRAFT SUBSTITUTES MARKET: DEALS, DECEMBER 2022–JANUARY 2024
  • TABLE 186 DENTAL BONE GRAFT SUBSTITUTES MARKET: EXPANSIONS, APRIL 2021
  • TABLE 187 COMPANY PRODUCT FOOTPRINT
  • TABLE 188 COMPANY APPLICATION FOOTPRINT
  • TABLE 189 COMPANY MECHANISM FOOTPRINT
  • TABLE 190 COMPANY END USER FOOTPRINT
  • TABLE 191 COMPANY REGIONAL FOOTPRINT
  • TABLE 192 DENTAL BONE GRAFT SUBSTITUTES MARKET: DETAILED LIST OF KEY START-UPS/SMES
  • TABLE 193 DENTSPLY SIRONA INC.: BUSINESS OVERVIEW
  • TABLE 194 DENTSPLY SIRONA INC.: PRODUCTS/SERVICES/SOLUTIONS OFFERED
  • TABLE 195 DENTSPLY SIRONA INC.: DEALS
  • TABLE 196 ENVISTA HOLDINGS CORPORATION: BUSINESS OVERVIEW
  • TABLE 197 ENVISTA HOLDINGS CORPORATION: PRODUCTS/SERVICES/SOLUTIONS OFFERED
  • TABLE 198 ENVISTA HOLDINGS CORPORATION: PRODUCT LAUNCHES & APPROVALS
  • TABLE 199 ENVISTA HOLDINGS CORPORATION: DEALS
  • TABLE 200 JOHNSON & JOHNSON: BUSINESS OVERVIEW
  • TABLE 201 JOHNSON & JOHNSON: PRODUCTS/SERVICES/SOLUTIONS OFFERED
  • TABLE 202 JOHNSON & JOHNSON: DEALS
  • TABLE 203 INSTITUT STRAUMANN AG: BUSINESS OVERVIEW
  • TABLE 204 INSTITUT STRAUMANN AG: PRODUCTS/SERVICES/SOLUTIONS OFFERED
  • TABLE 205 INSTITUT STRAUMANN AG: PRODUCT LAUNCHES & APPROVALS
  • TABLE 206 INSTITUT STRAUMANN AG : DEALS
  • TABLE 207 INSTITUT STRAUMANN AG: OTHER DEVELOPMENTS
  • TABLE 208 MEDTRONIC, PLC: BUSINESS OVERVIEW
  • TABLE 209 MEDTRONIC, PLC: PRODUCTS/SERVICES/SOLUTIONS OFFERED
  • TABLE 210 MEDTRONIC PLC: DEALS
  • TABLE 211 MEDTRONIC PLC: EXPANSIONS
  • TABLE 212 ZIMVIE INC.: BUSINESS OVERVIEW
  • TABLE 213 ZIMVIE INC.: PRODUCTS/SERVICES/SOLUTIONS OFFERED
  • TABLE 214 ZIMVIE INC: DEALS
  • TABLE 215 HENRY SCHEIN, INC.: BUSINESS OVERVIEW
  • TABLE 216 HENRY SCHEIN, INC.: PRODUCTS/SERVICES/SOLUTIONS OFFERED
  • TABLE 217 HENRY SCHEIN, INC.: PRODUCT LAUNCHES & APPROVALS
  • TABLE 218 HENRY SCHEIN, INC.: DEALS
  • TABLE 219 RTI SURGICAL: PRODUCTS/SERVICES/SOLUTIONS OFFERED
  • TABLE 220 RTI SURGICAL: DEALS
  • TABLE 221 LIFENET HEALTH: PRODUCTS/SERVICES/SOLUTIONS OFFERED
  • TABLE 222 DENTIUM CO., LTD.: PRODUCTS/SERVICES/SOLUTIONS OFFERED
  • TABLE 223 GEISTLICH PHARMA AG: PRODUCTS/SERVICES/SOLUTIONS OFFERED
  • TABLE 224 STRYKER CORPORATION: BUSINESS OVERVIEW
  • TABLE 225 STRYKER CORPORATION: PRODUCTS/SERVICES/SOLUTIONS OFFERED
  • TABLE 226 STRYKER CORPORATION: DEALS
  • TABLE 227 INTEGRA LIFESCIENCES HOLDINGS CORPORATION: BUSINESS OVERVIEW
  • TABLE 228 INTEGRA LIFESCIENCES HOLDINGS CORPORATION: PRODUCTS/SERVICES/SOLUTIONS OFFERED
  • TABLE 229 INTEGRA LIFESCIENCES HOLDINGS CORPORATION: PRODUCT LAUNCHES & APPROVALS
  • TABLE 230 INTEGRA LIFESCIENCES HOLDINGS CORPORATION: DEALS
  • TABLE 231 TISSUE REGENIX GROUP PLC: BUSINESS OVERVIEW
  • TABLE 232 TISSUE REGENIX GROUP PLC: PRODUCTS/SERVICES/SOLUTIONS OFFERED
  • TABLE 233 TISSUE REGENIX GROUP PLC: PRODUCT LAUNCHES & APPROVALS
  • TABLE 234 TISSUE REGENIX GROUP PLC: DEALS
  • TABLE 235 TISSUE REGENIX GROUP PLC: OTHER DEVELOPMENTS
  • TABLE 236 KURARAY CO., LTD.: BUSINESS OVERVIEW
  • TABLE 237 KURARAY CO., LTD.: PRODUCTS/SERVICES/SOLUTIONS OFFERED
  • TABLE 238 KURARAY CO., LTD.: DEALS
  • TABLE 239 KURARAY CO., LTD.: OTHER DEVELOPMENTS
  • TABLE 240 BEGO GMBH & CO. KG: BUSINESS OVERVIEW
  • TABLE 241 BEGO GMBH & CO. KG: PRODUCTS/SERVICES/SOLUTIONS OFFERED
  • TABLE 242 BEGO GMBH & CO. KG: DEALS
  • TABLE 243 YOUNG INNOVATIONS: BUSINESS OVERVIEW
  • TABLE 244 YOUNG INNOVATIONS: PRODUCTS/SERVICES/SOLUTIONS OFFERED
  • TABLE 245 YOUNG INNOVATIONS: DEALS
  • TABLE 246 KEYSTONE DENTAL: BUSINESS OVERVIEW
  • TABLE 247 KEYSTONE DENTAL: PRODUCTS/SERVICES/SOLUTIONS OFFERED
  • TABLE 248 KEYSTONE DENTAL: DEALS
LIST OF FIGURES
 
  • FIGURE 1 RESEARCH DESIGN
  • FIGURE 2 KEY PRIMARY SOURCES
  • FIGURE 3 BREAKDOWN OF PRIMARY INTERVIEWS: SUPPLY-SIDE AND DEMAND-SIDE PARTICIPANTS
  • FIGURE 4 BREAKDOWN OF PRIMARY INTERVIEWS (SUPPLY SIDE): BY COMPANY TYPE, DESIGNATION, AND REGION
  • FIGURE 5 BREAKDOWN OF PRIMARY INTERVIEWS (DEMAND SIDE): BY END USER, DESIGNATION, AND REGION
  • FIGURE 6 SUPPLY-SIDE MARKET SIZE ESTIMATION: REVENUE SHARE ANALYSIS
  • FIGURE 7 REVENUE SHARE ANALYSIS: ILLUSTRATIVE EXAMPLE OF TISSUE REGENIX GROUP PLC
  • FIGURE 8 DENTAL BONE GRAFT SUBSTITUTES MARKET: SUPPLY-SIDE MARKET SIZE ESTIMATION
  • FIGURE 9 CAGR PROJECTIONS FROM ANALYSIS OF DRIVERS, RESTRAINTS, OPPORTUNITIES, AND CHALLENGES
  • FIGURE 10 CAGR PROJECTIONS: SUPPLY-SIDE ANALYSIS
  • FIGURE 11 TOP-DOWN APPROACH
  • FIGURE 12 DATA TRIANGULATION METHODOLOGY
  • FIGURE 13 SYNTHETIC BONE GRAFT SEGMENT TO LEAD MARKET BY 2029
  • FIGURE 14 SOCKET PRESERVATION SEGMENT TO ACCOUNT FOR LARGEST SHARE IN 2024
  • FIGURE 15 OSTEOCONDUCTION SEGMENT TO LEAD MARKET BY 2029
  • FIGURE 16 BIO-OSS SEGMENT TO GROW AT HIGHEST CAGR DURING FORECAST PERIOD
  • FIGURE 17 HOSPITALS SEGMENT TO ACCOUNT FOR LARGEST SHARE BY 2029
  • FIGURE 18 DENTAL BONE GRAFT SUBSTITUTES MARKET: REGIONAL SNAPSHOT
  • FIGURE 19 RISING TECHNOLOGICAL ADVANCEMENTS TO DRIVE GROWTH OF DENTAL BONE GRAFT SUBSTITUTES MARKET
  • FIGURE 20 HOSPITALS SEGMENT TO DOMINATE MARKET DURING FORECAST PERIOD
  • FIGURE 21 ASIA PACIFIC TO REGISTER HIGHEST CAGR DURING FORECAST PERIOD
  • FIGURE 22 NORTH AMERICA TO BE LARGEST MARKET FOR DENTAL BONE GRAFT SUBSTITUTES DURING FORECAST PERIOD
  • FIGURE 23 DEVELOPING MARKETS TO REGISTER HIGHER GROWTH DURING FORECAST PERIOD
  • FIGURE 24 DENTAL BONE GRAFT SUBSTITUTES MARKET: DRIVERS, RESTRAINTS, OPPORTUNITIES, AND CHALLENGES
  • FIGURE 25 VALUE CHAIN ANALYSIS
  • FIGURE 26 SUPPLY CHAIN ANALYSIS
  • FIGURE 27 PATENT PUBLICATION TRENDS (JANUARY 2013–SEPTEMBER 2023)
  • FIGURE 28 TOP PATENT APPLICANTS AND OWNERS (COMPANIES/INSTITUTES) FOR DENTAL BONE GRAFT SUBSTITUTES (JANUARY 2013–MARCH 2024)
  • FIGURE 29 TOP PATENT APPLICANT COUNTRIES FOR DENTAL BONE GRAFT SUBSTITUTES (JANUARY 2013–MARCH 2024)
  • FIGURE 30 INFLUENCE OF STAKEHOLDERS ON BUYING PROCESS FOR TOP THREE APPLICATIONS
  • FIGURE 31 KEY BUYING CRITERIA FOR TOP THREE APPLICATIONS
  • FIGURE 32 ECOSYSTEM/MARKET MAP
  • FIGURE 33 DENTAL BONE GRAFT SUBSTITUTES MARKET: ADJACENT MARKETS
  • FIGURE 34 TRENDS/DISRUPTIONS IMPACTING CUSTOMERS’ BUSINESSES
  • FIGURE 35 US TO DOMINATE DENTAL BONE GRAFT SUBSTITUTES MARKET DURING FORECAST PERIOD
  • FIGURE 36 NORTH AMERICA: DENTAL BONE GRAFT SUBSTITUTES MARKET SNAPSHOT
  • FIGURE 37 EUROPE: DENTAL BONE GRAFT SUBSTITUTES MARKET SNAPSHOT
  • FIGURE 38 ASIA PACIFIC: DENTAL BONE GRAFT SUBSTITUTES MARKET SNAPSHOT
  • FIGURE 39 REVENUE SHARE ANALYSIS OF KEY PLAYERS OPERATING IN DENTAL BONE GRAFT SUBSTITUTES MARKET
  • FIGURE 40 MARKET SHARE ANALYSIS, BY KEY PLAYER, 2023
  • FIGURE 41 DENTAL BONE GRAFT SUBSTITUTES MARKET: COMPANY EVALUATION MATRIX (KEY PLAYERS), 2023
  • FIGURE 42 OVERALL COMPANY FOOTPRINT
  • FIGURE 43 DENTAL BONE GRAFT SUBSTITUTES MARKET: COMPANY EVALUATION MATRIX (START-UPS/SMES), 2023
  • FIGURE 44 DENTAL BONE GRAFT SUBSTITUTES MARKET: FUNDING ANALYSIS, 2019–2023
  • FIGURE 45 MOST VALUED FIRMS IN DENTAL BONE GRAFT SUBSTITUTES MARKET, 2023 (USD BILLION)
  • FIGURE 46 DENTSPLY SIRONA INC.: COMPANY SNAPSHOT
  • FIGURE 47 ENVISTA HOLDINGS CORPORATION: COMPANY SNAPSHOT
  • FIGURE 48 JOHNSON & JOHNSON: COMPANY SNAPSHOT
  • FIGURE 49 INSTITUT STRAUMANN AG: COMPANY SNAPSHOT
  • FIGURE 50 MEDTRONIC, PLC: COMPANY SNAPSHOT
  • FIGURE 51 ZIMVIE INC.: COMPANY SNAPSHOT
  • FIGURE 52 HENRY SCHEIN, INC.: COMPANY SNAPSHOT
  • FIGURE 53 STRYKER CORPORATION: COMPANY SNAPSHOT
  • FIGURE 54 INTEGRA LIFESCIENCES HOLDINGS CORPORATION: COMPANY SNAPSHOT
  • FIGURE 55 TISSUE REGENIX GROUP PLC: COMPANY SNAPSHOT
  • FIGURE 56 KURARAY CO., LTD.: COMPANY SNAPSHOT

The study involved four major activities in estimating the current size of the dental bone graft substitute market. Exhaustive secondary research was done to collect information on the market, peer market, and parent market. The next step was to validate these findings, assumptions, and sizing with industry experts across the value chain through primary research. Both top-down and bottom-up approaches were employed to estimate the complete market size. After that, market breakdown and data triangulation were used to estimate the market size of segments and subsegments.

Secondary Research

The secondary research process involved the widespread use of secondary sources, directories, databases (such as Bloomberg Businessweek, Factiva, and D&B Hoovers), white papers, annual reports, company house documents, investor presentations, and SEC filings of companies. Secondary research was used to identify and collect information useful for the extensive, technical, market-oriented, and commercial study of the dental bone graft substitute market. It was also used to obtain important information about the key players and market classification and segmentation according to industry trends to the bottom-most level, and key developments related to market and technology perspectives. A database of the key industry leaders was also prepared using secondary research.

Primary Research

In the primary research process, various sources from both the supply and demand sides were interviewed to obtain qualitative and quantitative information for this report. The primary sources from the supply side include industry experts such as CEOs, vice presidents, marketing and sales directors, technology & innovation directors, and related key executives from various key companies and organizations operating in the dental bone graft substitute market. The primary sources from the demand side included industry experts, purchase & sales managers, doctors, and personnel from research organizations. Primary research was conducted to validate the market segmentation, identify key players in the market, and gather insights on key industry trends and key market dynamics.

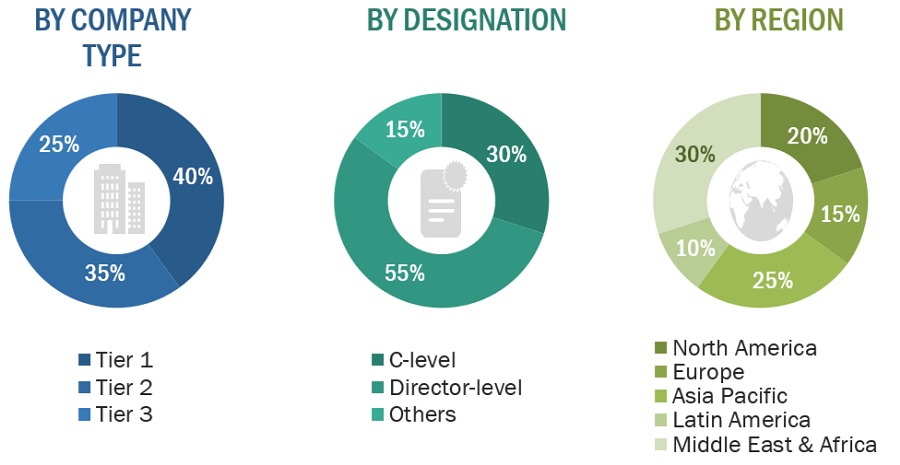
A breakdown of the primary respondents for the dental bone graft substitute market is provided below:
Dental Bone Graft Substitute Market Size, and Share

Note 1: C-level primaries include CEOs, COOs, CTOs, and VPs.

Note 2: Other primaries include Others include sales managers, marketing managers, and product managers.

Note 3: Companies are classified into tiers based on their total revenue. As of 2020: Tier 1=>USD 1 billion, Tier 2 = USD 500 million to USD 1 billion, Tier 3=<USD 500 million

To know about the assumptions considered for the study, download the pdf brochure

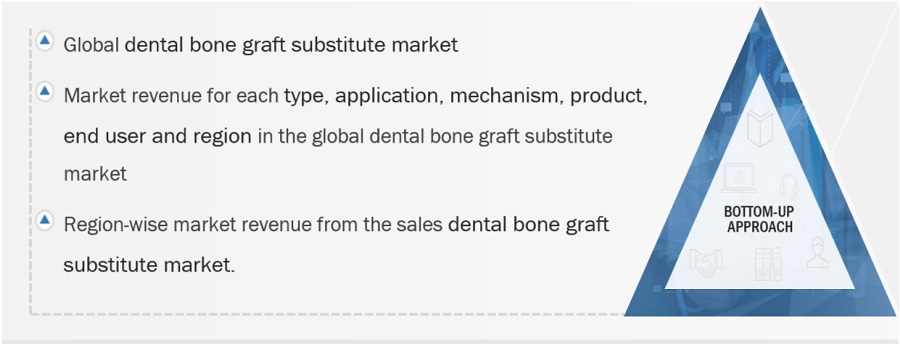
The research methodology used to estimate the size of the dental bone graft substitute market includes the following details.

The market sizing of the market was undertaken from the global side.

Country-level Analysis: The size of the dental bone graft substitute market was obtained from the annual presentations of leading players and secondary data available in the public domain. The share of products and services in the overall dental bone graft substitute market was obtained from secondary data and validated by primary participants to arrive at the total dental bone graft substitute market. Primary participants further validated the numbers.

Geographic market assessment (by region & country): The geographic assessment was done using the following approaches:

Approach 1: Geographic revenue contributions/splits of leading players in the market (wherever available) and respective growth trends

Approach 2: Geographic adoption trends for individual product segments by end users and growth prospects for each of the segments (assumptions and indicative estimates validated from primary interviews)

At each point, the assumptions and approaches were validated through industry experts contacted during primary research. Considering the limitations of data available from secondary research, revenue estimates for individual companies (for the overall dental bone graft substitute market and geographic market assessment) were ascertained based on a detailed analysis of their respective product offerings, geographic reach/strength (direct or through distributors or suppliers), and the shares of the leading players in a particular region or country.

Global Dental Bone Graft Substitute Size: Top-Down Approach
Dental Bone Graft Substitute Market Size, and Share

To know about the assumptions considered for the study, Request for Free Sample Report

Global Dental bone graft substitute Size: Bottom-Up Approach

Dental Bone Graft Substitute Market Size, and Share

Data Triangulation

After arriving at the overall market size—using the market size estimation processes explained above—the market was split into several segments and sub-segments. To complete the overall market engineering process and arrive at the exact statistics of each market segment and subsegment, data triangulation, and market breakdown procedures were employed, wherever applicable. The data was triangulated by studying various factors and trends from both the demand and supply sides.

Market Definition

A dental bone graft substitute is a biocompatible material used by dentists to rebuild or augment jawbone tissue lost due to various reasons. These substitutes act as a scaffold or supportive structure to promote the growth of new bone tissue in the jaw. They essentially fill the defect or gap where bone loss has occurred.

Key Stakeholders

  • Manufacturers and distributors of dental bone graft substitute
  • Manufacturers and distributors of dental bone graft substitute components
  • Dental bone graft substitute companies
  • Healthcare institutes
  • Diagnostic laboratories
  • Dental Hospitals and clinics
  • Academic institutes
  • Research institutes
  • Government associations
  • Market research and consulting firms
  • Venture capitalists and investors

Objectives of the Study

  • To define, describe, segment, analyze, and forecast the global dental bone graft substitute market by type, application, mechanism, product, end user and region.
  • To provide detailed information about the factors influencing the market growth (drivers, restraints, opportunities, and challenges)
  • To analyze micro markets concerning individual growth trends, prospects, and contributions to the overall market
  • To analyze market opportunities for stakeholders and provide details of the competitive landscape for key players.
  • To forecast the size of the dental bone graft substitute market in North America, Europe, Asia Pacific, Latin America, and the Middle East & Africa and GCC countries.
  • To profile the key players in the dental bone graft substitute market and comprehensively analyze their core competencies.
  • To track and analyze competitive developments such as agreements, collaborations, and partnerships; expansions; acquisitions; and product launches and approvals in the dental bone graft substitute market.
  • To analyze the impact of the recession on the dental bone graft substitute market

Available Customizations

With the given market data, MarketsandMarkets offers customizations as per the company’s specific needs. The following customization options are available for the report:

Geographic Analysis

  • Further breakdown of the Rest of Asia Pacific dental bone graft substitute market into Indonesia, Philippines, Vietnam, Hong Kong, and other countries
  • Further breakdown of the Rest of Europe dental bone graft substitute market into Belgium, Russia, the Netherlands, Switzerland, and other countries.
  • Further breakdown of the Rest of Latin America dental bone graft substitute market into Argentina, Peru, and other countries.
Custom Market Research Services

We will customize the research for you, in case the report listed above does not meet with your exact requirements. Our custom research will comprehensively cover the business information you require to help you arrive at strategic and profitable business decisions.

Request Customization

Instant Answers with GPT - Ask Now!

Ask real questions. Get complete answers !
Report Code
MD 4392
Published ON
Apr, 2024
Choose License Type
BUY NOW
  • SHARE
X
Request Customization
Speak to Analyst
Speak to Analyst
OR FACE-TO-FACE MEETING
PERSONALIZE THIS RESEARCH
  • Triangulate with your Own Data
  • Get Data as per your Format and Definition
  • Gain a Deeper Dive on a Specific Application, Geography, Customer or Competitor
  • Any level of Personalization
REQUEST A FREE CUSTOMIZATION
LET US HELP YOU!
  • What are the Known and Unknown Adjacencies Impacting the Dental Bone Graft Substitute Market
  • What will your New Revenue Sources be?
  • Who will be your Top Customer; what will make them switch?
  • Defend your Market Share or Win Competitors
  • Get a Scorecard for Target Partners
CUSTOMIZED WORKSHOP REQUEST
knowledgestore logo

Want to explore hidden markets that can drive new revenue in Dental Bone Graft Substitute Market?

Find Hidden Markets
  • Call Us
  • +1-888-600-6441 (Corporate office hours)
  • +1-888-600-6441 (US/Can toll free)
  • +44-800-368-9399 (UK office hours)
CONNECT WITH US
ABOUT TRUST ONLINE
©2024 MarketsandMarkets Research Private Ltd. All rights reserved
DMCA.com Protection Status
Website Feedback