The study involved four major activities in estimating the current size of the battery management system market. Exhaustive secondary research has been done to collect information on the market, peer market, and parent market. The next step has been to validate these findings, assumptions, and sizing with industry experts across the value chain through primary research. Both top-down and bottom-up approaches have been employed to estimate the complete market size. After that, market breakdown and data triangulation methods have been used to estimate the market size of segments and subsegments. Two sources of information—secondary and primary—have been used to identify and collect information for an extensive technical and commercial study of the battery management system (BMS) market.
Secondary Research
Secondary sources include annual reports, press releases, investor presentations of companies, white papers, certified publications, articles by recognized authors, regulatory bodies, trade directories, databases, and corporate filings such as annual reports, investor presentations, financial statements, trade, business and professional associations, white papers, manufacturing associations.
Primary Research
Primary sources are experts from the core and related industries and preferred battery management system providers, distributors, alliances, standards, and certification organizations related to various segments of this industry’s value chain.
In the primary research process, various primary sources from both supply and demand sides have been interviewed to obtain qualitative and quantitative information on the market. The primary sources from the supply side included various industry experts, such as chief experience officers (CXOs), vice presidents (VPs), and directors from business development, marketing, product development/innovation teams, and related key executives from battery management system providers, such as Renesas Electronics Corporation. (Germany), Sensata Technologies, Inc. (Japan), Eberspächer (Germany), Panasonic Holdings Corporation (Japan), and Texas Instruments Incorporated. (US); industry associations; independent consultants and importers; distributors; and key opinion leaders.
The breakdown of primary respondents has been provided in the figure below.

To know about the assumptions considered for the study, download the pdf brochure
Market Size Estimation
Both top-down and bottom-up approaches have been used to estimate and validate the total size of the battery management system market. These methods have also been used extensively to estimate the size of various subsegments in the market. The following research methodology has been used to estimate the market size:
-
Major players in the industry and markets have been identified through extensive secondary research.
-
The industry’s value chain and market size (in terms of value) have been determined through primary and secondary research processes.
-
All percentage shares, splits, and breakdowns have been determined using secondary sources and verified through primary sources.
Bottom-up Approach
The bottom-up approach has been used to arrive at the overall size of the battery management system market from the revenues of the key players and their market shares. Calculations based on revenues of key companies identified in the market led to the estimation of their overall market size.
Approaches to determining market size by bottom-up analysis
-
Identifying industries that either use or will use battery management systems.
-
Tracking leading companies and system integrators operating across various industries.
-
Deriving the size of the BMS market through the data sanity method; analyzing revenues of more than 25 key providers through their annual reports and press releases and summing them up to estimate the overall market size.
-
Conducting multiple discussions with key opinion leaders to understand the demand for battery management systems and analyzing the breakup of the scope of work carried out by each major company.
-
Carrying out the market trend analysis to obtain the CAGR of the battery management system market by understanding the product penetration rate in each industry and analyzing the demand and supply of battery management systems in different industries.
-
Assigning a percentage to the overall revenue or, in a few cases, to segmental revenues of each company to derive their revenues from the sales of battery management systems. This percentage for each company has been assigned based on their product portfolios.
-
Verifying and crosschecking estimates at every level through discussions with key opinion leaders, including CXOs, directors, operation managers, and domain experts at MarketsandMarkets.
-
Studying various paid and unpaid information sources such as annual reports, press releases, white papers, and databases.
-
Tracking ongoing and identifying upcoming battery management system projects by companies and forecasting the market size based on these developments and other critical parameters.

Top-Down Approach
In the top-down approach, the overall market size has been used to estimate the size of the individual market (mentioned in market segmentation) through percentage splits from secondary and primary research. For specific market segments, the size of the most appropriate immediate parent market has been used to implement the top-down approach. The bottom-up approach has also been implemented for data obtained from secondary research to validate the market size of various segments.
The market share for each company has been estimated to verify revenues used earlier in the bottom-up approach. With the data triangulation procedure and validation of the data through primaries, the size of the parent market and each market segment has been determined and confirmed. The data triangulation procedure used for this study has been explained in the next section.
Approach to determining market size by top-down analysis
-
MarketsandMarkets focuses on the top-line expenditures and investments made throughout the battery management system ecosystem to manufacture new batteries and retrofit the existing ones.
-
The information related to revenues generated by key manufacturers of battery management systems has been studied and analyzed.
-
Multiple on-field discussions have been carried out with key opinion leaders of leading companies involved in manufacturing battery management systems.
-
The geographical split has been estimated using secondary sources based on various factors, such as the number of players in a specific country or region and battery management systems provided by these players.

Data Triangulation
After arriving at the overall market size from the estimation process explained above, the overall market has been split into several segments and subsegments. Where applicable, the market breakdown and data triangulation procedures have been employed to complete the overall market engineering process and arrive at the exact statistics for all segments and subsegments. The data has been triangulated by studying numerous factors and trends from both the demand and supply sides. The market has also been validated using both top-down and bottom-up approaches.
Market Definition
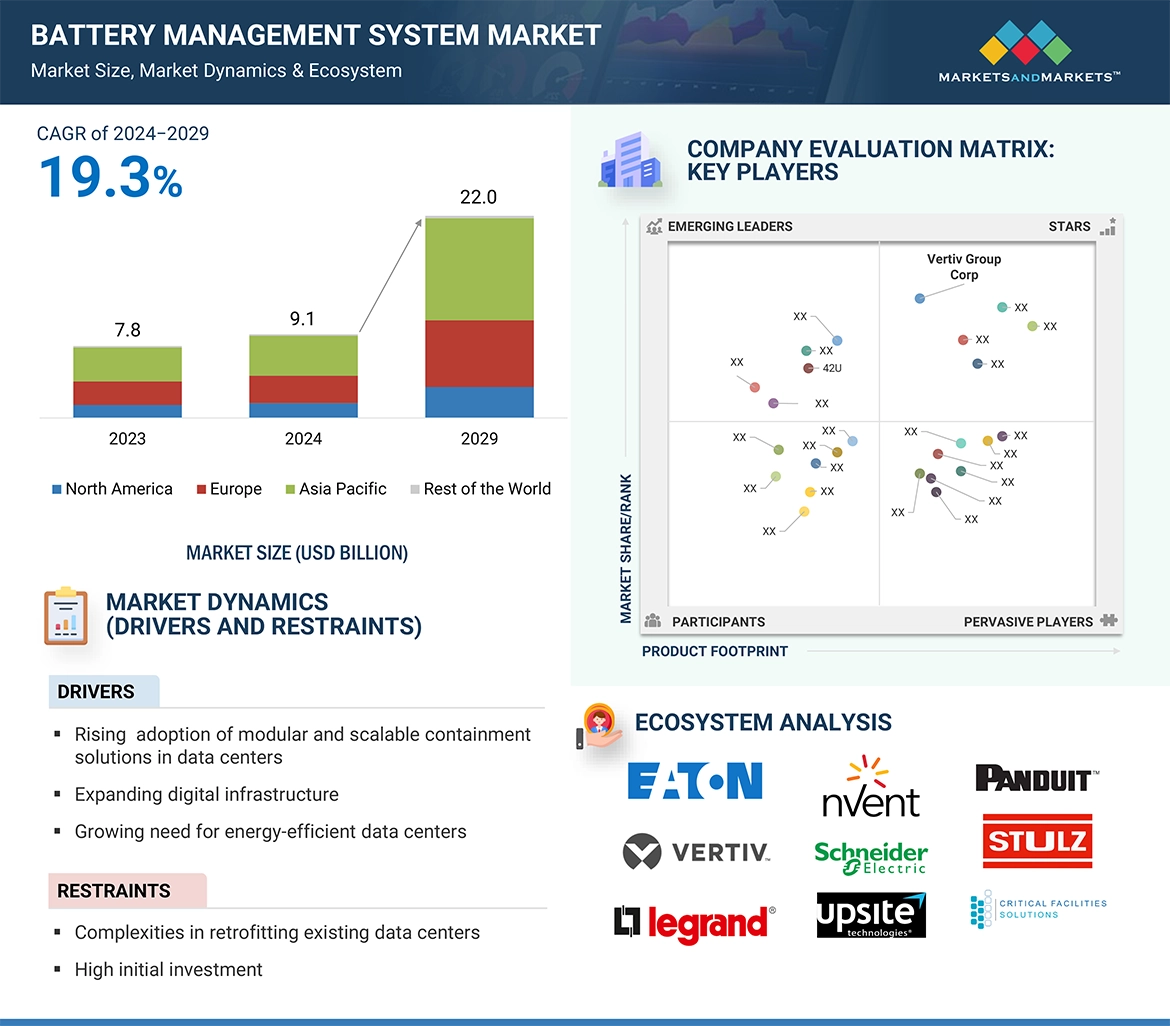
A battery management system (BMS) is an electronic device that monitors and controls the operation and functioning of a rechargeable battery. It is called the brain of the battery, as it enhances safety, performance, charging rates, and longevity by managing current, voltage, temperature, and battery capacity. Its primary functions include protection from overcharging, ensuring safe operation, cell balancing, voltage and temperature control, and determining the state of charge (SoC) and state of health (SoH) of the battery. A battery management system typically comprises hardware and software customized per applications and battery specifications.
Key Stakeholders
-
Government Bodies and Policymakers
-
Industry-standard Organizations, Forums, Alliances, and Associations
-
Market Research and Consulting Firms
-
Raw Material Suppliers and Distributors
-
Research Institutes and Organizations
-
Battery Cell and Battery Pack Manufacturers
-
Testing, Inspection, and Certification Providers
-
Distributors and Resellers
-
End Users
Report Objectives
-
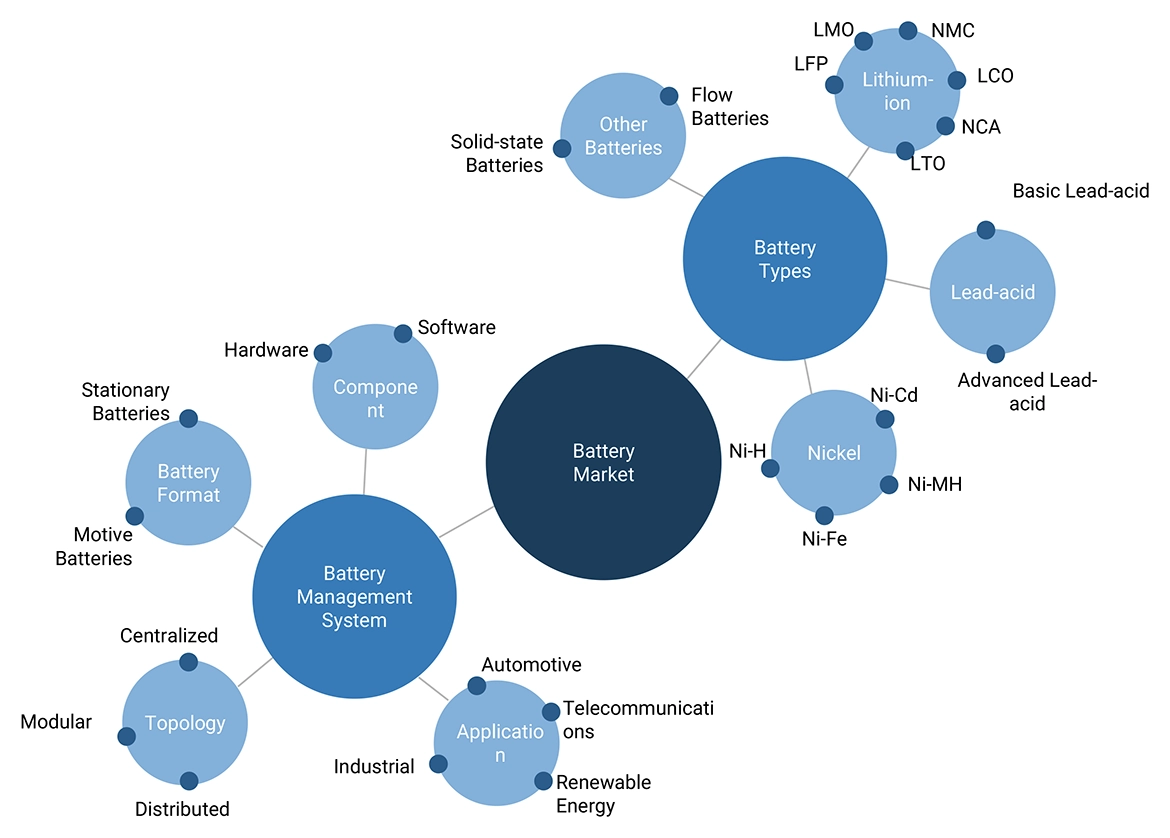
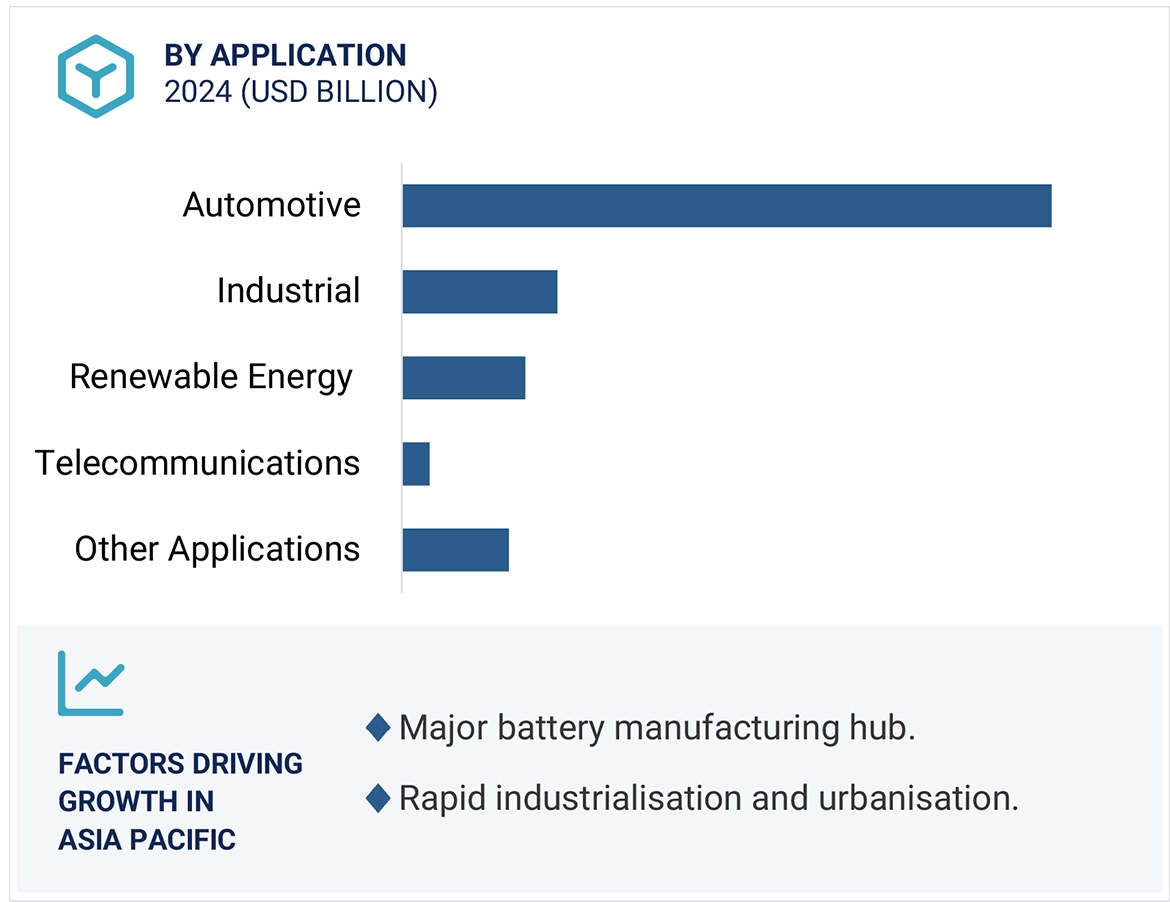
To define, describe, and forecast the battery management system market based on type, battery type, topology, and application
-
To describe and forecast the size of the BMS market based on four regions: North America, Europe, Asia Pacific, and the Rest of the World (RoW), along with their respective countries
-
To provide detailed information regarding drivers, restraints, opportunities, and challenges influencing the market growth
-
To provide a detailed overview of the process flow of the BMS market
-
To provide ecosystem analysis, case study analysis, patent analysis, technology analysis, pricing analysis, Porter’s five forces analysis, key stakeholders & buying criteria, key conferences & events, regulatory bodies, government agencies, and regulations pertaining to the market under study
-
To strategically analyze micromarkets with respect to individual growth trends, prospects, and contributions to the overall market size
-
To study the complete value chain of the battery management system market
-
To analyze opportunities for stakeholders by identifying high-growth segments of the BMS market
-
To strategically profile the key players and comprehensively analyze their market positions in terms of their ranking and core competencies
-
To analyze competitive developments, such as product launches, acquisitions, agreements, and partnerships, in the battery management system market
Available Customizations
Based on the given market data, MarketsandMarkets offers customizations in the reports according to the client’s specific requirements. The available customization options are as follows:
Company Information
-
Detailed analysis and profiling of additional market players (up to 5)


Growth opportunities and latent adjacency in Battery Management System Market