2
RESEARCH METHODOLOGY
37
5
MARKET OVERVIEW
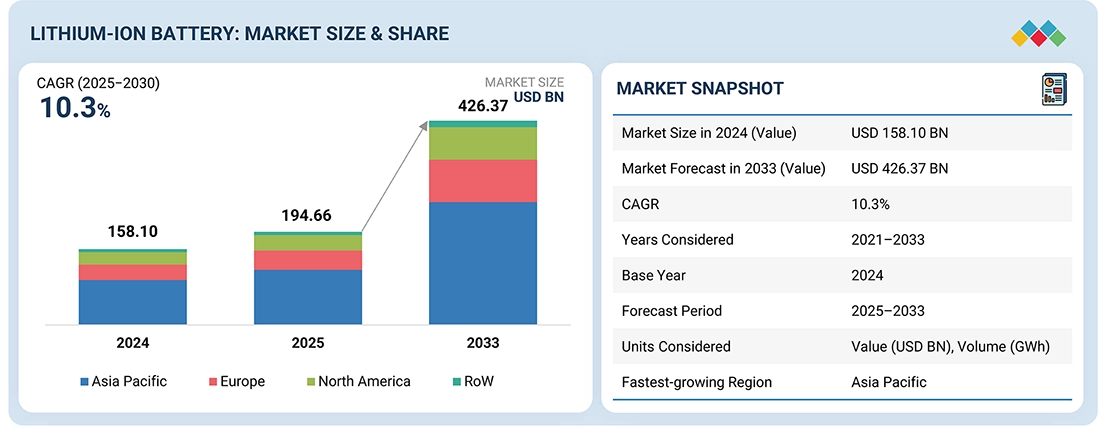
Transition to zero-emission vehicles drives lithium-ion battery innovation amid evolving market dynamics.
54
5.2.1.1
TRANSITION TO ZERO-EMISSION VEHICLES DUE TO CLEAN MOBILITY AGENDA
5.2.1.2
GROWING PREFERENCE FOR LFP BATTERIES AMONG EV MANUFACTURERS
5.2.1.3
WIDESPREAD DEPLOYMENT OF BATTERY-OPERATED MATERIAL HANDLING EQUIPMENT IN INDUSTRIAL APPLICATIONS
5.2.1.4
SURGING DEMAND FOR WEARABLE DEVICES
5.2.2.1
SAFETY CONCERNS AND HIGH RECYCLING AND DISPOSAL COSTS
5.2.3.1
NEW ERA OF RENEWABLE ENERGY CAPACITY AND STORAGE INNOVATIONS
5.2.3.2
ACCELERATED R&D EFFORTS TO DEVELOP ADVANCED LI-ION BATTERIES
5.2.3.3
ANTICIPATED DECLINE IN COSTS OF LI-ION BATTERIES
5.2.4.1
COMPETITION FROM EMERGING TECHNOLOGIES SUCH AS SODIUM-ION AND FLOW BATTERIES
5.2.4.2
INCREASED TARIFFS ON CHINESE EVS IN EUROPE AND NORTH AMERICA
5.2.4.3
TECHNICAL ISSUES AND BATTERY PERFORMANCE-RELATED CHALLENGES
5.2.4.4
FINANCIAL RISKS AND MARKET DISRUPTIONS WITNESSED BY BATTERY MANUFACTURERS
5.5.1
AVERAGE SELLING PRICE TREND OF LITHIUM-ION BATTERIES, 2021–2033
5.5.2
PRICING RANGE OF LITHIUM-ION BATTERY PACKS, BY KEY PLAYER, 2024
5.5.3
AVERAGE SELLING PRICE TREND OF LFP AND NMC BATTERIES, 2021–2024
5.5.4
AVERAGE SELLING PRICE TREND OF LITHIUM-ION BATTERIES, BY REGION, 2021–2024
5.6
KEY INSIGHTS RELATED TO LITHIUM-ION BATTERY INDUSTRY
5.6.1
TOP LITHIUM-PRODUCING COUNTRIES
5.6.2
LITHIUM-ION BATTERY MANUFACTURING CAPACITY, BY COUNTRY, 2022 VS. 2025 VS. 2030
5.6.3
LIST OF CURRENTLY OPERATIONAL AND UPCOMING GIGAFACTORIES
5.7
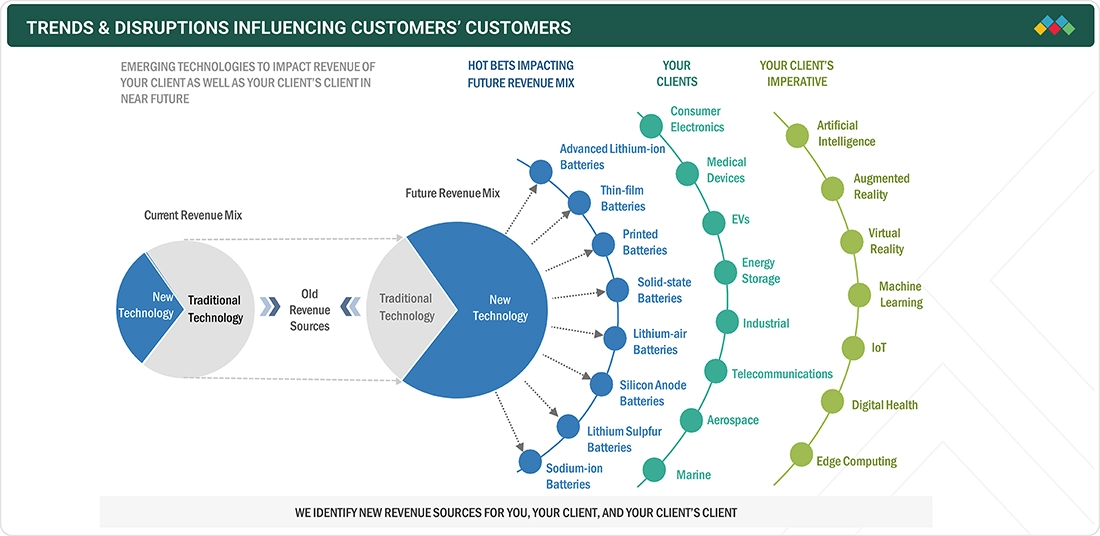
TRENDS/DISRUPTIONS IMPACTING CUSTOMER BUSINESS
5.8
INVESTMENT AND FUNDING SCENARIO
5.9.1.1
LITHIUM-SULFUR BATTERIES
5.9.1.2
LITHIUM-SILICON BATTERIES
5.9.1.3
SOLID-STATE BATTERIES
5.9.2
ADJACENT TECHNOLOGIES
5.9.2.3
SODIUM-ION BATTERIES
5.9.2.4
LIQUID-METAL BATTERIES
5.9.3
COMPLEMENTARY TECHNOLOGIES
5.9.3.1
BATTERY MANAGEMENT SYSTEMS
5.9.3.2
ENERGY MANAGEMENT SYSTEM
5.10
PORTER’S FIVE FORCES ANALYSIS
5.10.1
BARGAINING POWER OF SUPPLIERS
5.10.2
BARGAINING POWER OF BUYERS
5.10.3
THREAT OF NEW ENTRANTS
5.10.4
THREAT OF SUBSTITUTES
5.10.5
INTENSITY OF COMPETITIVE RIVALRY
5.11
KEY STAKEHOLDERS AND BUYING CRITERIA
5.11.1
KEY STAKEHOLDERS IN BUYING PROCESS
5.12.1
TOYOTA MATERIAL HANDLING HELPS REDUCE EQUIPMENT DOWNTIME BY REPLACING LEAD-ACID BATTERIES WITH LITHIUM-ION TECHNOLOGY
5.12.2
LITHION’S LIFEPO4 U-CHARGE BATTERY MODULES ALLOW MEDICAL EQUIPMENT MANUFACTURER INCREASE EFFICIENCY AND RELIABILITY OF MEDICAL DEVICES
5.12.3
EV MANUFACTURER ACHIEVES ENHANCED SAFETY AND IMPROVED RUN TIME BY REPLACING NIMH BATTERIES WITH LITHION’S LIFEPO4 BATTERY MODULES
5.13.1
IMPORT SCENARIO (HS CODE 850650)
5.13.2
EXPORT SCENARIO (HS CODE 850650)
5.15
KEY CONFERENCES AND EVENTS, 2025–2026
5.16
REGULATORY LANDSCAPE
5.16.1
REGULATORY BODIES, GOVERNMENT AGENCIES, AND OTHER ORGANIZATIONS
5.17.2
IMPACT OF AI ON LITHIUM-ION BATTERY MARKET
5.17.3
TOP USE CASES AND MARKET POTENTIAL
5.18
IMPACT OF 2025 US TARIFF
5.18.3
PRICE IMPACT ANALYSIS
5.18.4
IMPACT ON COUNTRY/REGION
5.18.5
IMPACT ON APPLICATIONS
6
MATERIALS USED IN LITHIUM-ION BATTERIES
Explore diverse cathode and anode materials revolutionizing lithium-ion battery efficiency and performance.
109
6.2.1
CATHODE MATERIALS FOR LITHIUM-ION BATTERIES
6.2.1.1
LITHIUM IRON PHOSPHATE
6.2.1.2
LITHIUM COBALT OXIDE
6.2.1.3
LITHIUM NICKEL MANGANESE COBALT
6.2.1.4
LITHIUM NICKEL COBALT ALUMINUM OXIDE
6.2.1.5
LITHIUM MANGANESE OXIDE
6.3.1
ANODE MATERIALS FOR LITHIUM-ION BATTERIES
6.3.1.2
ARTIFICIAL GRAPHITE
6.3.1.3
OTHER ANODE MATERIALS
7
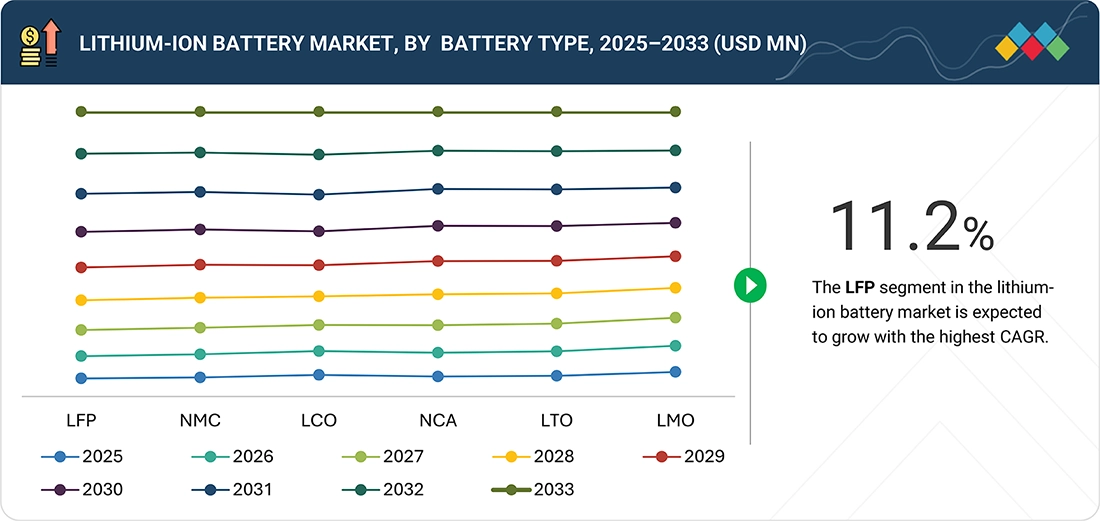
LITHIUM-ION BATTERY MARKET, BY BATTERY TYPE
Market Size & Growth Rate Forecast Analysis to 2033 in USD Billion | 27 Data Tables
114
7.2.1
LOWER SELF-HEATING RATE TO ACCELERATE ADOPTION
7.3.1
LONG LIFESPAN AND LOW MAINTENANCE REQUIREMENTS TO BOOST DEMAND
7.4.1
RISING USE IN PORTABLE ELECTRONICS TO DRIVE MARKET
7.5.1
HIGH SECURITY AND STABILITY DUE TO LOW OPERATING VOLTAGE TO BOOST DEMAND
7.6.1
ENHANCED THERMAL STABILITY AND SAFETY TO ACCELERATE ADOPTION
7.7.1
POWER AND AUTOMOTIVE INDUSTRIES TO CONTRIBUTE MOST TO MARKET GROWTH
8
LITHIUM-ION BATTERY MARKET, BY APPLICATION
Market Size & Growth Rate Forecast Analysis to 2033 in USD Billion | 100 Data Tables
130
8.2.1
GROWING ADOPTION OF ELECTRIC VEHICLES TO DRIVE MARKET
8.2.2
BY BATTERY CAPACITY
8.2.5.2
VANS/LIGHT TRUCKS
8.2.5.3
MEDIUM & HEAVY TRUCKS
8.2.5.5
OFF-HIGHWAY VEHICLES
8.3.1
GROWING IMPLEMENTATION OF LI-ON BATTERIES IN RESIDENTIAL AND GRID-SCALE ENERGY STORAGE APPLICATIONS TO DRIVE MARKET
8.3.2
BY BATTERY CAPACITY
8.3.5.2
COMMERCIAL & INDUSTRIAL
8.4.1
INCREASING DEPLOYMENT OF ELECTRIFIED SYSTEMS SUPPORTING AUTOMATED OPERATIONS TO PROPEL MARKET
8.4.2.1
MATERIAL HANDLING EQUIPMENT
8.4.2.3
LOW-SPEED ELECTRIC VEHICLES
8.4.3
BY BATTERY CAPACITY
8.5.1
LONG LIFESPAN, HIGH ENERGY DENSITY, LOW SELF-DISCHARGE RATE TO INCREASE INTEGRATION INTO ELECTRONIC DEVICES
8.5.2.2
LAPTOPS & TABLETS
8.5.3
BY BATTERY CAPACITY
8.6.1
ESCALATING NEED FOR RELIABLE POWER SUPPLY FOR LIFE-SAVING DEVICES TO FACILITATE ADOPTION
8.6.2.1
PORTABLE & DIAGNOSTIC DEVICES
8.6.2.2
WEARABLE & IMPLANTABLE DEVICES
8.6.3
BY BATTERY CAPACITY
8.7.1.1
HIGHER POWER DENSITY, FASTER CHARGING TIMES, LONGER LIFESPAN, AND MINIMAL MAINTENANCE FEATURES TO DRIVE ADOPTION
8.7.2.1
ABILITY TO RESIST HIGH DISCHARGE CURRENTS, MECHANICAL SHOCKS, AND VIBRATIONS TO SPUR DEMAND
8.7.3.1
GREATER EMPHASIS OF AEROSPACE COMPANIES ON MINIMIZING AIRCRAFT WEIGHT AND MAXIMIZING POWER TO ACCELERATE DEMAND
9
LITHIUM-ION BATTERY MARKET, BY REGION
Comprehensive coverage of 8 Regions with country-level deep-dive of 17 Countries | 30 Data Tables.
179
9.2.1
MACROECONOMIC OUTLOOK FOR NORTH AMERICA
9.2.2.1
PUBLIC–PRIVATE ALLIANCES FOR CLEAN ENERGY FUTURE TO EXPEDITE DEMAND
9.2.3.1
ABUNDANCE OF COBALT, LITHIUM, AND NICKEL MATERIALS TO CREATE LUCRATIVE OPPORTUNITIES FOR BATTERY PROVIDERS
9.2.4.1
INCREASING INVESTMENTS IN LITHIUM-ION BATTERY PRODUCTION TO DRIVE MARKET
9.3.1
MACROECONOMIC OUTLOOK FOR EUROPE
9.3.2.1
CLEAN ENERGY GOALS TO FUEL BATTERY DEMAND
9.3.3.1
RISING FOCUS ON GENERATING ELECTRICITY USING RENEWABLES TO FOSTER MARKET GROWTH
9.3.4.1
GOVERNMENT-BACKED EXPANSION OF LITHIUM AND EV BATTERY ECOSYSTEM TO SUPPORT MARKET GROWTH
9.3.5.1
GOVERNMENT INCENTIVES PROMOTING USE OF EVS TO CONTRIBUTE TO MARKET GROWTH
9.3.6.1
PUSH FOR CLEAN MOBILITY AND CLEAN ENERGY TO BOOST DEMAND
9.4.1
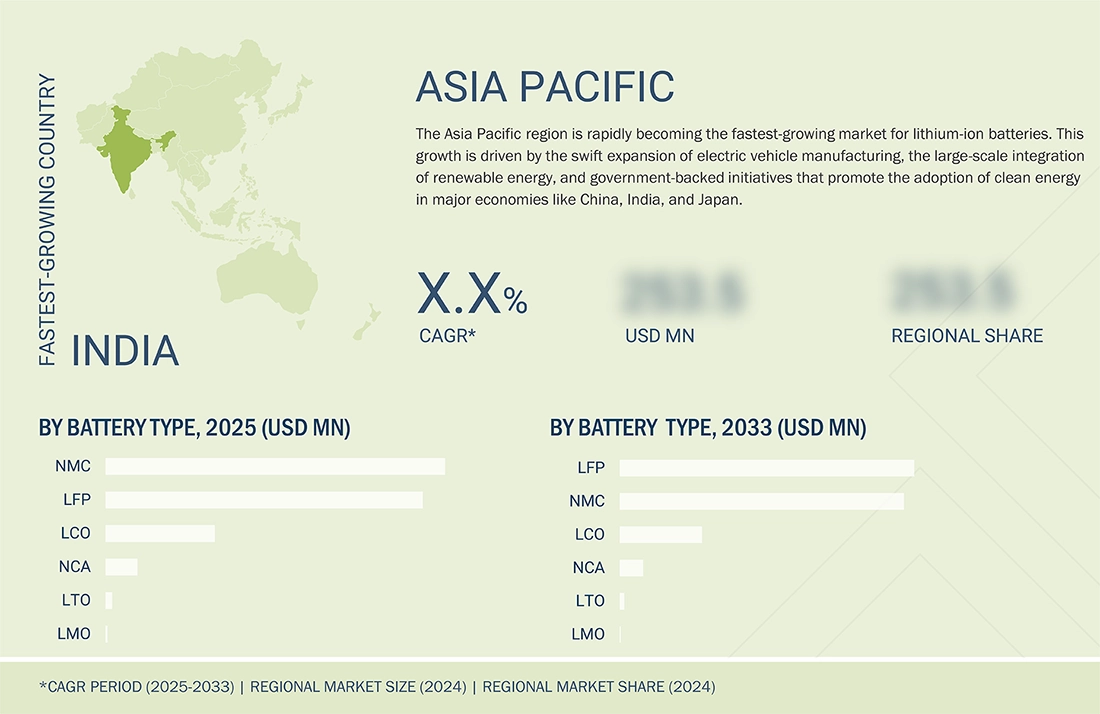
MACROECONOMIC OUTLOOK FOR ASIA PACIFIC
9.4.2.1
STRATEGIC DOMINANCE IN BATTERY SUPPLY CHAIN AND EV MANUFACTURING TO ACCELERATE MARKET GROWTH
9.4.3.1
STRONG PRESENCE OF MAJOR LITHIUM-ION MANUFACTURERS TO SUPPORT MARKET GROWTH
9.4.4.1
LITHIUM DISCOVERIES AND RISING EV ADOPTION TO UNLOCK NEW OPPORTUNITIES
9.4.4.2
RECENT STRATEGIC DEVELOPMENTS ACCELERATING INDIA’S MARKET GROWTH
9.4.5.1
INVESTMENT IN ADVANCED BATTERY TECHNOLOGIES TO FUEL MARKET EXPANSION
9.4.6.1
GROWING DEMAND FOR CLEANER AND MORE AFFORDABLE TRANSPORTATION TO FUEL MARKET GROWTH
9.4.7
REST OF ASIA PACIFIC
9.5.1
MACROECONOMIC OUTLOOK FOR ROW
9.5.2.7
REST OF MIDDLE EAST
9.5.3.2
OTHER AFRICAN COUNTRIES
9.5.4.1
ATTRACTIVE DESTINATION FOR LITHIUM-ION BATTERY MANUFACTURERS TO PROPEL MARKET
10
COMPETITIVE LANDSCAPE
Uncover strategic moves and market shares shaping the lithium-ion battery industry's competitive future.
214
10.2
KEY PLAYER STRATEGIES/RIGHT TO WIN, 2021–2024
10.3
REVENUE ANALYSIS, 2021–2024
10.4
MARKET SHARE ANALYSIS, 2024
10.4.1
OVERALL LITHIUM-ION BATTERY MARKET SHARE ANALYSIS
10.4.2
LITHIUM-ION BATTERY MARKET SHARE ANALYSIS FOR EV APPLICATION, BY INSTALLED CAPACITY
10.5
COMPANY VALUATION AND FINANCIAL METRICS
10.7
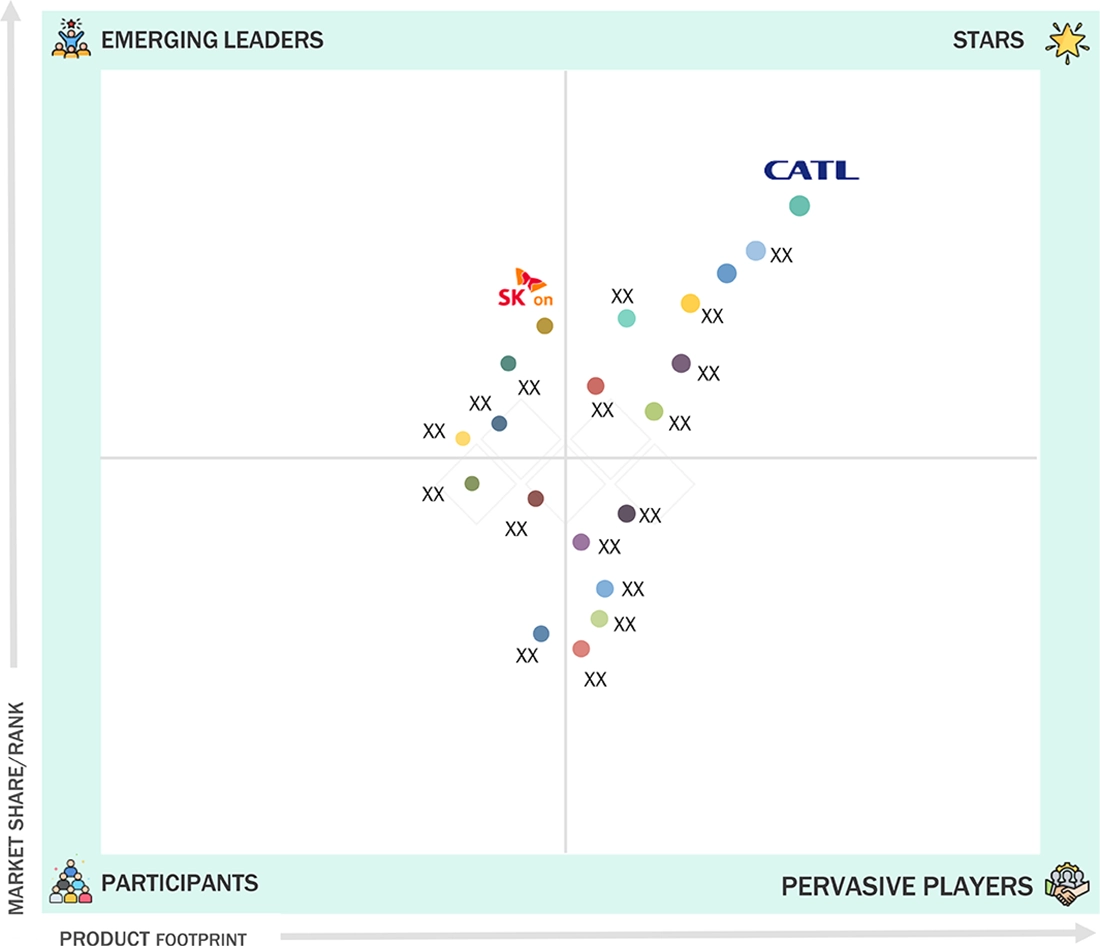
COMPANY EVALUATION MATRIX: KEY PLAYERS, 2024
10.7.5
COMPANY FOOTPRINT: KEY PLAYERS, 2024
10.7.5.1
COMPANY FOOTPRINT
10.7.5.2
REGION FOOTPRINT
10.7.5.3
BATTERY TYPE FOOTPRINT
10.7.5.4
APPLICATION FOOTPRINT
10.8
COMPANY EVALUATION MATRIX: STARTUPS/SMES, 2024
10.8.1
PROGRESSIVE COMPANIES
10.8.2
RESPONSIVE COMPANIES
10.8.5
COMPETITIVE BENCHMARKING: STARTUPS/SMES, 2024
10.8.5.1
DETAILED LIST OF KEY STARTUPS/SMES
10.8.5.2
COMPETITIVE BENCHMARKING OF KEY STARTUPS/SMES
10.8.6
STARTUP LANDSCAPE ACROSS KEY SEGMENTS OF LITHIUM BATTERY VALUE CHAIN
10.9
COMPETITIVE SCENARIO
10.9.4
OTHER DEVELOPMENTS
11
COMPANY PROFILES
In-depth Company Profiles of Leading Market Players with detailed Business Overview, Product and Service Portfolio, Recent Developments, and Unique Analyst Perspective (MnM View)
238
11.1.1
LG ENERGY SOLUTION
11.1.1.1
BUSINESS OVERVIEW
11.1.1.2
PRODUCTS/SOLUTIONS/SERVICES OFFERED
11.1.1.3
RECENT DEVELOPMENTS
11.1.3
PANASONIC HOLDINGS CORPORATION
11.1.5
CONTEMPORARY AMPEREX TECHNOLOGY CO., LIMITED
11.1.10
EVE ENERGY CO., LTD.
11.1.12
GS YUASA CORPORATION
11.1.13
MITSUBISHI ELECTRIC CORPORATION
11.1.14
SK INNOVATION CO., LTD.
11.1.16
TOSHIBA CORPORATION
11.1.17
SUNWODA ELECTRONIC CO., LTD.
11.2.2
AMPEREX TECHNOLOGY LIMITED
11.2.3
AMPRIUS TECHNOLOGIES
11.2.4
ENOVIX CORPORATION
11.2.5
FARASIS ENERGY(GANZHOU)CO., LTD.
11.2.6
GROUP14 TECHNOLOGIES, INC.
11.2.7
IPOWER BATTERIES PRIVATE LIMITED
11.2.11
NEXTECH BATTERIES
11.2.12
PPBC (POLYPLUS BATTERY COMPANY)
11.2.14
SILA NANOTECHNOLOGIES INC.
12.2
KNOWLEDGESTORE: MARKETSANDMARKETS’ SUBSCRIPTION PORTAL
12.3
CUSTOMIZATION OPTIONS
TABLE 1
LITHIUM-ION BATTERY MARKET: RISK ANALYSIS
TABLE 2
LIST OF UPCOMING GLOBAL BESS PROJECTS
TABLE 3
LIST OF COMPANIES WITNESSED BANKRUPTCY IN MARKET
TABLE 4
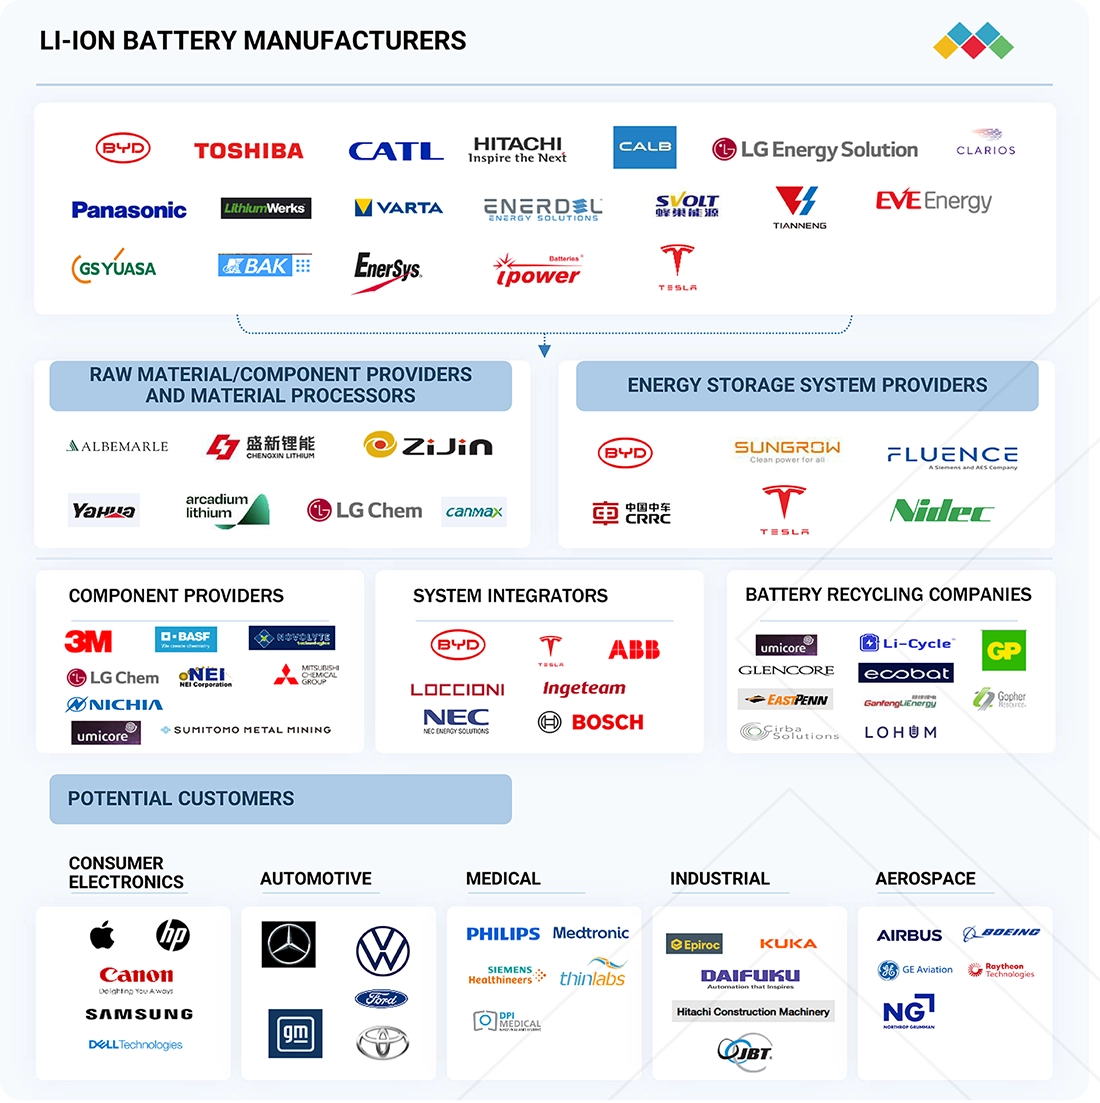
LITHIUM-ION BATTERY ECOSYSTEM ANALYSIS
TABLE 5
PRICING RANGE OF LITHIUM-ION BATTERY PACKS OFFERED BY KEY PLAYERS, 2024
TABLE 6
AVERAGE SELLING PRICE TREND OF LFP AND NMC BATTERIES, 2021–2024 (USD/KWH)
TABLE 7
AVERAGE SELLING PRICE TREND OF LITHIUM-ION BATTERIES, BY REGION, 2021–2024 (USD/KWH)
TABLE 8
LITHIUM PRODUCTION, BY COUNTRY, 2023
TABLE 9
LARGEST OPERATIONAL GIGAFACTORIES WORLDWIDE
TABLE 10
UPCOMING GIGAFACTORIES WORLDWIDE
TABLE 11
LARGEST PE/VC-BACKED INVESTMENTS IN BATTERY ENERGY STORAGE SYSTEMS ANNOUNCED IN 2024
TABLE 12
LITHIUM-ION BATTERY MARKET: PORTER’S FIVE FORCES ANALYSIS
TABLE 13
INFLUENCE OF STAKEHOLDERS ON BUYING PROCESS, BY APPLICATION
TABLE 14
KEY BUYING CRITERIA FOR TOP 3 APPLICATIONS
TABLE 15
IMPORT DATA FOR HS CODE 850650-COMPLIANT PRODUCTS, BY COUNTRY, 2020–2024 (USD MILLION)
TABLE 16
EXPORT DATA FOR HS CODE 850650-COMPLIANT PRODUCTS, BY COUNTRY, 2020–2024 (USD MILLION)
TABLE 17
LITHIUM-ION BATTERY MARKET: INNOVATIONS AND PATENT REGISTRATIONS, 2021–2024
TABLE 18
LITHIUM-ION BATTERY MARKET: LIST OF KEY CONFERENCES AND EVENTS
TABLE 19
NORTH AMERICA: LIST OF REGULATORY BODIES, GOVERNMENT AGENCIES, AND OTHER ORGANIZATIONS
TABLE 20
EUROPE: LIST OF REGULATORY BODIES, GOVERNMENT AGENCIES, AND OTHER ORGANIZATIONS
TABLE 21
ASIA PACIFIC: LIST OF REGULATORY BODIES, GOVERNMENT AGENCIES, AND OTHER ORGANIZATIONS
TABLE 22
ROW: LIST OF REGULATORY BODIES, GOVERNMENT AGENCIES, AND OTHER ORGANIZATIONS
TABLE 24
US-ADJUSTED RECIPROCAL TARIFF RATES
TABLE 25
KEY PRODUCT-RELATED TARIFF EFFECTIVE FOR MARKET
TABLE 26
EXPECTED CHANGE IN PRICES AND ANTICIPATED IMPACT ON APPLICATIONS MARKET DUE TO TARIFF
TABLE 27
KEY MATERIALS USED IN LITHIUM-ION BATTERY COMPONENTS
TABLE 28
COMPARISON OF LITHIUM-ION BATTERY TYPES BASED ON DIFFERENT PARAMETERS
TABLE 29
MARKET, BY BATTERY TYPE, 2021–2024 (USD BILLION)
TABLE 30
MARKET, BY BATTERY TYPE, 2025–2033 (USD BILLION)
TABLE 31
NMC: MARKET, BY APPLICATION, 2021–2024 (USD BILLION)
TABLE 32
NMC: MARKET, BY APPLICATION, 2025–2033 (USD BILLION)
TABLE 33
NMC: MARKET, BY REGION, 2021–2024 (USD BILLION)
TABLE 34
NMC: MARKET, BY REGION, 2025–2033 (USD BILLION)
TABLE 35
LFP: MARKET, BY APPLICATION, 2021–2024 (USD BILLION)
TABLE 36
LFP: MARKET, BY APPLICATION, 2025–2033 (USD BILLION)
TABLE 37
LFP: MARKET, BY REGION, 2021–2024 (USD BILLION)
TABLE 38
LFP: MARKET, BY REGION, 2025–2033 (USD BILLION)
TABLE 39
LCO: MARKET, BY APPLICATION, 2021–2024 (USD BILLION)
TABLE 40
LCO: MARKET, BY APPLICATION, 2025–2033 (USD BILLION)
TABLE 41
LCO: MARKET, BY REGION, 2021–2024 (USD BILLION)
TABLE 42
LCO: MARKET, BY REGION, 2025–2033 (USD BILLION)
TABLE 43
LTO: MARKET, BY APPLICATION, 2021–2024 (USD BILLION)
TABLE 44
LTO: MARKET, BY APPLICATION, 2025–2033 (USD BILLION)
TABLE 45
LTO: MARKET, BY REGION, 2021–2024 (USD BILLION)
TABLE 46
LTO: MARKET, BY REGION, 2025–2033 (USD BILLION)
TABLE 47
LMO: MARKET, BY APPLICATION, 2021–2024 (USD BILLION)
TABLE 48
LMO: MARKET, BY APPLICATION, 2025–2033 (USD BILLION)
TABLE 49
LMO: MARKET, BY REGION, 2021–2024 (USD BILLION)
TABLE 50
LMO: MARKET, BY REGION, 2025–2033 (USD BILLION)
TABLE 51
NCA: MARKET, BY APPLICATION, 2021–2024 (USD BILLION)
TABLE 52
NCA: MARKET, BY APPLICATION, 2025–2033 (USD BILLION)
TABLE 53
NCA: MARKET, BY REGION, 2021–2024 (USD BILLION)
TABLE 54
NCA: MARKET, BY REGION, 2025–2033 (USD BILLION)
TABLE 55
LITHIUM-ION BATTERY MARKET, BY APPLICATION, 2021–2024 (USD BILLION)
TABLE 56
MARKET, BY APPLICATION, 2025–2033 (USD BILLION)
TABLE 57
EVS: MARKET, BY INSTALLED CAPACITY, 2021–2024 (GWH)
TABLE 58
EVS: MARKET, BY INSTALLED CAPACITY, 2025–2033 (GWH)
TABLE 59
EVS: MARKET, BY BATTERY CAPACITY, 2021–2024 (USD BILLION)
TABLE 60
EVS: MARKET, BY BATTERY CAPACITY, 2025–2033 (USD BILLION)
TABLE 61
EVS: MARKET, BY BATTERY TYPE, 2021–2024 (USD BILLION)
TABLE 62
EVS: MARKET, BY BATTERY TYPE, 2025–2033 (USD BILLION)
TABLE 63
BATTERY TYPE/FORM USED BY OEMS, BY EV MODEL, 2025–2026
TABLE 64
BATTERY FORMS: ADVANTAGES AND DISADVANTAGES
TABLE 65
EVS: MARKET, BY BATTERY FORM, 2021–2024 (USD BILLION)
TABLE 66
EVS: MARKET, BY BATTERY FORM, 2025–2033 (USD BILLION)
TABLE 67
EVS : MARKET, BY VEHICLE TYPE, 2021–2024 (GWH)
TABLE 68
EVS: MARKET, BY VEHICLE TYPE, 2025–2033 (GWH)
TABLE 69
EVS: MARKET, BY REGION, 2021–2024 (USD BILLION)
TABLE 70
EVS: MARKET, BY REGION, 2025–2033 (USD BILLION)
TABLE 71
EVS: MARKET IN NORTH AMERICA, BY COUNTRY, 2021–2024 (USD BILLION)
TABLE 72
EVS: MARKET IN NORTH AMERICA, BY COUNTRY, 2025–2033 (USD BILLION)
TABLE 73
EVS: MARKET IN EUROPE, BY COUNTRY, 2021–2024 (USD BILLION)
TABLE 74
EVS: MARKET IN EUROPE, BY COUNTRY, 2025–2033 (USD BILLION)
TABLE 75
EVS: MARKET IN ASIA PACIFIC, BY COUNTRY, 2021–2024 (USD BILLION)
TABLE 76
EVS: MARKET IN ASIA PACIFIC, BY COUNTRY, 2025–2033 (USD BILLION)
TABLE 77
EVS: MARKET IN ROW, BY REGION, 2021–2024 (USD BILLION)
TABLE 78
EVS: MARKET IN ROW, BY REGION, 2025–2033 (USD BILLION)
TABLE 79
ENERGY STORAGE: MARKET, BY INSTALLED CAPACITY, 2021–2024 (GWH)
TABLE 80
ENERGY STORAGE: MARKET, BY INSTALLED CAPACITY, 2025–2033 (GWH)
TABLE 81
ENERGY STORAGE: MARKET, BY BATTERY CAPACITY, 2021–2024 (USD BILLION)
TABLE 82
ENERGY STORAGE: MARKET, BY BATTERY CAPACITY, 2025–2033 (USD BILLION)
TABLE 83
ENERGY STORAGE: MARKET, BY BATTERY TYPE, 2021–2024 (USD BILLION)
TABLE 84
ENERGY STORAGE: MARKET, BY BATTERY TYPE, 2025–2033 (USD BILLION)
TABLE 85
ENERGY STORAGE: MARKET, BY CONNECTION TYPE, 2021–2024 (USD BILLION)
TABLE 86
ENERGY STORAGE: MARKET, BY CONNECTION TYPE, 2025–2033 (USD BILLION)
TABLE 87
ENERGY STORAGE: MARKET, BY END USE, 2021–2024 (USD BILLION)
TABLE 88
ENERGY STORAGE: MARKET, BY END USE, 2025–2033 (USD BILLION)
TABLE 89
ENERGY STORAGE: MARKET, BY REGION, 2021–2024 (USD BILLION)
TABLE 90
ENERGY STORAGE: MARKET, BY REGION, 2025–2033 (USD BILLION)
TABLE 91
ENERGY STORAGE: MARKET IN NORTH AMERICA, BY COUNTRY, 2021–2024 (USD BILLION)
TABLE 92
ENERGY STORAGE: MARKET IN NORTH AMERICA, BY COUNTRY, 2025–2033 (USD BILLION)
TABLE 93
ENERGY STORAGE: MARKET IN EUROPE, BY COUNTRY, 2021–2024 (USD BILLION)
TABLE 94
ENERGY STORAGE: MARKET IN EUROPE, BY COUNTRY, 2025–2033 (USD BILLION)
TABLE 95
ENERGY STORAGE: MARKET IN ASIA PACIFIC, BY COUNTRY, 2021–2024 (USD BILLION)
TABLE 96
ENERGY STORAGE: MARKET IN ASIA PACIFIC, BY COUNTRY, 2025–2033 (USD BILLION)
TABLE 97
ENERGY STORAGE: MARKET IN ROW, BY REGION, 2021–2024 (USD BILLION)
TABLE 98
ENERGY STORAGE: MARKET IN ROW, BY REGION, 2025–2033 (USD BILLION)
TABLE 99
INDUSTRIAL: MARKET, BY BATTERY CAPACITY, 2021–2024 (USD MILLION)
TABLE 100
INDUSTRIAL: MARKET, BY BATTERY CAPACITY, 2025–2033 (USD MILLION)
TABLE 101
INDUSTRIAL: MARKET, BY BATTERY TYPE, 2021–2024 (USD MILLION)
TABLE 102
INDUSTRIAL: MARKET, BY BATTERY TYPE, 2025–2033 (USD MILLION)
TABLE 103
INDUSTRIAL: MARKET, BY REGION, 2021–2024 (USD MILLION)
TABLE 104
INDUSTRIAL: MARKET, BY REGION, 2025–2033 (USD MILLION)
TABLE 105
INDUSTRIAL: MARKET IN NORTH AMERICA, BY COUNTRY, 2021–2024 (USD MILLION)
TABLE 106
INDUSTRIAL: MARKET IN NORTH AMERICA, BY COUNTRY, 2025–2033 (USD MILLION)
TABLE 107
INDUSTRIAL: MARKET IN EUROPE, BY COUNTRY, 2021–2024 (USD MILLION)
TABLE 108
INDUSTRIAL: MARKET IN EUROPE, BY COUNTRY, 2025–2033 (USD MILLION)
TABLE 109
INDUSTRIAL: MARKET IN ASIA PACIFIC, BY COUNTRY, 2021–2024 (USD MILLION)
TABLE 110
INDUSTRIAL: MARKET IN ASIA PACIFIC, BY COUNTRY, 2025–2033 (USD MILLION)
TABLE 111
INDUSTRIAL: MARKET IN ROW, BY REGION, 2021–2024 (USD MILLION)
TABLE 112
INDUSTRIAL: MARKET IN ROW, BY REGION, 2025–2033 (USD MILLION)
TABLE 113
CONSUMER ELECTRONICS: MARKET, BY PRODUCT TYPE, 2021–2024 (USD BILLION)
TABLE 114
CONSUMER ELECTRONICS: MARKET, BY PRODUCT TYPE, 2025–2033 (USD BILLION)
TABLE 115
CONSUMER ELECTRONICS: MARKET, BY BATTERY CAPACITY, 2021–2024 (USD BILLION)
TABLE 116
CONSUMER ELECTRONICS: MARKET, BY BATTERY CAPACITY, 2025–2033 (USD BILLION)
TABLE 117
CONSUMER ELECTRONICS: MARKET, BY BATTERY TYPE, 2021–2024 (USD BILLION)
TABLE 118
CONSUMER ELECTRONICS: MARKET, BY BATTERY TYPE, 2025–2033 (USD BILLION)
TABLE 119
CONSUMER ELECTRONICS: MARKET, BY REGION, 2021–2024 (USD BILLION)
TABLE 120
CONSUMER ELECTRONICS: MARKET, BY REGION, 2025–2033 (USD BILLION)
TABLE 121
CONSUMER ELECTRONICS: MARKET IN NORTH AMERICA, BY COUNTRY, 2021–2024 (USD BILLION)
TABLE 122
CONSUMER ELECTRONICS: MARKET IN NORTH AMERICA, BY COUNTRY, 2025–2033 (USD BILLION)
TABLE 123
CONSUMER ELECTRONICS: MARKET IN EUROPE, BY COUNTRY, 2021–2024 (USD BILLION)
TABLE 124
CONSUMER ELECTRONICS: MARKET IN EUROPE, BY COUNTRY, 2025–2033 (USD BILLION)
TABLE 125
CONSUMER ELECTRONICS: MARKET IN ASIA PACIFIC, BY COUNTRY, 2021–2024 (USD BILLION)
TABLE 126
CONSUMER ELECTRONICS: MARKET IN ASIA PACIFIC, BY COUNTRY, 2025–2033 (USD BILLION)
TABLE 127
CONSUMER ELECTRONICS: MARKET IN ROW, BY REGION, 2021–2024 (USD BILLION)
TABLE 128
CONSUMER ELECTRONICS: MARKET IN ROW, BY REGION, 2025–2033 (USD BILLION)
TABLE 129
MEDICAL: MARKET, BY BATTERY CAPACITY, 2021–2024 (USD MILLION)
TABLE 130
MEDICAL: MARKET, BY BATTERY CAPACITY, 2025–2033 (USD MILLION)
TABLE 131
MEDICAL: MARKET, BY BATTERY TYPE, 2021–2024 (USD MILLION)
TABLE 132
MEDICAL: MARKET, BY BATTERY TYPE, 2025–2033 (USD MILLION)
TABLE 133
MEDICAL: MARKET, BY REGION, 2021–2024 (USD MILLION)
TABLE 134
MEDICAL: MARKET, BY REGION, 2025–2033 (USD MILLION)
TABLE 135
MEDICAL: MARKET IN NORTH AMERICA, BY COUNTRY, 2021–2024 (USD MILLION)
TABLE 136
MEDICAL: MARKET IN NORTH AMERICA, BY COUNTRY, 2025–2033 (USD MILLION)
TABLE 137
MEDICAL: MARKET IN EUROPE, BY COUNTRY, 2021–2024 (USD MILLION)
TABLE 138
MEDICAL: MARKET IN EUROPE, BY COUNTRY, 2025–2033 (USD MILLION)
TABLE 139
MEDICAL: MARKET IN ASIA PACIFIC, BY COUNTRY, 2021–2024 (USD MILLION)
TABLE 140
MEDICAL: MARKET IN ASIA PACIFIC, BY COUNTRY, 2025–2033 (USD MILLION)
TABLE 141
MEDICAL: MARKET IN ROW, BY REGION, 2021–2024 (USD MILLION)
TABLE 142
MEDICAL: MARKET IN ROW, BY REGION, 2025–2033 (USD MILLION)
TABLE 143
OTHER APPLICATIONS: MARKET, BY BATTERY TYPE, 2021–2024 (USD MILLION)
TABLE 144
OTHER APPLICATIONS: MARKET, BY BATTERY TYPE, 2025–2033 (USD MILLION)
TABLE 145
OTHER APPLICATIONS: MARKET, BY REGION, 2021–2024 (USD MILLION)
TABLE 146
OTHER APPLICATIONS: MARKET, BY REGION, 2025–2033 (USD MILLION)
TABLE 147
OTHER APPLICATIONS: MARKET IN NORTH AMERICA, BY COUNTRY, 2021–2024 (USD MILLION)
TABLE 148
OTHER APPLICATIONS: MARKET IN NORTH AMERICA, BY COUNTRY, 2025–2033 (USD MILLION)
TABLE 149
OTHER APPLICATIONS: MARKET IN EUROPE, BY COUNTRY, 2021–2024 (USD MILLION)
TABLE 150
OTHER APPLICATIONS: MARKET IN EUROPE, BY COUNTRY, 2025–2033 (USD MILLION)
TABLE 151
OTHER APPLICATIONS: MARKET IN ASIA PACIFIC, BY COUNTRY, 2021–2024 (USD MILLION)
TABLE 152
OTHER APPLICATIONS: MARKET IN ASIA PACIFIC, BY COUNTRY, 2025–2033 (USD MILLION)
TABLE 153
OTHER APPLICATIONS: MARKET IN ROW, BY REGION, 2021–2024 (USD MILLION)
TABLE 154
OTHER APPLICATIONS: MARKET IN ROW, BY REGION, 2025–2033 (USD MILLION)
TABLE 155
LITHIUM-ION BATTERY MARKET, BY REGION, 2021–2024 (USD BILLION)
TABLE 156
LITHIUM-ION BATTERY MARKET, BY REGION, 2025–2033 (USD BILLION)
TABLE 157
NORTH AMERICA: MARKET, BY COUNTRY, 2021–2024 (USD BILLION)
TABLE 158
NORTH AMERICA: MARKET, BY COUNTRY, 2025–2033 (USD BILLION)
TABLE 159
NORTH AMERICA: MARKET, BY BATTERY TYPE, 2021–2024 (USD BILLION)
TABLE 160
NORTH AMERICA: MARKET, BY BATTERY TYPE, 2025–2033 (USD BILLION)
TABLE 161
NORTH AMERICA: MARKET, BY APPLICATION, 2021–2024 (USD BILLION)
TABLE 162
NORTH AMERICA: MARKET, BY APPLICATION, 2025–2033 (USD BILLION)
TABLE 163
EUROPE: MARKET, BY COUNTRY, 2021–2024 (USD BILLION)
TABLE 164
EUROPE: MARKET, BY COUNTRY, 2025–2033 (USD BILLION)
TABLE 165
EUROPE: MARKET, BY BATTERY TYPE, 2021–2024 (USD BILLION)
TABLE 166
EUROPE: MARKET, BY BATTERY TYPE, 2025–2033 (USD BILLION)
TABLE 167
EUROPE: MARKET, BY APPLICATION, 2021–2024 (USD BILLION)
TABLE 168
EUROPE: MARKET, BY APPLICATION, 2025–2033 (USD BILLION)
TABLE 169
ASIA PACIFIC: MARKET, BY COUNTRY, 2021–2024 (USD BILLION)
TABLE 170
ASIA PACIFIC: MARKET, BY COUNTRY, 2025–2033 (USD BILLION)
TABLE 171
ASIA PACIFIC: MARKET, BY BATTERY TYPE, 2021–2024 (USD BILLION)
TABLE 172
ASIA PACIFIC: MARKET, BY BATTERY TYPE, 2025–2033 (USD BILLION)
TABLE 173
ASIA PACIFIC: MARKET, BY APPLICATION, 2021–2024 (USD BILLION)
TABLE 174
ASIA PACIFIC: MARKET, BY APPLICATION, 2025–2033 (USD BILLION)
TABLE 175
ROW: MARKET, BY REGION, 2021–2024 (USD MILLION)
TABLE 176
ROW: MARKET, BY REGION, 2025–2033 (USD MILLION)
TABLE 177
ROW: MARKET, BY BATTERY TYPE, 2021–2024 (USD MILLION)
TABLE 178
ROW: MARKET, BY BATTERY TYPE, 2025–2033 (USD MILLION)
TABLE 179
ROW: MARKET, BY APPLICATION, 2021–2024 (USD MILLION)
TABLE 180
ROW: MARKET, BY APPLICATION, 2025–2033 (USD MILLION)
TABLE 181
MIDDLE EAST: MARKET, BY COUNTRY, 2021–2024 (USD MILLION)
TABLE 182
MIDDLE EAST: MARKET, BY COUNTRY, 2025–2033 (USD MILLION)
TABLE 183
AFRICA: MARKET, BY COUNTRY, 2021–2024 (USD MILLION)
TABLE 184
AFRICA: MARKET, BY COUNTRY, 2025–2033 (USD MILLION)
TABLE 185
LITHIUM-ION BATTERY MARKET: OVERVIEW OF STRATEGIES ADOPTED BY KEY PLAYERS, 2021–2024
TABLE 186
LITHIUM-ION BATTERY MARKET: DEGREE OF COMPETITION, 2024
TABLE 187
LITHIUM-ION BATTERY MARKET: DEGREE OF COMPETITION FOR EVS APPLICATIONS, 2024
TABLE 188
LITHIUM-ION BATTERY MARKET: REGION FOOTPRINT
TABLE 189
LITHIUM-ION BATTERY MARKET: BATTERY TYPE FOOTPRINT
TABLE 190
LITHIUM-ION BATTERY MARKET: APPLICATION FOOTPRINT
TABLE 191
LITHIUM-ION BATTERY MARKET: DETAILED LIST OF KEY STARTUPS/SMES
TABLE 192
LITHIUM-ION BATTERY MARKET: COMPETITIVE BENCHMARKING OF KEY STARTUPS/SMES
TABLE 193
LITHIUM-ION BATTERY MARKET: PRODUCT LAUNCHES, JANUARY 2021–MAY 2025
TABLE 194
LITHIUM-ION BATTERY MARKET: DEALS, JANUARY 2021–MAY 2025
TABLE 195
LITHIUM-ION BATTERY MARKET: EXPANSIONS, JANUARY 2021–MAY 2025
TABLE 196
LITHIUM-ION BATTERY MARKET: OTHER DEVELOPMENTS, JANUARY 2021–MAY 2025
TABLE 197
LG ENERGY SOLUTION: COMPANY OVERVIEW
TABLE 198
LG ENERGY SOLUTION: PRODUCTS/SOLUTIONS/SERVICES OFFERED
TABLE 199
LG ENERGY SOLUTION: PRODUCT LAUNCHES
TABLE 200
LG ENERGY SOLUTION: DEALS
TABLE 201
LG ENERGY SOLUTION: EXPANSIONS
TABLE 202
SAMSUNG SDI: COMPANY OVERVIEW
TABLE 203
SAMSUNG SDI: PRODUCTS/SOLUTIONS/SERVICES OFFERED
TABLE 204
SAMSUNG SDI: DEALS
TABLE 205
SAMSUNG SDI: EXPANSIONS
TABLE 206
SAMSUNG SDI: OTHER DEVELOPMENTS
TABLE 207
PANASONIC HOLDINGS CORPORATION: COMPANY OVERVIEW
TABLE 208
PANASONIC HOLDINGS CORPORATION: PRODUCTS/SOLUTIONS/SERVICES OFFERED
TABLE 209
PANASONIC HOLDINGS CORPORATION: DEALS
TABLE 210
PANASONIC HOLDINGS CORPORATION: EXPANSIONS
TABLE 211
PANASONIC HOLDINGS CORPORATION: OTHER DEVELOPMENTS
TABLE 212
BYD COMPANY LTD.: COMPANY OVERVIEW
TABLE 213
BYD COMPANY LTD.: PRODUCTS/SOLUTIONS/SERVICES OFFERED
TABLE 214
BYD COMPANY LTD.: DEALS
TABLE 215
CONTEMPORARY AMPEREX TECHNOLOGY CO., LIMITED: COMPANY OVERVIEW
TABLE 216
CONTEMPORARY AMPEREX TECHNOLOGY CO., LIMITED: PRODUCTS/SOLUTIONS/SERVICES OFFERED
TABLE 217
CONTEMPORARY AMPEREX TECHNOLOGY CO., LIMITED: PRODUCT LAUNCHES
TABLE 218
CONTEMPORARY AMPEREX TECHNOLOGY CO., LIMITED: DEALS
TABLE 219
BAK POWER: COMPANY OVERVIEW
TABLE 220
BAK POWER: PRODUCTS/SOLUTIONS/SERVICES OFFERED
TABLE 221
BAK POWER: PRODUCT LAUNCHES
TABLE 222
BAK POWER: EXPANSIONS
TABLE 223
CALB: COMPANY OVERVIEW
TABLE 224
CALB: PRODUCTS/SOLUTIONS/SERVICES OFFERED
TABLE 225
CALB: PRODUCT LAUNCHES
TABLE 226
CLARIOS: COMPANY OVERVIEW
TABLE 227
CLARIOS: PRODUCTS/SOLUTIONS/SERVICES OFFERED
TABLE 228
ENERSYS: COMPANY OVERVIEW
TABLE 229
ENERSYS: PRODUCTS/SOLUTIONS/SERVICES OFFERED
TABLE 231
ENERSYS: EXPANSIONS
TABLE 232
EVE ENERGY CO., LTD.: COMPANY OVERVIEW
TABLE 233
EVE ENERGY CO., LTD.: PRODUCTS/SOLUTIONS/SERVICES OFFERED
TABLE 234
EVE ENERGY CO., LTD.: PRODUCT LAUNCHES
TABLE 235
EVE ENERGY CO., LTD.: DEALS
TABLE 236
GOTION: COMPANY OVERVIEW
TABLE 237
GOTION: PRODUCTS/SOLUTIONS/SERVICES OFFERED
TABLE 239
GS YUASA CORPORATION: COMPANY OVERVIEW
TABLE 240
GS YUASA CORPORATION: PRODUCTS/SOLUTIONS/SERVICES OFFERED
TABLE 241
GS YUASA CORPORATION: DEALS
TABLE 242
GS YUASA CORPORATION: OTHER DEVELOPMENTS
TABLE 243
MITSUBISHI ELECTRIC CORPORATION: COMPANY OVERVIEW
TABLE 244
MITSUBISHI ELECTRIC CORPORATION: PRODUCTS/SOLUTIONS/SERVICES OFFERED
TABLE 245
SK INNOVATION CO., LTD.: COMPANY OVERVIEW
TABLE 246
SK INNOVATION CO., LTD.: PRODUCTS/SOLUTIONS/SERVICES OFFERED
TABLE 247
SK INNOVATION CO., LTD.: DEALS
TABLE 248
TESLA: COMPANY OVERVIEW
TABLE 249
TESLA: PRODUCTS/SOLUTIONS/SERVICES OFFERED
TABLE 250
TESLA: DEVELOPMENTS
TABLE 251
TOSHIBA CORPORATION: COMPANY OVERVIEW
TABLE 252
TOSHIBA CORPORATION: PRODUCTS/SOLUTIONS/SERVICES OFFERED
TABLE 253
TOSHIBA CORPORATION: PRODUCT LAUNCHES
TABLE 254
TOSHIBA CORPORATION: DEALS
TABLE 255
SUNWODA ELECTRONIC CO., LTD.: COMPANY OVERVIEW
TABLE 256
SUNWODA ELECTRONIC CO., LTD.: PRODUCTS/SOLUTIONS/SERVICES OFFERED
TABLE 257
SUNWODA ELECTRONIC CO., LTD.: DEALS
TABLE 258
VARTA AG: COMPANY OVERVIEW
TABLE 259
VARTA AG: PRODUCTS/SOLUTIONS/SERVICES OFFERED
FIGURE 1
LITHIUM-ION BATTERY MARKET SEGMENTATION
FIGURE 2
LITHIUM-ION BATTERY MARKET: RESEARCH DESIGN
FIGURE 3
LITHIUM-ION BATTERY MARKET: RESEARCH APPROACH
FIGURE 4
MARKET SIZE ESTIMATION METHODOLOGY: TOP-DOWN APPROACH
FIGURE 5
MARKET SIZE ESTIMATION METHODOLOGY: BOTTOM-UP APPROACH
FIGURE 6
MARKET SIZE ESTIMATION METHODOLOGY FOR MARKET: SUPPLY-SIDE ANALYSIS
FIGURE 7
DATA TRIANGULATION
FIGURE 9
LITHIUM-ION BATTERY MARKET, 2021–2033
FIGURE 10
LFP BATTERY TYPE TO ACCOUNT FOR LARGEST MARKET SHARE IN 2033
FIGURE 11
ENERGY STORAGE SEGMENT TO RECORD HIGHEST CAGR DURING FORECAST PERIOD
FIGURE 12
ASIA PACIFIC TO LEAD GLOBAL MARKET DURING FORECAST PERIOD
FIGURE 13
RISING SALES OF BATTERY-OPERATED ELECTRIC VEHICLES GLOBALLY TO DRIVE MARKET
FIGURE 14
EVS SEGMENT TO DOMINATE MARKET, BY APPLICATION, IN 2033
FIGURE 15
HISTORICAL AND PROJECTED DATA ON BATTERY CAPACITY INSTALLATIONS WORLDWIDE, 2021–2033
FIGURE 16
EVS SEGMENT AND CHINA TO HOLD LARGEST SHARE OF MARKET IN ASIA PACIFIC IN 2033
FIGURE 17
INDIA TO RECORD HIGHEST CAGR IN GLOBAL LITHIUM-ION BATTERY BETWEEN 2025 AND 2033
FIGURE 18
LITHIUM-ION BATTERY MARKET: DRIVERS, RESTRAINTS, OPPORTUNITIES, AND CHALLENGES
FIGURE 19
ELECTRIC CAR SALES, 2018–2024
FIGURE 20
LITHIUM-ION BATTERY MARKET: IMPACT ANALYSIS OF DRIVERS
FIGURE 21
LITHIUM-ION BATTERY MARKET: IMPACT ANALYSIS OF RESTRAINTS
FIGURE 22
LITHIUM-ION BATTERY MARKET: IMPACT ANALYSIS OF OPPORTUNITIES
FIGURE 23
LITHIUM-ION BATTERY MARKET: IMPACT ANALYSIS OF CHALLENGES
FIGURE 24
LITHIUM-ION BATTERY VALUE CHAIN ANALYSIS
FIGURE 25
KEY PLAYERS IN LITHIUM-ION BATTERY ECOSYSTEM
FIGURE 26
AVERAGE SELLING PRICE TREND OF LITHIUM-ION BATTERIES, 2021–2033
FIGURE 27
AVERAGE SELLING PRICE TREND OF LFP AND NMC BATTERIES, 2021–2024
FIGURE 28
AVERAGE SELLING PRICE TREND OF LITHIUM-ION BATTERIES, BY REGION, 2021–2024
FIGURE 29
LITHIUM-ION BATTERY MANUFACTURING CAPACITY OF DIFFERENT COUNTRIES, 2022 VS. 2025 VS. 2030
FIGURE 30
TRENDS/DISRUPTIONS INFLUENCING PLAYERS IN MARKET
FIGURE 31
GLOBAL EV BATTERY INVESTMENT AND VC FUNDING SCENARIO, 2018–2024
FIGURE 32
GLOBAL INVESTMENT AND PE/VC FUNDING SCENARIO FOR BATTERY ENERGY STORAGE SYSTEMS, 2020–2024
FIGURE 33
LITHIUM-ION BATTERY MARKET: PORTER’S FIVE FORCES ANALYSIS
FIGURE 34
INFLUENCE OF STAKEHOLDERS ON BUYING PROCESS FOR TOP 3 APPLICATIONS
FIGURE 35
KEY BUYING CRITERIA FOR TOP 3 APPLICATIONS
FIGURE 36
IMPORT SCENARIO FOR HS CODE 850650-COMPLIANT PRODUCTS, BY COUNTRY, 2020–2024
FIGURE 37
EXPORT SCENARIO FOR HS CODE 850650-COMPLIANT PRODUCTS, BY COUNTRY, 2020–2024
FIGURE 38
LITHIUM-ION BATTERY MARKET: PATENT ANALYSIS, 2014–2024
FIGURE 39
KEY AI USE CASES IN LITHIUM-ION BATTERY MARKET
FIGURE 40
LITHIUM-ION BATTERY MARKET, BY TYPE
FIGURE 41
LFP SEGMENT TO RECORD HIGHEST CAGR DURING FORECAST PERIOD
FIGURE 42
PERFORMANCE PARAMETERS OF NMC BATTERIES
FIGURE 43
PERFORMANCE PARAMETERS OF LFP BATTERIES
FIGURE 44
PERFORMANCE PARAMETERS OF LCO BATTERIES
FIGURE 45
PERFORMANCE PARAMETERS OF LTO BATTERIES
FIGURE 46
PERFORMANCE PARAMETERS OF LMO BATTERIES
FIGURE 47
PERFORMANCE PARAMETERS OF NCA BATTERIES
FIGURE 48
LITHIUM-ION BATTERY MARKET, BY APPLICATION
FIGURE 49
EVS SEGMENT TO HOLD PROMINENT MARKET SHARE IN 2033
FIGURE 50
LITHIUM-ION BATTERY MARKET, BY REGION
FIGURE 51
INDIA TO REGISTER HIGHEST CAGR IN GLOBAL MARKET DURING FORECAST PERIOD
FIGURE 52
ASIA PACIFIC TO RECORD HIGHEST CAGR FROM 2025 TO 2033
FIGURE 53
NORTH AMERICA: MARKET SNAPSHOT
FIGURE 54
US HELD LARGEST SHARE OF NORTH AMERICAN MARKET IN 2024
FIGURE 55
EUROPE: MARKET SNAPSHOT
FIGURE 56
UK TO RECORD HIGHEST CAGR IN EUROPEAN MARKET DURING FORECAST PERIOD
FIGURE 57
ASIA PACIFIC: LITHIUM-ION BATTERY MARKET SNAPSHOT
FIGURE 58
CHINA TO CAPTURE LARGEST SHARE OF ASIA PACIFIC MARKET IN 2033
FIGURE 59
EMERGING BATTERY POWERHOUSES: INDIA’S GIGAFACTORY MAP
FIGURE 60
MIDDLE EAST TO EMERGE AS FASTEST-GROWING REGION IN MARKET IN ROW DURING FORECAST PERIOD
FIGURE 61
LITHIUM-ION BATTERY MARKET: REVENUE ANALYSIS, 2021–2024
FIGURE 62
LITHIUM-ION BATTERY MARKET SHARE ANALYSIS, 2024
FIGURE 63
COMPANY VALUATION
FIGURE 64
FINANCIAL METRICS (EV/EBITDA)
FIGURE 65
BRAND COMPARISON
FIGURE 66
LITHIUM-ION BATTERY MARKET: COMPANY EVALUATION MATRIX (KEY PLAYERS), 2024
FIGURE 67
LITHIUM-ION MARKET: COMPANY FOOTPRINT
FIGURE 68
LITHIUM-ION BATTERY MARKET: COMPANY EVALUATION MATRIX (STARTUPS/SMES), 2024
FIGURE 69
LITHIUM BATTERY STARTUP LANDSCAPE
FIGURE 70
LG ENERGY SOLUTION: COMPANY SNAPSHOT
FIGURE 71
SAMSUNG SDI: COMPANY SNAPSHOT
FIGURE 72
PANASONIC HOLDINGS CORPORATION: COMPANY SNAPSHOT
FIGURE 73
BYD COMPANY LTD.: COMPANY SNAPSHOT
FIGURE 74
CONTEMPORARY AMPEREX TECHNOLOGY CO., LIMITED: COMPANY SNAPSHOT
FIGURE 75
CALB: COMPANY SNAPSHOT
FIGURE 76
ENERSYS: COMPANY SNAPSHOT
FIGURE 77
EVE ENERGY CO., LTD.: COMPANY SNAPSHOT
FIGURE 78
GOTION: COMPANY SNAPSHOT
FIGURE 79
GS YUASA CORPORATION: COMPANY SNAPSHOT
FIGURE 80
MITSUBISHI ELECTRIC CORPORATION: COMPANY SNAPSHOT
FIGURE 81
SK INNOVATION CO., LTD.: COMPANY SNAPSHOT
FIGURE 82
TESLA: COMPANY SNAPSHOT
FIGURE 83
TOSHIBA CORPORATION: COMPANY SNAPSHOT
FIGURE 84
SUNWODA ELECTRONIC CO., LTD.: COMPANY SNAPSHOT
FIGURE 85
VARTA AG: COMPANY SNAPSHOT

 Download PDF
 Request Customisation


Dylan
Apr, 2026
What are the key drivers of lithium-ion battery adoption over the next 5�10 years?.
Tyler
Apr, 2026
How are EVs, grid storage, and renewable integration impacting growth projections?.
Liam
Apr, 2026
Are trends like recycling, second-life applications, and circular economy included in the growth outlook?.
Aytak
Apr, 2022
I would like to have a general idea about the future of Lithium-Ion Battery Market size on a global scale and in Austria specifically..