Batter & Breader Premixes Market

Batter & Breader Premixes Market by Batter Type (Adhesion Batter, Beer Batter, Thick Batter, Customized Batter), Breader Type (Crumbs & Flakes, Flour & Starch), Application (Meat, Seafood, Vegetables), End Users and Region - Global Forecast to 2028

Report Code: FB 6555 Sep, 2023, by marketsandmarkets.com

[394 Pages Report] The batter & breader premixes market is estimated at USD 2.7 billion in 2023 and is projected to reach USD 3.8 billion by 2028, at a CAGR of 6.7% from 2023 to 2028.

The batter & breader premixes market is highly impacted by the increasing size of the convenience & fast-food industry and innovative offerings by batter & breader premixes manufacturers. The growth rate of the fast-food industry is significant owing to the changing lifestyles of people around the globe. The US is the dominant market in the fast-food industry and this trend is expected to continue. The emerging economies of the Asia Pacific region are the major markets for batter & breader premixes and are increasingly contributing to their demand, owing to the rising disposable income, rapidly increasing population, and an increase in the demand for processed foods in these countries. The widespread impact of Western cuisines on developing regions such as Asia Pacific and Latin America has led to a tremendous increase in demand for fast-food products. Moreover, constant innovations offer investment opportunities to batter & breader premixes manufacturers. On the other hand, raising awareness about the ill-health effects of fried food such as obesity, high cholesterol levels, and heart problems.

Batter & Breader Premixes Market

To know about the assumptions considered for the study, Request for Free Sample Report

Batter & Breader Premixes Market Attractive Opportunities

To know about the assumptions considered for the study, download the pdf brochure

Drivers: Rising demand for processed, prepared, and convenience food

Rising living standards, expanding working populations, and increased disposable income in emerging economies like India, Brazil, and China have driven a surge in demand for convenient and processed foods. These countries have witnessed a faster growth rate in the processed food sector compared to developed nations, where advanced food processing technologies have led to slower revenue growth. The higher demand for processed foods in developing nations, along with increased consumption of convenience foods due to larger working populations, is expected to boost the batter and breader premixes market. As consumers increasingly prioritize taste, nutrition, and health benefits in their food choices, there is a growing demand for premixes that enhance the flavor, texture, and overall quality of the final food product. Batter and breader premixes play a crucial role in achieving these goals, making it easier to infuse flavors and ingredients, extend shelf life, and improve the overall appeal of end products.

Restraints: Prevalence of allergies to batter & breader premix sources, such as soy and wheat

Food allergies and intolerances have been around for a long time. Recently, they've become a bigger concern as their occurrence has gone up. According to the Food Allergy Research & Education organization in the US, soy and wheat are among the top eight major food allergens causing serious reactions. Four of these allergens - wheat, soybeans, milk, and eggs - are often found in batter systems. For example, soybeans are packed with nutrients like vitamins, minerals, isoflavones, and proteins. However, they also contain anti-nutritional parts that can lead to issues like soy allergies. One of these components, Kunitz STI trypsin inhibitor, can cause allergic reactions in susceptible individuals. People who can't tolerate gluten are at risk for celiac disease, a condition triggered by a reaction to gluten proteins in wheat, barley, rye, and sometimes oats. Although it can affect people of all ages who have a genetic predisposition, it often starts in early infancy. Celiac disease causes inflammation and damage to the inner lining of the small intestine due to an allergic reaction to gluten in the diet. The signs and symptoms of celiac disease can range from mild to severe. According to the Celiac Sprue Association, there's currently no cure for celiac disease, and the only effective treatment is sticking to a gluten-free diet. Thus, allergies caused due to batter & breader sources are projected to restrain the global batter & breader premixes market during the forecast period.

Opportunities: Increase in investments in research & development for new batter & breader technologies

Batter and breader premixes play a significant role in the production of processed and convenient foods. The growing demand for these premixes, which not only uphold the quality of the final product but also enhance its value, has spurred food ingredient manufacturers to invest heavily in research and development, leading to the introduction of innovative solutions. These offerings often encompass tailored blends and systems. Globalization has brought about heightened awareness of various food trends among consumers. This has prompted food manufacturing companies to extend their reach worldwide, benefitting from increased trade liberalization. As a result, they're venturing into new and previously unexplored markets. Even local players are upping their game, expanding their product portfolios to stay competitive. For example, manufacturers in China, India, and Japan have developed battering equipment that rivals both imported and market-leading options in terms of quality. To gain a competitive edge, companies, both domestically and internationally, are channeling their efforts into innovating their battering technologies. This includes the adoption of cutting-edge techniques like electrostatic coating, which outperforms traditional methods, resulting in an even more efficient coating process.

Challenges: Shift toward fresh food products

The market's inclination towards fresh and frozen food coatings has posed a challenge in formulating and developing batter-based coatings and breading for a range of new products. Developed countries like the US, Germany, and the UK are witnessing shifts in food preferences, altered eating habits, and increased concerns over food safety, all of which are impacting the food processing industry. The aging population in these nations is also contributing to heightened health worries, leading to a preference for fresh, locally sourced, and minimally processed food items devoid of synthetic additives. As per the Population Reference Bureau in the US, the proportion of the population aged over 65 was 11.2%, a figure that has risen to 13% in 2010 and is projected to reach 20.4% by 2040. Furthermore, the demand for products featuring sugar, sugar syrups, and chemically preserved chocolate coatings is notably dwindling. This trend poses a potential threat to the growth of the batter and breader premixes market, as individuals with health concerns view highly processed foods as potentially detrimental, opting instead for fresh, organic, and naturally derived fruits, vegetables, and minimally processed food options. This shift in preference adversely impacts the demand for batter and breader premixes.

Batter & Breader Premixes Market Ecosystem

Based on application meat products segment is estimated to account for the largest market share of the batter & breader premixes market

The sheer ubiquity of meat-based products in global cuisine further solidifies the role of meat applications in driving market demand. Whether in classic comfort foods or gourmet offerings, the inclusion of battered and breaded meat items has become a culinary norm across cultures. This broad appeal ensures a sustained and robust market for specialized batters and breaders designed for meat applications. Moreover, meat applications offer a wide canvas for culinary creativity and innovation. These specialized batters and breaders can be tailored to accommodate various types of meat, from poultry to red meats and even seafood. This adaptability allows chefs and food processors to craft an array of dishes, catering to diverse tastes and preferences. As a result, meat applications have become a cornerstone in the culinary repertoire of restaurants, fast-food chains, and food manufacturers alike.

Based on batter type, customized batter is anticipated to have the highest growth rate in the market

Customized batter formulations represent a pivotal demand driver within the batter and breader market, revolutionizing the way food processors and chefs approach culinary creations. This specialized type of batter plays a paramount role by offering tailored solutions that cater to specific preferences, dietary requirements, and culinary applications. Unlike generic batters, customized formulations empower professionals to achieve a distinctive and signature quality in their food products. The primary factor fueling the significance of customized batter lies in its ability to address the evolving and diverse needs of consumers. By allowing for precise adjustments in ingredients, texture, and flavor profiles, these batters can be fine-tuned to match the unique demands of different cuisines and target demographics. This versatility enables chefs and food manufacturers to craft products that stand out in a crowded market, setting them apart from competitors and meeting the discerning expectations of consumers.

By breader type, crumbs & flakes segment is projected to witness a higher growth rate during the forecast period

The primary factor propelling the significance of crumbs and flakes lies in their ability to deliver a consistently crunchy and crispy texture. Their irregular, granular structure provides a distinct mouthfeel, adding an extra layer of sensory satisfaction to the eating experience. This textural enhancement is particularly sought after in the food industry, as it elevates the perceived quality of products, making them more appealing to consumers. Furthermore, crumbs and flakes are renowned for their adaptability across a diverse range of food items. Whether used to coat proteins, vegetables, or even desserts, they offer a convenient and efficient solution for achieving a desirable crunch. This versatility allows chefs and food manufacturers to explore a wide array of culinary creations, from classic comfort foods to innovative, gourmet offerings, thus solidifying crumbs and flakes as a cornerstone in the culinary toolkit.

The North American market is projected to contribute the largest share of the global batter & breader premixes market

North America, especially the US, has been a significant consumer of processed and convenience foods, which often include cheese-flavored snacks and products. This has contributed to the demand for batter & breader premixes as an ingredient. Consumers have shown a growing preference for convenient, ready-to-eat, and portable snack options. Batter & breader premixes are often used to add flavor to such products, aligning with this trend. Its use in various food items helps enhance taste profiles and can make products more appealing to consumers. One key factor contributing to North America's significance is the consumer penchant for convenience and indulgence. The fast-paced lifestyles and busy schedules of North American consumers drive the demand for pre-prepared and easy-to-cook food options. Batters and breaders play a vital role in meeting this demand by providing a quick and efficient way to enhance the texture and flavor of various food products. This aligns perfectly with the region's culinary culture, which includes a wide range of battered and breaded dishes, from classic fried chicken to fish and chips.

Batter & Breader Premixes Market by Region

Key Market Players

Archer Daniels Midland (US), Kerry Group Plc (Ireland), Associated British Foods Plc (UK), Cargill, Incorporated (US), and Ingredion (US) are among the key players in the global batter & breader premixes market. These players in this market are focusing on increasing their presence through expansion and collaboration. These companies have a strong presence in North America, Asia Pacific, and Europe.

Want to explore hidden markets that can drive new revenue in Batter & Breader Premixes Market?

Scope of the Report

Report Metric

Details

Market size estimation

2023–2028

Base year considered

2022

Forecast period considered

2023–2028

Units considered

Value (USD Million/Billion), Volume (KT)

Segments Covered

By Batter Type, By Breader Type, By Application, By End User, and By Region

Regions covered

North America, South America, Europe, Asia Pacific, and Rest of the World

Companies studied

ADM (US)

Kerry Group Plc (Ireland)

Associated British Foods plc (UK)

Cargill, Incorporated (US)

Ingredion (US)

McCormick & Company, Inc. (US)

Showa Sangyo Co., Ltd. (Japan)

Bunge Limited (US)

House-Autry Mills (US)

Newly Weds Foods (US)

Shimakyu (Thailand)

Thai Nisshin Technomic Co., Ltd (Indonesia)

Arcadia Foods (Thailand)

KyoeiFood (Thailand)

Blendex Company (US)

Bon Food Industries Sdn Bhd (Malaysia)

HelioFood (Malaysia)

BRF (Brazil)

PT Sriboga Flour Mill (Indonesia)

BRATA Produktions (Germany)

Xiamen Uprisingstar Foodstuffs Co., Ltd (China)

Zhuhai Yitong Industrial Co., Ltd (China)

PT. Primera Panca Dwima (Indonesia)

Dongguan Hongxing Foods Co., Ltd (China)

Bowman Ingredients (UK)

Report Scope

Batter & breader premixes Market:

By Batter Type
  • Adhesion batter
  • Tempura batter
  • Beer batter
  • Thick batter
  • Customized batter
By breader type
  • Crumbs & flakes
  • Dry bread crumbs
  • Fresh bread crumbs
  • Cracker crumbs
  • Others (including nuts
    and seeds)
  • Flour & starch
  • Cereals
  • Wheat
  • Rice
  • Corn
  • Others
    (include oats
    and barley)
  • Pulses
  • Blends
  • Others (include tapioca, potatoes, nuts, and seeds)
By Application
  • Meat
  • Pork
  • Chicken
  • Seafood
  • Vegetables
  • Onion rings
  • Other vegetables
  • Others
By end users
  • Food Service Restaurants
  • Quick Food Service Restaurants
  • Full-Service Restaurants
  • Offline Platforms
  • Supermarkets And Hypermarkets
  • Convenience Stores
  • Others
  • Online Platforms
By Region
  • North America
  • Europe
  • Asia Pacific
  • South America
  • Rest of the World (RoW)

Recent Developments

  • In July 2022, Ingredion (US) made investments, including the opening of a cutting-edge manufacturing facility in Shandong, China, that has more than doubled its starch production capacity in the country. Ingredion's USD 160 million capital investment to expand specialty starch production marks a significant stride toward meeting global demand for modified and clean-label starches.  This move strategically positions Ingredion to cater to the increasing demand in the Asia-Pacific region. The company's investments not only aim to expand capacity but also to enhance sustainability and reduce long-term costs.
  • In March 2023, Kerry Group plc (Ireland) inaugurated the Southern Europe Innovation Centre in Barcelona, Spain, showcasing its commitment to expanding its presence in the region, catering to customers in Spain, Portugal, Italy, and France. By leveraging the facility's cutting-edge labs and technology expertise, Kerry can accelerate the development of novel and tailored batter & breader premixes solutions for the region. This enhanced product portfolio and the ability to cater to diverse consumer tastes are likely to position Kerry as a dominant player in the South European batter & breader premixes market.
  • In June 2019, Cargill, Incorporated (US) established its inaugural innovation center in Singapore. This center is designed to assist clients in understanding and adapting to evolving market dynamics and changing consumer preferences related to taste, nutrition, and food safety. Moreover, it links Cargill's customers in the Asia Pacific area to a vast global network, comprising 10 additional innovation centers and a community of 2,000 food scientists. Cargill's existing presence in the region includes innovation centers in Beijing and Shanghai. Singapore was chosen as the location for its third center due to its strategic positioning and the government's strong commitment to establishing the country as a prominent global innovation hub. Cargill's enhanced capabilities in understanding consumer preferences and advancing food safety and nutrition align with the demands of the premixes market.

Frequently Asked Questions (FAQ):

To speak to our analyst for a discussion on the above findings, click Speak to Analyst

Exclusive indicates content/data unique to MarketsandMarkets and not available with any competitors.

INTRODUCTION
34
RESEARCH METHODOLOGY
40
EXECUTIVE SUMMARY
54
PREMIUM INSIGHTS
58
MARKET OVERVIEW
62
  • 5.1 INTRODUCTION
  • 5.2 MACROECONOMIC INDICATORS
    RISING GLOBAL POPULATION AND DIVERSE FOOD CONSUMPTION
  • 5.3 MARKET DYNAMICS
    DRIVERS
    - Rise in consumption of premium meat products
    - Inclination toward low-carb and gluten-free products
    - Rising demand for processed, prepared, and convenience food products
    - Expanding fast food industry
    RESTRAINTS
    - Volatility in raw material prices
    - Prevalence of allergies to batter & breader premix sources, such as soy and wheat
    - Stringent regulatory standards
    OPPORTUNITIES
    - Emerging markets to illustrate great potential for batter and breader premixes
    - Increase in investments in research & development for new batter and breader technologies
    CHALLENGES
    - Infrastructural and regulatory challenges in developing countries
    - Shift toward fresh food products
    - Health and nutritional concerns
INDUSTRY TRENDS
74
  • 6.1 INTRODUCTION
  • 6.2 VALUE CHAIN ANALYSIS
  • 6.3 SUPPLY CHAIN ANALYSIS
  • 6.4 PRICING ANALYSIS
    AVERAGE SELLING PRICE OF BATTER AND BREADER PREMIXES TYPES, BY KEY COMPANY
    AVERAGE SELLING PRICE OF BATTER AND BREADER PREMIXES, BY TYPE
  • 6.5 ECOSYSTEM ANALYSIS
    ECOSYSTEM VIEW
    ECOSYSTEM MAP
    - Upstream
    - Downstream
  • 6.6 TRENDS/DISRUPTIONS IMPACTING CONSUMERS’ BUSINESSES
  • 6.7 PATENT ANALYSIS
  • 6.8 TRADE ANALYSIS
  • 6.9 TARIFF AND REGULATORY LANDSCAPE
    REGULATORY BODIES, GOVERNMENT AGENCIES, AND OTHER ORGANIZATIONS
  • 6.10 REGULATORY FRAMEWORK
    INTRODUCTION
    NORTH AMERICA
    - US Food and Drug Administration (FDA)
    - Food and Agriculture Organization (FAO)
    - Canadian Food and Drug Act and Regulations
    - Mexico
    EUROPE
    ASIA PACIFIC
    - China
    - Japan
    - Australia & New Zealand
    SOUTH AMERICA
    - Brazil
    - Argentina
    - Rest of South America
    MIDDLE EAST
    - UAE
  • 6.11 TECHNOLOGY ANALYSIS
    CLEAN-LABEL INGREDIENTS
    HEALTH-CONSCIOUS OPTIONS
  • 6.12 PORTER’S FIVE FORCES ANALYSIS
    THREAT OF NEW ENTRANTS
    THREAT OF SUBSTITUTES
    BARGAINING POWER OF SUPPLIERS
    BARGAINING POWER OF BUYERS
    INTENSITY OF COMPETITIVE RIVALRY
  • 6.13 KEY CONFERENCES & EVENTS
  • 6.14 KEY STAKEHOLDERS & BUYING CRITERIA
    KEY STAKEHOLDERS IN BUYING PROCESS
    BUYING CRITERIA
  • 6.15 CASE STUDY ANALYSIS
    INGREDION ADOPTED SUSTAINABLE, CLEAN-LABEL PULSE FLOURS TO IMPROVE PRODUCT QUALITY
    KERRY DEVELOPED PRETZEL BREADCRUMB COATING SYSTEM INSPIRED BY GERMAN TRADITIONAL BAKING TECHNIQUES TO ADD CRUNCHY TEXTURE TO ITS FOOD PRODUCTS
BATTER & BREADER PREMIXES MARKET, BY BATTER TYPE
109
  • 7.1 INTRODUCTION
  • 7.2 ADHESION BATTER
    GROWING DEMAND FOR BATTERED AND BREADED MEAT AND SEAFOOD ITEMS AND RISING FAST-FOOD CHAINS TO DRIVE MARKET
  • 7.3 TEMPURA BATTER
    UNIQUE BATTER COMPOSITION, LESS OIL USAGE, AND ESCHEWING BREADCRUMBS TO DRIVE DEMAND FOR TEMPURA BATTER
  • 7.4 BEER BATTER
    NEED TO MAINTAIN LIGHTNESS OF FOOD PRODUCTS WHILE ENHANCING VOLUME TO FUEL DEMAND FOR BEER BATTER
  • 7.5 THICK BATTER
    RISING DEMAND FOR THICK BATTER IN NORTH AMERICAN SNACK FOOD INDUSTRY TO DRIVE MARKET
  • 7.6 CUSTOMIZED BATTER
    HIGH COMPETITION AMONG QUICK SERVICE RESTAURANTS TO DRIVE CONSUMPTION OF CUSTOMIZED BATTER
BATTER & BREADER PREMIXES MARKET, BY BREADER TYPE
123
  • 8.1 INTRODUCTION
  • 8.2 CRUMBS & FLAKES
    DRY BREADCRUMBS
    - Rising trend of product differentiation to fuel demand for dry breadcrumbs
    FRESH BREADCRUMBS
    - Use of fresh breadcrumbs for soft coating on fried foods or for stuffing to drive demand
    CRACKER CRUMBS
    - Cracker crumbs to be used in pre-dust applications
    OTHER CRUMBS & FLAKES
  • 8.3 FLOUR & STARCH
    CEREALS
    - Wheat
    - Rice
    - Corn
    - Other cereals
  • 8.4 PULSES
    HIGH PROTEIN AND FIBER CONTENT OF PULSES TO ADD DISTINCT FLAVOR TO COATED FOODS
  • 8.5 BLENDS
    BLENDED BREADERS MADE FROM BREADCRUMBS, CEREAL BREADERS, OR FRUIT & NUT BREADERS TO DRIVE MARKET
  • 8.6 OTHER FLOUR & STARCH TYPES
BATTER & BREADER PREMIXES MARKET, BY APPLICATION
150
  • 9.1 INTRODUCTION
  • 9.2 MEAT
    INCREASING MEAT CONSUMPTION TO DRIVE DEMAND FOR BATTER & BREADER PREMIXES
    PORK
    - Rising consumption of pork in fast-food chains in North American and European countries to drive market
    CHICKEN
    - Rising health concerns and preference for low-calorie foods to fuel consumption of chicken
  • 9.3 SEAFOOD
    INCREASING USAGE OF TEMPURA BATTER & BREADER IN SEAFOOD APPLICATIONS TO DRIVE MARKET
    CRAB
    FISH
    OTHER SEAFOOD APPLICATIONS
  • 9.4 VEGETABLES
    RISING DEMAND FOR GOURMET FRIED VEGETABLE SNACKS TO BOOST DEMAND FOR BATTER AND BREADER PREMIXES
    ONION RINGS
    - Popularity in US as restaurant snack and side dish to drive its demand
    OTHER VEGETABLES
  • 9.5 OTHER APPLICATIONS
BATTER & BREADER PREMIXES MARKET, BY END USER
179
  • 10.1 INTRODUCTION
  • 10.2 FOOD SERVICE RESTAURANTS
    QUICK SERVICE RESTAURANTS
    - Need for crunchy textures and consumers seeking convenient and delectable meals to drive market
    FULL-SERVICE RESTAURANTS
    - Need for high standards during peak hours and enhanced customer to drive demand for full-service restaurants
  • 10.3 OFFLINE PLATFORMS
    SUPERMARKETS & HYPERMARKETS
    - Supermarkets and hypermarkets to drive market with wide-ranging consumer-centric approach
    CONVENIENCE STORES
    - Convenience stores to benefit from premixes due to their simplicity of application and reduced cooking times
    OTHER OFFLINE PLATFORMS
  • 10.4 ONLINE PLATFORMS
    ONLINE PLATFORMS TO PROPEL SALE OF BATTER & BREADER PREMIXES TO GLOBAL AUDIENCE BY REVOLUTIONIZING CUSTOMER BASE
BATTER & BREADER PREMIXES MARKET, BY REGION
192
  • 11.1 INTRODUCTION
  • 11.2 NORTH AMERICA
    NORTH AMERICA: RECESSION IMPACT ANALYSIS
    US
    - Need for gluten-free, low-carb, and low-fat batter premixes to drive market
    CANADA
    - Rising immigration, increasing interest in global cuisines, and growing restaurant business to drive market
    MEXICO
    - Increasing need for processed foods at reasonable price to drive market
  • 11.3 EUROPE
    EUROPE: RECESSION IMPACT ANALYSIS
    GERMANY
    - Large consumer base, high purchasing power, hectic lifestyles, and rising demand for frozen processed foods to drive market
    UK
    - Growing consumption of meat and seafood products and rising demand for beer batter to drive market
    FRANCE
    - Rising trend of eating out and increasing tourism to drive demand for batter & breader premixes
    SPAIN
    - Increasing demand for innovation in food products and willingness to spend to fuel demand for customized batter & breader premixes
    ITALY
    - Increasing number of food service chains and growing need for convenient and ready-to-cook food products to drive market
    REST OF EUROPE
  • 11.4 ASIA PACIFIC
    ASIA PACIFIC: RECESSION IMPACT ANALYSIS
    CHINA
    - Increasing purchasing power of middle-class families, rapid urbanization, increased adoption of convenience meat and seafood products to drive market
    INDIA
    - Increasing adoption of Western cuisines and rising standards of living to propel market
    JAPAN
    - Increasing consumption of batter premixes in homemade dishes to drive market
    AUSTRALIA & NEW ZEALAND
    - Increasing shift toward ready-to-prepare meat and seafood products to propel market
    SOUTH KOREA
    - Increasing number of Western tourists and rising demand for Western flavors to propel market
    INDONESIA
    - Rising online food delivery services and increasing tourism to fuel demand for batter & breader premixes
    MALAYSIA
    - Strong poultry trade support to drive batter & breader premixes market
    REST OF ASIA PACIFIC
  • 11.5 SOUTH AMERICA
    SOUTH AMERICA: RECESSION IMPACT ANALYSIS
    BRAZIL
    - Increasing consumption of processed meat products and rising investment in meat sector to drive market
    ARGENTINA
    - Culinary shifts and growing appetite for convenience foods to fuel demand for batter & breader premixes
    REST OF SOUTH AMERICA
  • 11.6 ROW
    ROW: RECESSION IMPACT ANALYSIS
    MIDDLE EAST
    - Rising tourism and businesses and high consumption of chicken and beef products to drive market
    AFRICA
    - Diverse culinary culture and rising expansion of food service industry to propel market
COMPETITIVE LANDSCAPE
277
  • 12.1 OVERVIEW
  • 12.2 MARKET SHARE ANALYSIS FOR KEY PLAYERS
  • 12.3 STRATEGIES ADOPTED BY KET PLAYERS
  • 12.4 SEGMENTAL REVENUE ANALYSIS FOR KEY PLAYERS
  • 12.5 COMPANY EVALUATION MATRIX
    STARS
    EMERGING LEADERS
    PERVASIVE PLAYERS
    PARTICIPANTS
    COMPANY FOOTPRINT
  • 12.6 START-UP/SME EVALUATION MATRIX
    PROGRESSIVE COMPANIES
    RESPONSIVE COMPANIES
    DYNAMIC COMPANIES
    STARTING BLOCKS
    COMPETITIVE BENCHMARKING
  • 12.7 COMPETITIVE SCENARIO
    PRODUCT LAUNCHES
    DEALS
    OTHERS
COMPANY PROFILES
301
  • 13.1 INTRODUCTION
  • 13.2 KEY PLAYERS
    ADM
    - Business overview
    - Products offered
    - Recent developments
    - MnM view
    KERRY GROUP PLC
    - Business overview
    - Products offered
    - Recent developments
    - MnM view
    ASSOCIATED BRITISH FOODS PLC
    - Business overview
    - Products offered
    - Recent developments
    - MnM view
    CARGILL, INCORPORATED
    - Business overview
    - Products offered
    - Recent developments
    - MnM view
    INGREDION
    - Business overview
    - Products offered
    - Recent developments
    - MnM view
    MCCORMICK & COMPANY, INC.
    - Business overview
    - Products offered
    - Recent developments
    - MnM view
    SHOWA SANGYO CO., LTD.
    - Business overview
    - Products offered
    - Recent developments
    - MnM view
    TATE & LYLE
    - Business overview
    - Products offered
    - Recent developments
    - MnM view
    BUNGE LIMITED
    - Business overview
    - Products offered
    - Recent developments
    - MnM view
    HOUSE-AUTRY MILLS
    - Business overview
    - Products offered
    - Recent developments
    - MnM view
    NEWLY WEDS FOODS
    - Business overview
    - Products offered
    - Recent developments
    - MnM view
    SHIMAKYU
    - Business overview
    - Products offered
    - Recent developments
    - MnM view
    THAI NISSHIN TECHNOMIC CO., LTD.
    - Business overview
    - Products offered
    - Recent developments
    - MnM view
    ARCADIA FOODS
    - Business overview
    - Products offered
    - Recent developments
    - MnM view
    KYOEIFOOD
    - Business overview
    - Products offered
    - Recent developments
    - MnM view
    BLENDEX COMPANY
    - Business overview
    - Products offered
    - Recent developments
    - MnM view
  • 13.3 START-UPS/SMES
    BON FOOD INDUSTRIES SDN BHD
    - Business overview
    - Products offered
    - Recent developments
    - MnM view
    HELIOFOOD
    - Business overview
    - Products offered
    - Recent developments
    - MnM view
    BRF GLOBAL
    - Business overview
    - Products offered
    - Recent developments
    - MnM view
    PT SRIBOGA FLOUR MILL
    - Business overview
    - Products offered
    - Recent developments
    - MnM view
    BRATA PRODUKTIONS
    - Business overview
    - Products offered
    - Recent developments
    - MnM view
    XIAMEN UPRISING STAR FOODSTUFFS CO., LTD.
    ZHUHAI YITONG INDUSTRIAL CO., LTD.
    PT. PRIMERA PANCA DWIMA
    DONGGUAN HONGXING FOODS CO., LTD.
    BOWMAN INGREDIENTS
ADJACENT AND RELATED MARKETS
363
  • 14.1 INTRODUCTION
  • 14.2 LIMITATIONS
  • 14.3 FOOD COATING MARKET
    MARKET DEFINITION
    MARKET OVERVIEW
  • 14.4 PULSE FLOUR MARKET
    MARKET DEFINITION
    MARKET OVERVIEW
  • 14.5 FUNCTIONAL FLOUR MARKET
    MARKET DEFINITION
    MARKET OVERVIEW
APPENDIX
369
  • 15.1 DISCUSSION GUIDE
  • 15.2 KNOWLEDGESTORE: MARKETSANDMARKETS’ SUBSCRIPTION PORTAL
  • 15.3 CUSTOMIZATION OPTIONS
  • 15.4 RELATED REPORTS
  • 15.5 AUTHOR DETAILS
LIST OF TABLES
 
  • TABLE 1 USD EXCHANGE RATES, 2019–2022
  • TABLE 2 AVERAGE SELLING PRICE OF BATTER AND BREADER TYPES, BY KEY COMPANY, 2022 (USD/KG)
  • TABLE 3 AVERAGE SELLING PRICE OF BATTER AND BREADER PREMIXES, BY REGION, 2019–2022 (USD/KG)
  • TABLE 4 KEY PATENTS PERTAINING TO BATTER AND BREADER PREMIXES, 2022–2023
  • TABLE 5 NORTH AMERICA: LIST OF REGULATORY BODIES, GOVERNMENT AGENCIES, AND OTHER ORGANIZATIONS
  • TABLE 6 EUROPE: LIST OF REGULATORY BODIES, GOVERNMENT AGENCIES, AND OTHER ORGANIZATIONS
  • TABLE 7 ASIA PACIFIC: LIST OF REGULATORY BODIES, GOVERNMENT AGENCIES, AND OTHER ORGANIZATIONS
  • TABLE 8 SOUTH AMERICA: LIST OF REGULATORY BODIES, GOVERNMENT AGENCIES, AND OTHER ORGANIZATIONS
  • TABLE 9 REST OF THE WORLD: REGULATORY BODIES, GOVERNMENT AGENCIES, AND OTHER ORGANIZATIONS
  • TABLE 10 FOOD COATING WITH STANDARDS OF USE
  • TABLE 11 KEY CONFERENCES & EVENTS, 2023–2024
  • TABLE 12 INFLUENCE OF STAKEHOLDERS ON BUYING PROCESS FOR BATTER AND BREADER PREMIXES
  • TABLE 13 KEY BUYING CRITERIA FOR TOP BATTER AND BREADER PREMIXES
  • TABLE 14 BATTER & BREADER PREMIXES MARKET, BY BATTER TYPE, 2019–2022 (USD MILLION)
  • TABLE 15 BATTER & BREADER PREMIXES MARKET, BY BATTER TYPE, 2023–2028 (USD MILLION)
  • TABLE 16 BATTER & BREADER PREMIXES MARKET, BY BATTER TYPE, 2019–2022 (KT)
  • TABLE 17 BATTER & BREADER PREMIXES MARKET, BY BATTER TYPE, 2023–2028 (KT)
  • TABLE 18 ADHESION BATTER: BATTER & BREADER PREMIXES MARKET, BY REGION, 2019–2022 (USD MILLION)
  • TABLE 19 ADHESION BATTER: BATTER & BREADER PREMIXES MARKET, BY REGION, 2023–2028 (USD MILLION)
  • TABLE 20 ADHESION BATTER: BATTER & BREADER PREMIXES MARKET, BY REGION, 2019–2022 (KT)
  • TABLE 21 ADHESION BATTER: BATTER & BREADER PREMIXES MARKET, BY REGION, 2023–2028 (KT)
  • TABLE 22 TEMPURA BATTER: BATTER & BREADER PREMIXES MARKET, BY REGION, 2019–2022 (USD MILLION)
  • TABLE 23 TEMPURA BATTER: BATTER & BREADER PREMIXES MARKET, BY REGION, 2023–2028 (USD MILLION)
  • TABLE 24 TEMPURA BATTER: BATTER & BREADER PREMIXES MARKET, BY REGION, 2019–2022 (KT)
  • TABLE 25 TEMPURA BATTER: BATTER & BREADER PREMIXES MARKET, BY REGION, 2023–2028 (KT)
  • TABLE 26 BEER BATTER: BATTER & BREADER PREMIXES MARKET, BY REGION, 2019–2022 (USD MILLION)
  • TABLE 27 BEER BATTER: BATTER & BREADER PREMIXES MARKET, BY REGION, 2023–2028 (USD MILLION)
  • TABLE 28 BEER BATTER: BATTER & BREADER PREMIXES MARKET, BY REGION, 2019–2022 (KT)
  • TABLE 29 BEER BATTER: BATTER & BREADER PREMIXES MARKET, BY REGION, 2023–2028 (KT)
  • TABLE 30 THICK BATTER: BATTER & BREADER PREMIXES MARKET, BY REGION, 2019–2022 (USD MILLION)
  • TABLE 31 THICK BATTER: BATTER & BREADER PREMIXES MARKET, BY REGION, 2023–2028 (USD MILLION)
  • TABLE 32 THICK BATTER: BATTER & BREADER PREMIXES MARKET, BY REGION, 2019–2022 (KT)
  • TABLE 33 THICK BATTER: BATTER & BREADER PREMIXES MARKET, BY REGION, 2023–2028 (KT)
  • TABLE 34 CUSTOMIZED BATTER: BATTER & BREADER PREMIXES MARKET, BY REGION, 2019–2022 (USD MILLION)
  • TABLE 35 CUSTOMIZED BATTER: BATTER & BREADER PREMIXES MARKET, BY REGION, 2023–2028 (USD MILLION)
  • TABLE 36 CUSTOMIZED BATTER: BATTER & BREADER PREMIXES MARKET, BY REGION, 2019–2022 (KT)
  • TABLE 37 CUSTOMIZED BATTER: BATTER & BREADER PREMIXES MARKET, BY REGION, 2023–2028 (KT)
  • TABLE 38 BATTER & BREADER PREMIXES MARKET, BY BREADER TYPE, 2019–2022 (USD MILLION)
  • TABLE 39 BATTER & BREADER PREMIXES MARKET, BY BREADER TYPE, 2023–2028 (USD MILLION)
  • TABLE 40 BATTER & BREADER PREMIXES MARKET, BY BREADER TYPE, 2019–2022 (KT)
  • TABLE 41 BATTER & BREADER PREMIXES MARKET, BY BREADER TYPE, 2023–2028 (KT)
  • TABLE 42 CRUMBS & FLAKES: BATTER & BREADER PREMIXES MARKET, BY TYPE, 2019–2022 (USD MILLION)
  • TABLE 43 CRUMBS & FLAKES: BATTER & BREADER PREMIXES MARKET, BY TYPE, 2023–2028 (USD MILLION)
  • TABLE 44 CRUMBS & FLAKES: BATTER & BREADER PREMIXES MARKET, BY TYPE, 2019–2022 (KT)
  • TABLE 45 CRUMBS & FLAKES: BATTER & BREADER PREMIXES MARKET, BY TYPE, 2023–2028 (KT)
  • TABLE 46 CRUMBS & FLAKES: BATTER & BREADER PREMIXES MARKET, BY REGION, 2019–2022 (USD MILLION)
  • TABLE 47 CRUMBS & FLAKES: BATTER & BREADER PREMIXES MARKET, BY REGION, 2023–2028 (USD MILLION)
  • TABLE 48 CRUMBS & FLAKES: BATTER & BREADER PREMIXES MARKET, BY REGION, 2019–2022 (KT)
  • TABLE 49 CRUMBS & FLAKES: BATTER & BREADER PREMIXES MARKET, BY REGION, 2023–2028 (KT)
  • TABLE 50 DRY BREADCRUMBS: BATTER & BREADER PREMIXES MARKET, BY REGION, 2019–2022 (USD MILLION)
  • TABLE 51 DRY BREADCRUMBS: BATTER & BREADER PREMIXES MARKET, BY REGION, 2023–2028 (USD MILLION)
  • TABLE 52 DRY BREADCRUMBS: BATTER & BREADER PREMIXES MARKET, BY REGION, 2019–2022 (KT)
  • TABLE 53 DRY BREADCRUMBS: BATTER & BREADER PREMIXES MARKET, BY REGION, 2023–2028 (KT)
  • TABLE 54 FRESH BREADCRUMBS: BATTER & BREADER PREMIXES MARKET, BY REGION, 2019–2022 (USD MILLION)
  • TABLE 55 FRESH BREADCRUMBS: BATTER & BREADER PREMIXES MARKET, BY REGION, 2023–2028 (USD MILLION)
  • TABLE 56 FRESH BREADCRUMBS: BATTER & BREADER PREMIXES MARKET, BY REGION, 2019–2022 (KT)
  • TABLE 57 FRESH BREADCRUMBS: BATTER & BREADER PREMIXES MARKET, BY REGION, 2023–2028 (KT)
  • TABLE 58 CRACKER CRUMBS: BATTER & BREADER PREMIXES MARKET, BY REGION, 2019–2022 (USD MILLION)
  • TABLE 59 CRACKER CRUMBS: BATTER & BREADER PREMIXES MARKET, BY REGION, 2023–2028 (USD MILLION)
  • TABLE 60 CRACKER CRUMBS: BATTER & BREADER PREMIXES MARKET, BY REGION, 2019–2022 (KT)
  • TABLE 61 CRACKER CRUMBS: BATTER & BREADER PREMIXES MARKET, BY REGION, 2023–2028 (KT)
  • TABLE 62 OTHER CRUMBS & FLAKES: BATTER & BREADER PREMIXES MARKET, BY REGION, 2019–2022 (USD MILLION)
  • TABLE 63 OTHER CRUMBS & FLAKES: BATTER & BREADER PREMIXES MARKET, BY REGION, 2023–2028 (USD MILLION)
  • TABLE 64 OTHER CRUMBS & FLAKES: BATTER & BREADER PREMIXES MARKET, BY REGION, 2019–2022 (KT)
  • TABLE 65 OTHER CRUMBS & FLAKES: BATTER & BREADER PREMIXES MARKET, BY REGION, 2023–2028 (KT)
  • TABLE 66 FLOUR & STARCH: BATTER & BREADER PREMIXES MARKET, BY TYPE, 2019–2022 (USD MILLION)
  • TABLE 67 FLOUR & STARCH: BATTER & BREADER PREMIXES MARKET, BY TYPE, 2023–2028 (USD MILLION)
  • TABLE 68 FLOUR & STARCH: BATTER & BREADER PREMIXES MARKET, BY TYPE, 2019–2022 (KT)
  • TABLE 69 FLOUR & STARCH: BATTER & BREADER PREMIXES MARKET, BY TYPE, 2023–2028 (KT)
  • TABLE 70 FLOUR & STARCH: BATTER & BREADER PREMIXES MARKET, BY REGION, 2019–2022 (USD MILLION)
  • TABLE 71 FLOUR & STARCH: BATTER & BREADER PREMIXES MARKET, BY REGION, 2023–2028 (USD MILLION)
  • TABLE 72 FLOUR & STARCH: BATTER & BREADER PREMIXES MARKET, BY REGION, 2019–2022 (KT)
  • TABLE 73 FLOUR & STARCH: BATTER & BREADER PREMIXES MARKET, BY REGION, 2023–2028 (KT)
  • TABLE 74 CEREALS: BATTER & BREADER PREMIXES MARKET, BY TYPE, 2019–2022 (USD MILLION)
  • TABLE 75 CEREALS: BATTER & BREADER PREMIXES MARKET, BY TYPE, 2023–2028 (USD MILLION)
  • TABLE 76 CEREALS: BATTER & BREADER PREMIXES MARKET, BY TYPE, 2019–2022 (KT)
  • TABLE 77 CEREALS: BATTER & BREADER PREMIXES MARKET, BY TYPE, 2023–2028 (KT)
  • TABLE 78 CEREALS: BATTER & BREADER PREMIXES MARKET, BY REGION, 2019–2022 (USD MILLION)
  • TABLE 79 CEREALS: BATTER & BREADER PREMIXES MARKET, BY REGION, 2023–2028 (USD MILLION)
  • TABLE 80 CEREALS: BATTER & BREADER PREMIXES MARKET, BY REGION, 2019–2022 (KT)
  • TABLE 81 CEREALS: BATTER & BREADER PREMIXES MARKET, BY REGION, 2023–2028 (KT)
  • TABLE 82 PULSES: BATTER & BREADER PREMIXES MARKET, BY REGION, 2019–2022 (USD MILLION)
  • TABLE 83 PULSES: BATTER & BREADER PREMIXES MARKET, BY REGION, 2023–2028 (USD MILLION)
  • TABLE 84 PULSES: BATTER & BREADER PREMIXES MARKET, BY REGION, 2019–2022 (KT)
  • TABLE 85 PULSES: BATTER & BREADER PREMIXES MARKET, BY REGION, 2023–2028 (KT)
  • TABLE 86 BLENDS: BATTER & BREADER PREMIXES MARKET, BY REGION, 2019–2022 (USD MILLION)
  • TABLE 87 BLENDS: BATTER & BREADER PREMIXES MARKET, BY REGION, 2023–2028 (USD MILLION)
  • TABLE 88 BLENDS: BATTER & BREADER PREMIXES MARKET, BY REGION, 2019–2022 (KT)
  • TABLE 89 BLENDS: BATTER & BREADER PREMIXES MARKET, BY REGION, 2023–2028 (KT)
  • TABLE 90 OTHER FLOUR & STARCH TYPES: BATTER & BREADER PREMIXES MARKET, BY REGION, 2019–2022 (USD MILLION)
  • TABLE 91 OTHER FLOUR & STARCH TYPES: BATTER & BREADER PREMIXES MARKET, BY REGION, 2023–2028 (USD MILLION)
  • TABLE 92 OTHER FLOUR & STARCH TYPES: BATTER & BREADER PREMIXES MARKET, BY REGION, 2019–2022 (KT)
  • TABLE 93 OTHER FLOUR & STARCH TYPES: BATTER & BREADER PREMIXES MARKET, BY REGION, 2023–2028 (KT)
  • TABLE 94 BATTER & BREADER PREMIXES MARKET, BY APPLICATION, 2019–2022 (USD MILLION)
  • TABLE 95 BATTER & BREADER PREMIXES MARKET, BY APPLICATION, 2023–2028 (USD MILLION)
  • TABLE 96 BATTER & BREADER PREMIXES MARKET, BY APPLICATION, 2019–2022 (KT)
  • TABLE 97 BATTER & BREADER PREMIXES MARKET, BY APPLICATION, 2023–2028 (KT)
  • TABLE 98 MEAT: BATTER & BREADER PREMIXES MARKET, BY TYPE, 2019–2022 (USD MILLION)
  • TABLE 99 MEAT: BATTER & BREADER PREMIXES MARKET, BY TYPE, 2023–2028 (USD MILLION)
  • TABLE 100 MEAT: BATTER & BREADER PREMIXES MARKET, BY TYPE, 2019–2022 (KT)
  • TABLE 101 MEAT: BATTER & BREADER PREMIXES MARKET, BY TYPE, 2023–2028 (KT)
  • TABLE 102 MEAT: BATTER & BREADER PREMIXES MARKET, BY REGION, 2019–2022 (USD MILLION)
  • TABLE 103 MEAT: BATTER & BREADER PREMIXES MARKET, BY REGION, 2023–2028 (USD MILLION)
  • TABLE 104 MEAT: BATTER & BREADER PREMIXES MARKET, BY REGION, 2019–2022 (KT)
  • TABLE 105 MEAT: BATTER & BREADER PREMIXES MARKET, BY REGION, 2023–2028 (KT)
  • TABLE 106 PORK: BATTER & BREADER PREMIXES MARKET, BY REGION, 2019–2022 (USD MILLION)
  • TABLE 107 PORK: BATTER & BREADER PREMIXES MARKET, BY REGION, 2023–2028 (USD MILLION)
  • TABLE 108 PORK: BATTER & BREADER PREMIXES MARKET, BY REGION, 2019–2022 (KT)
  • TABLE 109 PORK: BATTER & BREADER PREMIXES MARKET, BY REGION, 2023–2028 (KT)
  • TABLE 110 CHICKEN: BATTER & BREADER PREMIXES MARKET, BY REGION, 2019–2022 (USD MILLION)
  • TABLE 111 CHICKEN: BATTER & BREADER PREMIXES MARKET, BY REGION, 2023–2028 (USD MILLION)
  • TABLE 112 CHICKEN: BATTER & BREADER PREMIXES MARKET, BY REGION, 2019–2022 (KT)
  • TABLE 113 CHICKEN: BATTER & BREADER PREMIXES MARKET, BY REGION, 2023–2028 (KT)
  • TABLE 114 SEAFOOD: BATTER & BREADER PREMIXES MARKET, BY TYPE, 2019–2022 (USD MILLION)
  • TABLE 115 SEAFOOD: BATTER & BREADER PREMIXES MARKET, BY TYPE, 2023–2028 (USD MILLION)
  • TABLE 116 SEAFOOD: BATTER & BREADER PREMIXES MARKET, BY TYPE, 2019–2022 (KT)
  • TABLE 117 SEAFOOD: BATTER & BREADER PREMIXES MARKET, BY TYPE, 2023–2028 (KT)
  • TABLE 118 SEAFOOD: BATTER & BREADER PREMIXES MARKET, BY REGION, 2019–2022 (USD MILLION)
  • TABLE 119 SEAFOOD: BATTER & BREADER PREMIXES MARKET, BY REGION, 2023–2028 (USD MILLION)
  • TABLE 120 SEAFOOD: BATTER & BREADER PREMIXES MARKET, BY REGION, 2019–2022 (KT)
  • TABLE 121 SEAFOOD: BATTER & BREADER PREMIXES MARKET, BY REGION, 2023–2028 (KT)
  • TABLE 122 CRAB: BATTER & BREADER PREMIXES MARKET, BY REGION, 2019–2022 (USD MILLION)
  • TABLE 123 CRAB: BATTER & BREADER PREMIXES MARKET, BY REGION, 2023–2028 (USD MILLION)
  • TABLE 124 CRAB: BATTER & BREADER PREMIXES MARKET, BY REGION, 2019–2022 (KT)
  • TABLE 125 CARB: BATTER & BREADER PREMIXES MARKET, BY REGION, 2023–2028 (KT)
  • TABLE 126 FISH: BATTER & BREADER PREMIXES MARKET, BY REGION, 2019–2022 (USD MILLION)
  • TABLE 127 FISH: BATTER & BREADER PREMIXES MARKET, BY REGION, 2023–2028 (USD MILLION)
  • TABLE 128 FISH: BATTER & BREADER PREMIXES MARKET, BY REGION, 2019–2022 (KT)
  • TABLE 129 FISH: BATTER & BREADER PREMIXES MARKET, BY REGION, 2023–2028 (KT)
  • TABLE 130 OTHER SEAFOOD APPLICATIONS: BATTER & BREADER PREMIXES MARKET, BY REGION, 2019–2022 (USD MILLION)
  • TABLE 131 OTHER SEAFOOD APPLICATIONS: BATTER & BREADER PREMIXES MARKET, BY REGION, 2023–2028 (USD MILLION)
  • TABLE 132 OTHER SEAFOOD APPLICATIONS: BATTER & BREADER PREMIXES MARKET, BY REGION, 2019–2022 (KT)
  • TABLE 133 OTHER SEAFOOD APPLICATIONS: BATTER & BREADER PREMIXES MARKET, BY REGION, 2023–2028 (KT)
  • TABLE 134 VEGETABLES: BATTER & BREADER PREMIXES MARKET, BY TYPE, 2019–2022 (USD MILLION)
  • TABLE 135 VEGETABLES: BATTER & BREADER PREMIXES MARKET, BY TYPE, 2023–2028 (USD MILLION)
  • TABLE 136 VEGETABLES: BATTER & BREADER PREMIXES MARKET, BY TYPE, 2019–2022 (KT)
  • TABLE 137 VEGETABLES: BATTER & BREADER PREMIXES MARKET, BY TYPE, 2023–2028 (KT)
  • TABLE 138 VEGETABLES: BATTER & BREADER PREMIXES MARKET, BY REGION, 2019–2022 (USD MILLION)
  • TABLE 139 VEGETABLES: BATTER & BREADER PREMIXES MARKET, BY REGION, 2023–2028 (USD MILLION)
  • TABLE 140 VEGETABLES: BATTER & BREADER PREMIXES MARKET, BY REGION, 2019–2022 (KT)
  • TABLE 141 VEGETABLES: BATTER & BREADER PREMIXES MARKET, BY REGION, 2023–2028 (KT)
  • TABLE 142 ONION RINGS: BATTER & BREADER PREMIXES MARKET, BY REGION, 2019–2022 (USD MILLION)
  • TABLE 143 ONION RINGS: BATTER & BREADER PREMIXES MARKET, BY REGION, 2023–2028 (USD MILLION)
  • TABLE 144 ONION RINGS: BATTER & BREADER PREMIXES MARKET, BY REGION, 2019–2022 (KT)
  • TABLE 145 ONION RINGS: BATTER & BREADER PREMIXES MARKET, BY REGION, 2023–2028 (KT)
  • TABLE 146 OTHER VEGETABLES: BATTER & BREADER PREMIXES MARKET, BY REGION, 2019–2022 (USD MILLION)
  • TABLE 147 OTHER VEGETABLES: BATTER & BREADER PREMIXES MARKET, BY REGION, 2023–2028 (USD MILLION)
  • TABLE 148 OTHER VEGETABLES: BATTER & BREADER PREMIXES MARKET, BY REGION, 2019–2022 (KT)
  • TABLE 149 OTHER VEGETABLES: BATTER & BREADER PREMIXES MARKET, BY REGION, 2023–2028 (KT)
  • TABLE 150 OTHER APPLICATIONS: BATTER & BREADER PREMIXES MARKET, BY REGION, 2019–2022 (USD MILLION)
  • TABLE 151 OTHER APPLICATIONS: BATTER & BREADER PREMIXES MARKET, BY REGION, 2023–2028 (USD MILLION)
  • TABLE 152 OTHER APPLICATIONS: BATTER & BREADER PREMIXES MARKET, BY REGION, 2019–2022 (KT)
  • TABLE 153 OTHER APPLICATIONS: BATTER & BREADER PREMIXES MARKET, BY REGION, 2023–2028 (KT)
  • TABLE 154 BATTER & BREADER PREMIXES MARKET, BY END USER, 2019–2022 (USD MILLION)
  • TABLE 155 BATTER & BREADER PREMIXES MARKET, BY END USER, 2023–2028 (USD MILLION)
  • TABLE 156 FOOD SERVICE RESTAURANTS: BATTER & BREADER PREMIXES MARKET, BY REGION, 2019–2022 (USD MILLION)
  • TABLE 157 FOOD SERVICE RESTAURANTS: BATTER & BREADER PREMIXES MARKET, BY REGION, 2023–2028 (USD MILLION)
  • TABLE 158 FOOD SERVICE RESTAURANTS: BATTER & BREADER PREMIXES MARKET, BY TYPE, 2019–2022 (USD MILLION)
  • TABLE 159 FOOD SERVICE RESTAURANTS: BATTER & BREADER PREMIXES MARKET, BY TYPE, 2023–2028 (USD MILLION)
  • TABLE 160 QUICK-SERVICE RESTAURANTS: BATTER & BREADER PREMIXES MARKET, BY REGION, 2019–2022 (USD MILLION)
  • TABLE 161 QUICK-SERVICE RESTAURANTS: BATTER & BREADER PREMIXES MARKET, BY REGION, 2023–2028 (USD MILLION)
  • TABLE 162 FULL-SERVICE RESTAURANTS: BATTER & BREADER PREMIXES MARKET, BY REGION, 2019–2022 (USD MILLION)
  • TABLE 163 FULL-SERVICE RESTAURANTS: BATTER & BREADER PREMIXES MARKET, BY REGION, 2023–2028 (USD MILLION)
  • TABLE 164 OFFLINE PLATFORMS: BATTER & BREADER PREMIXES MARKET, BY REGION, 2019–2022 (USD MILLION)
  • TABLE 165 OFFLINE PLATFORMS: BATTER & BREADER PREMIXES MARKET, BY REGION, 2023–2028 (USD MILLION)
  • TABLE 166 OFFLINE PLATFORMS: BATTER & BREADER PREMIXES MARKET, BY TYPE, 2019–2022 (USD MILLION)
  • TABLE 167 OFFLINE PLATFORMS: BATTER & BREADER PREMIXES MARKET, BY TYPE, 2023–2028 (USD MILLION)
  • TABLE 168 SUPERMARKETS & HYPERMARKETS: BATTER & BREADER PREMIXES MARKET, BY REGION, 2019–2022 (USD MILLION)
  • TABLE 169 SUPERMARKETS & HYPERMARKETS: BATTER & BREADER PREMIXES MARKET, BY REGION, 2023–2028 (USD MILLION)
  • TABLE 170 CONVENIENCE STORES: BATTER & BREADER PREMIXES MARKET, BY REGION, 2019–2022 (USD MILLION)
  • TABLE 171 CONVENIENCE STORES: BATTER & BREADER PREMIXES MARKET, BY REGION, 2023–2028 (USD MILLION)
  • TABLE 172 OTHER OFFLINE PLATFORMS: BATTER & BREADER PREMIXES MARKET, BY REGION, 2019–2022 (USD MILLION)
  • TABLE 173 OTHER OFFLINE PLATFORMS: BATTER & BREADER PREMIXES MARKET, BY REGION, 2023–2028 (USD MILLION)
  • TABLE 174 ONLINE PLATFORMS: BATTER & BREADER PREMIXES MARKET, BY REGION, 2019–2022 (USD MILLION)
  • TABLE 175 ONLINE PLATFORMS: BATTER & BREADER PREMIXES MARKET, BY REGION, 2023–2028 (USD MILLION)
  • TABLE 176 BATTER & BREADER PREMIXES MARKET, BY REGION, 2019–2022 (USD MILLION)
  • TABLE 177 BATTER & BREADER PREMIXES MARKET, BY REGION, 2023–2028 (USD MILLION)
  • TABLE 178 BATTER & BREADER PREMIXES MARKET, BY REGION, 2019–2022 (KT)
  • TABLE 179 BATTER & BREADER PREMIXES MARKET, BY REGION, 2023–2028 (KT)
  • TABLE 180 NORTH AMERICA: BATTER & BREADER PREMIXES MARKET, BY COUNTRY, 2019–2022 (USD MILLION)
  • TABLE 181 NORTH AMERICA: BATTER & BREADER PREMIXES MARKET, BY COUNTRY, 2023–2028 (USD MILLION)
  • TABLE 182 NORTH AMERICA: BATTER & BREADER PREMIXES MARKET, BY COUNTRY, 2019–2022 (KT)
  • TABLE 183 NORTH AMERICA: BATTER & BREADER PREMIXES MARKET, BY COUNTRY, 2023–2028 (KT)
  • TABLE 184 NORTH AMERICA: BATTER & BREADER PREMIXES MARKET, BY BATTER TYPE, 2019–2022 (USD MILLION)
  • TABLE 185 NORTH AMERICA: BATTER & BREADER PREMIXES MARKET, BY BATTER TYPE, 2023–2028 (USD MILLION)
  • TABLE 186 NORTH AMERICA: BATTER & BREADER PREMIXES MARKET, BY BATTER TYPE, 2019–2022 (KT)
  • TABLE 187 NORTH AMERICA: BATTER & BREADER PREMIXES MARKET, BY BATTER TYPE, 2023–2028 (KT)
  • TABLE 188 NORTH AMERICA: BATTER & BREADER PREMIXES MARKET, BY BREADER TYPE, 2019–2022 (USD MILLION)
  • TABLE 189 NORTH AMERICA: BATTER & BREADER PREMIXES MARKET, BY BREADER TYPE, 2023–2028 (USD MILLION)
  • TABLE 190 NORTH AMERICA: BATTER & BREADER PREMIXES MARKET, BY BREADER TYPE, 2019–2022 (KT)
  • TABLE 191 NORTH AMERICA: BATTER & BREADER PREMIXES MARKET, BY BREADER TYPE, 2023–2028 (KT)
  • TABLE 192 NORTH AMERICA: BATTER & BREADER PREMIXES MARKET, BY APPLICATION, 2019–2022 (USD MILLION)
  • TABLE 193 NORTH AMERICA: BATTER & BREADER PREMIXES MARKET, BY APPLICATION, 2023–2028 (USD MILLION)
  • TABLE 194 NORTH AMERICA: BATTER & BREADER PREMIXES MARKET, BY APPLICATION, 2019–2022 (KT)
  • TABLE 195 NORTH AMERICA: BATTER & BREADER PREMIXES MARKET, BY APPLICATION, 2023–2028 (KT)
  • TABLE 196 NORTH AMERICA: BATTER & BREADER PREMIXES MARKET, BY END USER, 2019–2022 (USD MILLION)
  • TABLE 197 NORTH AMERICA: BATTER & BREADER PREMIXES MARKET, BY END USER, 2023–2028 (USD MILLION)
  • TABLE 198 US: BATTER & BREADER PREMIXES MARKET, BY APPLICATION, 2019–2022 (USD MILLION)
  • TABLE 199 US: BATTER & BREADER PREMIXES MARKET, BY APPLICATION, 2023–2028 (USD MILLION)
  • TABLE 200 US: BATTER & BREADER PREMIXES MARKET, BY APPLICATION, 2019–2022 (KT)
  • TABLE 201 US: BATTER & BREADER PREMIXES MARKET, BY APPLICATION, 2023–2028 (KT)
  • TABLE 202 CANADA: BATTER & BREADER PREMIXES MARKET, BY APPLICATION, 2019–2022 (USD MILLION)
  • TABLE 203 CANADA: BATTER & BREADER PREMIXES MARKET, BY APPLICATION, 2023–2028 (USD MILLION)
  • TABLE 204 CANADA: BATTER & BREADER PREMIXES MARKET, BY APPLICATION, 2019–2022 (KT)
  • TABLE 205 CANADA: BATTER & BREADER PREMIXES MARKET, BY APPLICATION, 2023–2028 (KT)
  • TABLE 206 MEXICO: BATTER & BREADER PREMIXES MARKET, BY APPLICATION, 2019–2022 (USD MILLION)
  • TABLE 207 MEXICO: BATTER & BREADER PREMIXES MARKET, BY APPLICATION, 2023–2028 (USD MILLION)
  • TABLE 208 MEXICO: BATTER & BREADER PREMIXES MARKET, BY APPLICATION, 2019–2022 (KT)
  • TABLE 209 MEXICO: BATTER & BREADER PREMIXES MARKET, BY APPLICATION, 2023–2028 (KT)
  • TABLE 210 EUROPE: BATTER & BREADER PREMIXES MARKET, BY COUNTRY, 2019–2022 (USD MILLION)
  • TABLE 211 EUROPE: BATTER & BREADER PREMIXES MARKET, BY COUNTRY, 2023–2028 (USD MILLION)
  • TABLE 212 EUROPE: BATTER & BREADER PREMIXES MARKET, BY COUNTRY, 2019–2022 (KT)
  • TABLE 213 EUROPE: BATTER & BREADER PREMIXES MARKET, BY COUNTRY, 2023–2028 (KT)
  • TABLE 214 EUROPE: BATTER & BREADER PREMIXES MARKET, BY BATTER TYPE, 2019–2022 (USD MILLION)
  • TABLE 215 EUROPE: BATTER & BREADER PREMIXES MARKET, BY BATTER TYPE, 2023–2028 (USD MILLION)
  • TABLE 216 EUROPE: BATTER & BREADER PREMIXES MARKET, BY BATTER TYPE, 2019–2022 (KT)
  • TABLE 217 EUROPE: BATTER & BREADER PREMIXES MARKET, BY BATTER TYPE, 2023–2028 (KT)
  • TABLE 218 EUROPE: BATTER & BREADER PREMIXES MARKET, BY BREADER TYPE, 2019–2022 (USD MILLION)
  • TABLE 219 EUROPE: BATTER & BREADER PREMIXES MARKET, BY BREADER TYPE, 2023–2028 (USD MILLION)
  • TABLE 220 EUROPE: BATTER & BREADER PREMIXES MARKET, BY BREADER TYPE, 2019–2022 (KT)
  • TABLE 221 EUROPE: BATTER & BREADER PREMIXES MARKET, BY BREADER TYPE, 2023–2028 (KT)
  • TABLE 222 EUROPE: BATTER & BREADER PREMIXES MARKET, BY APPLICATION, 2019–2022 (USD MILLION)
  • TABLE 223 EUROPE: BATTER & BREADER PREMIXES MARKET, BY APPLICATION, 2023–2028 (USD MILLION)
  • TABLE 224 EUROPE: BATTER & BREADER PREMIXES MARKET, BY APPLICATION, 2019–2022 (KT)
  • TABLE 225 EUROPE: BATTER & BREADER PREMIXES MARKET, BY APPLICATION, 2023–2028 (KT)
  • TABLE 226 EUROPE: BATTER & BREADER PREMIXES MARKET, BY END USER, 2019–2022 (USD MILLION)
  • TABLE 227 EUROPE: BATTER & BREADER PREMIXES MARKET, BY END USER, 2023–2028 (USD MILLION)
  • TABLE 228 GERMANY: BATTER & BREADER PREMIXES MARKET, BY APPLICATION, 2019–2022 (USD MILLION)
  • TABLE 229 GERMANY: BATTER & BREADER PREMIXES MARKET, BY APPLICATION, 2023–2028 (USD MILLION)
  • TABLE 230 GERMANY: BATTER & BREADER PREMIXES MARKET, BY APPLICATION, 2019–2022 (KT)
  • TABLE 231 GERMANY: BATTER & BREADER PREMIXES MARKET, BY APPLICATION, 2023–2028 (KT)
  • TABLE 232 UK: BATTER & BREADER PREMIXES MARKET, BY APPLICATION, 2019–2022 (USD MILLION)
  • TABLE 233 UK: BATTER & BREADER PREMIXES MARKET, BY APPLICATION, 2023–2028 (USD MILLION)
  • TABLE 234 UK: BATTER & BREADER PREMIXES MARKET, BY APPLICATION, 2019–2022 (KT)
  • TABLE 235 UK: BATTER & BREADER PREMIXES MARKET, BY APPLICATION, 2023–2028 (KT)
  • TABLE 236 FRANCE: BATTER & BREADER PREMIXES MARKET, BY APPLICATION, 2019–2022 (USD MILLION)
  • TABLE 237 FRANCE: BATTER & BREADER PREMIXES MARKET, BY APPLICATION, 2023–2028 (USD MILLION)
  • TABLE 238 FRANCE: BATTER & BREADER PREMIXES MARKET, BY APPLICATION, 2019–2022 (KT)
  • TABLE 239 FRANCE: BATTER & BREADER PREMIXES MARKET, BY APPLICATION, 2023–2028 (KT)
  • TABLE 240 SPAIN: BATTER & BREADER PREMIXES MARKET, BY APPLICATION, 2019–2022 (USD MILLION)
  • TABLE 241 SPAIN: BATTER & BREADER PREMIXES MARKET, BY APPLICATION, 2023–2028 (USD MILLION)
  • TABLE 242 SPAIN: BATTER & BREADER PREMIXES MARKET, BY APPLICATION, 2019–2022 (KT)
  • TABLE 243 SPAIN: BATTER & BREADER PREMIXES MARKET, BY APPLICATION, 2023–2028 (KT)
  • TABLE 244 ITALY: BATTER & BREADER PREMIXES MARKET, BY APPLICATION, 2019–2022 (USD MILLION)
  • TABLE 245 ITALY: BATTER & BREADER PREMIXES MARKET, BY APPLICATION, 2023–2028 (USD MILLION)
  • TABLE 246 ITALY: BATTER & BREADER PREMIXES MARKET, BY APPLICATION, 2019–2022 (KT)
  • TABLE 247 ITALY: BATTER & BREADER PREMIXES MARKET, BY APPLICATION, 2023–2028 (KT)
  • TABLE 248 REST OF EUROPE: BATTER & BREADER PREMIXES MARKET, BY APPLICATION, 2019–2022 (USD MILLION)
  • TABLE 249 REST OF EUROPE: BATTER & BREADER PREMIXES MARKET, BY APPLICATION, 2023–2028 (USD MILLION)
  • TABLE 250 REST OF EUROPE: BATTER & BREADER PREMIXES MARKET, BY APPLICATION, 2019–2022 (KT)
  • TABLE 251 REST OF EUROPE: BATTER & BREADER PREMIXES MARKET, BY APPLICATION, 2023–2028 (KT)
  • TABLE 252 ASIA PACIFIC: BATTER & BREADER PREMIXES MARKET, BY COUNTRY, 2019–2022 (USD MILLION)
  • TABLE 253 ASIA PACIFIC: BATTER & BREADER PREMIXES MARKET, BY COUNTRY, 2023–2028 (USD MILLION)
  • TABLE 254 ASIA PACIFIC: BATTER & BREADER PREMIXES MARKET, BY COUNTRY, 2019–2022 (KT)
  • TABLE 255 ASIA PACIFIC: BATTER & BREADER PREMIXES MARKET, BY COUNTRY, 2023–2028 (KT)
  • TABLE 256 ASIA PACIFIC: BATTER & BREADER PREMIXES MARKET, BY BATTER TYPE, 2019–2022 (USD MILLION)
  • TABLE 257 ASIA PACIFIC: BATTER & BREADER PREMIXES MARKET, BY BATTER TYPE, 2023–2028 (USD MILLION)
  • TABLE 258 ASIA PACIFIC: BATTER & BREADER PREMIXES MARKET, BY BATTER TYPE, 2019–2022 (KT)
  • TABLE 259 ASIA PACIFIC: BATTER & BREADER PREMIXES MARKET, BY BATTER TYPE, 2023–2028 (KT)
  • TABLE 260 ASIA PACIFIC: BATTER & BREADER PREMIXES MARKET, BY BREADER TYPE, 2019–2022 (USD MILLION)
  • TABLE 261 ASIA PACIFIC: BATTER & BREADER PREMIXES MARKET, BY BREADER TYPE, 2023–2028 (USD MILLION)
  • TABLE 262 ASIA PACIFIC: BATTER & BREADER PREMIXES MARKET, BY BREADER TYPE, 2019–2022 (KT)
  • TABLE 263 ASIA PACIFIC: BATTER & BREADER PREMIXES MARKET, BY BREADER TYPE, 2023–2028 (KT)
  • TABLE 264 ASIA PACIFIC: BATTER & BREADER PREMIXES MARKET, BY APPLICATION, 2019–2022 (USD MILLION)
  • TABLE 265 ASIA PACIFIC: BATTER & BREADER PREMIXES MARKET, BY APPLICATION, 2023–2028 (USD MILLION)
  • TABLE 266 ASIA PACIFIC: BATTER & BREADER PREMIXES MARKET, BY APPLICATION, 2019–2022 (KT)
  • TABLE 267 ASIA PACIFIC: BATTER & BREADER PREMIXES MARKET, BY APPLICATION, 2023–2028 (KT)
  • TABLE 268 ASIA PACIFIC: BATTER & BREADER PREMIXES MARKET, BY END USER, 2019–2022 (USD MILLION)
  • TABLE 269 ASIA PACIFIC: BATTER & BREADER PREMIXES MARKET, BY END USER, 2023–2028 (USD MILLION)
  • TABLE 270 CHINA: BATTER & BREADER PREMIXES MARKET, BY APPLICATION, 2019–2022 (USD MILLION)
  • TABLE 271 CHINA: BATTER & BREADER PREMIXES MARKET, BY APPLICATION, 2023–2028 (USD MILLION)
  • TABLE 272 CHINA: BATTER & BREADER PREMIXES MARKET, BY APPLICATION, 2019–2022 (KT)
  • TABLE 273 CHINA: BATTER & BREADER PREMIXES MARKET, BY APPLICATION, 2023–2028 (KT)
  • TABLE 274 INDIA: BATTER & BREADER PREMIXES MARKET, BY APPLICATION, 2019–2022 (USD MILLION)
  • TABLE 275 INDIA: BATTER & BREADER PREMIXES MARKET, BY APPLICATION, 2023–2028 (USD MILLION)
  • TABLE 276 INDIA: BATTER & BREADER PREMIXES MARKET, BY APPLICATION, 2019–2022 (KT)
  • TABLE 277 INDIA: BATTER & BREADER PREMIXES MARKET, BY APPLICATION, 2023–2028 (KT)
  • TABLE 278 JAPAN: BATTER & BREADER PREMIXES MARKET, BY APPLICATION, 2019–2022 (USD MILLION)
  • TABLE 279 JAPAN: BATTER & BREADER PREMIXES MARKET, BY APPLICATION, 2023–2028 (USD MILLION)
  • TABLE 280 JAPAN: BATTER & BREADER PREMIXES MARKET, BY APPLICATION, 2019–2022 (KT)
  • TABLE 281 JAPAN: BATTER & BREADER PREMIXES MARKET, BY APPLICATION, 2023–2028 (KT)
  • TABLE 282 AUSTRALIA AND NEW ZEALAND: BATTER & BREADER PREMIXES MARKET, BY APPLICATION, 2019–2022 (USD MILLION)
  • TABLE 283 AUSTRALIA AND NEW ZEALAND: BATTER & BREADER PREMIXES MARKET, BY APPLICATION, 2023–2028 (USD MILLION)
  • TABLE 284 AUSTRALIA AND NEW ZEALAND: BATTER & BREADER PREMIXES MARKET, BY APPLICATION, 2019–2022 (KT)
  • TABLE 285 AUSTRALIA AND NEW ZEALAND: BATTER & BREADER PREMIXES MARKET, BY APPLICATION, 2023–2028 (KT)
  • TABLE 286 SOUTH KOREA: BATTER & BREADER PREMIXES MARKET, BY APPLICATION, 2019–2022 (USD MILLION)
  • TABLE 287 SOUTH KOREA: BATTER & BREADER PREMIXES MARKET, BY APPLICATION, 2023–2028 (USD MILLION)
  • TABLE 288 SOUTH KOREA: BATTER & BREADER PREMIXES MARKET, BY APPLICATION, 2019–2022 (KT)
  • TABLE 289 SOUTH KOREA: BATTER & BREADER PREMIXES MARKET, BY APPLICATION, 2023–2028 (KT)
  • TABLE 290 INDONESIA: BATTER & BREADER PREMIXES MARKET, BY APPLICATION, 2019–2022 (USD MILLION)
  • TABLE 291 INDONESIA: BATTER & BREADER PREMIXES MARKET, BY APPLICATION, 2023–2028 (USD MILLION)
  • TABLE 292 INDONESIA: BATTER & BREADER PREMIXES MARKET, BY APPLICATION, 2019–2022 (KT)
  • TABLE 293 INDONESIA: BATTER & BREADER PREMIXES MARKET, BY APPLICATION, 2023–2028 (KT)
  • TABLE 294 MALAYSIA: BATTER & BREADER PREMIXES MARKET, BY APPLICATION, 2019–2022 (USD MILLION)
  • TABLE 295 MALAYSIA: BATTER & BREADER PREMIXES MARKET, BY APPLICATION, 2023–2028 (USD MILLION)
  • TABLE 296 MALAYSIA: BATTER & BREADER PREMIXES MARKET, BY APPLICATION, 2019–2022 (KT)
  • TABLE 297 MALAYSIA: BATTER & BREADER PREMIXES MARKET, BY APPLICATION, 2023–2028 (KT)
  • TABLE 298 REST OF ASIA PACIFIC: BATTER & BREADER PREMIXES MARKET, BY APPLICATION, 2019–2022 (USD MILLION)
  • TABLE 299 REST OF ASIA PACIFIC: BATTER & BREADER PREMIXES MARKET, BY APPLICATION, 2023–2028 (USD MILLION)
  • TABLE 300 REST OF ASIA PACIFIC: BATTER & BREADER PREMIXES MARKET, BY APPLICATION, 2019–2022 (KT)
  • TABLE 301 REST OF ASIA PACIFIC: BATTER & BREADER PREMIXES MARKET, BY APPLICATION, 2023–2028 (KT)
  • TABLE 302 SOUTH AMERICA: BATTER & BREADER PREMIXES MARKET, BY COUNTRY, 2019–2022 (USD MILLION)
  • TABLE 303 SOUTH AMERICA: BATTER & BREADER PREMIXES MARKET, BY COUNTRY, 2023–2028 (USD MILLION)
  • TABLE 304 SOUTH AMERICA: BREADER PREMIXES MARKET, BY COUNTRY, 2019–2022 (KT)
  • TABLE 305 SOUTH AMERICA: BREADER PREMIXES MARKET, BY COUNTRY, 2023–2028 (KT)
  • TABLE 306 SOUTH AMERICA: BATTER & BREADER PREMIXES MARKET, BY BATTER TYPE, 2019–2022 (USD MILLION)
  • TABLE 307 SOUTH AMERICA: BATTER & BREADER PREMIXES MARKET, BY BATTER TYPE, 2023–2028 (USD MILLION)
  • TABLE 308 SOUTH AMERICA: BATTER & BREADER PREMIXES MARKET, BY BATTER TYPE, 2019–2022 (KT)
  • TABLE 309 SOUTH AMERICA: BATTER & BREADER PREMIXES MARKET, BY BATTER TYPE, 2023–2028 (KT)
  • TABLE 310 SOUTH AMERICA: BATTER & BREADER PREMIXES MARKET, BY BREADER TYPE, 2019–2022 (USD MILLION)
  • TABLE 311 SOUTH AMERICA: BATTER & BREADER PREMIXES MARKET, BY BREADER TYPE, 2023–2028 (USD MILLION)
  • TABLE 312 SOUTH AMERICA: BATTER & BREADER PREMIXES MARKET, BY BREADER TYPE, 2019–2022 (KT)
  • TABLE 313 SOUTH AMERICA: BATTER & BREADER PREMIXES MARKET, BY BREADER TYPE, 2023–2028 (KT)
  • TABLE 314 SOUTH AMERICA: BATTER & BREADER PREMIXES MARKET, BY APPLICATION, 2019–2022 (USD MILLION)
  • TABLE 315 SOUTH AMERICA: BATTER & BREADER PREMIXES MARKET, BY APPLICATION, 2023–2028 (USD MILLION)
  • TABLE 316 SOUTH AMERICA: BATTER & BREADER PREMIXES MARKET, BY APPLICATION, 2019–2022 (KT)
  • TABLE 317 SOUTH AMERICA: BATTER & BREADER PREMIXES MARKET, BY APPLICATION, 2023–2028 (KT)
  • TABLE 318 SOUTH AMERICA: BATTER & BREADER PREMIXES MARKET, BY END USER, 2019–2022 (USD MILLION)
  • TABLE 319 SOUTH AMERICA: BATTER & BREADER PREMIXES MARKET, BY END USER, 2023–2028 (USD MILLION)
  • TABLE 320 BRAZIL: BATTER & BREADER PREMIXES MARKET, BY APPLICATION, 2019–2022 (USD MILLION)
  • TABLE 321 BRAZIL: BATTER & BREADER PREMIXES MARKET, BY APPLICATION, 2023–2028 (USD MILLION)
  • TABLE 322 BRAZIL: BATTER & BREADER PREMIXES MARKET, BY APPLICATION, 2019–2022 (KT)
  • TABLE 323 BRAZIL: BATTER & BREADER PREMIXES MARKET, BY APPLICATION, 2023–2028 (KT)
  • TABLE 324 ARGENTINA: BATTER & BREADER PREMIXES MARKET, BY APPLICATION, 2019–2022 (USD MILLION)
  • TABLE 325 ARGENTINA: BATTER & BREADER PREMIXES MARKET, BY APPLICATION, 2023–2028 (USD MILLION)
  • TABLE 326 ARGENTINA: BATTER & BREADER PREMIXES MARKET, BY APPLICATION, 2019–2022 (KT)
  • TABLE 327 ARGENTINA: BATTER & BREADER PREMIXES MARKET, BY APPLICATION, 2023–2028 (KT)
  • TABLE 328 REST OF SOUTH AMERICA: BATTER & BREADER PREMIXES MARKET, BY APPLICATION, 2019–2022 (USD MILLION)
  • TABLE 329 REST OF SOUTH AMERICA: BATTER & BREADER PREMIXES MARKET, BY APPLICATION, 2023–2028 (USD MILLION)
  • TABLE 330 REST OF SOUTH AMERICA: BATTER & BREADER PREMIXES MARKET, BY APPLICATION, 2019–2022 (KT)
  • TABLE 331 REST OF SOUTH AMERICA: BATTER & BREADER PREMIXES MARKET, BY APPLICATION, 2023–2028 (KT)
  • TABLE 332 ROW: BATTER & BREADER PREMIXES MARKET, BY SUBREGION, 2019–2022 (USD MILLION)
  • TABLE 333 ROW: BATTER & BREADER PREMIXES MARKET, BY SUBREGION, 2023–2028 (USD MILLION)
  • TABLE 334 ROW: BATTER & BREADER PREMIXES MARKET, BY SUBREGION, 2019–2022 (KT)
  • TABLE 335 ROW: BATTER & BREADER PREMIXES MARKET, BY SUBREGION, 2023–2028 (KT)
  • TABLE 336 ROW: BATTER & BREADER PREMIXES MARKET, BY BATTER TYPE, 2019–2022 (USD MILLION)
  • TABLE 337 ROW: BATTER & BREADER PREMIXES MARKET, BY BATTER TYPE, 2023–2028 (USD MILLION)
  • TABLE 338 ROW: BATTER & BREADER PREMIXES MARKET, BY BATTER TYPE, 2019–2022 (KT)
  • TABLE 339 ROW: BATTER & BREADER PREMIXES MARKET, BY BATTER TYPE, 2023–2028 (KT)
  • TABLE 340 ROW: BATTER & BREADER PREMIXES MARKET, BY BREADER TYPE, 2019–2022 (USD MILLION)
  • TABLE 341 ROW: BATTER & BREADER PREMIXES MARKET, BY BREADER TYPE, 2023–2028 (USD MILLION)
  • TABLE 342 ROW: BATTER & BREADER PREMIXES MARKET, BY BREADER TYPE, 2019–2022 (KT)
  • TABLE 343 ROW: BATTER & BREADER PREMIXES MARKET, BY BREADER TYPE, 2023–2028 (KT)
  • TABLE 344 ROW: BATTER & BREADER PREMIXES MARKET, BY APPLICATION, 2019–2022 (USD MILLION)
  • TABLE 345 ROW: BATTER & BREADER PREMIXES MARKET, BY APPLICATION, 2023–2028 (USD MILLION)
  • TABLE 346 ROW: BATTER & BREADER PREMIXES MARKET, BY APPLICATION, 2019–2022 (KT)
  • TABLE 347 ROW: BATTER & BREADER PREMIXES MARKET, BY APPLICATION, 2023–2028 (KT)
  • TABLE 348 ROW: BATTER & BREADER PREMIXES MARKET, BY END USER, 2019–2022 (USD MILLION)
  • TABLE 349 ROW: BATTER & BREADER PREMIXES MARKET, BY END USER, 2023–2028 (USD MILLION)
  • TABLE 350 MIDDLE EAST: BATTER & BREADER PREMIXES MARKET, BY APPLICATION, 2019–2022 (USD MILLION)
  • TABLE 351 MIDDLE EAST: BATTER & BREADER PREMIXES MARKET, BY APPLICATION, 2023–2028 (USD MILLION)
  • TABLE 352 MIDDLE EAST: BATTER & BREADER PREMIXES MARKET, BY APPLICATION, 2019–2022 (KT)
  • TABLE 353 MIDDLE EAST: BATTER & BREADER PREMIXES MARKET, BY APPLICATION, 2023–2028 (KT)
  • TABLE 354 AFRICA: BATTER & BREADER PREMIXES MARKET, BY APPLICATION, 2019–2022 (USD MILLION)
  • TABLE 355 AFRICA: BATTER & BREADER PREMIXES MARKET, BY APPLICATION, 2023–2028 (USD MILLION)
  • TABLE 356 AFRICA: BATTER & BREADER PREMIXES MARKET, BY APPLICATION, 2019–2022 (KT)
  • TABLE 357 AFRICA: BATTER & BREADER PREMIXES MARKET, BY APPLICATION, 2023–2028 (KT)
  • TABLE 358 BATTER & BREADER PREMIXES MARKET: INTENSITY OF COMPETITIVE RIVALRY
  • TABLE 359 COMPANY FOOTPRINT, BY TYPE
  • TABLE 360 COMPANY FOOTPRINT, BY APPLICATION
  • TABLE 361 COMPANY FOOTPRINT, BY REGION
  • TABLE 362 OVERALL COMPANY FOOTPRINT
  • TABLE 363 DETAILED LIST OF START-UPS/SMES
  • TABLE 364 COMPETITIVE BENCHMARKING OF START-UPS/SMES
  • TABLE 365 BATTER & BREADER PREMIXES: DEALS, 2019–2023
  • TABLE 366 BATTER & BREADER PREMIXES: OTHERS, 2019–2023
  • TABLE 367 ADM: BUSINESS OVERVIEW
  • TABLE 368 ADM: PRODUCTS OFFERED
  • TABLE 369 ADM: DEALS
  • TABLE 370 ADM: OTHERS
  • TABLE 371 KERRY GROUP PLC: BUSINESS OVERVIEW
  • TABLE 372 KERRY GROUP PLC: PRODUCTS OFFERED
  • TABLE 373 KERRY GROUP PLC: OTHERS
  • TABLE 374 ASSOCIATED BRITISH FOODS PLC: BUSINESS OVERVIEW
  • TABLE 375 ASSOCIATED BRITISH FOODS PLC: PRODUCTS OFFERED
  • TABLE 376 ASSOCIATED BRITISH FOODS PLC: DEALS
  • TABLE 377 ASSOCIATED BRITISH FOODS PLC: OTHERS
  • TABLE 378 CARGILL, INCORPORATED: BUSINESS OVERVIEW
  • TABLE 379 CARGILL, INCORPORATED: PRODUCTS OFFERED
  • TABLE 380 CARGILL, INCORPORATED: OTHERS
  • TABLE 381 INGREDION: BUSINESS OVERVIEW
  • TABLE 382 INGREDION: PRODUCTS OFFERED
  • TABLE 383 INGREDION: OTHERS
  • TABLE 384 MCCORMICK & COMPANY, INC.: BUSINESS OVERVIEW
  • TABLE 385 MCCORMICK & COMPANY, INC.: PRODUCTS OFFERED
  • TABLE 386 MCCORMICK & COMPANY, INC.: OTHERS
  • TABLE 387 SHOWA SANGYO CO., LTD.: BUSINESS OVERVIEW
  • TABLE 388 SHOWA SANGYO CO., LTD.: PRODUCTS OFFERED
  • TABLE 389 TATE & LYLE: BUSINESS OVERVIEW
  • TABLE 390 TATE & LYLE: PRODUCTS OFFERED
  • TABLE 391 TATE & LYLE: DEALS
  • TABLE 392 TATE & LYLE: OTHERS
  • TABLE 393 BUNGE LIMITED: BUSINESS OVERVIEW
  • TABLE 394 BUNGE LIMITED: PRODUCTS OFFERED
  • TABLE 395 HOUSE-AUTRY MILLS: BUSINESS OVERVIEW
  • TABLE 396 HOUSE-AUTRY MILLS: PRODUCTS OFFERED
  • TABLE 397 NEWLY WEDS FOODS: BUSINESS OVERVIEW
  • TABLE 398 NEWLY WEDS FOODS: PRODUCTS OFFERED
  • TABLE 399 NEWLY WEDS FOODS: DEALS
  • TABLE 400 SHIMAKYU: BUSINESS OVERVIEW
  • TABLE 401 SHIMAKYU: PRODUCTS OFFERED
  • TABLE 402 THAI NISSHIN TECHNOMIC CO., LTD.: BUSINESS OVERVIEW
  • TABLE 403 THAI NISSHIN TECHNOMIC CO., LTD.: PRODUCTS OFFERED
  • TABLE 404 ARCADIA FOODS: BUSINESS OVERVIEW
  • TABLE 405 ARCADIA FOODS: PRODUCTS OFFERED
  • TABLE 406 KYOEIFOOD: BUSINESS OVERVIEW
  • TABLE 407 KYOEIFOOD: PRODUCTS OFFERED
  • TABLE 408 BLENDEX COMPANY: BUSINESS OVERVIEW
  • TABLE 409 BLENDEX COMPANY: PRODUCTS OFFERED
  • TABLE 410 BON FOOD INDUSTRIES SDN BHD: BUSINESS OVERVIEW
  • TABLE 411 BON FOOD INDUSTRIES SDN BHD: PRODUCTS OFFERED
  • TABLE 412 HELIOFOOD: BUSINESS OVERVIEW
  • TABLE 413 HELIOFOOD: PRODUCTS OFFERED
  • TABLE 414 BRF GLOBAL: BUSINESS OVERVIEW
  • TABLE 415 BRF GLOBAL: PRODUCTS OFFERED
  • TABLE 416 PT SRIBOGA FLOUR MILL: BUSINESS OVERVIEW
  • TABLE 417 PT SRIBOGA FLOUR MILL: PRODUCTS OFFERED
  • TABLE 418 BRATA PRODUKTIONS: BUSINESS OVERVIEW
  • TABLE 419 BRATA PRODUKTIONS: PRODUCTS OFFERED
  • TABLE 420 ADJACENT MARKETS TO BATTER & BREADER PREMIXES
  • TABLE 421 FOOD COATING MARKET, BY INGREDIENT TYPE, 2019–2022 (USD MILLION)
  • TABLE 422 FOOD COATING MARKET, BY INGREDIENT TYPE, 2023–2028 (USD MILLION)
  • TABLE 423 FOOD COATING MARKET, BY INGREDIENT TYPE, 2019–2022 (KT)
  • TABLE 424 FOOD COATING MARKET, BY INGREDIENT TYPE, 2023–2028 (KT)
  • TABLE 425 PULSE FLOURS MARKET, BY TYPE, 2015–2022 (MMT)
  • TABLE 426 PULSE FLOURS MARKET, BY TYPE, 2015–2022 (USD BILLION)
  • TABLE 427 FUNCTIONAL FLOURS MARKET, BY TYPE, 2014–2022 (USD BILLION)
  • TABLE 428 FUNCTIONAL FLOURS MARKET, BY TYPE, 2014–2022 (MT)
LIST OF FIGURES
 
  • FIGURE 1 RESEARCH DESIGN
  • FIGURE 2 BREAKDOWN OF PRIMARY INTERVIEWS: BY COMPANY TYPE, DESIGNATION, AND REGION
  • FIGURE 3 MARKET SIZE ESTIMATION METHODOLOGY: TOP-DOWN APPROACH
  • FIGURE 4 MARKET SIZE ESTIMATION METHODOLOGY: BOTTOM-UP APPROACH
  • FIGURE 5 DATA TRIANGULATION METHODOLOGY
  • FIGURE 6 RECESSION MACROINDICATORS
  • FIGURE 7 GLOBAL INFLATION RATE, 2011–2021
  • FIGURE 8 GLOBAL GDP, 2011–2021 (USD TRILLION)
  • FIGURE 9 RECESSION INDICATORS AND THEIR IMPACT ON BATTER & BREADER PREMIXES MARKET
  • FIGURE 10 GLOBAL BATTER & BREADER PREMIXES MARKET: EARLIER FORECAST VS. RECESSION FORECAST
  • FIGURE 11 ADHESION BATTER SEGMENT TO DOMINATE MARKET DURING FORECAST PERIOD
  • FIGURE 12 FLOUR & STARCH SEGMENT TO DOMINATE MARKET DURING FORECAST PERIOD
  • FIGURE 13 MEAT SEGMENT TO DOMINATE MARKET DURING FORECAST PERIOD
  • FIGURE 14 FOOD SERVICE RESTAURANTS SEGMENT TO DOMINATE MARKET DURING FORECAST PERIOD
  • FIGURE 15 ASIA PACIFIC TO BE FASTEST-GROWING REGION IN BATTER & BREADER PREMIXES MARKET DURING FORECAST PERIOD
  • FIGURE 16 POTENTIAL RISE IN DEMAND FOR CONVENIENCE MEAT AND SEAFOOD PRODUCTS TO DRIVE MARKET
  • FIGURE 17 ASIA PACIFIC: CHINA TO ACCOUNT FOR LARGEST MARKET SHARE IN 2023
  • FIGURE 18 MEAT APPLICATION TO ACCOUNT FOR LARGEST MARKET SIZE IN 2022
  • FIGURE 19 BATTER & BREADER PREMIXES MARKET SHARE, BY TYPE, 2023 VS. 2028
  • FIGURE 20 BATTER & BREADER PREMIXES MARKET SIZE, BY FLOUR AND STARCH TYPE, 2023 VS. 2028
  • FIGURE 21 US TO DOMINATE MARKET DURING FORECAST PERIOD
  • FIGURE 22 POPULATION GROWTH TREND, 1950–2050
  • FIGURE 23 BATTER & BREADER PREMIXES MARKET: DRIVERS, RESTRAINTS, OPPORTUNITIES, AND CHALLENGES
  • FIGURE 24 GLOBAL MEAT DEMAND, 2005 VS. 2050 (USD BILLION)
  • FIGURE 25 CHICKEN CONSUMPTION IN US: SUPERMARKETS VS. FOODSERVICE ESTABLISHMENTS, 2014–2018
  • FIGURE 26 VALUE CHAIN ANALYSIS
  • FIGURE 27 SUPPLY CHAIN MAP
  • FIGURE 28 AVERAGE SELLING PRICE OF BATTER AND BREADER PREMIXES TYPES, BY KEY COMPANY
  • FIGURE 29 AVERAGE SELLING PRICE OF BATTER TYPES, 2019–2022 (USD/KG)
  • FIGURE 30 AVERAGE SELLING PRICE OF KEY BREADER TYPES, 2019–2022 (USD/KG)
  • FIGURE 31 REVENUE SHIFT FOR BATTER & BREADER PREMIXES MARKET
  • FIGURE 32 PATENTS GRANTED, BY REGION
  • FIGURE 33 PATENTS GRANTED ANNUALLY, 2012–2022
  • FIGURE 34 EXPORT VALUE OF FLOUR AND STARCH, BY KEY COUNTRY, 2018–2022 (USD THOUSAND)
  • FIGURE 35 IMPORT VALUE OF FLOUR AND STARCH, BY KEY COUNTRY, 2018–2022 (USD THOUSAND)
  • FIGURE 36 INFLUENCE OF STAKEHOLDERS ON BUYING PROCESS
  • FIGURE 37 KEY BUYING CRITERIA FOR BATTER AND BREADER PREMIXES
  • FIGURE 38 BATTER & BREADER PREMIXES MARKET, BY BATTER TYPE, 2023 VS. 2028 (USD MILLION)
  • FIGURE 39 BATTER & BREADER PREMIXES MARKET, BY BREADER TYPE, 2023 VS. 2028 (USD MILLION)
  • FIGURE 40 VOLUME OF RICE EXPORTED, BY COUNTRY, 2019 (MILLION TONS)
  • FIGURE 41 ANNUAL GLOBAL PRODUCTION OF CORN, 2017–2019 (MMT)
  • FIGURE 42 BATTER & BREADER PREMIXES MARKET, BY APPLICATION, 2023 VS. 2028 (USD MILLION)
  • FIGURE 43 MEAT PRODUCTION IN EUROPE, 2006–2021
  • FIGURE 44 PORK CONSUMPTION, BY COUNTRY, 2012–2022 (KILOGRAMS/CAPITA)
  • FIGURE 45 ESTIMATED PER CAPITA CONSUMPTION OF FISH AND SEAFOOD BY COUNTRY, 2019 (KG)
  • FIGURE 46 BATTER & BREADER PREMIXES MARKET, BY END USER, 2023 VS. 2028 (USD MILLION)
  • FIGURE 47 BATTER & BREADER PREMIXES MARKET: GEOGRAPHIC SNAPSHOT, 2023–2028
  • FIGURE 48 NORTH AMERICA: INFLATION RATES, BY KEY COUNTRY, 2019–2021
  • FIGURE 49 NORTH AMERICA: RECESSION IMPACT ANALYSIS, 2023
  • FIGURE 50 NORTH AMERICA: BATTER & BREADER PREMIXES MARKET SNAPSHOT
  • FIGURE 51 EUROPE: ESTIMATED PER CAPITA CONSUMPTION OF FISH AND SEAFOOD BY COUNTRY, 2019–2020
  • FIGURE 52 EUROPE: INFLATION RATES, BY KEY COUNTRY, 2017–2021
  • FIGURE 53 EUROPE: RECESSION IMPACT ANALYSIS, 2023
  • FIGURE 54 ASIA PACIFIC: INFLATION RATES, BY KEY COUNTRY, 2017–2021
  • FIGURE 55 ASIA PACIFIC: RECESSION IMPACT ANALYSIS, 2023
  • FIGURE 56 ASIA PACIFIC: BATTER & BREADER PREMIXES MARKET SNAPSHOT
  • FIGURE 57 SOUTH AMERICA: INFLATION RATES, BY KEY COUNTRY, 2017–2021
  • FIGURE 58 SOUTH AMERICA: RECESSION IMPACT ANALYSIS, 2023
  • FIGURE 59 ROW: INFLATION RATES, BY KEY SUBREGION, 2017–2021
  • FIGURE 60 ROW: RECESSION IMPACT ANALYSIS, 2022–2023
  • FIGURE 61 SEGMENTAL REVENUE ANALYSIS FOR KEY PLAYERS, 2018–2022 (USD BILLION)
  • FIGURE 62 COMPANY EVALUATION MATRIX, 2022
  • FIGURE 63 START-UP/SME EVALUATION MATRIX, 2022
  • FIGURE 64 ADM: COMPANY SNAPSHOT
  • FIGURE 65 KERRY GROUP PLC: COMPANY SNAPSHOT
  • FIGURE 66 ASSOCIATED BRITISH FOODS PLC: COMPANY SNAPSHOT
  • FIGURE 67 CARGILL, INCORPORATED: COMPANY SNAPSHOT
  • FIGURE 68 INGREDION: COMPANY SNAPSHOT
  • FIGURE 69 MCCORMICK & COMPANY, INC.: COMPANY SNAPSHOT
  • FIGURE 70 SHOWA SANGYO CO., LTD.: COMPANY SNAPSHOT
  • FIGURE 71 TATE & LYLE: COMPANY SNAPSHOT
  • FIGURE 72 BUNGE LIMITED: COMPANY SNAPSHOT

This research involves the extensive use of secondary sources; directories; and databases (Bloomberg and Factiva) to identify and collect information useful for a technical, market-oriented, and commercial study of the batter & breader premixes market. In-depth interviews were conducted with various primary respondents, such as key industry participants, Subject Matter Experts (SMEs), C-level executives of key market players, and industry consultants, to obtain and verify critical qualitative and quantitative information and to assess prospects.

Secondary Research

In the secondary research process, various sources such as annual reports, press releases & investor presentations of companies, white papers, food journals, certified publications, articles from recognized authors, gold & silver standard websites, directories, and databases were referred to, to identify and collect information. Secondary research was mainly used to obtain key information about the industry’s supply chain, the total pool of key players, and market classification and segmentation as per the industry trends to the bottom-most level, regional markets, and key developments from both market- and technology-oriented perspectives.

Primary Research

In the primary research process, various sources from the supply and demand sides were interviewed to obtain qualitative and quantitative information. The primary sources from the supply side included industry experts, such as CEOs, vice presidents, marketing directors, technology and innovation directors, and related key executives from various key companies and organizations operating in the batter & breader premixes market.

After the complete market engineering (which included calculations for market statistics, market breakdown, market size estimations, market forecasting, and data triangulation), extensive primary research was conducted to gather information and to verify and validate the critical numbers arrived at. Primary research was also conducted to identify the segmentation types, industry trends, key players, and competitive landscape of batter & breader premixes supplied by different market players, key market dynamics such as drivers, restraints, opportunities, industry trends, and key player strategies.

In the complete market engineering process, top-down and bottom-up approaches were extensively used along with several data triangulation methods to conduct market estimation and forecasting for the overall segments and subsegments listed in this report. Extensive qualitative and quantitative analysis was performed on the complete market engineering process to list key information/insights throughout the report.
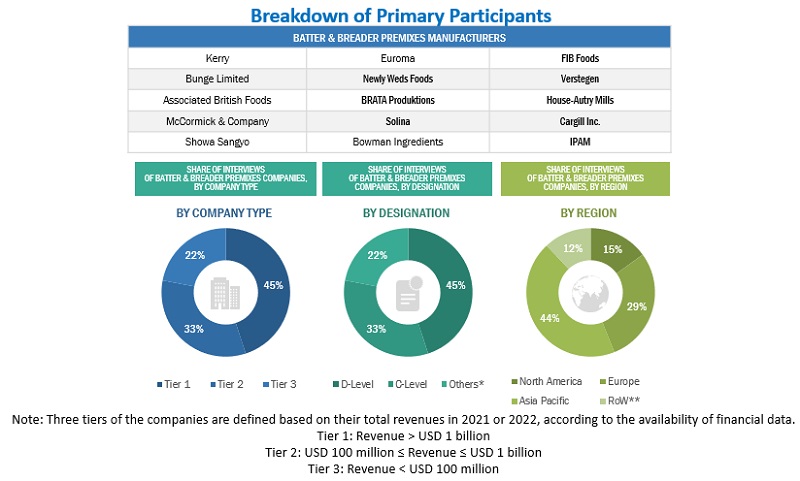
Batter & Breader Premixes Market Primary Research

To know about the assumptions considered for the study, download the pdf brochure

Market Size Estimation

Both the top-down and bottom-up approaches were used to estimate and validate the total size of the market. These approaches were also used extensively to estimate the size of various dependent submarkets. The research methodology used to estimate the market size includes the following:

  • The key players in the industry and markets were identified through extensive secondary research.
  • The industry’s supply chain and market size were determined through primary and secondary research.
  • All percentage shares, splits, and breakdowns were determined using secondary sources and verified through primary sources.
  • All possible parameters that affect the market covered in this research study were accounted for, viewed in extensive detail, verified through primary research, and analyzed to obtain the final quantitative and qualitative data.
  • The research included the study of reports, reviews, and newsletters of top market players, along with extensive interviews for key opinions from leaders such as CEOs, directors, and marketing executives.

Market size estimation: Top-Down approach

In the top-down approach, the overall market size was used to estimate the size of individual markets (mentioned in the segmentation) through percentage splits from secondary and primary research. For the calculation of each specific market segment, the most appropriate immediate parent market size was used to implement the top-down approach. The market share was then estimated for each company to verify the revenue share used earlier in the bottom-up procedure. With the data triangulation procedure and validation of data through primary, the overall parent market size and each market size were determined and confirmed. The data triangulation procedure in this study is explained in the next section.
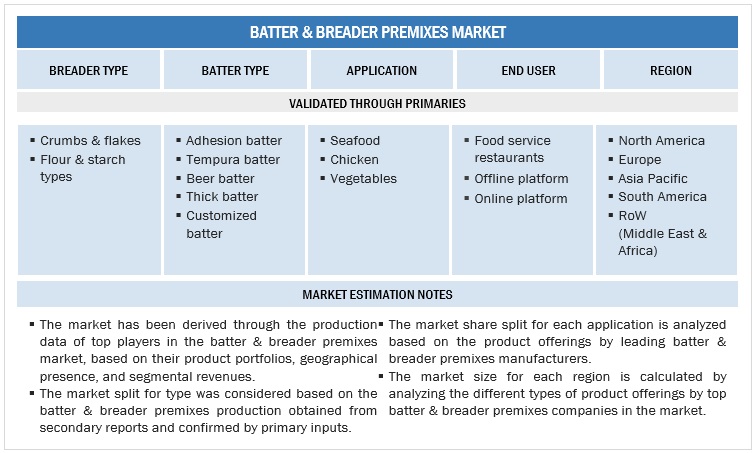
Batter & Breader Premixes Market Top-Down approach

To know about the assumptions considered for the study, Request for Free Sample Report

Market size estimation methodology: Bottom-up approach

In the bottom-up approach, each country's market size for batter & breader premixes and the types was arrived at through secondary sources, such as annual reports, investor presentations, journals, and government publications. The bottom-up procedure was also implemented on the data extracted from secondary research to validate the market segment sizes obtained.

The penetration rate of each type of batter & breader premixes in each country was calculated from secondary sources. Country-level data for batter & breader premixes were estimated based on the adoption rate of each type of batter & breader premixes within each food application. The origin of each product type was tracked via product mapping and studied for its penetration level to estimate the market size at a regional level. Each product type was studied for its commercially available form. The market size arrived at was further validated by primary respondents.
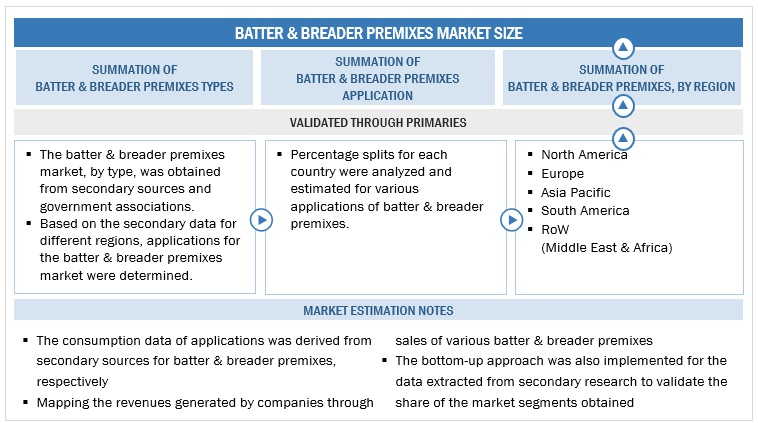
Batter & Breader Premixes Market Bottom-up approach

Data Triangulation

After arriving at the overall market size from the estimation process explained above, the total market was split into several segments. To complete the overall market engineering process and arrive at the exact statistics for all segments, data triangulation and market breakdown procedures were employed, wherever applicable. The data was triangulated by studying various factors and trends from both the demand and supply sides. In addition, the market size was validated using both top-down and bottom-up approaches. It was then verified through primary interviews. Hence, there are three approaches: first is the top-down approach, second is the bottom-up approach, with the third is expert interviews. Only when the values arrived at from the three points match, the data is assumed to be correct.

Market Definition

Batter & breader premixes are primarily used as a coating for deep-fried food products. These premixes enhance the appearance of food products and contribute to their crispy texture. Batter & breader products are suitable for seafood, chicken, and other high-value products. These premixes mainly help in retaining moisture in the final product.

The major types of batter premixes considered for the study include tempura batter, adhesion batter, beer batter, thick batter, and customized batter, while the major types of breader premixes include crumbs & flakes and flour & starch.

Key Stakeholders

  • Food product suppliers and manufacturers
  • Food product importers and exporters
  • Food product traders and distributors
  • Government and research organizations
  • Associations and industry bodies
  • World Health Organization (WHO)
  • Food and Drug Administration (FDA)
  • Institute of Food and Agricultural Sciences (IFAS)
  • Global Food & Beverage Association (GFBA)
  • National Food Safety and Quality Service (SENASA)
  • Canadian Food Inspection Agency (CFIA)
  • Center for Professional Advancement (CfPA)

Report Objectives

Market Intelligence

  • To define, segment, and estimate the size of the batter & breader premixes market with respect to its type, application, and region
  • To provide detailed information about the major factors influencing the growth of the market (drivers, restraints, opportunities, and industry-specific challenges)
  • To analyze the complete supply chain and the influence of all key stakeholders, such as manufacturers, suppliers, and end users
  • To analyze the opportunities in the market for stakeholders and provide details of the competitive landscape for market leaders
  • To profile the key players and comprehensively analyze their core competencies
  • To analyze the competitive developments, such as new product launches, acquisitions, investments, expansions, and partnerships, in the batter & breader premixes market

Competitive Intelligence

  • Profiling the key players in the batter & breader premixes market and comprehensively analyzing their market positions and core competencies
  • Providing a comparative analysis of the market leaders based on the following:
    • Product offerings
    • Business strategies
    • Strengths, weaknesses, opportunities, and threats
    • Key financials
  • Understanding the competitive landscape and identifying the major growth strategies adopted by the players across the key regions
  • Providing insights on the key investments in product innovations and patent registrations

Available Customizations:

With the given market data, MarketsandMarkets offers customizations according to company-specific scientific needs.

The following customization options are available for the report:

Product Analysis

  • Product Matrix, which gives a detailed comparison of the product portfolio of each company.

Geographic Analysis

With the given market data, MarketsandMarkets offers customizations according to company-specific scientific needs.

  • Further breakdown of the Rest of European batter & breader premixes market, by key country
  • Further breakdown of the Rest of the South American batter & breader premixes market, by key country
  • Further breakdown of the Rest of Asia Pacific batter & breader premixes market, by key country

Company Information

  • Detailed analyses and profiling of additional market players
Custom Market Research Services

We will customize the research for you, in case the report listed above does not meet with your exact requirements. Our custom research will comprehensively cover the business information you require to help you arrive at strategic and profitable business decisions.

Request Customization

Instant Answers with GPT - Ask Now!

Ask real questions. Get complete answers !
Report Code
FB 6555
Published ON
Sep, 2023
Choose License Type
BUY NOW
  • SHARE
X
Request Customization
Speak to Analyst
Speak to Analyst
OR FACE-TO-FACE MEETING
PERSONALIZE THIS RESEARCH
  • Triangulate with your Own Data
  • Get Data as per your Format and Definition
  • Gain a Deeper Dive on a Specific Application, Geography, Customer or Competitor
  • Any level of Personalization
REQUEST A FREE CUSTOMIZATION
LET US HELP YOU!
  • What are the Known and Unknown Adjacencies Impacting the Batter & Breader Premixes Market
  • What will your New Revenue Sources be?
  • Who will be your Top Customer; what will make them switch?
  • Defend your Market Share or Win Competitors
  • Get a Scorecard for Target Partners
CUSTOMIZED WORKSHOP REQUEST
knowledgestore logo

Want to explore hidden markets that can drive new revenue in Batter & Breader Premixes Market?

Find Hidden Markets
  • Call Us
  • +1-888-600-6441 (Corporate office hours)
  • +1-888-600-6441 (US/Can toll free)
  • +44-800-368-9399 (UK office hours)
CONNECT WITH US
ABOUT TRUST ONLINE
©2024 MarketsandMarkets Research Private Ltd. All rights reserved
DMCA.com Protection Status
Website Feedback