Self-driving Cars Market

Report Code AT 2090
Published in Dec, 2024, By MarketsandMarkets™
Download PDF

Choose License Type

Buy Report Now Inquire Before Buying

Self-driving Cars Market by Level of Autonomy (Semi-Autonomous (L1, L2, and L3) and Autonomous (L4 and L5), Component Type, Mobility Type (Personal Mobility and Shared Mobility), Vehicle Class (A&B, C&D, and E&F), and Region - Global Forecast to 2035


Overview

The global self-driving cars market is projected to reach 76,217 thousand units by 2035, from 37,090 thousand units in 2024, at a CAGR of 6.8%. The market is growing rapidly due to technological advancements, stringent regulations, and increased demand for safer, more convenient vehicles. Asia Pacific is the largest market for self-driving cars, with China approving Level 3 testing for NIO in December 2023 and expanding public road trials for BYD, FAW, and SAIC in 2024. Similarly, South Korea’s Vision 2030 targets citywide autonomous infrastructure by 2026, while Japan plans Level 4 deployments across 100 municipalities by 2027. Regulations such as Europe’s GSR2 (2024) and US NHTSA’s pedestrian AEB mandate (2029) further drive automakers such as Mercedes-Benz and BMW to innovate in Level 3 autonomy.

Self-driving Cars Market

Attractive Opportunities in the Self-driving Cars Market

ASIA PACIFIC

Asia Pacific is projected to lead the self-driving cars market, driven by substantial investments from OEMs and technology companies in autonomous driving systems.

Strict safety regulations like GSR2 and efforts to enhance ADAS features are speeding up the adoption of self-driving cars in Europe.

Commercialization of Level 3 autonomy and push for autonomous ride-hailing services, present lucrative opportunities for market players.

Minimizing human error and improving safety standards are the key factors driving the growth of the self-driving cars market.

The North American self-driving cars market is projected to reach 9,218 thousand units by 2035, with a CAGR of 3.0%.

Global Self-driving Cars Market Dynamics

Driver: Government regulations for integration of advanced safety technologies

Government regulations are a key driver for the self-driving cars market, necessitating the integration of advanced safety technologies. Policymakers worldwide are promoting the adoption of advanced driver assistance systems (ADAS) to reduce accidents and improve road safety. These regulations span basic safety features such as anti-lock braking to more advanced technologies, including automatic emergency braking and lane keep assist. Crash test ratings and safety assessment programs also incentivize automakers to incorporate these technologies for improved safety. For instance, the EU’s Vehicle General Safety Regulations, introduced in July 2022, focus on road safety and autonomous vehicle development, with mandates for intelligent speed assistance, driver attention warnings, and emergency stop signals in all vehicles by July 2024. Similarly, the European New Car Assessment Program (Euro NCAP) and the US National Highway Traffic Safety Administration (NHTSA) examine and rate vehicle safety performance. High safety ratings are crucial selling points for automakers, encouraging them to invest in self-driving software that guarantees compliance with safety requirements and improves vehicle safety. Together, these factors accelerate the adoption of ADAS and other autonomous technologies in the automotive industry, thereby driving the market.

Restraint: High development costs

High development costs associated with autonomous vehicles are a significant hurdle for the growth of the self-driving cars market. A fully autonomous vehicle integrates hardware, such as LiDAR, radar, high-resolution camera, and computing units, as well as software for real-time decision-making and safety. Developing these technologies requires extensive R&D, testing, and regulatory compliance, driving up costs for automakers. For instance, vehicles with Level 2+ capabilities typically incur component costs between USD 1,500 and 2,000. Meanwhile, for higher levels of autonomy (Levels 3 and 4), the costs can rise above USD 5,000 per vehicle, especially in the early rollout stages, due to the need for additional, more advanced hardware and complex software. These high costs impact both new entrants and established players, potentially slowing adoption and limiting self-driving technology to premium markets. For instance, companies such as Waymo LLC (US) and Cruise LLC (US) have collectively invested billions to advance autonomous technology. However, these costs make it challenging to reach accessible consumer price points, impacting the pace of expansion in the mainstream market, mainly as companies work to transition from costly prototypes to economically viable production models.


Opportunity: Emergence of subscription-based service offerings

Subscription-based autonomous driving solutions are emerging as promising revenue opportunities for original equipment manufacturers (OEMs) in the self-driving cars market. OEMs can generate recurring revenue by offering ADAS and other autonomous driving features through subscription models while allowing users to choose and update these features. Prominent automotive companies such as Tesla (US), Ford Motor Company (US), General Motors (US), and Mercedes-Benz Group AG (Germany) are at the forefront of this trend, offering various pricing structures for their self-driving solutions. For instance, Ford’s BlueCruise technology is free for the first 90 days on its 2024 and 2025 models, after which customers can opt for a subscription at USD 50 per month or USD 495 per year. Similarly, Mercedes’ DRIVE PILOT, one of the industry’s most advanced Level 3 systems, comes with an annual fee of USD 2,500. Alternately, General Motors takes a different approach by charging an upfront cost of USD 2,200 for Chevrolet and GMC models and USD 2,500 for Cadillacs; after a duration of three years, this converts to a USD 25 monthly or USD 250 yearly fee.

Challenges: Lack of software standardization

A lack of software standardization poses a critical challenge to the self-driving cars market, hindering the interoperability and integration of autonomous vehicle systems. Self-driving technology relies on complex sensors, data processing, AI, and real-time decision-making algorithms necessary for seamless operations across different platforms and manufacturers. However, the absence of standardized software protocols leads to fragmentation, with each automaker or technology company developing proprietary systems that may not communicate effectively with other systems. This fragmentation increases development costs, complicates collaboration, and limits the ability to adopt uniform safety and security measures across the industry. It also poses challenges to developing universal testing and validation methods for regulatory approval and public trust. For instance, software systems of companies such as Tesla (US), Waymo LLC (US), and Cruise LLC (US) create barriers to collective learning and cross-platform improvements, as each company’s software operates independently. To address this, the industry must employ collaborative efforts to establish software standards similar to the ISO and SAE standards for safety-critical automotive systems. Without these standards, the self-driving cars market may face delays and higher costs, slowing the widespread adoption of autonomous vehicles.

Global Self-driving Cars Market Ecosystem Analysis

The self-driving cars market ecosystem is a collaborative network of multiple sectors working together to enable autonomous mobility. It includes component providers such as Velodyne (US), which offers LiDAR systems, and NVIDIA Corporation (US), which supplies powerful processors to handle real-time data. Map and software providers, such as HERE (Netherlands) and Google (US), supply high-definition mapping and navigation systems for autonomous driving. Autonomous technology providers like Waymo LLC (US) and Pony.ai (US) develop AI-driven decision-making software that powers vehicle autonomy. OEMs, including Tesla (US) and Ford Motor Company (US), manufacture vehicles and integrate autonomous technology into their designs. Robotaxi and shuttle manufacturers, such as Zoox, Inc. (US) and Navya (France), create autonomous vehicles for urban shared mobility solutions. Each segment plays a distinct role, from vehicle perception to navigation and fleet deployment, all contributing to the broader self-driving cars ecosystem.

Top Companies in Self-driving Cars Market
 

Radar to be largest component segment during forecast period

Radar is expected to be the largest segment of the self-driving cars market during the forecast period, driven by its critical role in enhancing vehicle safety and supporting ADAS. It is suitable in challenging conditions such as low visibility or adverse weather, where cameras and LiDAR may face limitations. Thus, OEMs increasingly incorporate radar to improve adaptive cruise control and collision avoidance functionalities. Radar technology plays a critical role in self-driving cars, especially at higher levels of autonomy (Level 3 and beyond), providing reliable data on the vehicle’s surroundings. Short-range radar (SRR), medium-range radar (MRR), and long-range radar (LRR) are types of radars categorized by their detection range. Short-range radars detect objects up to a few hundred meters used in parking assistance and collision avoidance. Medium-range radars cover several kilometers, facilitating adaptive cruise control and lane-keeping. Long-range radars detect objects up to hundreds of kilometers, crucial for autonomous driving, weather monitoring, and defense. Vehicle models such as the Nissan Altima, Audi A4, Honda Accord, and Tesla Model S are equipped with short-range radar. Alternately, the Ford F-Series Duty Truck, Ram ProMaster, and Mercedes-Benz Sprinter models are fitted with medium-range radar. The Audi Q4 e-tron (L1) is equipped with radar from Continental AG (Germany), while the Audi Q5 features radar from Robert Bosch GmbH (Germany). The BYD Song L 2024 (L2), which uses milliwave radar from Shenzhen Cheng-Tech Co., Ltd., further illustrates the growing demand for vehicle radar technology.

Level 2 to surpass other autonomy levels during forecast period

Level 2 is expected to be the largest segment of the self-driving cars market during the forecast period, driven by the integration of advanced driver assistance features such as lane centering, adaptive cruise control, and traffic jam assist. These systems enhance safety and convenience while maintaining driver supervision, making them appealing in key markets such as the US, Japan, and Germany. Automakers have increasingly deployed L2 technology, with models like the Ford Mustang Mach-E featuring BlueCruise and Tesla’s Enhanced Autopilot gaining significant traction. Ford’s BlueCruise is available across the US, Canada, and European markets, including the UK, Germany, France, Italy, and Norway. General Motors’ Super Cruise, featured in the Cadillac CT4 and Chevrolet Silverado, and Tesla’s Autopilot in the Model 3, also underscore the growing demand for L2 autonomy. Recent launches, such as General Motors’s Cadillac Optiq, Chevrolet Equinox EV with Super Cruise, Honda’s Acura ZDX, and Kia’s EV3, further emphasize the increasing availability and demand for accessible L2 features. Similarly, in Asia Pacific, rapid technological adoption and strong consumer interest in ADAS-equipped cars are expected to drive growth.

Asia Pacific to be dominant during forecast period

Asia Pacific is expected to be the largest market for self-driving cars during the forecast period, driven by government initiatives, technological advancements, and the presence of leading automakers. Countries such as China and South Korea are at the forefront of this growth. For instance, China has issued 16,000 test licenses for driverless cars and opened approximately 20,000 miles of public roads for autonomous vehicle testing as of August 2024. The country’s ambitious goal to ensure that 70% of new cars are equipped with Level 2 or Level 3 autonomy by 2025 demonstrates its commitment to autonomous vehicle adoption. The rapid expansion of robotaxi services by companies such as Baidu Co., Ltd. (China) and WeRide (China) across multiple Chinese cities has also created a robust ecosystem supporting self-driving technology. Similarly, South Korea aims to commercialize at least one Level 4 vehicle by 2027. Furthermore, the presence of prominent automakers, including Toyota Motor Corporation (Japan), Honda Motor Co., Ltd. (Japan), and Hyundai Motor Group (South Korea), boosts the region’s potential. In May 2024, Honda announced plans to introduce self-driving taxis in Japan by 2026. Meanwhile, Kia launched the EV9 equipped with Level 3 autonomy in August 2024. Such developments reflect the strong focus of these automakers on leading the autonomous vehicle revolution.

LARGEST MARKET IN 2024-2035
CHINA, LARGEST MARKET IN THE REGION
Self-driving Cars Market Size and Share

Recent Developments of Self-driving Cars Market

  • In October 2024, Tesla (US) introduced the Cybercab, a fully autonomous robotaxi priced under USD 30,000. It is designed without a steering wheel or pedals.
  • In October 2024, Toyota Motor Corporation (Japan) announced a collaboration with Suzuki Motor Corporation on the development of a battery electric vehicle. The new model is designed exclusively as a BEV (battery electric vehicle).
  • In June 2024, Cruise LLC (US), a General Motors (US) subsidiary, announced that it had resumed manual driving in Phoenix, Houston, and Dallas, with supervised operations ongoing in Phoenix and Dallas.
  • In April 2024, Buick (US), a General Motors (US) subsidiary, unveiled the Enclave SUV for model year 2025. The SUV will be made available with Super Cruise, General Motors’s hands-free driver assistance system with L2+ capabilities.

Key Market Players

List of Top Self-driving cars Market Companies

The Self-driving Cars Market is dominated by a few major players that have a wide regional presence. The major players in the Self-driving Cars Market are

Want to explore hidden markets that can drive new revenue in Self-driving Cars Market?

Scope of the Report

Report Attribute Details
Market size available for years 2019–2035
Base year considered 2023
Forecast period 2024-2035
Forecast units Volume (Thousand Units)
Segments Covered Vehicle Class, Component Type, Sensor Type, Electric Vehicle, Propulsion, and Region
Regions covered Asia Pacific, Europe, and North America


Key Questions Addressed by the Report

What is the current size of the self-driving cars market?
The self-driving cars market is estimated at 37,090 thousand units in 2024. It is expected to reach 76,217 thousand units by 2035, with a CAGR of 6.8%.
Who are the key players in the self-driving cars market?
The self-driving cars market is dominated by players such as Toyota Motor Corporation (Japan), Tesla (US), BYD Co., Ltd. (China), Volkswagen Group (Germany), Ford Motor Company (US), and Hyundai Motor Group (South Korea).
Which region is projected to account for the largest share of the self-driving cars market?
Asia Pacific is projected to account for the largest share of the self-driving cars market, subject to rapid urbanization, government initiatives, and widespread adoption of ADAS technologies.
Which country is projected to lead the self-driving cars market in Asia Pacific during the forecast period?
China is projected to lead the self-driving cars market in Asia Pacific due to its government-backed initiatives, extensive public road testing, and advancements by companies such as NIO (China), BYD Co., Ltd. (China), and SAIC Motor Corporation Limited (China).
What are the key market trends impacting the growth of the self-driving car market?
Key trends impacting the growth of the self-driving cars market include advancements in AI and sensor technologies, increased government support for autonomous mobility, and high consumer demand for ADAS-equipped vehicles.


Personalize This Research

  • Triangulate with your Own Data
  • Get Data as per your Format and Definition
  • Gain a Deeper Dive on a Specific Application, Geography, Customer or Competitor
  • Any level of Personalization
Request A Free Customisation

Let Us Help You

  • What are the Known and Unknown Adjacencies Impacting the Self-driving Cars Market
  • What will your New Revenue Sources be?
  • Who will be your Top Customer; what will make them switch?
  • Defend your Market Share or Win Competitors
  • Get a Scorecard for Target Partners
Customized Workshop Request

Table of Contents

Exclusive indicates content/data unique to MarketsandMarkets and not available with any competitors.

TITLE
PAGE NO
INTRODUCTION
28
RESEARCH METHODOLOGY
34
EXECUTIVE SUMMARY
48
PREMIUM INSIGHTS
52
MARKET OVERVIEW
56
  • 5.1 INTRODUCTION
  • 5.2 MARKET DYNAMICS
    DRIVERS
    - Focus on improving road safety
    - Government regulations for integration of advanced safety technologies
    - Rise of autonomous ride-hailing services
    RESTRAINTS
    - High development costs
    - Data privacy concerns
    OPPORTUNITIES
    - Emergence of subscription-based service offerings
    - Consumer focus on sustainable transportation solutions
    CHALLENGES
    - Substantial cost of ADAS integration
    - Lack of software standardization
    - Inadequate infrastructure for self-driving cars
  • 5.3 TRENDS AND DISRUPTIONS IMPACTING CUSTOMERS’ BUSINESSES
  • 5.4 PRICING ANALYSIS
    AVERAGE SELLING PRICE TREND, BY COMPONENT
    AVERAGE SELLING PRICE TREND, BY REGION
  • 5.5 ECOSYSTEM ANALYSIS
  • 5.6 VALUE CHAIN ANALYSIS
  • 5.7 CASE STUDY ANALYSIS
    FRANKFURT AIRPORT CONDUCTS TRIALS FOR AUTONOMOUS BAGGAGE TRACTORS TO ENHANCE OPERATIONAL EFFICIENCY
    CONTINENTAL DEVELOPS INNOVATIVE SOLUTIONS TO ADDRESS AUTONOMOUS DRIVING CHALLENGES
    WAYMO INTEGRATES ADVANCED PERCEPTION SYSTEMS WITH SENSORS TO REDUCE TRAFFIC-RELATED FATALITIES
    AMBARELLA OFFERS AD SOFTWARE AND HARDWARE SOLUTIONS FOR SCALABLE AUTONOMOUS DRIVING
    NVIDIA PROVIDES OPEN AV DEVELOPMENT PLATFORM FOR AUTONOMOUS VEHICLES
    GENERAL MOTORS AND UMTRI EVALUATE SAFETY SYSTEMS TO REDUCE COLLISIONS
  • 5.8 IMPACT OF AI
  • 5.9 INVESTMENT AND FUNDING SCENARIO
  • 5.10 PATENT ANALYSIS
  • 5.11 TECHNOLOGY ANALYSIS
    KEY TECHNOLOGIES
    - V2X
    - Thermal imaging cameras
    - Edge computing
    COMPLEMENTARY TECHNOLOGIES
    - Cloud computing
    - Terrain sensing systems
    - Automated valet parking
    ADJACENT TECHNOLOGIES
    - Solid-state LiDAR
    - Blockchain
  • 5.12 TRADE ANALYSIS
  • 5.13 REGULATORY LANDSCAPE
    REGULATIONS ON AUTONOMOUS VEHICLE USAGE, BY COUNTRY
    REGULATORY BODIES, GOVERNMENT AGENCIES, AND OTHER ORGANIZATIONS
  • 5.14 KEY CONFERENCES AND EVENTS, 2024–2025
  • 5.15 KEY STAKEHOLDERS AND BUYING CRITERIA
    KEY STAKEHOLDERS IN BUYING PROCESS
    BUYING CRITERIA
  • 5.16 MNM INSIGHTS ON KEY OEMS’ INCLINATION TOWARD IN-HOUSE SOFTWARE DEVELOPMENT
  • 5.17 AUTONOMOUS VEHICLE TRENDS AND KEY START-UPS
SELF-DRIVING CARS MARKET, BY LEVEL OF AUTONOMY
97
  • 6.1 INTRODUCTION
  • 6.2 SEMI-AUTONOMOUS
    L1
    - Integration of entry-level ADAS for enhanced safety and comfort to drive market
    L2
    - Increasing preference for advanced safety features to drive market
    L3
    - Regulatory approvals to drive market
  • 6.3 AUTONOMOUS
    L4
    - Ongoing development of robotaxis and shuttles to drive market
    L5
    - Growing investments in urban mobility and smart infrastructure to drive market
  • 6.4 PRIMARY INSIGHTS
SELF-DRIVING CARS MARKET, BY COMPONENT
109
  • 7.1 INTRODUCTION
  • 7.2 CAMERA
    FOCUS ON INCREASING VEHICLE SAFETY TO DRIVE MARKET
  • 7.3 LIDAR
    RAPID DEVELOPMENTS BY COMPONENT MANUFACTURERS TO DRIVE MARKET
  • 7.4 RADAR
    EXTENSIVE USE OF AUTOMATIC EMERGENCY BRAKING AND COLLISION AVOIDANCE FEATURES TO DRIVE MARKET
  • 7.5 ULTRASONIC SENSOR
    WIDESPREAD DEPLOYMENT IN ADAS APPLICATIONS TO DRIVE MARKET
  • 7.6 INFRARED SENSOR
  • 7.7 OTHERS
  • 7.8 PRIMARY INSIGHTS
SELF-DRIVING CARS MARKET, BY MOBILITY TYPE
122
  • 8.1 INTRODUCTION
  • 8.2 PERSONAL MOBILITY
    GROWING CONSUMER INTEREST IN AUTONOMOUS VEHICLE OWNERSHIP TO DRIVE MARKET
  • 8.3 SHARED MOBILITY
    RISING DEMAND FOR RIDE-SHARING AND ROBOTAXI SERVICES TO DRIVE MARKET
  • 8.4 PRIMARY INSIGHTS
SELF-DRIVING CARS MARKET, BY VEHICLE CLASS
130
  • 9.1 INTRODUCTION
  • 9.2 A&B
    EMPHASIS ON AFFORDABLE AUTOMATION TO DRIVE MARKET
  • 9.3 C&D
    ELEVATED DEMAND FOR ADAS-EQUIPPED MID-SIZE SEDANS AND SUVS TO DRIVE MARKET
  • 9.4 E&F
    SHIFT TOWARD LUXURY DRIVING EXPERIENCES TO DRIVE MARKET
  • 9.5 PRIMARY INSIGHTS
SELF-DRIVING CARS MARKET, BY REGION
137
  • 10.1 INTRODUCTION
  • 10.2 ASIA PACIFIC
    MACROECONOMIC OUTLOOK
    CHINA
    - Government support to drive market
    INDIA
    - Focus on advanced mobility solutions to drive market
    JAPAN
    - Technological advancements by prominent players to drive market
    SOUTH KOREA
    - Strategic collaborations between self-driving car manufacturers to drive market
  • 10.3 EUROPE
    MACROECONOMIC OUTLOOK
    GERMANY
    - Significant presence of prominent automakers and components suppliers to drive market
    FRANCE
    - Emphasis on sustainable transportation solutions and advanced mobility services to drive market
    ITALY
    - Consumer demand for safer driving solutions to drive market
    UK
    - Rapid development of autonomous vehicles to drive market
    SPAIN
    - Government’s push for improving road safety to drive market
  • 10.4 NORTH AMERICA
    MACROECONOMIC OUTLOOK
    US
    - Wide consumer acceptance of autonomous technologies to drive market
    CANADA
    - Emergence of innovative start-ups to drive market
COMPETITIVE LANDSCAPE
176
  • 11.1 INTRODUCTION
  • 11.2 KEY PLAYER STRATEGIES/RIGHT TO WIN, 2022–2024
  • 11.3 REVENUE ANALYSIS OF SELF-DRIVING CAR MANUFACTURERS, 2019–2023
  • 11.4 MARKET SHARE ANALYSIS FOR SELF-DRIVING CAR MANUFACTURERS, 2023
  • 11.5 MARKET RANKING OF AUTONOMOUS DRIVING COMPONENT PROVIDERS, 2023
  • 11.6 COMPANY VALUATION AND FINANCIAL METRICS
  • 11.7 BRAND/PRODUCT COMPARISON
  • 11.8 COMPANY EVALUATION MATRIX: KEY PLAYERS, 2024
    STARS
    EMERGING LEADERS
    PERVASIVE PLAYERS
    PARTICIPANTS
    COMPANY FOOTPRINT
    - Company footprint
    - Level of autonomy footprint
    - Mobility type footprint
    - Vehicle class footprint
    - Region footprint
  • 11.9 COMPANY EVALUATION MATRIX: START-UPS/SMES, 2024
    PROGRESSIVE COMPANIES
    RESPONSIVE COMPANIES
    DYNAMIC COMPANIES
    STARTING BLOCKS
    COMPETITIVE BENCHMARKING
    - List of start-ups/SMEs
    - Competitive benchmarking of start-ups/SMEs
  • 11.10 COMPETITIVE SCENARIO
    PRODUCT LAUNCHES/DEVELOPMENTS
    DEALS
    EXPANSIONS
    OTHERS
COMPANY PROFILES
196
  • 12.1 KEY PLAYERS (OEMS)
    TOYOTA MOTOR CORPORATION
    - Business overview
    - Products/Solutions/Services offered
    - Recent developments
    - MnM view
    TESLA
    - Business overview
    - Products/Solutions/Services offered
    - Recent developments
    - MnM view
    BYD CO., LTD.
    - Business overview
    - Products/Solutions/Services offered
    - Recent developments
    - MnM view
    VOLKSWAGEN GROUP
    - Business overview
    - Products/Solutions/Services offered
    - Recent developments
    - MnM view
    FORD MOTOR COMPANY
    - Business overview
    - Products/Solutions/Services offered
    - Recent developments
    - MnM view
    GENERAL MOTORS
    - Business overview
    - Products/Solutions/Services offered
    - Recent developments
    MERCEDES-BENZ GROUP AG
    - Business overview
    - Products/Solutions/Services offered
    - Recent developments
    WAYMO LLC
    - Business overview
    - Products/Solutions/Services offered
    - Recent developments
    BMW GROUP
    - Business overview
    - Products/Solutions/Services offered
    - Recent developments
    HYUNDAI MOTOR GROUP
    - Business overview
    - Products/Solutions/Services offered
    - Recent developments
  • 12.2 KEY PLAYERS (COMPONENT PROVIDERS)
    MOBILEYE
    - Business overview
    - Products/Solutions/Services offered
    - Recent developments
    NVIDIA CORPORATION
    - Business overview
    - Products/Solutions/Services offered
    - Recent developments
    ROBERT BOSCH GMBH
    - Business overview
    - Products/Solutions/Services offered
    - Recent developments
    CONTINENTAL AG
    - Business overview
    - Products/Solutions/Services offered
    - Recent developments
    ZF FRIEDRICHSHAFEN AG
    - Business overview
    - Products/Solutions/Services offered
    - Recent developments
    DENSO CORPORATION
    - Business overview
    - Products/Solutions/Services offered
    - Recent developments
    MAGNA INTERNATIONAL INC.
    - Business overview
    - Products/Solutions/Services offered
    - Recent developments
    NXP SEMICONDUCTORS
    - Business overview
    - Products/Solutions/Services offered
    - Recent developments
    APTIV
    - Business overview
    - Products/Solutions/Services offered
    - Recent developments
    VALEO
    - Business overview
    - Products/Solutions/Services offered
    - Recent developments
  • 12.3 OTHER PLAYERS (OEMS)
    STELLANTIS NV
    RENAULT GROUP
    MOTIONAL, INC.
    ZOOX, INC.
    NAVYA
  • 12.4 OTHER PLAYERS (COMPONENT PROVIDERS)
    AURORA INNOVATION INC.
    NURO, INC.
    AISIN CORPORATION
    HITACHI AUTOMOTIVE
    RENESAS ELECTRONICS CORPORATION
    INFINEON TECHNOLOGIES AG
    FICOSA INTERNATIONAL SA
    TEXAS INSTRUMENTS
    VOXX INTERNATIONAL CORP
    BLACKBERRY
    MICROSEMI CORPORATION
    XILINX
    VEONEER
    SAMSUNG ELECTRO-MECHANICS
    TELEDYNE FLIR LLC
    MCNEX CO., LTD.
    STONKAM CO., LTD.
    LG ELECTRONICS
RECOMMENDATIONS BY MARKETSANDMARKETS
290
  • 13.1 ASIA PACIFIC TO BE LARGEST MARKET FOR SELF-DRIVING CARS
  • 13.2 LEVEL 3 AUTONOMY TO BE DOMINANT
  • 13.3 LIDAR TO BE FASTEST-GROWING COMPONENT
  • 13.4 AI TO BE PIVOTAL IN SELF-DRIVING CAR DEVELOPMENT
  • 13.5 CONCLUSION
APPENDIX
292
  • 14.1 INSIGHTS FROM INDUSTRY EXPERTS
  • 14.2 DISCUSSION GUIDE
  • 14.3 KNOWLEDGESTORE: MARKETSANDMARKETS’ SUBSCRIPTION PORTAL
  • 14.4 CUSTOMIZATION OPTIONS
    SELF-DRIVING CARS MARKET, BY LEVEL OF AUTONOMY, AT COUNTRY LEVEL
    MARKET, BY EV TYPE, AT COUNTRY LEVEL
    COMPANY INFORMATION
    - Profiling of additional market players (up to five)
  • 14.5 RELATED REPORTS
  • 14.6 AUTHOR DETAILS
LIST OF TABLES
 
  • TABLE 1 MARKET DEFINITION, BY LEVEL OF AUTONOMY
  • TABLE 2 MARKET DEFINITION, BY COMPONENT
  • TABLE 3 MARKET DEFINITION, BY MOBILITY TYPE
  • TABLE 4 MARKET DEFINITION, BY VEHICLE CLASS
  • TABLE 5 INCLUSIONS AND EXCLUSIONS
  • TABLE 6 USD EXCHANGE RATES
  • TABLE 7 REGULATORY SAFETY FEATURES BY EUROPEAN COMMISSION
  • TABLE 8 IMPACT ANALYSIS OF MARKET DYNAMICS
  • TABLE 9 AVERAGE SELLING PRICE OF SELF-DRIVING CARS, BY COMPONENT, 2022–2024 P(USD)
  • TABLE 10 AVERAGE SELLING PRICE OF SELF-DRIVING CARS, BY REGION, 2022–2024 (USD)
  • TABLE 11 ROLE OF COMPANIES IN ECOSYSTEM
  • TABLE 12 LIST OF FUNDINGS, 2022–2023
  • TABLE 13 PATENT ANALYSIS
  • TABLE 14 BENEFITS OF CLOUD COMPUTING IN SELF-DRIVING CARS
  • TABLE 15 IMPORT DATA FOR HS CODE 8708, BY COUNTRY, 2019–2023 (USD BILLION)
  • TABLE 16 EXPORT DATA FOR HS CODE 8708, BY COUNTRY, 2019–2023 (USD BILLION)
  • TABLE 17 TESTING PARAMETERS FOR NEW CAR MODELS
  • TABLE 18 REGULATIONS AND LEGISLATION FOR ADAS/AUTONOMOUS VEHICLES IN US
  • TABLE 19 NORTH AMERICA: REGULATORY BODIES, GOVERNMENT AGENCIES, AND OTHER ORGANIZATIONS
  • TABLE 20 EUROPE: REGULATORY BODIES, GOVERNMENT AGENCIES, AND OTHER ORGANIZATIONS
  • TABLE 21 ASIA PACIFIC: REGULATORY BODIES, GOVERNMENT AGENCIES, AND OTHER ORGANIZATIONS
  • TABLE 22 KEY CONFERENCES AND EVENTS, 2024–2025
  • TABLE 23 INFLUENCE OF STAKEHOLDERS ON BUYING PROCESS, BY LEVEL OF AUTONOMY (%)
  • TABLE 24 KEY BUYING CRITERIA, BY LEVEL OF AUTONOMY
  • TABLE 25 IN-HOUSE SOFTWARE DEVELOPMENT BY OEMS
  • TABLE 26 MARKET, BY LEVEL OF AUTONOMY, 2019–2023 (THOUSAND UNITS)
  • TABLE 27 MARKET, BY LEVEL OF AUTONOMY, 2024–2030 (THOUSAND UNITS)
  • TABLE 28 MARKET, BY LEVEL OF AUTONOMY, 2031–2035 (THOUSAND UNITS)
  • TABLE 29 AUTONOMOUS VEHICLE REGULATIONS, BY COUNTRY
  • TABLE 30 L1 AUTONOMOUS VEHICLE LAUNCHES, 2022–2024
  • TABLE 31 L1: MARKET, BY REGION, 2019–2023 (THOUSAND UNITS)
  • TABLE 32 L1: MARKET, BY REGION, 2024–2030 (THOUSAND UNITS)
  • TABLE 33 L1: MARKET, BY REGION, 2031–2035 (THOUSAND UNITS)
  • TABLE 34 L2 AUTONOMOUS VEHICLE LAUNCHES, 2022–2025
  • TABLE 35 L2: MARKET, BY REGION, 2019–2023 (THOUSAND UNITS)
  • TABLE 36 L2: MARKET, BY REGION, 2024–2030 (THOUSAND UNITS)
  • TABLE 37 L2: MARKET, BY REGION, 2031–2035 (THOUSAND UNITS)
  • TABLE 38 L3 AUTONOMOUS VEHICLE LAUNCHES, 2022–2024
  • TABLE 39 L3: MARKET, BY REGION, 2019–2023 (THOUSAND UNITS)
  • TABLE 40 L3: MARKET, BY REGION, 2024–2030 (THOUSAND UNITS)
  • TABLE 41 L3: MARKET, BY REGION, 2031–2035 (THOUSAND UNITS)
  • TABLE 42 L4: MARKET, BY REGION, 2024–2030 (THOUSAND UNITS)
  • TABLE 43 L4: MARKET, BY REGION, 2031–2035 (THOUSAND UNITS)
  • TABLE 44 L5: MARKET, BY REGION, 2024–2030 (THOUSAND UNITS)
  • TABLE 45 L5: MARKET, BY REGION, 2031–2035 (THOUSAND UNITS)
  • TABLE 46 TOP COMPONENT PROVIDERS, 2023–2024
  • TABLE 47 MARKET, BY COMPONENT, 2019–2023 (THOUSAND UNITS)
  • TABLE 48 MARKET, BY COMPONENT, 2024–2030 (THOUSAND UNITS)
  • TABLE 49 MARKET, BY COMPONENT, 2031–2035 (THOUSAND UNITS)
  • TABLE 50 SELF-DRIVING CARS MARKET, BY COMPONENT, 2019–2023 (USD MILLION)
  • TABLE 51 MARKET, BY COMPONENT, 2024–2030 (USD MILLION)
  • TABLE 52 MARKET, BY COMPONENT, 2031–2035 (USD MILLION)
  • TABLE 53 CAMERA: MARKET, BY REGION, 2019–2023 (THOUSAND UNITS)
  • TABLE 54 CAMERA: MARKET, BY REGION, 2024–2030 (THOUSAND UNITS)
  • TABLE 55 CAMERA: MARKET, BY REGION, 2031–2035 (THOUSAND UNITS)
  • TABLE 56 CAMERA: MARKET, BY REGION, 2019–2023 (USD MILLION)
  • TABLE 57 CAMERA: MARKET, BY REGION, 2024–2030 (USD MILLION)
  • TABLE 58 CAMERA: MARKET, BY REGION, 2031–2035 (USD MILLION)
  • TABLE 59 LIDAR: MARKET, BY REGION, 2019–2023 (THOUSAND UNITS)
  • TABLE 60 LIDAR: MARKET, BY REGION, 2024–2030 (THOUSAND UNITS)
  • TABLE 61 LIDAR: MARKET, BY REGION, 2031–2035 (THOUSAND UNITS)
  • TABLE 62 LIDAR: MARKET, BY REGION, 2019–2023 (USD MILLION)
  • TABLE 63 LIDAR: MARKET, BY REGION, 2024–2030 (USD MILLION)
  • TABLE 64 LIDAR: MARKET, BY REGION, 2031–2035 (USD MILLION)
  • TABLE 65 RADAR: MARKET, BY REGION, 2019–2023 (THOUSAND UNITS)
  • TABLE 66 RADAR: MARKET, BY REGION, 2024–2030 (THOUSAND UNITS)
  • TABLE 67 RADAR: MARKET, BY REGION, 2031–2035 (THOUSAND UNITS)
  • TABLE 68 RADAR: MARKET, BY REGION, 2019–2023 (USD MILLION)
  • TABLE 69 RADAR: MARKET, BY REGION, 2024–2030 (USD MILLION)
  • TABLE 70 RADAR: MARKET, BY REGION, 2031–2035 (USD MILLION)
  • TABLE 71 ULTRASONIC SENSOR: MARKET, BY REGION, 2019–2023 (THOUSAND UNITS)
  • TABLE 72 ULTRASONIC SENSOR: MARKET, BY REGION, 2024–2030 (THOUSAND UNITS)
  • TABLE 73 ULTRASONIC SENSOR: MARKET, BY REGION, 2031–2035 (THOUSAND UNITS)
  • TABLE 74 ULTRASONIC SENSOR: MARKET, BY REGION, 2019–2023 (USD MILLION)
  • TABLE 75 ULTRASONIC SENSOR: MARKET, BY REGION, 2024–2030 (USD MILLION)
  • TABLE 76 ULTRASONIC SENSOR: MARKET, BY REGION, 2031–2035 (USD MILLION)
  • TABLE 77 SELF-DRIVING CARS MARKET, BY MOBILITY TYPE, 2019–2023 (THOUSAND UNITS)
  • TABLE 78 MARKET, BY MOBILITY TYPE, 2024–2030 (THOUSAND UNITS)
  • TABLE 79 MARKET, BY MOBILITY TYPE, 2031–2035 (THOUSAND UNITS)
  • TABLE 80 ROBOTAXIS USED FOR PASSENGER TRANSPORTATION WORLDWIDE
  • TABLE 81 PERSONAL MOBILITY: MARKET, BY LEVEL OF AUTONOMY, 2019–2023 (THOUSAND UNITS)
  • TABLE 82 PERSONAL MOBILITY: MARKET, BY LEVEL OF AUTONOMY, 2024–2030 (THOUSAND UNITS)
  • TABLE 83 PERSONAL MOBILITY: MARKET, BY LEVEL OF AUTONOMY, 2031–2035 (THOUSAND UNITS)
  • TABLE 84 PERSONAL MOBILITY: MARKET, BY REGION, 2019–2023 (THOUSAND UNITS)
  • TABLE 85 PERSONAL MOBILITY: MARKET, BY REGION, 2024–2030 (THOUSAND UNITS)
  • TABLE 86 PERSONAL MOBILITY: MARKET, BY REGION, 2031–2035 (THOUSAND UNITS)
  • TABLE 87 SHARED MOBILITY: MARKET, BY LEVEL OF AUTONOMY, 2019–2023 (THOUSAND UNITS)
  • TABLE 88 SHARED MOBILITY: MARKET, BY LEVEL OF AUTONOMY, 2024–2030 (THOUSAND UNITS)
  • TABLE 89 SHARED MOBILITY: MARKET, BY LEVEL OF AUTONOMY, 2031–2035 (THOUSAND UNITS)
  • TABLE 90 SHARED MOBILITY: MARKET, BY REGION, 2019–2023 (THOUSAND UNITS)
  • TABLE 91 SHARED MOBILITY: MARKET, BY REGION, 2024–2030 (THOUSAND UNITS)
  • TABLE 92 SHARED MOBILITY: MARKET, BY REGION, 2031–2035 (THOUSAND UNITS)
  • TABLE 93 SELF-DRIVING CARS MARKET, BY VEHICLE CLASS, 2019–2023 (THOUSAND UNITS)
  • TABLE 94 MARKET, BY VEHICLE CLASS, 2024–2030 (THOUSAND UNITS)
  • TABLE 95 MARKET, BY VEHICLE CLASS, 2031–2035 (THOUSAND UNITS)
  • TABLE 96 A&B: MARKET, BY REGION, 2019–2023 (THOUSAND UNITS)
  • TABLE 97 A&B: MARKET, BY REGION, 2024–2030 (THOUSAND UNITS)
  • TABLE 98 A&B: MARKET, BY REGION, 2031–2035 (THOUSAND UNITS)
  • TABLE 99 C&D: MARKET, BY REGION, 2019–2023 (THOUSAND UNITS)
  • TABLE 100 C&D: MARKET, BY REGION, 2024–2030 (THOUSAND UNITS)
  • TABLE 101 C&D: MARKET, BY REGION, 2031–2035 (THOUSAND UNITS)
  • TABLE 102 E&F: MARKET, BY REGION, 2019–2023 (THOUSAND UNITS)
  • TABLE 103 E&F: MARKET, BY REGION, 2024–2030 (THOUSAND UNITS)
  • TABLE 104 E&F: MARKET, BY REGION, 2031–2035 (THOUSAND UNITS)
  • TABLE 105 AUTONOMOUS VEHICLE DEVELOPMENT PHASES AND THEIR IMPACT
  • TABLE 106 MARKET, BY REGION, 2019–2023 (THOUSAND UNITS)
  • TABLE 107 MARKET, BY REGION, 2024–2030 (THOUSAND UNITS)
  • TABLE 108 MARKET, BY REGION, 2031–2035 (THOUSAND UNITS)
  • TABLE 109 AUTONOMOUS VEHICLE PROJECTS IN ASIA PACIFIC
  • TABLE 110 ASIA PACIFIC: MARKET, BY COUNTRY, 2019–2023 (THOUSAND UNITS)
  • TABLE 111 ASIA PACIFIC: MARKET, BY COUNTRY, 2024–2030 (THOUSAND UNITS)
  • TABLE 112 ASIA PACIFIC: MARKET, BY COUNTRY, 2031–2035 (THOUSAND UNITS)
  • TABLE 113 ASIA PACIFIC: MARKET, BY VEHICLE CLASS, 2019–2023 (THOUSAND UNITS)
  • TABLE 114 ASIA PACIFIC: MARKET, BY VEHICLE CLASS, 2024–2030 (THOUSAND UNITS)
  • TABLE 115 ASIA PACIFIC: MARKET, BY VEHICLE CLASS, 2031–2035 (THOUSAND UNITS)
  • TABLE 116 ASIA PACIFIC: MARKET, BY LEVEL OF AUTONOMY, 2019–2023 (THOUSAND UNITS)
  • TABLE 117 ASIA PACIFIC: MARKET, BY LEVEL OF AUTONOMY, 2024–2030 (THOUSAND UNITS)
  • TABLE 118 ASIA PACIFIC: MARKET, BY LEVEL OF AUTONOMY, 2031–2035 (THOUSAND UNITS)
  • TABLE 119 KEY AUTONOMOUS VEHICLE COMPANIES AND THEIR PARTNERS IN CHINA
  • TABLE 120 CHINA: SELF-DRIVING CARS MARKET, BY LEVEL OF AUTONOMY, 2019–2023 (THOUSAND UNITS)
  • TABLE 121 CHINA: MARKET, BY LEVEL OF AUTONOMY, 2024–2030 (THOUSAND UNITS)
  • TABLE 122 CHINA: MARKET, BY LEVEL OF AUTONOMY, 2031–2035 (THOUSAND UNITS)
  • TABLE 123 INDIA: MARKET, BY LEVEL OF AUTONOMY, 2019–2023 (THOUSAND UNITS)
  • TABLE 124 INDIA: MARKET, BY LEVEL OF AUTONOMY, 2024–2030 (THOUSAND UNITS)
  • TABLE 125 INDIA: MARKET, BY LEVEL OF AUTONOMY, 2031–2035 (THOUSAND UNITS)
  • TABLE 126 JAPAN: MARKET, BY LEVEL OF AUTONOMY, 2019–2023 (THOUSAND UNITS)
  • TABLE 127 JAPAN: MARKET, BY LEVEL OF AUTONOMY, 2024–2030 (THOUSAND UNITS)
  • TABLE 128 JAPAN: MARKET, BY LEVEL OF AUTONOMY, 2031–2035 (THOUSAND UNITS)
  • TABLE 129 SOUTH KOREA: MARKET, BY LEVEL OF AUTONOMY, 2019–2023 (THOUSAND UNITS)
  • TABLE 130 SOUTH KOREA: MARKET, BY LEVEL OF AUTONOMY, 2024–2030 (THOUSAND UNITS)
  • TABLE 131 SOUTH KOREA: MARKET, BY LEVEL OF AUTONOMY, 2031–2035 (THOUSAND UNITS)
  • TABLE 132 EUROPE: MARKET, BY COUNTRY, 2019–2023 (THOUSAND UNITS)
  • TABLE 133 EUROPE: MARKET, BY COUNTRY, 2024–2030 (THOUSAND UNITS)
  • TABLE 134 EUROPE: MARKET, BY COUNTRY, 2031–2035 (THOUSAND UNITS)
  • TABLE 135 EUROPE: MARKET, BY VEHICLE CLASS, 2019–2023 (THOUSAND UNITS)
  • TABLE 136 EUROPE: MARKET, BY VEHICLE CLASS, 2024–2030 (THOUSAND UNITS)
  • TABLE 137 EUROPE: MARKET, BY VEHICLE CLASS, 2031–2035 (THOUSAND UNITS)
  • TABLE 138 EUROPE: MARKET, BY LEVEL OF AUTONOMY, 2019–2023 (THOUSAND UNITS)
  • TABLE 139 EUROPE: MARKET, BY LEVEL OF AUTONOMY, 2024–2030 (THOUSAND UNITS)
  • TABLE 140 EUROPE: MARKET, BY LEVEL OF AUTONOMY, 2031–2035 (THOUSAND UNITS)
  • TABLE 141 GERMANY: SELF-DRIVING CARS MARKET, BY LEVEL OF AUTONOMY, 2019–2023 (THOUSAND UNITS)
  • TABLE 142 GERMANY: MARKET, BY LEVEL OF AUTONOMY, 2024–2030 (THOUSAND UNITS)
  • TABLE 143 GERMANY: MARKET, BY LEVEL OF AUTONOMY, 2031–2035 (THOUSAND UNITS)
  • TABLE 144 FRANCE: MARKET, BY LEVEL OF AUTONOMY, 2019–2023 (THOUSAND UNITS)
  • TABLE 145 FRANCE: MARKET, BY LEVEL OF AUTONOMY, 2024–2030 (THOUSAND UNITS)
  • TABLE 146 FRANCE: MARKET, BY LEVEL OF AUTONOMY, 2031–2035 (THOUSAND UNITS)
  • TABLE 147 ITALY: MARKET, BY LEVEL OF AUTONOMY, 2019–2023 (THOUSAND UNITS)
  • TABLE 148 ITALY: MARKET, BY LEVEL OF AUTONOMY, 2024–2030 (THOUSAND UNITS)
  • TABLE 149 ITALY: MARKET, BY LEVEL OF AUTONOMY, 2031–2035 (THOUSAND UNITS)
  • TABLE 150 UK: MARKET, BY LEVEL OF AUTONOMY, 2019–2023 (THOUSAND UNITS)
  • TABLE 151 UK: MARKET, BY LEVEL OF AUTONOMY, 2024–2030 (THOUSAND UNITS)
  • TABLE 152 UK: MARKET, BY LEVEL OF AUTONOMY, 2031–2035 (THOUSAND UNITS)
  • TABLE 153 SPAIN: MARKET, BY LEVEL OF AUTONOMY, 2019–2023 (THOUSAND UNITS)
  • TABLE 154 SPAIN: MARKET, BY LEVEL OF AUTONOMY, 2024–2030 (THOUSAND UNITS)
  • TABLE 155 SPAIN: MARKET, BY LEVEL OF AUTONOMY, 2031–2035 (THOUSAND UNITS)
  • TABLE 156 NORTH AMERICA: SELF-DRIVING CARS MARKET, BY COUNTRY, 2019–2023 (THOUSAND UNITS)
  • TABLE 157 NORTH AMERICA: MARKET, BY COUNTRY, 2024–2030 (THOUSAND UNITS)
  • TABLE 158 NORTH AMERICA: MARKET, BY COUNTRY, 2031–2035 (THOUSAND UNITS)
  • TABLE 159 NORTH AMERICA: MARKET, BY VEHICLE CLASS, 2019–2023 (THOUSAND UNITS)
  • TABLE 160 NORTH AMERICA: MARKET, BY VEHICLE CLASS, 2024–2030 (THOUSAND UNITS)
  • TABLE 161 NORTH AMERICA: MARKET, BY VEHICLE CLASS, 2031–2035 (THOUSAND UNITS)
  • TABLE 162 NORTH AMERICA: MARKET, BY LEVEL OF AUTONOMY, 2019–2023 (THOUSAND UNITS)
  • TABLE 163 NORTH AMERICA: MARKET, BY LEVEL OF AUTONOMY, 2024–2030 (THOUSAND UNITS)
  • TABLE 164 NORTH AMERICA: MARKET, BY LEVEL OF AUTONOMY, 2031–2035 (THOUSAND UNITS)
  • TABLE 165 US: SELF-DRIVING CARS MARKET, BY LEVEL OF AUTONOMY, 2019–2023 (THOUSAND UNITS)
  • TABLE 166 US: MARKET, BY LEVEL OF AUTONOMY, 2024–2030 (THOUSAND UNITS)
  • TABLE 167 US: MARKET, BY LEVEL OF AUTONOMY, 2031–2035 (THOUSAND UNITS)
  • TABLE 168 CANADA: MARKET, BY LEVEL OF AUTONOMY, 2019–2023 (THOUSAND UNITS)
  • TABLE 169 CANADA: MARKET, BY LEVEL OF AUTONOMY, 2024–2030 (THOUSAND UNITS)
  • TABLE 170 CANADA: MARKET, BY LEVEL OF AUTONOMY, 2031–2035 (THOUSAND UNITS)
  • TABLE 171 KEY PLAYER STRATEGIES/RIGHT TO WIN, 2022–2024
  • TABLE 172 MARKET SHARE ANALYSIS, 2023
  • TABLE 173 LEVEL OF AUTONOMY FOOTPRINT
  • TABLE 174 MOBILITY TYPE FOOTPRINT
  • TABLE 175 VEHICLE CLASS FOOTPRINT
  • TABLE 176 REGION FOOTPRINT
  • TABLE 177 LIST OF START-UPS/SMES
  • TABLE 178 COMPETITIVE BENCHMARKING OF START-UPS/SMES
  • TABLE 179 MARKET: PRODUCT LAUNCHES/DEVELOPMENTS, 2022–2024
  • TABLE 180 MARKET: DEALS, 2022–2024
  • TABLE 181 MARKET: EXPANSIONS, 2022–2024
  • TABLE 182 SELF-DRIVING CARS MARKET: OTHERS, 2022–2024
  • TABLE 183 TOYOTA MOTOR CORPORATION: COMPANY OVERVIEW
  • TABLE 184 TOYOTA MOTOR CORPORATION: NEW VEHICLE MODELS, BY LEVEL OF AUTONOMY
  • TABLE 185 TOYOTA MOTOR CORPORATION: PRODUCTS/SOLUTIONS/SERVICES OFFERED
  • TABLE 186 TOYOTA MOTOR CORPORATION: PRODUCT LAUNCHES/DEVELOPMENTS
  • TABLE 187 TOYOTA MOTOR CORPORATION: DEALS
  • TABLE 188 TESLA: COMPANY OVERVIEW
  • TABLE 189 TESLA: NEW VEHICLE MODELS, BY LEVEL OF AUTONOMY
  • TABLE 190 TESLA: PRODUCTS/SOLUTIONS/SERVICES OFFERED
  • TABLE 191 TESLA: PRODUCT LAUNCHES/DEVELOPMENTS
  • TABLE 192 TESLA: DEALS
  • TABLE 193 TESLA: EXPANSIONS
  • TABLE 194 TESLA: OTHERS
  • TABLE 195 BYD CO., LTD.: COMPANY OVERVIEW
  • TABLE 196 BYD CO., LTD.: NEW VEHICLE MODELS, BY LEVEL OF AUTONOMY
  • TABLE 197 BYD CO., LTD.: PRODUCTS/SOLUTIONS/SERVICES OFFERED
  • TABLE 198 BYD CO., LTD.: PRODUCT LAUNCHES/DEVELOPMENTS
  • TABLE 199 BYD CO., LTD.: DEALS
  • TABLE 200 BYD CO., LTD.: EXPANSIONS
  • TABLE 201 BYD CO., LTD.: OTHERS
  • TABLE 202 VOLKSWAGEN GROUP: COMPANY OVERVIEW
  • TABLE 203 VOLKSWAGEN GROUP: NEW VEHICLE MODELS, BY LEVEL OF AUTONOMY
  • TABLE 204 VOLKSWAGEN GROUP: PRODUCTS/SOLUTIONS/SERVICES OFFERED
  • TABLE 205 VOLKSWAGEN GROUP: DEALS
  • TABLE 206 FORD MOTOR COMPANY: COMPANY OVERVIEW
  • TABLE 207 FORD MOTOR COMPANY: NEW VEHICLE MODELS, BY LEVEL OF AUTONOMY
  • TABLE 208 FORD MOTOR COMPANY: VEHICLES COMPATIBLE WITH BLUECRUISE
  • TABLE 209 FORD MOTOR COMPANY: PRODUCTS/SOLUTIONS/SERVICES OFFERED
  • TABLE 210 FORD MOTOR COMPANY: OTHERS
  • TABLE 211 GENERAL MOTORS: COMPANY OVERVIEW
  • TABLE 212 GENERAL MOTORS: NEW VEHICLE MODELS, BY LEVEL OF AUTONOMY
  • TABLE 213 GENERAL MOTORS: VEHICLES COMPATIBLE WITH SUPER CRUISE
  • TABLE 214 GENERAL MOTORS: PRODUCTS/SOLUTIONS/SERVICES OFFERED
  • TABLE 215 GENERAL MOTORS: PRODUCT LAUNCHES/DEVELOPMENTS
  • TABLE 216 GENERAL MOTORS: DEALS
  • TABLE 217 GENERAL MOTORS: EXPANSIONS
  • TABLE 218 MERCEDES-BENZ GROUP AG: COMPANY OVERVIEW
  • TABLE 219 MERCEDES-BENZ GROUP AG: NEW VEHICLE MODELS, BY LEVEL OF AUTONOMY, 2023–2024
  • TABLE 220 MERCEDES-BENZ GROUP AG: VEHICLES COMPATIBLE WITH DRIVE PILOT
  • TABLE 221 MERCEDES-BENZ GROUP AG: PRODUCTS/SOLUTIONS/SERVICES OFFERED
  • TABLE 222 MERCEDES-BENZ GROUP AG: PRODUCT LAUNCHES/DEVELOPMENTS
  • TABLE 223 MERCEDES-BENZ GROUP AG: DEALS
  • TABLE 224 WAYMO LLC: COMPANY OVERVIEW
  • TABLE 225 WAYMO LLC: PRODUCTS/SOLUTIONS/SERVICES OFFERED
  • TABLE 226 WAYMO LLC: PRODUCT LAUNCHES/DEVELOPMENTS
  • TABLE 227 WAYMO LLC: DEALS
  • TABLE 228 WAYMO LLC: EXPANSIONS
  • TABLE 229 BMW GROUP: COMPANY OVERVIEW
  • TABLE 230 BMW GROUP: NEW VEHICLE MODELS, BY LEVEL OF AUTONOMY
  • TABLE 231 BMW GROUP: PRODUCTS/SOLUTIONS/SERVICES OFFERED
  • TABLE 232 BMW GROUP: DEALS
  • TABLE 233 BMW GROUP: OTHERS
  • TABLE 234 HYUNDAI MOTOR GROUP: COMPANY OVERVIEW
  • TABLE 235 HYUNDAI MOTOR GROUP: NEW VEHICLE MODELS, BY LEVEL OF AUTONOMY
  • TABLE 236 HYUNDAI MOTOR GROUP: PRODUCTS/SOLUTIONS/SERVICES OFFERED
  • TABLE 237 HYUNDAI MOTOR GROUP: PRODUCT LAUNCHES/DEVELOPMENTS
  • TABLE 238 HYUNDAI MOTOR GROUP: DEALS
  • TABLE 239 MOBILEYE: COMPANY OVERVIEW
  • TABLE 240 MOBILEYE: PRODUCTS/SOLUTIONS/SERVICES OFFERED
  • TABLE 241 MOBILEYE: PRODUCT LAUNCHES/DEVELOPMENTS
  • TABLE 242 MOBILEYE: DEALS
  • TABLE 243 NVIDIA CORPORATION: COMPANY OVERVIEW
  • TABLE 244 NVIDIA CORPORATION: PRODUCTS/SOLUTIONS/SERVICES OFFERED
  • TABLE 245 NVIDIA CORPORATION: PRODUCT LAUNCHES/DEVELOPMENTS
  • TABLE 246 NVIDIA CORPORATION: DEALS
  • TABLE 247 ROBERT BOSCH GMBH: COMPANY OVERVIEW
  • TABLE 248 ROBERT BOSCH GMBH: PRODUCTS/SOLUTIONS/SERVICES OFFERED
  • TABLE 249 ROBERT BOSCH GMBH: PRODUCT LAUNCHES/DEVELOPMENTS
  • TABLE 250 ROBERT BOSCH GMBH: DEALS
  • TABLE 251 ROBERT BOSCH GMBH: EXPANSIONS
  • TABLE 252 CONTINENTAL AG: COMPANY OVERVIEW
  • TABLE 253 CONTINENTAL AG: PRODUCTS/SOLUTIONS/SERVICES OFFERED
  • TABLE 254 CONTINENTAL AG: PRODUCT LAUNCHES/DEVELOPMENTS
  • TABLE 255 CONTINENTAL AG: DEALS
  • TABLE 256 CONTINENTAL AG: EXPANSIONS
  • TABLE 257 CONTINENTAL AG: OTHERS
  • TABLE 258 ZF FRIEDRICHSHAFEN AG: COMPANY OVERVIEW
  • TABLE 259 ZF FRIEDRICHSHAFEN AG: PRODUCTS/SOLUTIONS/SERVICES OFFERED
  • TABLE 260 ZF FRIEDRICHSHAFEN AG: PRODUCT LAUNCHES/DEVELOPMENTS
  • TABLE 261 ZF FRIEDRICHSHAFEN AG: DEALS
  • TABLE 262 DENSO CORPORATION: COMPANY OVERVIEW
  • TABLE 263 DENSO CORPORATION: PRODUCTS/SOLUTIONS/SERVICES OFFERED
  • TABLE 264 DENSO CORPORATION: PRODUCT LAUNCHES/DEVELOPMENTS
  • TABLE 265 DENSO CORPORATION: DEALS
  • TABLE 266 DENSO CORPORATION: OTHERS
  • TABLE 267 MAGNA INTERNATIONAL INC.: COMPANY OVERVIEW
  • TABLE 268 MAGNA INTERNATIONAL INC.: PRODUCTS/SOLUTIONS/SERVICES OFFERED
  • TABLE 269 MAGNA INTERNATIONAL INC.: PRODUCT LAUNCHES/DEVELOPMENTS
  • TABLE 270 MAGNA INTERNATIONAL INC.: DEALS
  • TABLE 271 MAGNA INTERNATIONAL INC.: EXPANSIONS
  • TABLE 272 NXP SEMICONDUCTORS: COMPANY OVERVIEW
  • TABLE 273 NXP SEMICONDUCTORS: PRODUCTS/SOLUTIONS/SERVICES OFFERED
  • TABLE 274 NXP SEMICONDUCTORS: PRODUCT LAUNCHES/DEVELOPMENTS
  • TABLE 275 NXP SEMICONDUCTORS: DEALS
  • TABLE 276 APTIV: COMPANY OVERVIEW
  • TABLE 277 APTIV: PRODUCTS/SOLUTIONS/SERVICES OFFERED
  • TABLE 278 APTIV: PRODUCT LAUNCHES/DEVELOPMENTS
  • TABLE 279 APTIV: DEALS
  • TABLE 280 VALEO: COMPANY OVERVIEW
  • TABLE 281 VALEO: PRODUCTS/SOLUTIONS/SERVICES OFFERED
  • TABLE 282 VALEO: DEALS
  • TABLE 283 VALEO: EXPANSIONS
  • TABLE 284 VALEO: OTHERS
  • TABLE 285 STELLANTIS NV: COMPANY OVERVIEW
  • TABLE 286 RENAULT GROUP: COMPANY OVERVIEW
  • TABLE 287 MOTIONAL, INC.: COMPANY OVERVIEW
  • TABLE 288 ZOOX, INC.: COMPANY OVERVIEW
  • TABLE 289 NAVYA: COMPANY OVERVIEW
  • TABLE 290 AURORA INNOVATION INC.: COMPANY OVERVIEW
  • TABLE 291 NURO, INC.: COMPANY OVERVIEW
  • TABLE 292 AISIN CORPORATION: COMPANY OVERVIEW
  • TABLE 293 HITACHI AUTOMOTIVE: COMPANY OVERVIEW
  • TABLE 294 RENESAS ELECTRONICS CORPORATION: COMPANY OVERVIEW
  • TABLE 295 INFINEON TECHNOLOGIES AG: COMPANY OVERVIEW
  • TABLE 296 FICOSA INTERNATIONAL SA: COMPANY OVERVIEW
  • TABLE 297 TEXAS INSTRUMENTS: COMPANY OVERVIEW
  • TABLE 298 VOXX INTERNATIONAL CORP: COMPANY OVERVIEW
  • TABLE 299 BLACKBERRY: COMPANY OVERVIEW
  • TABLE 300 MICROSEMI CORPORATION: COMPANY OVERVIEW
  • TABLE 301 XILINX: COMPANY OVERVIEW
  • TABLE 302 VEONEER: COMPANY OVERVIEW
  • TABLE 303 SAMSUNG ELECTRO-MECHANICS: COMPANY OVERVIEW
  • TABLE 304 TELEDYNE FLIR LLC: COMPANY OVERVIEW
  • TABLE 305 MCNEX CO., LTD.: COMPANY OVERVIEW
  • TABLE 306 STONKAM CO., LTD.: COMPANY OVERVIEW
  • TABLE 307 LG ELECTRONICS: COMPANY OVERVIEW
LIST OF FIGURES
 
  • FIGURE 1 SELF-DRIVING CARS MARKET SEGMENTATION
  • FIGURE 2 RESEARCH DESIGN
  • FIGURE 3 RESEARCH DESIGN MODEL
  • FIGURE 4 RESEARCH METHODOLOGY: HYPOTHESIS BUILDING
  • FIGURE 5 BOTTOM-UP APPROACH
  • FIGURE 6 TOP-DOWN APPROACH FOR MOBILITY TYPE AND VEHICLE CLASS
  • FIGURE 7 TOP-DOWN APPROACH FOR COMPONENT
  • FIGURE 8 DATA TRIANGULATION
  • FIGURE 9 GROWTH PROJECTIONS FROM DEMAND-SIDE DRIVERS
  • FIGURE 10 DEMAND- AND SUPPLY-SIDE FACTOR ANALYSIS
  • FIGURE 11 REGIONAL ECONOMY IMPACT ANALYSIS
  • FIGURE 12 MARKET OVERVIEW
  • FIGURE 13 ASIA PACIFIC TO LEAD MARKET DURING FORECAST PERIOD
  • FIGURE 14 L2 SEGMENT TO LEAD MARKET DURING FORECAST PERIOD
  • FIGURE 15 SURGE IN DEMAND FOR ROAD SAFETY TO DRIVE MARKET DURING FORECAST PERIOD
  • FIGURE 16 ASIA PACIFIC TO BE LARGEST MARKET FOR SELF-DRIVING CARS DURING FORECAST PERIOD
  • FIGURE 17 L2 SEGMENT TO BE DOMINANT DURING FORECAST PERIOD
  • FIGURE 18 RADAR TO SURPASS OTHER SEGMENTS DURING FORECAST PERIOD
  • FIGURE 19 PERSONAL MOBILITY SEGMENT TO BE LARGER THAN SHARED MOBILITY SEGMENT DURING FORECAST PERIOD
  • FIGURE 20 C&D SEGMENT TO SECURE LEADING POSITION DURING FORECAST PERIOD
  • FIGURE 21 MARKET DYNAMICS
  • FIGURE 22 NEW VEHICLE SAFETY STANDARDS BY EUROPEAN COMMISSION
  • FIGURE 23 VEHICLE ATTACK VECTORS
  • FIGURE 24 BUSINESS MODELS FOR AV MONETIZATION
  • FIGURE 25 HARDWARE BREAKDOWN OF AUDI Q5 ADAS FEATURES
  • FIGURE 26 TRENDS AND DISRUPTIONS IMPACTING CUSTOMERS’ BUSINESSES
  • FIGURE 27 AVERAGE SELLING PRICE OF SELF-DRIVING CARS, BY COMPONENT, 2022–2024 (USD)
  • FIGURE 28 AVERAGE SELLING PRICE OF SELF-DRIVING CARS, BY REGION, 2022–2024 (USD)
  • FIGURE 29 ECOSYSTEM ANALYSIS
  • FIGURE 30 VALUE CHAIN ANALYSIS
  • FIGURE 31 GENERAL MOTORS AND UMTRI CASE STUDY
  • FIGURE 32 IMPACT OF AI ON AUTOMOTIVE TECHNOLOGY
  • FIGURE 33 INVESTMENT AND FUNDING SCENARIO, 2021–2023
  • FIGURE 34 PATENT ANALYSIS
  • FIGURE 35 ROLE OF CONNECTIVITY IN MODERN VEHICLES
  • FIGURE 36 EXAMPLE OF THERMAL IMAGING IN VEHICLES
  • FIGURE 37 RANGE OF THERMAL IMAGING COMPARED TO OTHER SENSORS
  • FIGURE 38 EDGE COMPUTING SYSTEM ARCHITECTURE
  • FIGURE 39 TERRAIN SENSING SYSTEM IN JAGUAR LAND ROVER
  • FIGURE 40 BLOCKCHAIN IN AUTONOMOUS VEHICLES
  • FIGURE 41 IMPORT DATA FOR HS CODE 8708, BY COUNTRY, 2019–2023 (USD BILLION)
  • FIGURE 42 EXPORT DATA FOR HS CODE 8708, BY COUNTRY, 2019–2023 (USD BILLION)
  • FIGURE 43 INFLUENCE OF STAKEHOLDERS ON BUYING PROCESS, BY LEVEL OF AUTONOMY
  • FIGURE 44 KEY BUYING CRITERIA, BY LEVEL OF AUTONOMY
  • FIGURE 45 TOP EIGHT AV TRENDS TO LOOK FOR IN 2025 AND BEYOND
  • FIGURE 46 MARKET, BY LEVEL OF AUTONOMY, 2024–2035 (THOUSAND UNITS)
  • FIGURE 47 MARKET, BY COMPONENT, 2024–2035 (USD MILLION)
  • FIGURE 48 USE OF CAMERAS IN AUTOMOBILES
  • FIGURE 49 MARKET, BY MOBILITY TYPE, 2024–2035 (THOUSAND UNITS)
  • FIGURE 50 MARKET, BY VEHICLE CLASS, 2024–2035 (THOUSAND UNITS)
  • FIGURE 51 MERCEDES-BENZ DRIVE PILOT IN S-CLASS SEDAN
  • FIGURE 52 MARKET, BY REGION, 2024–2035 (THOUSAND UNITS)
  • FIGURE 53 ASIA PACIFIC: REAL GDP GROWTH RATE, BY COUNTRY, 2023–2025
  • FIGURE 54 ASIA PACIFIC: GDP PER CAPITA, BY COUNTRY, 2023–2025
  • FIGURE 55 ASIA PACIFIC: INFLATION RATE AVERAGE CONSUMER PRICES, BY COUNTRY, 2023–2025
  • FIGURE 56 ASIA PACIFIC: MANUFACTURING INDUSTRY CONTRIBUTION TO GDP, 2023
  • FIGURE 57 ASIA PACIFIC: MARKET SNAPSHOT
  • FIGURE 58 EUROPE: REAL GDP GROWTH RATE, BY COUNTRY, 2023–2025
  • FIGURE 59 EUROPE: GDP PER CAPITA, BY COUNTRY, 2023–2025
  • FIGURE 60 EUROPE: INFLATION RATE AVERAGE CONSUMER PRICES, BY COUNTRY, 2023–2025
  • FIGURE 61 EUROPE: MANUFACTURING INDUSTRY CONTRIBUTION TO GDP, 2023
  • FIGURE 62 EUROPE: MARKET, BY COUNTRY, 2024–2035 (THOUSAND UNITS)
  • FIGURE 63 NORTH AMERICA: REAL GDP GROWTH RATE, BY COUNTRY, 2023–2025
  • FIGURE 64 NORTH AMERICA: GDP PER CAPITA, BY COUNTRY, 2023–2025
  • FIGURE 65 NORTH AMERICA: CPI INFLATION RATE, BY COUNTRY, 2023–2025
  • FIGURE 66 NORTH AMERICA: MANUFACTURING INDUSTRY CONTRIBUTION TO GDP, 2023
  • FIGURE 67 NORTH AMERICA: MARKET SNAPSHOT
  • FIGURE 68 REVENUE ANALYSIS OF TOP FIVE SELF-DRIVING CAR MANUFACTURERS, 2019–2023
  • FIGURE 69 MARKET SHARE ANALYSIS OF KEY SELF-DRIVING CAR MANUFACTURERS, 2023
  • FIGURE 70 MARKET RANKING OF TOP FIVE AUTONOMOUS DRIVING COMPONENT PROVIDERS, 2023
  • FIGURE 71 COMPANY VALUATION OF KEY PLAYERS
  • FIGURE 72 FINANCIAL MATRIX OF KEY PLAYERS
  • FIGURE 73 BRAND/PRODUCT COMPARISON
  • FIGURE 74 COMPANY EVALUATION MATRIX (KEY PLAYERS), 2024
  • FIGURE 75 COMPANY FOOTPRINT
  • FIGURE 76 COMPANY EVALUATION MATRIX (START-UPS/SMES), 2024
  • FIGURE 77 TOYOTA MOTOR CORPORATION: COMPANY SNAPSHOT
  • FIGURE 78 TESLA: COMPANY SNAPSHOT
  • FIGURE 79 BYD CO., LTD.: COMPANY SNAPSHOT
  • FIGURE 80 VOLKSWAGEN GROUP: COMPANY SNAPSHOT
  • FIGURE 81 VOLKSWAGEN GROUP: REPORTING STRUCTURE
  • FIGURE 82 VOLKSWAGEN GROUP: MANUFACTURING FACILITIES
  • FIGURE 83 FORD MOTOR COMPANY: COMPANY SNAPSHOT
  • FIGURE 84 FORD MOTOR COMPANY: CO-PILOT 360
  • FIGURE 85 GENERAL MOTORS: COMPANY SNAPSHOT
  • FIGURE 86 MERCEDES-BENZ GROUP AG: COMPANY SNAPSHOT
  • FIGURE 87 BMW GROUP: COMPANY SNAPSHOT
  • FIGURE 88 BMW GROUP: ELECTRIC VEHICLE PLANS
  • FIGURE 89 HYUNDAI MOTOR GROUP: COMPANY SNAPSHOT
  • FIGURE 90 MOBILEYE: COMPANY SNAPSHOT
  • FIGURE 91 MOBILEYE: PRODUCT PORTFOLIO
  • FIGURE 92 NVIDIA CORPORATION: COMPANY SNAPSHOT
  • FIGURE 93 NVIDIA CORPORATION DRIVE SCALABLE PLATFORM
  • FIGURE 94 ROBERT BOSCH GMBH: COMPANY SNAPSHOT
  • FIGURE 95 ROBERT BOSCH GMBH: GEOGRAPHICAL PRESENCE
  • FIGURE 96 ROBERT BOSCH GMBH: ADAS OFFERINGS
  • FIGURE 97 CONTINENTAL AG: COMPANY SNAPSHOT
  • FIGURE 98 ZF FRIEDRICHSHAFEN AG: COMPANY SNAPSHOT
  • FIGURE 99 ZF FRIEDRICHSHAFEN AG: ADAS OFFERINGS
  • FIGURE 100 DENSO CORPORATION: COMPANY SNAPSHOT
  • FIGURE 101 MAGNA INTERNATIONAL INC.: COMPANY SNAPSHOT
  • FIGURE 102 MAGNA INTERNATIONAL INC.: ADAS OFFERINGS
  • FIGURE 103 NXP SEMICONDUCTORS: COMPANY SNAPSHOT
  • FIGURE 104 NXP SEMICONDUCTORS: S32 AUTOMOTIVE PROCESSING PLATFORM
  • FIGURE 105 APTIV: COMPANY SNAPSHOT
  • FIGURE 106 APTIV: ADAS SOLUTIONS
  • FIGURE 107 APTIV: GEN 6 ADAS PLATFORM
  • FIGURE 108 APTIV: SVA PLATFORM
  • FIGURE 109 VALEO: COMPANY SNAPSHOT
  • FIGURE 110 VALEO: DRIVE4U SENSORS


The research uses extensive secondary sources, such as company annual reports/presentations, industry association publications, magazine articles, directories, technical handbooks, World Economic Outlook, trade websites, technical articles, and databases, to identify and collect information on the self-driving car market. Primary sources, such as experts from related industries, OEMs, and suppliers, have been interviewed to obtain and verify critical information and assess the growth prospects and market estimations.

Secondary Research

Secondary sources for this research study include corporate filings, such as annual reports, investor presentations, and financial statements; trade, business, and professional associations; whitepapers and self-driving car and ADAS-related journals; certified publications; articles by recognized authors; directories; and databases. Secondary data has been collected and analyzed to determine the overall market size, further validated by primary research.

Primary Research

After understanding the self-driving cars market scenario through secondary research, extensive primary research has been conducted. Primary interviews have been conducted with market experts from both demand and supply sides across North America, Europe, and Asia Pacific. Approximately 35% of interviews have been conducted from the demand side, while 65% of primary interviews have been conducted from the supply side. The primary data has been collected through questionnaires, emails, and telephone interviews.

In the canvassing of primaries, various departments within organizations, such as sales and operations, have been covered to provide a holistic viewpoint in this report. Primary sources from the supply side include various industry experts, such as CXOs, vice presidents, directors from business development, marketing, product development/innovation teams, and related key executives from various key companies. Various system integrators, industry associations, independent consultants/industry veterans, and key opinion leaders have also been interviewed.
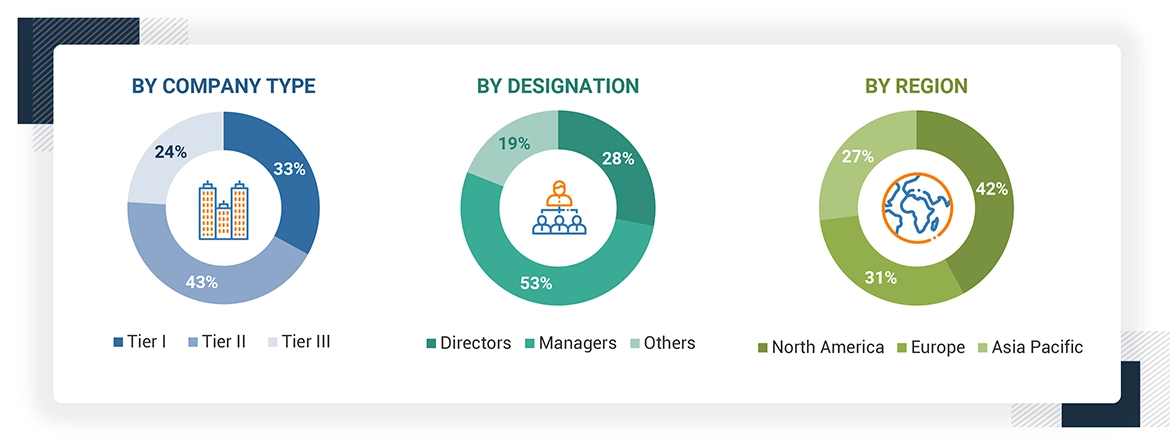
Self-driving Cars Market Size, and Share

Note: Others include sales, managers, and product managers.
Company tiers are based on the value chain; the company's revenue is not considered.

To know about the assumptions considered for the study, download the pdf brochure

Market Size Estimation

Both top-down and bottom-up approaches were used to estimate and validate the total size of the self-driving car market. These methods were also used extensively to estimate the size of various subsegments in the market. The research methodology used to estimate the market size includes the following:

Self-driving Cars Market : Top-Down and Bottom-Up Approach

Self-driving Cars Market Top Down and Bottom Up Approach

Data Triangulation

After arriving at the overall market size of the global market through the methodology mentioned above, this market was split into several segments and subsegments. The data triangulation and market breakdown procedures were employed to complete the overall market engineering process and arrive at the exact market value data for the key segments and sub-segments, wherever applicable. The extrapolated market data was triangulated by studying various macro indicators and regional trends from both the demand and supply-side participants.

Market Definition

Self-driving cars are technologies capable of performing dynamic driving tasks, with or without human supervision. The California DMV defines autonomous mode as when the technology manages driving operations independently. At the same time, SAE Level 5 autonomy represents vehicles capable of moving under all conditions without human intervention, even with a user in the driver's seat.

Stakeholders

  • ADAS Integrators
  • ADAS Solution Suppliers
  • Associations, Forums, and Alliances related to Autonomous Vehicles
  • Automotive Component Manufacturers
  • Automotive Industry Associations, Government Authorities, and Research Organizations
  • Automotive OEMs
  • Automotive Sensor Manufacturers
  • Automotive SoC and ECU Manufacturers
  • Automotive Software and Platform Providers
  • Autonomous Driving Platform Providers
  • Autonomous Vehicle Manufacturers
  • Country-specific Automotive Associations
  • European Automobile Manufacturers Association (ACEA)
  • Government and Research Organizations
  • National Highway Traffic Safety Administration (NHTSA)
  • Transport Authorities
  • Vehicle Safety Regulatory Bodies

Report Objectives

  • To analyze and forecast the self-driving cars market in terms of volume (thousand units) and value (USD million) from 2024 to 2035
  • To segment the market by Level of Autonomy, Component Type, Mobility Type, Vehicle Class, and region
    • To segment and forecast the market by Level of Autonomy (Semi-autonomous (L1, L2, and L3), and Autonomous (L4 and L5))
    • To segment and forecast the market by Component Type (Camera, LiDAR, Radar, Ultrasonic Sensors, Infrared Sensors, and Others)
    • To segment and forecast the market by Mobility Type (Personal Mobility and Shared Mobility)
    • To segment and forecast the market by Vehicle Class (A&B, C&D, and E&F)
    • To forecast the market by region [North America, Europe, and Asia Pacific]
  • To identify and analyze key drivers, challenges, restraints, and opportunities influencing the market growth
  • To strategically analyze the market for individual growth trends, prospects, and contributions to the total market
  • To study the following with respect to the market
    • Pricing Analysis
    • Investment and Funding Scenario
    • Value Chain Analysis
    • Ecosystem Analysis
    • Technology Analysis
    • Trade Analysis
    • Case Study Analysis
    • Patent Analysis
    • Regulatory Landscape
    • Key Stakeholders and Buying Criteria
    • Key Conferences and Events
  • To strategically profile the key players and comprehensively analyze their market share and core competencies
  • To analyze the impact of AI on the market
  • To track and analyze competitive developments such as deals, product launches/developments, expansions, and other activities undertaken by the key industry participants

Available Customizations

With the given market data, MarketsandMarkets offers customizations in accordance with the company's specific needs.

  • Additional Company Profiles (Up to 5)
  • Global Self-driving cars market, By Level of Autonomy, at Country Level
  • Global Self-driving cars market, By EV Type, at Country Level

Previous Versions of this Report

Semi-Autonomous and Autonomous Vehicles Market by Technology, Components, Powertrain (Conventional Vehicle, Hybrid Vehicle, and Electric Vehicle) and Region - Global Forecast to 2021 & 2030

Report Code AT 2090
Published in May, 2017, By MarketsandMarkets™

Semi Autonomous Market For Passenger Car By Type (Adaptive Cruise Control, Lane Keep Assist, Autonomous Park Assist & Adaptive Lights), By Technology, By Geography, & Autonomous Car (Qualitative Trends & Technologies) – Global Trends & Forecast To 2018

Report Code AT 2090
Published in Aug, 2013, By MarketsandMarkets™
"Our USP is "providing game-changing business opportunities reports with free customization" - so please feel free to provide us with your specific areas of interest / business challenges in much greater detail !!"

We appreciate your interest in this report. Once you fill out the form, you'll be immediately directed to an exclusive solution tailored to your needs. This high-value offering can help boost your revenue by 30% - a must-see opportunity for anyone looking to maximize growth.


By clicking the "Submit" button, you are agreeing to the Terms of Use and Privacy Policy.

Custom Market Research Services

We Will Customise The Research For You, In Case The Report Listed Above Does Not Meet With Your Requirements

Get 10% Free Customisation

Growth opportunities and latent adjacency in Self-driving Cars Market

DMCA.com Protection Status