7500+ companies worldwide approach us every year for their revenue growth initiatives
2
80% of Fortune 2000 companies rely on our research to identify new revenue sources
3
Top 2000 strategists around the world rely on us for their growth roadmap/initiatives
Automotive Wiring Harness Market by Application (Engine, Chassis, Cabin, Body & Lighting, HVAC, Battery, Dashboard/Cabin, Seat, Sunroof, Door), ICE & EV Transmission Type, Data Rate, Component Material & Region - Global Forecast to 2030
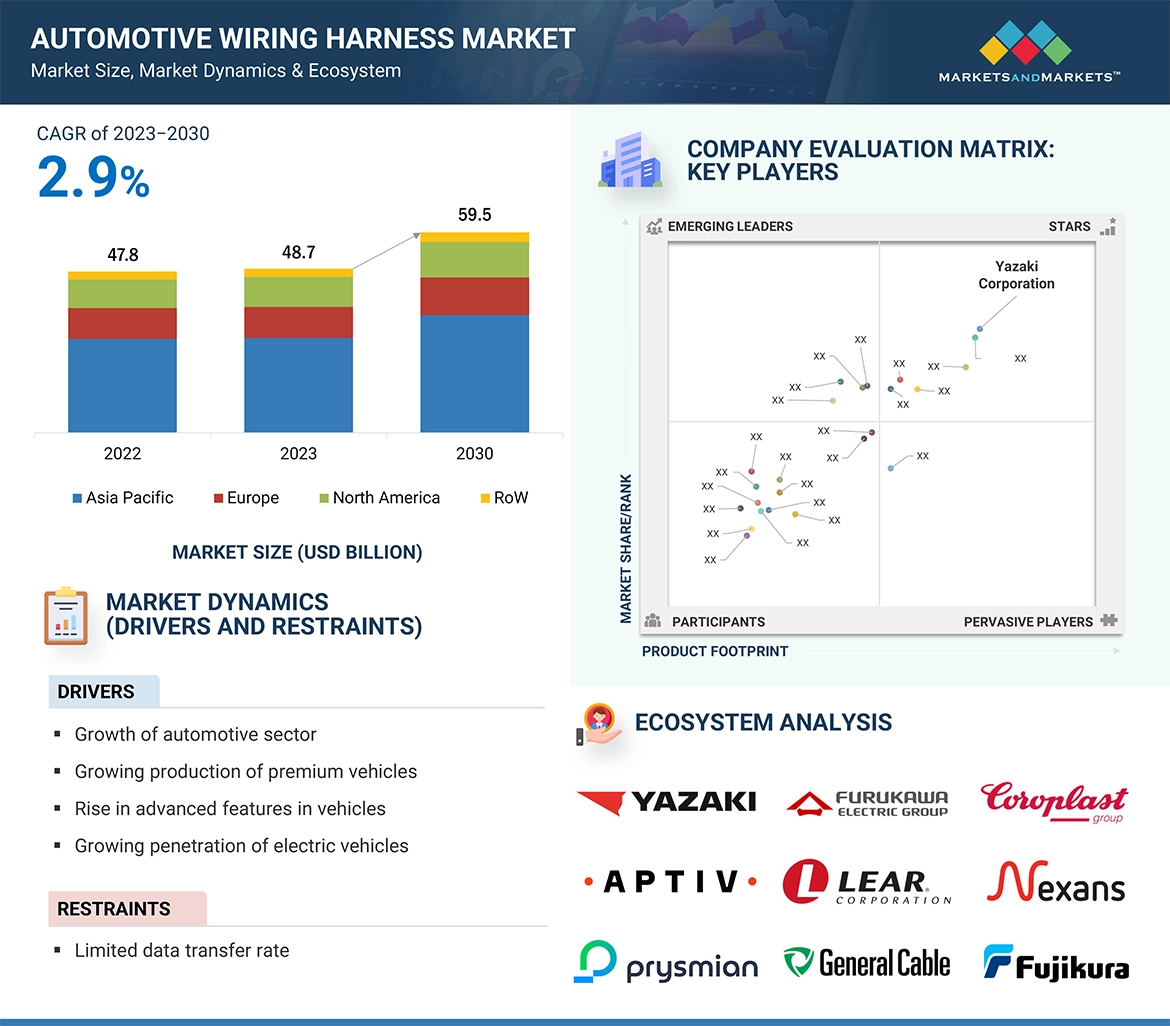
The global automotive wiring harness market size was valued at USD 48.7 billion in 2023 and is expected to reach USD 59.5 billion by 2030, at a CAGR of 2.9%, during the forecast period 2023-2030. The market has shown significant growth recently. Top OEMs are investing in the same, which would further drive the demand for high-speed data transmission wiring harnesses. Though the need for electronic features is growing in Europe and North America, Asia Pacific remains the key market.
Attractive Opportunities in the Automotive Wiring Harness Market
ASIA PACIFIC:
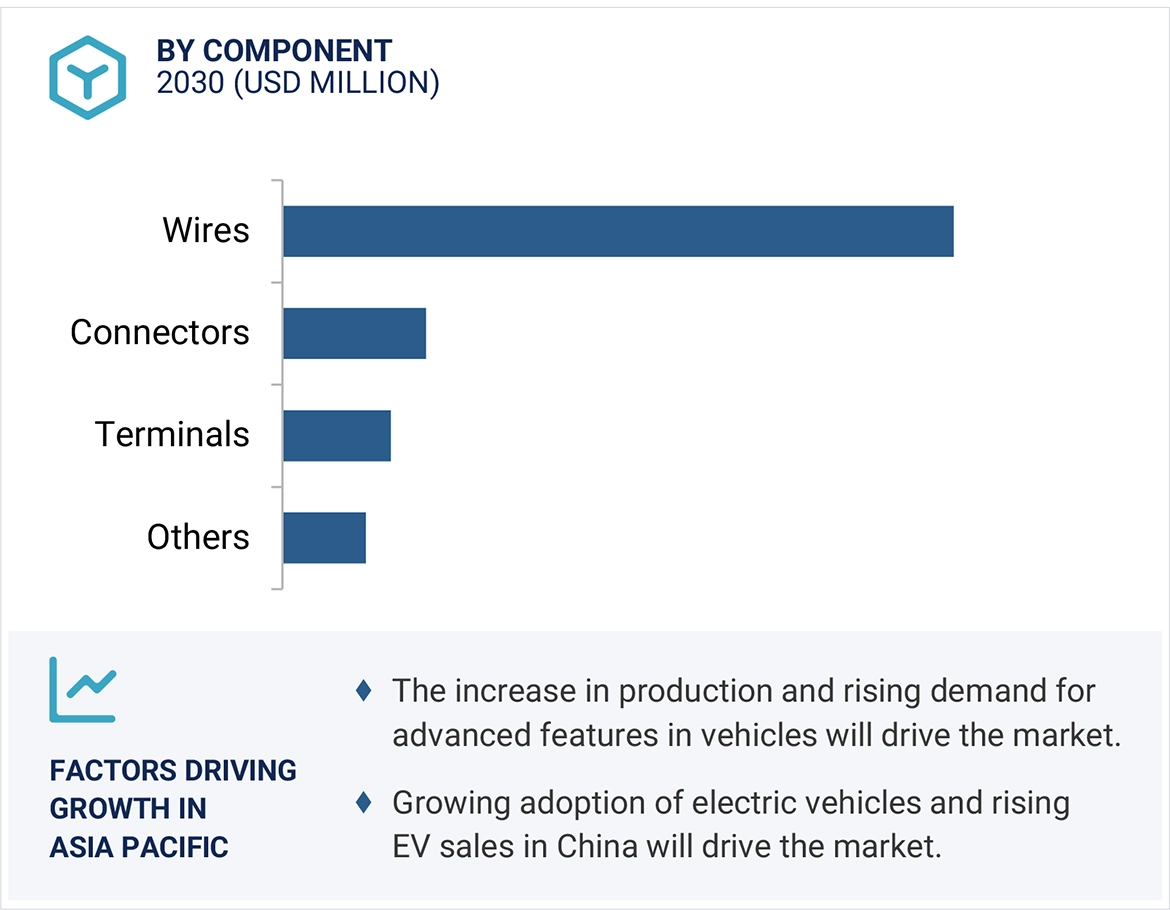
Market growth in the Asia Pacific can be attributed due to higher growth production and increasing applications of wiring harness in vehicles and due to increase in sales of electric vehicles in China and India.
Market growth can be attributed to increasing vehicle production, increase in demand for advanced features in vehicles, and growing penetration of electric vehicles.
Growing trend of autonomous and semi-autonomous vehicles and demand for lightweight harnesses would create growth opportunities for the automotive wiring harness market.
Technological advancements and increasing use of optical fiber in wiring harness would offer lucrative opportunities for market players in next five years.
The growth of market in Europe can be attributed to the increase in demand for advanced vehicle features in the region.
Global Automotive Wiring Harness Market Dynamics
DRIVER: Rise in Advanced Features in Vehicles
The automotive industry is witnessing a growing emphasis on safety and security, driving the demand for driver-assist technologies like Adaptive Cruise Control (ACC), Blind-Spot Detection (BSD), Advanced Front Lighting (AFL), and Lane Keeping Assist (LKA) to incorporate advanced features into vehicles. ACC systems rely on radar and sensors to maintain a safe following distance from the vehicle in front. Advanced parking systems, including 360-degree cameras and proximity sensors, rely on wiring harnesses to transmit data to the vehicle’s infotainment screen or instrument cluster, aiding drivers during parking maneuvers. All these systems require wiring harnesses to transfer data from the sensors to the vehicle’s steering system. Also, the surge in consumer demand for advanced features in vehicles is a significant driving factor behind the growth of the automotive wiring harness market. To meet these expectations, automakers are incorporating intricate electrical and electronic components in modern vehicles, increasing the dependency on wiring harnesses. The rise of electric and hybrid vehicles further amplifies this demand, with specialized wiring harnesses becoming pivotal for battery management, powertrains, and charging infrastructure. Moreover, the increasing integration of the Internet of Things (IoT) in vehicles and the need for customization and adherence to stringent regulations has driven the need for more complex and adaptable wiring solutions. As a result, automotive wiring harnesses are pivotal components in the evolving automotive industry, facilitating the safe and efficient operation of these advanced features, ultimately enhancing the driving experience and safety for consumers.Additionally, there is a mandate for vehicle manufacturers to comply with safety regulations, such as the Bharat New Vehicle Safety Assessment Program (BNVSAP), which requires the inclusion of passive safety features. For example, India mandated the standard fitment of driver-side and front passenger-side airbags in new models starting in April 2021. Similarly, the US National Highway Traffic Safety Administration (NHTSA) expects automatic emergency braking systems to become standard in vehicles by 2022. Furthermore, integrating multimedia and security systems has driven up the installation of cables and wiring harnesses. Comfortable features, including voice recognition systems, ambient lighting, heated seats, and advanced infotainment functionalities, have gained popularity among consumers, enhancing the overall driving experience. These features rely on onboard electronic devices that communicate through control signals powered by the vehicle’s electrical system, necessitating wiring harnesses. The increasing complexity of vehicle designs, aligned with advanced features, has led to a higher demand for wiring harnesses, consequently propelling the growth of the auto wiring harness market.The advanced features, such as voice recognition systems, ambient lighting, heated seats, heated steering wheels, enhanced infotainment functionality, digital instrument panel displays, cooled cupholders, and additional power steering functions, have gained significant traction among consumers. These rely on electronic devices that require wiring harnesses to transfer data, signals, and power efficiently. Within automotive design, wiring harness bundles are essential for the seamless operation of these diverse functionalities. Moreover, using active safety systems in vehicles has become instrumental in minimizing accidents, leveraging onboard sensors, radar, cameras, GPS, and laser technology. Notable active safety systems encompass Anti-lock Braking Systems (ABS), Electronic Stability Control (ESC), Electronic Brake-Force Distribution (EBD), Tire Pressure Monitoring Systems (TPMS), Lane Departure Warning Systems (LDWS), Automatic Emergency Braking (AEB), Blind-Spot Detection (BSD), Forward Collision Warning (FCW), and Traction Control Systems. The integration of these advanced features demands an ever-increasing number of wiring harnesses, propelling the growth of the market.
RESTRAINT: Limited data transfer rate
The growing complexity of modern vehicles, with their numerous advanced features, sensors, and connectivity options, necessitates high-speed and high-capacity data transfer. Limited data transfer rates can impede the performance of various vehicle systems, including infotainment, advanced driver-assistance systems (ADAS), and connected car features. As vehicles evolve with autonomous driving capabilities and increased connectivity, fast and reliable data transfer demand becomes even more critical. There are various advanced features in vehicles, such as a reverse parking camera, tire pressure monitoring system, and anti-lock braking system, which require the cabling from the camera to the electronic control unit (ECU) as there is no alternative to transfer the data. The traditional wiring harness can achieve a data transfer rate of up to certain kbps, and advanced features in the vehicle require high-speed data transfer in Mbps or Gbps.The companies are moving from traditional copper wiring harnesses to high-strength aluminum, high-speed twisted pair cables, and optical fiber cables to gain high-speed data rates. Companies like Bosch provide CAN FD solutions. Data rates for CAN FD can vary but may reach up to 5 Mbps or more. Companies like Broadcom, Marvell, and NXP Semiconductors provide Ethernet solutions for automotive use. Ethernet can offer data rates of 100 Mbps, 1 Gbps, or even 10 Gbps, depending on the implementation. There are different networks integrated into vehicles, such as CAN, LIN, CAN-FD, FlexRay, MOST (Media Oriented Systems Transport), and LDS (Low Voltage Differential Signaling), which transfer the data in wing-mirrors, powered seats, ambient lighting, various high-performance powertrain applications such as active suspension, adaptive cruise control, drive-by-wire, camera, and other infotainment applications.The limited data transfer rates are anticipated to affect automotive wiring harness market growth adversely. However, there is a growing interest in incorporating fiber optic technology into modern vehicles, especially as the demand for high-speed data transmission, connectivity, and advanced driver assistance systems (ADAS) continues to rise. Some luxury and high-end vehicles already feature fiber optic networks for infotainment and communication systems. For instance, Mercedes-Benz S-Class models feature a fiber optic-based infotainment system, offering high-quality audio and connectivity options. BMW 7 Series offers advanced infotainment and connectivity features. Some models incorporate fiber optic networks to support high-definition audio and multimedia systems. Companies like Sumitomo Electric Industries Ltd., Leoni AG, and Aptiv PLC have products offering high-speed data transfer technology to meet the demand.
OPPORTUNITY: Increase in use of high voltage wiring harnesses and optical fiber cables
The rise in electric and hybrid vehicles has necessitated the adoption of high voltage wiring harnesses to efficiently manage the flow of electrical power within these vehicles. High voltage wiring harnesses are vital for connecting the battery packs, power inverters, and electric motors, enabling the reliable operation of these electrified powertrains. As the market for electric vehicles continues to expand, the demand for specialized high voltage wiring solutions is expected to surge.High-voltage cables are a significant advancement in power transmission compared to traditional copper wires of the same size. The amount of power a cable can handle is directly linked to its voltage level, meaning higher voltage cables can carry much more power. For instance, a 100 kV cable can transport 100 times the power of a 1 kV cable. Importantly, these high-voltage cables are more powerful, lighter, and robust than their copper counterparts. Their reduced weight aligns with the ongoing trend of making electric vehicles (EVs) lighter. Moreover, their durability makes them an excellent choice for demanding automotive environments.In electric vehicles (EVs), optical fiber cables are being used to transmit data between different parts of the vehicle. These cables offer some key advantages over the traditional copper wires. They have a higher data capacity, meaning they can transfer more information quickly. They are also not affected by electromagnetic interference, which can disrupt data transmission in high-tech automotive settings where many electronic systems and sensors are at work nearby. Additionally, optical fiber cables are lighter, contributing to the goal of making EVs more lightweight and efficient. This makes them a great choice for modern, technology-packed cars. The PMMA-based graded-index plastic optical fiber can achieve a maximum bandwidth of approximately 3 GBPS when spanning 100 meters. While fiber optics offer several advantages, such as high data transfer rates, immunity to electromagnetic interference, and potential weight savings, the automotive industry traditionally relies on copper wiring for its electrical and data transmission needs. ABB Ltd., Cable Corporation of India Limited., Finolex Cables Ltd., Nexans SA., NKT A.S., Prysmian SpA., Siemens AG., and Southwire Company LLC. are some companies producing high-voltage automotive cables.With the growing adoption of BEVs, the demand for high voltage wiring harnesses will also increase, further driving the automotive wiring harness market. Global battery electric vehicle sales increased from 14,23,000 units in 2018 to 67,67,716 units in 2022. Increasing battery electric vehicle sales would have a direct impact on the ev wiring harness market. Companies like Furukawa, Sumitomo Electric Industries Ltd., Leoni AG, and others have also developed high voltage wiring harnesses and are working on improving these cables.
CHALLENGE: Fluctuating copper costs due to increasing demand
The automotive industry heavily relies on copper for manufacturing wiring harnesses. Copper is an excellent conductor of electricity and is widely used in wiring due to its reliability and conductivity. Copper is preferred for wiring harnesses due to its favorable characteristics, including ease of assembly, compact bundle size, high electrical conductivity, flexibility, and reliability. However, the pricing of copper can be a significant challenge due to fluctuations driven by supply and demand imbalances.The global demand for copper greatly influences its price, making it susceptible to continual increases. While copper and its alloys are versatile and widely used in various applications, many wiring harness manufacturers use aluminum as an alternative due to its lightweight and cost-effectiveness. Aluminum’s lower conductivity necessitates larger wire sizes for the same power rating. Additionally, aluminum requires specific termination technology to overcome challenges such as galvanic corrosion, oxidation, aging-related deformation, high thermal expansion, and lower flexibility and tensile strength. Consequently, copper remains the primary choice for wiring harness applications, although its fluctuating prices can impact the profitability of manufacturers. Moreover, the automotive industry has witnessed an increase in the use of copper per vehicle, particularly in regions like China, where the average copper weight per vehicle grew from 10.3 kg in 2016 to 14 kg in 2019. This increasing usage of copper in vehicles further exacerbates the impact of copper price fluctuations on automotive wiring harness costs, posing a challenge for manufacturers.Additionally, the unstable copper prices have repercussions for the automotive wire market of optical fiber cables. Original Equipment Manufacturers (OEMs) consider optical fibers a more durable alternative to copper or aluminum, capable of withstanding harsh environments and adverse weather conditions. However, optical fiber cables are relatively more expensive, potentially limiting their adoption. Furthermore, the expanding electric vehicle (EV) market is expected to influence copper demand considerably over the coming decade. A study conducted by the International Copper Association (ICA) in collaboration with IDTechEx revealed the crucial role of copper in various aspects of EV technology, from batteries and electric motors to wiring and charging infrastructure. The increasing adoption of EVs, driven by technological advancements, cost-efficiency, and a growing electric charger infrastructure, is anticipated to substantially increase copper demand. It is projected that by 2027, the number of electric vehicles on the road will increase to an estimated 27 million, up from 3 million in 2017, leading to a significant surge in copper demand, expected to reach 1.74 million tons in 2027.
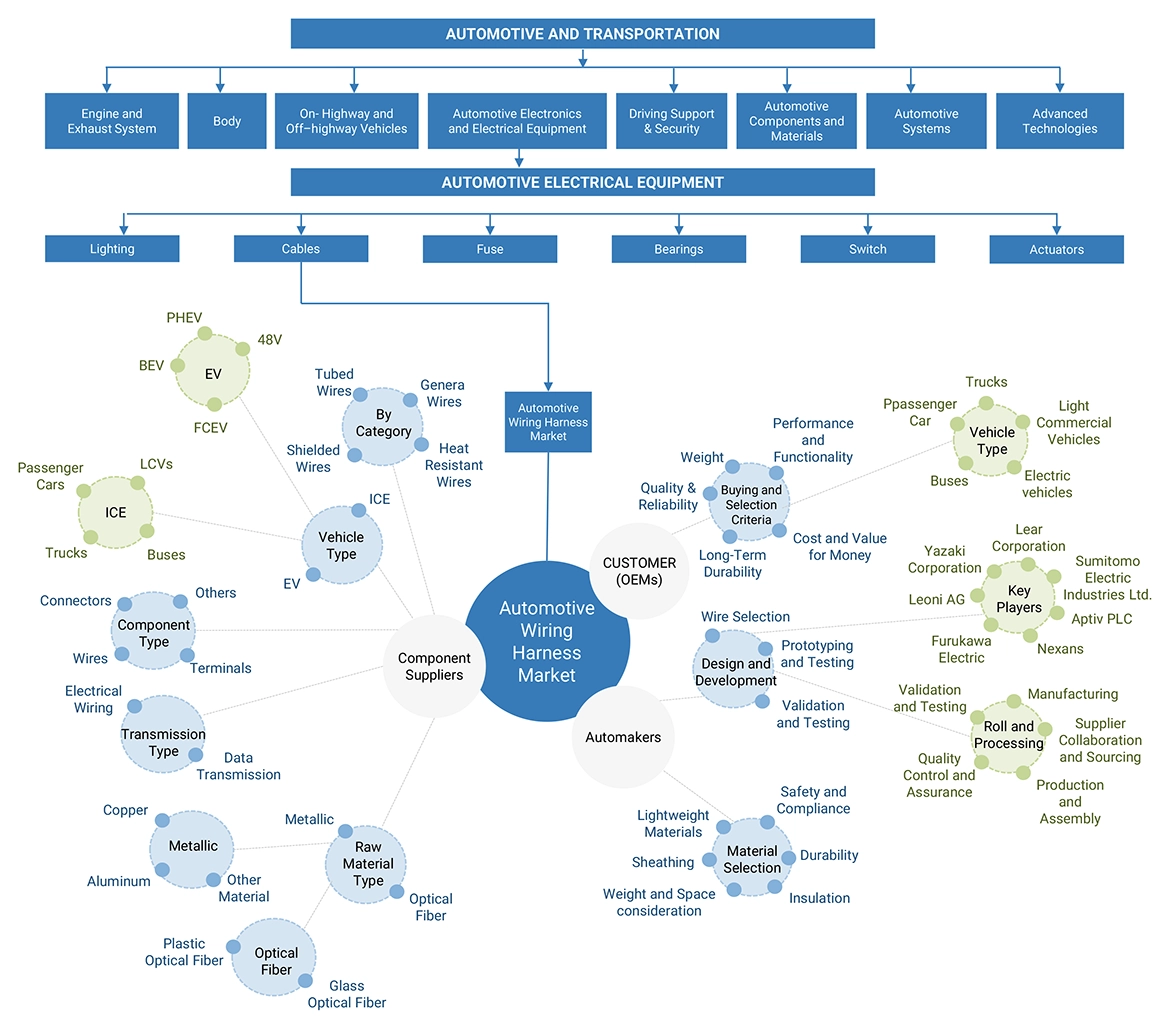
Global Automotive Wiring Harness Market Ecosystem Analysis
The ecosystem analysis highlights automotive wiring harness market players, primarily represented by component manufacturers, manufacturers, and dealers.
The chassis harness segment is estimated to be the largest market during the forecast period.
The Chassis harness segment is estimated to be the largest during the forecast period. The chassis of a vehicle is a central hub for various electrical components and systems, including those related to steering, braking, suspension, and stability control. Chassis wiring harnesses connect and interlink these components, which can be complex. As vehicles become more advanced with features like electronic stability control, adaptive suspension systems, and advanced braking systems, the complexity of chassis wiring increases. In Asia Pacific, the chassis wiring harness market is projected to hold the largest share during the forecast period in terms of value. The application of chassis wiring harnesses is expected to increase in Asia Pacific due to the increasing number of buses and trucks in the region. Increasing number of commercial vehicles in developing countries and growth in the ecommerce industry are major drivers of the chassis wiring harness market.
The electrical wiring harness market in ICE vehicles is anticipated to dominate based on transmission type.
Electrical wiring harnesses are fundamental vehicle components, connecting and supplying power to various electrical and electronic systems. These harnesses ensure the efficient and reliable operation of a wide range of vehicle functions, including lighting, power distribution, safety systems, infotainment, and more, and facilitate the operation of critical components, systems, and features, contributing to vehicle safety, performance, and functionality. They are used for transferring signals and power within the vehicle. According to primary respondents, electrical wiring accounts for almost 75-80% of the share in wiring harnesses by value. The predominance of electrical wiring harnesses is driven by modern vehicles’ increasing complexity and electrification, which require extensive and intricate electrical systems to support advanced features and functionalities. Ongoing developments focus on improving performance, reducing weight, and meeting environmental standards. Electrical wiring harness design holds paramount significance in vehicle engineering and performance. Primarily, it ensures the vehicle's safety by connecting crucial components like airbags and brake lights, preventing electrical malfunctions that could lead to accidents. Asia Pacific has the largest market share in electrical wiring due to increasing vehicle connectivity and functions. With advancements in technology, the number of tasks in a vehicle is expected to grow further.The motor management harness is the fastest-growing segment in the high-voltage wiring harness segment.High voltage wiring harnesses are crucial in motor management within electric vehicles (EVs) and hybrid electric vehicles (HEVs). These components transmit high-voltage electricity between various parts of the vehicle’s electrical system, including the power source (usually a high-voltage battery) and the electric motor or motors responsible for propulsion and energy regeneration. The demand for high-voltage systems has surged as the automotive industry continues to shift towards greater electrification, encompassing electric and hybrid vehicles. High voltage systems, including electric motors, power inverters, and battery management systems, are integral to electrified powertrains.EVs and HEVs use electric motors to power the vehicle, and the MMS is responsible for controlling the operation of these motors. As more and more people switch to EVs and HEVs, the demand for MMS harnesses is expected to continue to grow. Companies like TE Connectivity, Yazaki Corporation, Sumitomo Electric Industries, Ltd., etc., are developing high voltage wiring harnesses that are designed to meet the needs of electric vehicles (EVs), hybrid electric vehicles (HEVs), and plug-in hybrid electric vehicles (PHEVs). For instance, Guchen Electronic provides a drive motor high-voltage wire harness, a vital link between the electric motor and the high-voltage battery pack in electric vehicles. Crafted with premium components and dual insulation, this wiring harness offers excellent electrical properties, including robust insulation resistance and high current-carrying capacity, supporting currents of up to 300A. Sumitomo Electric has also introduced two innovative products in response to evolving trends in electric vehicles, one of which is designed as a direct connector that enables the seamless connection between the inverter and motor through high-voltage connectors.
ASIA PACIFIC Region Holds the Largest Share of the Automotive Wiring Harness Market
The study scope considers the Asia-Pacific region comprising countries - China, India, Japan, South Korea, Thailand, and the Rest of Asia-Pacific. In 2023, the Asia-Pacific region accounted for a 58% share of the global market in value. Increased vehicle production in China, India, and Japan contributed to the market’s growth. China was also the major contributor to the overall automotive wiring harness sales (approximately 55%) in the Asia-Pacific region in 2023.
Recent Developments of Automotive Wiring Harness Market Industry
In May 2023, Sumitomo Electric and NICT (National Institute of Information and Communications Technology) developed the world’s first 19-core optical fiber with a standard outer diameter. They set a new world record for transmission capacity. The new fiber can transmit 1.6 terabits per second (Tbsp.) over 10,000 kilometres, which is twice the capacity of the previous record holder. The development of this new fiber is a breakthrough for long-distance optical communication and is expected to be used in future 5G and beyond 5G networks. In May 2023, Sumitomo Electric Wiring Systems will invest approximately USD 10 million in manufacturing harnesses, becoming the first Tier 1 automotive company to establish operations in Tabasco, Mexico. Tabasco has seen a remarkable 24.3% growth in economic activity, positioning itself as an attractive destination for automotive investment. The company will be located near key transportation routes in the Tabasco Business Center industrial park. In March 2022, Morocco’s Ministry of Industry and Trade has inked eight investment agreements with prominent international automotive suppliers like Yazaki, Sumitomo, Lear, Stahlschmidt, and TE Connectivity, totalling USD 175 million in investments and promising the creation of 12,000 direct jobs. Yazaki Group has entered into three agreements for substantial investments in Morocco’s automotive sector. This includes the construction of a new wiring production plant in Meknes and expanding existing facilities in Kenitra and Tangier.
In December 2022, Aptiv PLC successfully acquired an 85% equity stake in Intercable Automotive Solutions from Intercable S.r.l., with the deal valued at USD 627 MN. Intercable Automotive Solutions, a leader in high-voltage power distribution and interconnect technology, will be an independent business unit under Aptiv’s Signal & Power Solutions segment, maintaining its existing brand. This acquisition strengthens Aptiv’s global leadership in vehicle architecture systems. In June 2022, Furukawa Electric secured deals with eight automakers to use its aluminium wire harnesses in one hundred vehicle models by 2025, mainly targeting European automakers. The company will continue developing aluminium harnesses to further reduce weight as the global shift toward EVs accelerates.
Key Market Players
Key Players in the Automotive Wiring Harness Market Include
Yazaki Corporation (Japan), Sumitomo Electric Industries, Ltd. (Japan), Aptiv PLC (Ireland), Furukawa Electric (Japan), and Leoni AG (Germany).
Fastest Growing Market
Asia Pacific
Largest Market
Asia Pacific
Forecast units
Volume (Units) and Value (USD Million)
Segments covered
By application, ICE vehicle type by transmission type and application, Electric vehicle type by transmission type and application, component, material, data transmission harness market, by data rate, by high voltage and region.
ICE, By Application
Engine harnesses, chassis harnesses, body & lighting harnesses, HVAC harnesses, dashboard/cabin harnesses, battery harnesses, seat harnesses, sunroof harnesses, and door harnesses
EV, By Application
Traction, engine harnesses, chassis harnesses, body & lighting harnesses, HVAC harnesses, dashboard/cabin harnesses, battery harnesses, seat harnesses, sunroof harnesses, and door harnesses
By Component
Connectors, terminals, wires, others.
By Material type
Metallic and Optical Fiber
By Transmission type
Electrical wiring and Data Transmission
Data transmission harness market by data transfer rate
<150 Mbps and 150 Mbps to 1 Gbps
High Voltage Wiring Harness
Battery and battery management system, Motor management harness
By Region
Asia Pacific North America Europe Rest of the World
Additional customization to be offered
Automotive Wiring Harness Market, By Application and Country Automotive Wiring Harness Market, By Type and Country
Key Questions Addressed by the Report
What is the current size of the global automotive wiring harness market?
The global automotive wiring harness market is estimated to be USD 48.7 billion in 2023, with Asia-Pacific dominating the market.
Which application is currently leading the automotive wiring harness market?
Chassis application is leading in the automotive wiring harness market.
Many companies are operating in the automotive wiring harness market space across the globe. Do you know who the front leaders are, and what strategies they have adopted?
Yazaki Corporation (Japan), Sumitomo Electric Industries (Japan), Aptiv PLC (Ireland), Furukawa Electric (Japan), and Leoni AG (Germany) are the prominent players in the automotive wiring harness market. These companies adopted new product launches, acquisitions, and joint venture strategies to gain traction in the automotive wiring harness market.
How does the demand for automotive wiring harness vary by region?
Asia-Pacific is estimated to be the largest market for automotive wiring harnesses during the forecast period, followed by Europe. The growth of the automotive wiring harness market in Asia-Pacific is mainly attributed to the higher demand for automotive wiring harnesses from China due to higher vehicle production.
What are the growth opportunities for the automotive wiring harness supplier?
The demand for autonomous and semi-autonomous vehicles and lightweight harnesses would create growth opportunities for the automotive wiring harness market. The need for high-speed data transmission cables, high voltage wiring harness components, and lightweight material are the trends that reflect the industry’s response to technological advancements, regulatory changes, and evolving consumer preferences.
How is the wiring harness market responding to the trend of autonomous vehicles?
Autonomous vehicles require extensive wiring to support advanced sensors, cameras, and computing systems. The wiring harness is integrated with the existing harnesses. This trend is driving innovation in the design and layout of wiring harnesses.
What materials are majorly used by companies for manufacturing wiring harnesses?
Companies mainly use copper due to its excellent electrical conductivity, thermal conductivity, and durability. While copper is the primary choice for its conductivity, ongoing efforts are to explore alternatives and more lightweight materials like aluminum to improve efficiency and reduce the weight of wiring harnesses in modern vehicles, particularly in electric vehicles (EVs), where weight reduction is crucial.
FIGURE 61 SUMITOMO ELECTRIC INDUSTRIES, LTD.: COMPANY SNAPSHOT
FIGURE 62 YAZAKI CORPORATION: COMPANY SNAPSHOT
FIGURE 63 APTIV PLC: COMPANY SNAPSHOT
FIGURE 64 LEONI AG: COMPANY SNAPSHOT
FIGURE 65 FURUKAWA ELECTRIC: COMPANY SNAPSHOT
FIGURE 66 NEXANS: COMPANY SNAPSHOT
FIGURE 67 LEAR CORPORATION: COMPANY SNAPSHOT
FIGURE 68 FUJIKURA LTD.: COMPANY SNAPSHOT
FIGURE 69 SAMVARDHANA MOTHERSON INTERNATIONAL LIMITED (SAMIL): COMPANY SNAPSHOT
FIGURE 70 GEBAUER & GRILLER GROUP: COMPANY SNAPSHOT
The study involves four main activities to estimate the current size of the automotive wiring harness market.
Exhaustive secondary research was done to collect information on the market, such as application, transmission type, category, component, material, ICE by transmission type & application & electric vehicle by transmission type & application, high voltage, and region.
The next step was to validate these findings, assumptions, and market analysis with industry experts across value chains through primary research.
Bottom-up and top-down approaches were employed to estimate the complete market size for different segments considered in this study.
After that, market breakdown and data triangulation processes were used to estimate the market size of segments and subsegments.
Secondary Research
Secondary sources in this research study included the Organization Internationale des Constructeurs d'Automobiles (OICA); corporate filings (such as annual reports, investor presentations, and financial statements); and trade, business, and automotive wiring harness associations. The secondary data was collected and analyzed to determine the overall market size, further validated by primary research.
Primary Research
Extensive primary research was conducted after understanding the automotive wiring harness market scenario through secondary research. Several primary interviews were conducted with market experts from automotive wiring harness providers, component/system providers, and end-user organizations across three major regions: North America, Europe, and Asia Pacific. Approximately 80% of the primary interviews were conducted with the automotive wiring harness and component/system providers and 20% from the end-user organizations. Primary data was collected through questionnaires, emails, and telephonic interviews. Various departments within organizations, including sales, operations, and administration, were contacted to provide a holistic viewpoint in the report while canvassing primaries. After interacting with industry participants, some brief sessions were conducted with experienced independent consultants to reinforce the findings from the primaries. This and the opinions of in-house subject matter experts led to the findings delineated in the rest of this report.
A detailed market estimation approach was followed to estimate and validate the value and volume of the automotive wiring harness market and other dependent submarkets, as mentioned below:
The bottom-up approach was used to estimate and validate the size of the market. The market size by application, in terms of volume, was derived by multiplying the region-level breakup for each application (engine harness, chassis wiring harness, body & lighting harness, HVAC harness, dashboard/ cabin harness, battery harness, seat harness, sunroof harness, traction harness (EVs) and door harness) with region-level automotive wiring harness sales.
The region-level market by application by volume is multiplied with the region-level average selling price (ASP) for each application to get the market for each application by value.
The summation of the region-level market would give the global market by application (engine harness, chassis wiring harness, body & lighting harness, HVAC harness, dashboard/ cabin harness, battery harness, seat harness, sunroof harness, and door harness). The total value of each region was then summed up to derive the total value of the market by application.
All key macro indicators affecting the revenue growth of the market segments and subsegments were accounted for, viewed in extensive detail, verified through primary research, and analyzed to get the validated and verified quantitative and qualitative data.
The gathered market data was consolidated and added with detailed inputs, analyzed, and presented in this report.
The top-down approach estimated and validated the market by transmission type regarding volume and value. The market value (USD million) by region (Asia Pacific, North America, Europe, and RoW) was derived from the global market. The penetration of each transmission type (electrical wiring and data transmission) at the regional level was derived from secondary sources and validated through primaries. The penetration of each transmission type (electrical wiring and data transmission) was multiplied by the regional market to get the market value (USD million), by transmission type for each region. All region-wise markets were summated to derive the total automotive wiring harness market value (USD million) by transmission type. The top-down approach was followed by ICE vehicle by transmission type, material type, data rate, component, and electric vehicle by transmission segments.
To define, describe, and forecast the size of the automotive wiring harness market in terms of volume and value
By application [engine harnesses, chassis harnesses, body & lighting harnesses, HVAC harnesses, dashboard/cabin harnesses, battery harnesses, seat harnesses, sunroof harnesses, and door harnesses]
By component (connectors, wires, terminals, and others) (in terms of value only)
By material type [metallic (copper, aluminum, and other materials) and optical fiber
(glass optical fiber and plastic optical fiber)] (in terms of value only)
ICE & electric vehicles by transmission type (data transmission and electrical wiring) (in terms of value only)
By data rate (<150 Mbps and 150 MBPS to 1 GBPS) (in terms of value only)
By ICE vehicle type (passenger cars, light commercial vehicles, buses, trucks) & mapped applications (engine harnesses, chassis harnesses, body & lighting harnesses, HVAC harnesses, dashboard/cabin harnesses, battery harnesses, seats, sunroof, and door harnesses)
By electric vehicle type (BEVs, PHEVs, and FCEVs) & mapped applications (traction harnesses, engine harnesses, chassis harnesses, body & lighting harnesses, HVAC harnesses, dashboard/cabin harnesses, battery harnesses, seat, sunroof, and door harnesses)
By high voltage wiring harness (battery and battery management system, motor management harness)
By region [Asia Pacific, North America, Europe, and the Rest of the World (RoW)]
To qualitatively analyze and assess the market for 48V architecture vehicles by region
To qualitatively analyze and evaluate the market based on category (general wires, heat resistant wires, shielded wires, and tubed wires)
To understand the market dynamics (drivers, restraints, opportunities, and challenges) of the market
To analyze the share of leading players in the automotive wiring harness market and evaluate competitive leadership mapping
To strategically analyze the key player strategies/right to win and company revenue analysis
To strategically analyze the market with supply chain analysis, market ecosystem, trade analysis, case studies, ASP analysis, patent analysis, trends/disruptions impacting buyers, technology trends, regulatory analysis, and the recession impact.
To analyze recent developments, including new product launches, expansions, and other activities undertaken by key industry participants in the market
Available Customizations
Along with the given market data, MarketsandMarkets offers customizations in accordance with a company’s specific needs
Automotive Wiring Harness Market, By Application & Country
Asia Pacific
China
India
Japan
South Korea
Thailand
Rest of Asia Pacific
Europe
Germany
France
UK
Spain
Russia
Italy
Rest of Europe
North America
US
Canada
Mexico
RoW
Brazil
South Africa
Others
Automotive Wiring Harness Market, By Type & Country
Asia Pacific
China
India
Japan
South Korea
Thailand
Rest of Asia Pacific
Europe
Germany
France
UK
Spain
Russia
Italy
Rest of Europe
North America
Previous Versions of this Report
Automotive Wiring Harness Market by Application (Engine, Chassis, Cabin, Body & Lighting, HVAC, Battery, Seat, Sunroof, Door), Transmission Type (Data, Electrical), Date Rate, ICE & Electric Vehicle, Component, Material, & Region - Global Forecast to 2026
Report CodeAT 2837
Published inDec, 2021, By MarketsandMarkets™
Automotive Wiring Harness Market by Application (Engine, Chassis, Cabin, Body & Lighting, HVAC, Battery, Seat, Sunroof, Door), Transmission Type (Data & Electrical), Category, ICE & Electric Vehicle, Component, Material, and Region - Global Forecast to 2027
Report CodeAT 2837
Published inNov, 2019, By MarketsandMarkets™
Automotive Wiring Harness Market by Application (Engine, Dashboard/Cabin, Body & Lighting, Airbag, HVAC, Battery), Propulsion, Vehicle (PC, LCV, Buses, Trucks), EV type, Component (Connectors, Wires, Terminals), Material, and Region - Global Forecast to 2025
Report CodeAT 2837
Published inMay, 2018, By MarketsandMarkets™
Automotive Wiring Harness Market by Application (Chassis, Body, Engine, HVAC, and Speed Sensors), Vehicle Type (Light, and Heavy), EV Type (PHEV, BEV, and HEV), Component Type (Connectors, Terminals), Material Type, and Region - Global Forecast to 2021
Report CodeAT 2837
Published inMar, 2017, By MarketsandMarkets™
Automotive Wiring Harness Market by Vehicle Type (Light Vehicles, Heavy Vehicles), Application Type (Chassis, Body Engine, HVAC, Speed Sensors), by Geography - Global Trends and Forecast to 2019
Report CodeAT 2837
Published inNov, 2014, By MarketsandMarkets™
Custom Market Research Services
We Will Customise The Research For You, In Case The Report Listed Above Does Not Meet With Your Requirements
Growth opportunities and latent adjacency in Automotive Wiring Harness Market
Devang
Jul, 2022
Automotive Wiring Harness Market comparison (ratings) illustrating the strength of Product portfolio of different companies including Leoni in four parameters:
a. Product offerings
b. R&D Expenditure
c. Inorganic
d. Organic
2. Provided ratings chart in terms of Business strategy Excellence on two parameters:
a. Product Offerings � Breadth and Depth
b. R&D Expenditure
Moreover, along with major players in the market, we have provided MNM view and SWOT analysis for Leoni. The same is provided to other major 4 players as well.
This includes:
1. Furukuwa Electric
2. Aptiv PLC
3. Yazaki Corporation
4. Sumitomo Electric Industries.
Before You Go
Expand Beyond Automotive Wiring Harness Market
Explore the top 20 industries influencing your market growth


Devang
Jul, 2022
Automotive Wiring Harness Market comparison (ratings) illustrating the strength of Product portfolio of different companies including Leoni in four parameters: a. Product offerings b. R&D Expenditure c. Inorganic d. Organic 2. Provided ratings chart in terms of Business strategy Excellence on two parameters: a. Product Offerings � Breadth and Depth b. R&D Expenditure Moreover, along with major players in the market, we have provided MNM view and SWOT analysis for Leoni. The same is provided to other major 4 players as well. This includes: 1. Furukuwa Electric 2. Aptiv PLC 3. Yazaki Corporation 4. Sumitomo Electric Industries.