Table of Contents
1 Introduction (Page No. - 14)
1.1 Objectives of the Study
1.2 Markets Covered
1.3 Years Considered in the Report
1.4 Currency & Pricing
1.5 Package Size
1.6 Limitation
1.7 Stakeholders
2 Research Methodology (Page No. - 17)
2.1 Research Data
2.2 Secondary Data
2.2.1 Key Secondary Sources
2.2.2 Key Data From Secondary Sources
2.3 Primary Data
2.3.1 Sampling Techniques & Data Collection Methods
2.3.2 Primary Participants
2.3.2.1 Key Industry Insights
2.4 Factor Analysis
2.4.1 Introduction
2.4.2 Demand Side Analysis
2.4.2.1 Impact of GDP on Commercial Vehicle Sales
2.4.2.2 Urbanization vs. Passenger Cars Per 1000 People
2.4.2.3 Infrastructure: Roadways
2.4.3 Supply Side Analysis
2.4.3.1 Vehicle Production Increasing in Developing Countries
2.4.4 Technological Advancements
2.4.5 Influence of Other Factors
3 Executive Summary (Page No. - 30)
4 Premium Insights (Page No. - 34)
4.1 Attractive Market Opportunities in the Automotive Gasket & Seal Market
4.2 Automotive Gasket & Seal Market, By Product Types
4.3 Metallic Gaskets to Dominate the Automotive Gasket & Seal Market
4.4 Automotive Gasket & Seal Market: Rapidly Growing Regions and Key Countries
4.5 China Holds the Largest Share in the Automotive Gasket & Seal Market, Followed By the U.S.
4.6 Automotive Gasket & Seal Market: Metallic Gaskets Have the Largest Market Size, By Value, in 2015
4.7 Life Cycle Analysis, By Region
5 Market Overview (Page No. - 41)
5.1 Introduction
5.2 Market Segmentation
5.3 Market Dynamics
5.3.1 Drivers
5.3.1.1 Technological Advancements
5.3.1.2 Increasing Vehicle Production Volume
5.3.2 Restraint
5.3.2.1 Increasing Electrification of Vehicles
5.3.3 Opportunity
5.3.3.1 Engine Downsizing & Lightweight Components Assemblies
5.3.4 Challenges
5.3.4.1 Design and Installation Issues
5.3.4.2 Dependency on Tier-Ii Suppliers
5.3.5 Burning Issue
5.3.5.1 Increasing Cost of Raw Material
5.4 Value Chain Analysis
5.5 Porter’s Five Forces Analysis
5.5.1 Threat of Substitutes
5.5.1.1 Key Components
5.5.2 Bargaining Power of Buyers
5.5.2.1 Reduction in Prices
5.5.3 Threat of New Entrants
5.5.3.1 Initial Investment
5.5.3.2 Existing Competition
5.5.4 Bargaining Power of Suppliers
5.5.4.1 Raw Material & Switching Cost
5.5.5 Intensity of Competitive Rivalry
5.5.5.1 Presence of Several Tier-Ii Companies
6 Automotive Gasket & Seal Market, By Product Type (Page No. - 49)
6.1 Introduction
6.2 Gasket
6.2.1 Metallic Gasket
6.2.2 Non- Metallic Gasket
6.3 Seal
6.3.1 O-Ring Seal
6.3.2 Lip Seal
6.3.3 Rotary Seal
6.3.4 Mechanical Seal
7 Automotive Gasket and Seal Market, By Vehicle Type (Page No. - 68)
7.1 Introduction
7.1.1 Passenger Car
7.1.2 Light Commercial Vehicles
7.1.3 Heavy Commercial Vehicles
8 Automotive Gasket and Seal Market, By Region (Page No. - 76)
8.1 Introduction
8.2 North America
8.2.1 U.S.
8.2.2 Canada
8.2.3 Mexico
8.3 Europe
8.3.1 Germany
8.3.2 France
8.3.3 U.K.
8.3.4 Spain
8.4 Asia-Pacific
8.4.1 China
8.4.2 Japan
8.4.3 South Korea
8.4.4 India
8.5 Rest of the World
8.5.1 Brazil
8.5.2 Russia
8.6 Pest Analysis
8.6.1 Political Factors
8.6.2 Economic Factors
8.6.3 Social Factors
8.6.4 Technological Factors
9 Competitive Landscape (Page No. - 116)
9.1 Overview
9.2 Market Share Analysis: Global Automotive Gasket & Seal Market
9.3 Competitive Situation & Trends
9.4 Battle for Market Share: New Product Launch Was the Key Strategy
9.5 New Product Launches
9.6 Agreements/Joint Ventures & Supply Contracts
9.7 Expansions
9.8 Acquisitions
10 Company Profiles (Page No. - 126)
(Company at a Glance, Recent Financials, Products & Services, Strategies & Insights, & Recent Developments)*
10.1 Introduction
10.2 AB SKF
10.3 Dana Holding Corporation
10.4 Federal-Mogul Holdings Corporation
10.5 Freudenberg Sealing Technologies Gmbh & Co. Kg
10.6 Flowserve Corporation
10.7 Smiths Group PLC
10.8 Trelleborg AB
10.9 Elringklinger AG
10.10 Datwyler Holding Inc.
10.11 Victor Gaskets India Limited
*Details on Company at a Glance, Recent Financials, Products & Services, Strategies & Insights, & Recent Developments Might Not be Captured in Case of
Unlisted Companies.
11 Appendix (Page No. - 160)
11.1 Insights of Industry Experts
11.2 Discussion Guide
11.3 Introducing RT: Real Time Market Intelligence
11.4 Available Customizations
11.5 Related Reports
List of Tables (87 Tables)
Table 1 Automotive Gasket & Seal Market Size, By Product Type, 2013-2020 ($Million)
Table 2 Automotive Gasket & Seal Market Size, By Product Type, 2013-2020 (‘000 Units)
Table 3 Automotive Gasket Market Size, By Region, 2013-2020 ($Million)
Table 4 Automotive Gasket Market Size, By Region, 2013-2020 (‘000 Units)
Table 5 Gasket Market Size, By Product Type, 2013-2020 ($Million)
Table 6 Automotive Metallic Gasket Market Size, By Region, 2013-2020 ($Million)
Table 7 Automotive Metallic Gasket Market Size, By Region, 2013-2020 (‘000 Units)
Table 8 Automotive Metallic Gasket Market Size, By Vehicle Type, 2013-2020 ($Million)
Table 9 Automotive Non-Metallic Gasket Market Size, By Region, 2013-2020 ($Million)
Table 10 Automotive Non-Metallic Gasket Market Size, By Region, 2013-2020 (‘000 Units)
Table 11 Automotive Non-Metallic Gasket Market Size, By Vehicle Type, 2013-2020 ($Million)
Table 12 Automotive Seal Market Size, By Region, 2013-2020 ($Million)
Table 13 Automotive Seal Market Size, By Product, 2013-2020 ($Million)
Table 14 Automotive Seal Market Size, By Product, 2012-2019 (‘000 Units)
Table 15 Automotive O-Ring Seal Market Size, By Region, 2013-2020 ($Million)
Table 16 Automotive O-Ring Seal Market Size, By Region, 2013-2020 (‘000 Units)
Table 17 Automotive O-Ring Seal Market Size, By Vehicle Type, 2013-2020 ($Million)
Table 18 Automotive Lip Seal Market Size, By Region, 2013-2020 ($Million)
Table 19 Automotive Lip Seal Market Size, By Region, 2013-2020 (‘000 Units)
Table 20 Automotive Lip Seal Market Size, By Vehicle Type, 2013-2020 ($Million)
Table 21 Automotive Lip Rotary Seal Market Size, By Region, 2013-2020 ($Million)
Table 22 Automotive Rotary Seal Market Size, By Region, 2013-2020 (‘000 Units)
Table 23 Automotive Rotary Seal Market Size, By Vehicle Type, 2013-2020 ($Million)
Table 24 Automotive Mechanical Seal Market Size, By Region, 2013-2020 ($Million)
Table 25 Automotive Mechanical Seal Market Size, By Region, 2013-2020 (‘000 Units)
Table 26 Automotive Mechanical Seal Market Size, By Vehicle Type, 2013-2020 ($Million)
Table 27 Automotive Gasket and Seal Market Size, By Vehicle Type, 2013-2020 ($Million)
Table 28 Automotive Gasket and Seal Market Size, By Vehicle Type, 2013-2020 (‘000 Units)
Table 29 Passenger Car : Automotive Gasket and Seal Market Size, By Country, 2013-2020 ($Million)
Table 30 Passenger Car: Automotive Gasket and Seal Market Size, By Product Type, 2013-2020 ($Million)
Table 31 Lcv: Automotive Gasket and Seal Market Size, By Region, 2013-2020 ($Million)
Table 32 Lcv: Automotive Gasket and Seal Market Size, By Product Type, 2013-2020 ($Million)
Table 33 Hcv: Automotive Gasket and Seal Market Size, By Region, 2013-2020 ($Million)
Table 34 Hcv: Automotive Gasket and Seal Market Size, By Product, 2013-2020 ($Million)
Table 35 Automotive Gasket & Seal Market Size, By Region, 2013-2020 ($Million)
Table 36 Automotive Gasket & Seal Market Size, By Region, 2013–2020 (Million Units)
Table 37 North America: Automotive Gasket & Seal Market Size, By Country, 2013–2020 ($Million)
Table 38 North America: Automotive Gasket & Seal Market Size, By Product Type, 2013–2020 ($Million)
Table 39 U.S.: Automotive Gasket & Seal Market Size, By Product Type, 2013–2020 ($Million)
Table 40 U.S.: Automotive Gasket & Seal Market Size, By Product Type, 2013–2020 (‘000 Units)
Table 41 U.S.: Automotive Gasket & Seal Market Size, By Vehicle Type, 2013–2020 ($Million)
Table 42 Canada: Automotive Gasket & Seal Market Size, By Product Type, 2013–2020 ($Million)
Table 43 Canada: Automotive Gasket & Seal Market Size, By Product Type, 2013–2020 (‘000 Units)
Table 44 Canada: Automotive Gasket & Seal Market Size, By Vehicle Type, 2013–2020 ($Million)
Table 45 Mexico: Automotive Gasket & Seal Market Size, By Product Type, 2013–2020 ($Million)
Table 46 Mexico: Automotive Gasket & Seal Market Size, By Product Type, 2013–2020 (‘000 Units)
Table 47 Mexico: Automotive Gasket & Seal Market Size, By Vehicle Type, 2013–2020 ($Million)
Table 48 Europe: Automotive Gasket & Seal Market Size, By Country, 2013–2020 ($Million)
Table 49 Europe: Automotive Gasket & Seal Market Size, By Product, 2013–2020 ($Million)
Table 50 Germany: Automotive Gasket & Seal Market Size, By Product, 2013–2020 ($Million)
Table 51 Germany: Automotive Gasket & Seal Market Size, By Product, 2013–2020 (‘000 Units)
Table 52 Germany: Automotive Gasket & Seal Market Size, By Vehicle Type, 2013–2020 ($Million)
Table 53 France: Automotive Gasket & Seal Market Size, By Product, 2013–2020 ($Million)
Table 54 France: Automotive Gasket & Seal Market Size, By Product, 2013–2020 (‘000 Units)
Table 55 France: Automotive Gasket & Seal Market Size, By Vehicle Type, 2013–2020 ($Million)
Table 56 U.K.: Automotive Gasket & Seal Market Size, By Product, 2013–2020 ($Million)
Table 57 U.K.: Automotive Gasket & Seal Market Size, By Product, 2013–2020 (‘000 Units)
Table 58 U.K.: Automotive Gasket & Seal Market Size, By Vehicle Type, 2013–2020 ($Million)
Table 59 Spain: Automotive Gasket & Seal Market Size, By Product, 2013–2020 ($Million)
Table 60 Spain: Automotive Gasket & Seal Market Size, By Product, 2013–2020 (‘000 Units)
Table 61 Spain: Automotive Gasket & Seal Market Size, By Vehicle Type, 2013–2020 ($Million)
Table 62 Asia-Pacific: Automotive Gasket & Seal Market Size, By Country, 2013-2020 ($Million)
Table 63 Asia-Pacific: Automotive Gasket & Seal Market Size, By Product Type, 2013-2020 ($Million)
Table 64 China: Automotive Gasket & Seal Market Size, By Product, 2013-2020 ($Million)
Table 65 China: Automotive Gasket & Seal Market Size, By Product, 2013-2020 (‘000 Units)
Table 66 China: Automotive Gasket & Seal Market Size, By Vehicle Type, 2013-2020 ($Million)
Table 67 Japan: Automotive Gasket & Seal Market Size, By Product, 2013-2020 ($Million)
Table 68 Japan: Automotive Gasket & Seal Market Size, By Product, 2013-2020 (‘000 Units)
Table 69 Japan: Automotive Gasket & Seal Market Size, By Vehicle Type, 2013-2020 ($Million)
Table 70 South Korea : Automotive Gasket & Seal Market Size, By Product, 2013-2020 ($Million)
Table 71 South Korea : Automotive Gasket & Seal Market Size, By Product, 2013-2020 (‘000 Units)
Table 72 South Korea: Automotive Gasket & Seal Market Size, By Vehicle Type, 2013-2020 ($Million)
Table 73 India : Automotive Gasket & Seal Market Size, By Product, 2013-2020 ($Million)
Table 74 India: Automotive Gasket & Seal Market Size, By Product, 2013-2020 (‘000 Units)
Table 75 India : Automotive Gasket & Seal Market Size, By Vehicle Type, 2013-2020 ($Million)
Table 76 RoW: Automotive Gasket & Seal Market Size, By Country, 2013-2020 ($Million)
Table 77 RoW: Automotive Gasket & Seal Market Size, By Product, 2013-2020 ($Million)
Table 78 Brazil: Automotive Gasket & Seal Market Size, By Product, 2013-2020 ($Million)
Table 79 Brazil: Automotive Gasket & Seal Market Size, By Product, 2013-2020 (‘000 Units)
Table 80 Brazil: Automotive Gasket & Seal Market Size, By Vehicle Type, 2013-2020 ($Million)
Table 81 Russia: Automotive Gasket & Seal Market Size, By Product, 2013-2020 ($Million)
Table 82 Russia: Automotive Gasket & Seal Market Size, By Product, 2013-2020 (‘000 Units)
Table 83 Russia: Automotive Gasket & Seal Market Size, By Vehicle Type, 2013-2020 ($Million)
Table 84 New Product Launches 2011–2014
Table 85 Agreements/Joint Ventures & Supply Contracts 2011-2014
Table 86 Expansions, 2011-2014
Table 87 Acquisitions, 2011–2014
List of Figures (57 Figures)
Figure 1 Research Design
Figure 2 Research Methodology Model
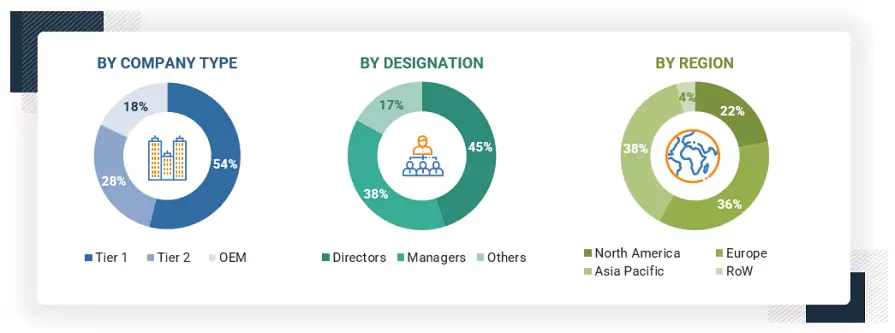
Figure 3 Breakdown of Primary Interviews: By Company Type, Designation, & Region
Figure 4 Gross Domestic Product (Gdp) vs. Commercial Vehicle Production
Figure 5 Urbanization vs. Passenger Cars Per 1000 People
Figure 6 Road Network vs. Passenger Car Sales
Figure 7 Vehicle Production, 2009-2013
Figure 8 Micro and Macro Factor Analysis
Figure 9 Market Size Estimation Methodology: Bottom-Up Approach
Figure 10 Automotive Gasket & Seal Market Snapshot (2015 vs. 2020): The Gasket & Seal Market Will Grow at a High CAGR for the Next Five Years
Figure 11 Automotive Gasket & Seal Market Snapshot (2014): Asia-Pacific to Capture the Largest Market Share
Figure 12 Mechanical Seal to Grow at the Highest CAGR of 11.1% for the Next Five Years
Figure 13 China & U.S. to Hold the Largest Market Shares, 2014
Figure 14 Mechanical Seals to Grow at the Highest CAGR in the Automotive Gasket & Seal Market
Figure 15 China & India Grow at a Highest CAGR in Automotive Gasket & Seal Market From 2015 to 2020
Figure 16 China Accounts for 26.1% of the Automotive Gasket & Seal Market (2015)
Figure 17 Asia-Pacific is Estimated to Dominate the Automotive & Seal Market in 2015
Figure 18 Asia-Pacific to Continue to be in the Growing Stage
Figure 19 Global Automotive Gasket and Seal Market Segmentation
Figure 20 The Improving Quality and Effectiveness of Gaskets and Seals is Expected to Drive the Market
Figure 21 Value Chain Analysis
Figure 22 Porter’s Five Forces Analysis
Figure 23 in Terms of Product Type, the Metallic Gasket Dominates the Global Automotive Gasket & Seal Market
Figure 24 The North American Metallic Gasket Market Set to Grow at the Highest CAGR of 7.1%
Figure 25 Asia-Pacific to Capture Half of the Non- Metallic Gasket Market in 2015
Figure 26 O-Ring Seal Market ($Million): Asia-Pacific is Estimated to Grow at a Promising Rate
Figure 27 Asia-Pacific is the Fastest-Growing Segment in the Overall Lip Seal Market
Figure 28 The North American Rotary Seal Market is Set to Grow at the Highest CAGR of 7.2%
Figure 29 Mechanical Seal Market ($Million): Asia-Pacific is Estimated to Grow at a Promising Rate
Figure 30 Heavy Commercial Vehicles: the Fastest-Growing Vehicle Segment
Figure 31 Regional Snapshot (2015) – Rapid-Growth Markets Are Emerging as New Hotspots
Figure 32 North American Market Snapshot: Demand to be Driven By the Increasing Rate of Vehicle Production
Figure 33 Automotive Gasket and Seal Market : Country-Wise & By Product Type, in North American Market (2015 vs. 2020)
Figure 34 Automotive Gasket and Seal Market Split, By Product in Major European Markets (2015 vs. 2020)
Figure 35 Asia-Pacific Automotive Gasket and Seal Market Snapshot – China to Occupy a Largest Share of the Automotive Gasket and Seal Market in 2015
Figure 36 Automotive Gasket and Seal Market : Country-Wise & By Product Type, in Major Asia-Pacific Market (2015 vs 2020)
Figure 37 Companies Adopted New Product Launch as the Key Growth Strategy During 2011-2014
Figure 38 Flowserve Corporation Registered Steady Growth Between 2009 -2013
Figure 39 Automotive Gasket and Seal Market Share, By Key Players, 2013
Figure 40 Market Evaluation Framework: Product Launches Have Fuelled Market Growth From 2011 - 2014
Figure 41 Region-Wise Revenue Mix of Top Five Market Players
Figure 42 Competitive Benchmarking of Key Market Players (2008-2013): Dana Holdings Corporation is the Champion Owing to Its Diversified Automotive Products Portfolio
Figure 43 AB SKF: Company Snapshot
Figure 44 AB SKF : SWOT
Figure 45 Dana Holding Corporation : Company Snapshot
Figure 46 Dana Holding Corporation: SWOT
Figure 47 Federal-Mogul Holdings Corporation: Company Snapshot
Figure 48 Federal-Mogul Holdings Corporation: SWOT
Figure 49 Freudenberg Sealing Technologies Gmbh & Co. Kg : Company Snapshot
Figure 50 Freudenberg Sealing Technologies Gmbh & Co. Kg : SWOT
Figure 51 Flowserve Corporation: Company Snapshot
Figure 52 Flowserve Corp: SWOT
Figure 53 Smiths Group PLC : Company Snapshot
Figure 54 Trelleborg AB: Company Snapshot
Figure 55 Elringklinger AG : Company Snapshot
Figure 56 Datwyler Holding Inc.: Company Snapshot
Figure 57 Victor Gaskets India Limited: Company Snapshot
Growth opportunities and latent adjacency in Automotive Gasket and Seal Market