Analytics as a Service Market

Report Code TC 3568
Published in May, 2024, By MarketsandMarkets™
Download PDF

Choose License Type

Buy Report Now Inquire Before Buying

Analytics as a Service Market by Software (Data Mining, Data Warehousing, Data Lake, Predictive Modelling, BI & Visualization, Advanced Analytics), Analytics Type (Marketing Analytics, Finance Analytics), Vertical and Region - Global Forecast to 2029

Overview

The Analytics as a Service Market size is expected to increase from USD 13.3 billion in 2024 to USD 39.8 billion by 2029, at a Compound Annual Growth Rate (CAGR) of 24.5% from 2024 to 2029. Due to various business drivers, the AaaS market is expected to grow significantly during the forecast period. The market is experiencing significant growth due to the proliferation of Big Data, IoT devices, and digital transformation initiatives across industries, increasing availability of data connectivity through multi-cloud and hybrid environments, and rise in demand for advanced analytic techniques due to increasing data volumes.

Attractive Opportunities in the Analytics As A Service Market

Asia Pacific

Asia Pacific is projected to have the fastest growth rate in the AI as a Service market due to rapid digital transformation, increasing government support for AI initiatives, and surging demand from sectors like e-commerce and smart cities. The region's expanding IT infrastructure and growing investment in AI technologies further drive adoption across industries.

Machine learning (ML) frameworks are expected to see healthy growth in the AI as a Service market due to increasing demand for customizable, scalable AI solutions. Businesses rely on ML frameworks for data-driven insights, automation, and improving decision-making.

Partnerships, collaborations, and product launches would offer lucrative opportunities for market players in the next five years.

The global AI as a Service market is experiencing rapid growth, driven by increasing adoption across industries like healthcare, finance, and retail. Factors such as digital transformation and cloud infrastructure expansion contributes to its widespread market expansion.

Technological advancements in the AI as a Service market include enhanced cloud-based platforms, improved machine learning algorithms, and AI-driven automation tools, enabling faster data processing, real-time analytics, and more scalable, cost-effective solutions for businesses across industries.

Global Analytics As A Service Market Dynamics

Driver: Increasing availability of data connectivity through multi-cloud and hybrid environments

The increasing availability of data connectivity through multi-cloud and hybrid environments is a significant driving factor in the adoption of Analytics as a Service (AaaS) market. As organizations continue to generate and store vast amounts of data across various cloud platforms, the need for seamless data integration and real-time analytics has become crucial. Multi-cloud and hybrid environments enable organizations to leverage the strengths of different cloud providers and infrastructure, allowing them to optimize costs, improve resilience, and meet regulatory requirements. This flexibility in data storage and processing has led to a surge in the adoption of AaaS, which provide organizations with the ability to analyze data from multiple sources in a centralized manner. AaaS platforms offer a range of analytics capabilities, including predictive modeling, machine learning, and real-time data processing, without the need for significant upfront investments in infrastructure. Moreover, the increasing adoption of Internet of Things (IoT) devices and the growing volume of data generated by these devices have further fueled the demand for AaaS offerings. IoT data, combined with other data sources such as customer interactions, sales records, and market trends, can provide valuable insights for decision-making. AaaS platforms enable organizations to process and analyze IoT data in real-time, allowing them to make informed decisions and optimize their operations.

Restraints: Discrepancy among data sources impedes the advancement of AaaS

The discrepancy among data sources significantly impedes the advancement of Analytics as a Service (AaaS) by creating inconsistencies, inaccuracies, and a lack of trust in the data. This issue arises from the use of multiple data sources with different tracking methods, naming conventions, and data definitions. For instance, a mobile marketing platform like Adjust counts an app install when a user opens an app for the first time, whereas the Apple Store counts an install when a person downloads an app. Such differences lead to discrepancies in reporting, making it challenging for organizations to extract insights, attribute revenue, identify trends, and implement personalization. The impact of data discrepancies is substantial, with 44% of CRM users estimating that poor-quality CRM data causes their company to lose over 10% of annual revenue. Moreover, 77% of data engineers, analysts, and scientists reported that their organization has data quality issues, with 91% stating that poor data quality impacts business performance. To overcome these challenges, organizations must invest in robust data integration tools and technologies that can seamlessly connect and consolidate data from multiple sources, ensuring data accuracy and enabling more comprehensive reporting. Additionally, establishing standardized data collection and reporting processes, implementing data governance frameworks, and conducting regular data validation and verification processes are crucial in minimizing data discrepancies and ensuring the reliability of data reporting.


Opportunity: Exploiting Generative AI for enhanced data democratization

Exploiting Generative AI for enhanced data democratization presents a significant opportunity in the adoption of the Analytics as a Service (AaaS) market. By leveraging Generative AI to democratize data access and insights, AaaS providers can offer innovative solutions that empower individuals across organizations to make data-driven decisions. Generative AI enables the creation of user-friendly applications that allow non-technical users to interact with data meaningfully, such as chatbots that provide clear explanations and visualizations. Moreover, Generative AI can automate processes, store insights over time, and execute actions based on user-defined parameters, streamlining data analysis and decision-making. Additionally, the ability of Generative AI to translate data into different languages and formats enhances global data sharing capabilities, while also identifying and mitigating bias in data, ensuring fair and unbiased insights. This transformative approach aligns with the growing demand for democratized access to data and insights, driving the evolution and growth of the AaaS market. According to a recent study, 70% of Chief Marketing Officers are already utilizing Generative AI, showcasing its value and rapid adoption across industries. The widespread recognition of Generative AI's impact on market research, with insight generation being a popular application, highlights its role as a powerful tool for gaining a competitive edge. Furthermore, Generative AI's efficiency in gathering diverse data, revolutionizing data management by organizing vast datasets, and uncovering hidden patterns within complex data sets underscores its potential to drive innovation and growth in the analytics landscape.

Challenge: Ensuring data quality and consistency

Ensuring data quality and consistency is a significant challenge in the adoption of Analytics as a Service (AaaS) market. Many organizations struggle with data silos, multiple data sources, and inconsistent data formats, making it difficult to obtain a unified view of their data. One major reason for the failure of AI and machine learning initiatives is inadequate data, with an IDC report estimating that nearly a third (28%) of all such projects fail. For example, a large U.S. manufacturing firm working on an analytics adoption project had 50 to 60 different source systems, each with varying data quality. Many business users are not trained in advanced statistics and math, making it difficult to establish trust in the data and results. Companies need to invest in creating a data culture where decisions are based on data and department leaders create data-based key performance indicators. Furthermore, the adoption time for advanced analytics solutions can vary depending on resources, data quality, and the nature of each business and its technology infrastructure. Aligning the business area and technology areas is crucial for developing and implementing processes and applications. To overcome these challenges, organizations need to create a solid framework for their data by establishing consistent business rules and cleaning up inconsistencies. Moving data and analytics to the cloud can help address increased complexity and costs.

Global Analytics As A Service Market Ecosystem Analysis

Analytics as a Service market Ecosystem The Analytics As A Service solution and service providers have implemented various types of organic and inorganic growth strategies, such as product upgrades, new product launches, partnerships, and agreements, business expansions, and mergers and acquisitions to strengthen their offerings in the market. Some major players in the analytics as a service market include Microsoft (US), IBM (US), Google (US), Oracle (US), SAP (Germany), AWS (US), SAS Institute (US), Teradata (US), Qlik (US), Salesforce (US), MicroStrategy (US), Cloudera (US), Altair (US), TIBCO Software (US)


By services, the business intelligence services segment registered the highest CAGR during the forecast period.

Business Intelligence (BI) services are significantly driving the growth of the AaaS market, as organizations increasingly recognize the value of transforming raw data into actionable insights. The demand for BI services within the AaaS framework is surging due to their ability to enhance decision-making, improve operational efficiency, and uncover new business opportunities. The integration of advanced BI tools with cloud-based analytics platforms allows businesses to access real-time data and perform sophisticated analyses without the need for substantial upfront investments in infrastructure. This is particularly appealing to small and medium-sized enterprises (SMEs), which seek cost-effective solutions to stay competitive. Additionally, the growing complexity of data ecosystems and the need for comprehensive data visualization and reporting tools are propelling the adoption of BI services, making them a cornerstone of the AaaS market's expansion.

By data processing, real-time analytics to register the largest market size during the forecast period.

The growth of real-time analytics within the Analytics as a Service market is accelerating, driven by the increasing need for immediate data insights to enhance decision-making processes and operational efficiency. Businesses across various sectors, such as finance, retail, and healthcare, are leveraging real-time analytics to gain instant visibility into their operations, enabling quicker responses to market changes, customer behavior, and potential issues. The rise of IoT devices and the expanding digital ecosystem have significantly boosted the demand for real-time data processing and analytics. Cloud-based AaaS solutions are particularly well-suited for real-time analytics due to their scalability, flexibility, and cost-effectiveness, allowing companies to analyze large volumes of streaming data without substantial infrastructure investments.

North America Region Holds the Largest Share of the Analytics As A Service Market

North America stands as the largest and fastest-growing region in the AaaS market, driven by a combination of technological innovation, high cloud adoption rates, and significant investments in big data and AI. The presence of leading technology companies and startups fosters a competitive environment that accelerates advancements in analytics solutions. Additionally, sectors such as finance, healthcare, and retail in North America are increasingly leveraging AaaS to gain strategic insights, enhance operational efficiencies, and improve customer experiences. The region's regulatory landscape, which supports data security and privacy, further boosts the adoption of analytics services. With a mature IT infrastructure and a strong emphasis on digital transformation, North America is at the forefront of the AaaS market's expansion, showcasing impressive growth rates and setting industry benchmarks.


Recent Developments of Analytics As A Service Market industry

  • In April 2024 Dataproc introduces the ability to deploy clusters with Compute Engine machine types. This enhancement offers greater flexibility in resource allocation, allowing users to tailor cluster configurations to their specific workload requirements more precisely.
  • In March 2024, The March 2024 update of Oracle Analytics Cloud brought forth numerous improvements spanning exploring, dashboarding, storytelling, data connectivity, modeling, preparation, augmented analytics, machine learning, performance, compliance, and administration.

Key Market Players

KEY PLAYERS IN THE Analytics As A Service Market INCLUDE

  • Microsoft (US)
  • IBM (US)
  • Google (US)
  • Oracle (US)
  • SAP (Germany)
  • AWS (US)
  • SAS Institute (US)
  • Teradata (US)
  • Qlik (US)
  • Salesforce (US)
  • MicroStrategy (US)
  • Cloudera (US)
  • Altair (US)
  • TIBCO Software (US)
  • Kellton (India)
  • Innowise (US)
  • Alteryx (US)
  • Jaspersoft (US)
  • MSys Technologies (India)
  • Synoptek (US)
  • Flatworld Solutions (India)
  • Protiviti (US)
  • Polestar Solutions (India)
  • Rapyder (India)
  • ScienceSoft (US)
  • GoodData (US)
  • Kyvos Insights (US)
  • DataToBiz (India)
  • ThoughtSpot (US)
  • Sisense (Israel)
  • eCloudChain (Germany).

Want to explore hidden markets that can drive new revenue in Analytics as a Service Market?

Scope of the Report

Report Attribute Details
Market size available for years 2019–2029
Base year considered 2023
Forecast period 2024–2029
Forecast units USD (Billion)
Segments Covered Software, services, data type, data processing, analytics type, vertical and region
Geographies covered North America, Asia Pacific, Europe, Middle East & Africa, and Latin America
List of Companies in Analytics As A Service Microsoft (US), IBM (US), Google (US), Oracle (US), SAP (Germany), AWS (US), SAS Institute (US), Teradata (US), Qlik (US), Salesforce (US), MicroStrategy (US), Cloudera (US), Altair (US), TIBCO Software (US), Kellton (India), Innowise (US), Alteryx (US), Jaspersoft (US), MSys Technologies (India), Synoptek (US), Flatworld Solutions (India), Protiviti (US), Polestar Solutions (India), Rapyder (India), ScienceSoft (US), GoodData (US), Kyvos Insights (US), DataToBiz (India), ThoughtSpot (US), Sisense (Israel), and eCloudChain (Germany).


Key Questions Addressed by the Report

What is the total CAGR expected to be recorded for the AaaS market during the forecast period?
The market is expected to record a CAGR of 24.5% during the forecast period.
Which are the key drivers supporting the growth of the AaaS market?
Some factors driving the growth of the AaaS market are increasing availability of data connectivity through multi-cloud and hybrid environments, rise in demand for advanced analytic techniques due to increasing data volumes, and proliferation of Big Data, IoT devices, and digital transformation initiatives across industries.
Which are the key verticals prevailing in the AaaS market?
The key verticals gaining a foothold in the AaaS market are BFSI, retail & consumer goods, telecommunications, healthcare & life sciences, manufacturing, automotive, transportation & logistics, government & defense, education, and others.
Who are the key vendors in the AaaS market?
Some major players in the AaaS market include Microsoft (US), IBM (US), Google (US), Oracle (US), SAP (Germany), AWS (US), SAS Institute (US), Teradata (US), Qlik (US), Salesforce (US), MicroStrategy (US), Cloudera (US), Altair (US), TIBCO Software (US), Kellton (India), Innowise (US), Alteryx (US), Jaspersoft (US), MSys Technologies (India), Synoptek (US), Flatworld Solutions (India), Protiviti (US), Unisys (US), Polestar Solutions (India), Rapyder (India), ScienceSoft (US), GoodData (US), Kyvos Insights (US), DataToBiz (India), ThoughtSpot (US), Sisense (Israel), and eCloudChain (Germany).


Personalize This Research

  • Triangulate with your Own Data
  • Get Data as per your Format and Definition
  • Gain a Deeper Dive on a Specific Application, Geography, Customer or Competitor
  • Any level of Personalization
Request A Free Customisation

Let Us Help You

  • What are the Known and Unknown Adjacencies Impacting the Analytics as a Service Market
  • What will your New Revenue Sources be?
  • Who will be your Top Customer; what will make them switch?
  • Defend your Market Share or Win Competitors
  • Get a Scorecard for Target Partners
Customized Workshop Request

Table of Contents

Exclusive indicates content/data unique to MarketsandMarkets and not available with any competitors.

TITLE
PAGE NO
INTRODUCTION
32
RESEARCH METHODOLOGY
40
EXECUTIVE SUMMARY
52
PREMIUM INSIGHTS
58
MARKET OVERVIEW AND INDUSTRY TRENDS
60
  • 5.1 INTRODUCTION
  • 5.2 MARKET DYNAMICS
    DRIVERS
    - Enhanced data connectivity through multi-cloud and hybrid environments
    - Rise in demand for advanced analytical techniques due to increasing data volumes
    - Proliferation of big data, IoT devices, and digital transformation initiatives across industries
    RESTRAINTS
    - Discrepancy among data sources
    - Data security and privacy concerns
    OPPORTUNITIES
    - Exploiting generative AI for enhanced data democratization
    - Emergence of data fabric and edge computing
    CHALLENGES
    - Ensuring data quality and consistency
    - Complexities of technical systems and architecture
  • 5.3 EVOLUTION OF ANALYTICS AS A SERVICE MARKET
  • 5.4 SUPPLY CHAIN ANALYSIS
  • 5.5 ECOSYSTEM ANALYSIS
    SOFTWARE PROVIDERS
    MANAGED SERVICE PROVIDERS
    CLOUD SERVICE PROVIDERS
    END USERS
    REGULATORY BODIES
  • 5.6 INVESTMENT LANDSCAPE AND FUNDING SCENARIO
  • 5.7 CASE STUDY ANALYSIS
    CASE STUDY 1: OCBC BANK IMPLEMENTED INNOVATIVE BANKING SOLUTION USING CLOUDERA DATA PLATFORM
    CASE STUDY 2: USE OF INNOWISE CRM SOFTWARE LED TO REDUCTION IN ADMINISTRATIVE COSTS FOR HEALTHCARE COMPANY
    CASE STUDY 3: JASPERSOFT REVOLUTIONIZED TIME AND EXPENSE MANAGEMENT FOR DATABASICS
    CASE STUDY 4: REPSLY ENHANCED RETAIL EXECUTION PLATFORM BY INTEGRATING ROBUST ANALYTICS THROUGH GOODDATA
    CASE STUDY 5: GLOBE LIFE INSURANCE DEPLOYED UNISYS PREDICTIVE DATA ANALYTICS PLATFORM TO FUEL BUSINESS EXPANSION
  • 5.8 TECHNOLOGY ANALYSIS
    KEY TECHNOLOGIES
    - Artificial intelligence
    - Cloud computing
    - Big data analytics
    COMPLEMENTARY TECHNOLOGIES
    - AR & VR
    - 5G
    - Blockchain
    ADJACENT TECHNOLOGIES
    - Edge computing
    - Cybersecurity
    - Internet of Things
  • 5.9 REGULATORY LANDSCAPE
    REGULATORY BODIES, GOVERNMENT AGENCIES, AND OTHER ORGANIZATIONS
    REGULATIONS: ANALYTICS AS A SERVICE
    - North America
    - Europe
    - Asia Pacific
    - Middle East & Africa
    - Latin America
  • 5.10 PATENT ANALYSIS
    METHODOLOGY
    PATENTS FILED, BY DOCUMENT TYPE
    INNOVATIONS AND PATENT APPLICATIONS
    - Top 10 patent applicants
  • 5.11 PRICING ANALYSIS
    AVERAGE SELLING PRICE TREND OF KEY PLAYERS, BY SOFTWARE TYPE
    INDICATIVE PRICING ANALYSIS, BY OFFERING
  • 5.12 KEY CONFERENCES AND EVENTS
  • 5.13 PORTER’S FIVE FORCES ANALYSIS
    THREAT OF NEW ENTRANTS
    THREAT OF SUBSTITUTES
    BARGAINING POWER OF SUPPLIERS
    BARGAINING POWER OF BUYERS
    INTENSITY OF COMPETITIVE RIVALRY
  • 5.14 TRENDS/DISRUPTIONS IMPACTING CUSTOMERS’ BUSINESSES
  • 5.15 KEY STAKEHOLDERS & BUYING CRITERIA
    KEY STAKEHOLDERS IN BUYING PROCESS
    BUYING CRITERIA
ANALYTICS AS A SERVICE MARKET, BY OFFERING
96
  • 6.1 INTRODUCTION
    OFFERING: ANALYTICS AS A SERVICE MARKET DRIVERS
  • 6.2 SOFTWARE, BY TYPE
    DATA MINING
    - Growing need to extract valuable insights from large datasets to boost segment growth
    DATA WAREHOUSING & DATA LAKES
    - Extensive use in handling structured as well as unstructured data to drive adoption
    DATA INTEGRATION
    - Requirement of effective data centralization tools to drive demand
    PREDICTIVE MODELLING
    - Extensive use in financial services sector to propel segment growth
    BI & VISUALIZATION
    - Increasing need to make critical business decisions in limited time to boost segment growth
    ADVANCED ANALYTICS
    - Need to uncover hidden patterns and correlations for strategic decision-making to fuel segment growth
  • 6.3 SOFTWARE, BY INTEGRATION
    STANDALONE
    - Increasing adoption of advanced solutions for streamlined data workflows to propel segment growth
    EMBEDDED
    - Self-service analytics that empower users to boost segment growth
  • 6.4 SOFTWARE, BY CLOUD TYPE
    PUBLIC
    - Reduced upfront costs and enhanced resource allocation to drive segment
    PRIVATE
    - Increasing demand for customized solutions tailored to specific business needs to drive segment
    HYBRID
    - Combined benefits of public and private clouds to fuel segment growth
  • 6.5 SERVICES
    CONSULTING & ENGINEERING SERVICES
    - Rising need to efficiently harness power of data to fuel segment growth
    DATA GOVERNANCE SERVICES
    - Focus on ensuring data quality, security, and compliance to propel segment
    DATA STORAGE SERVICES
    - Emergence of edge computing to support segment growth
    BUSINESS INTELLIGENCE SERVICES
    - Integration of advanced technologies into analytics to drive segment
    DATA WAREHOUSING SERVICES
    - Shift toward cloud deployment to fuel segment growth
ANALYTICS AS A SERVICE MARKET, BY DATA TYPE
122
  • 7.1 INTRODUCTION
    DATA TYPE: ANALYTICS AS A SERVICE MARKET DRIVERS
  • 7.2 STRUCTURED
    INCREASING DEMAND TO DERIVE VALUE FROM DATA TO MAINTAIN COMPLEX INFRASTRUCTURE TO DRIVE SEGMENT
  • 7.3 UNSTRUCTURED
    RISE IN DEMAND FOR ENHANCED CUSTOMER EXPERIENCE TO PROPEL SEGMENT
ANALYTICS AS A SERVICE MARKET, BY DATA PROCESSING
127
  • 8.1 INTRODUCTION
    DATA PROCESSING: ANALYTICS AS A SERVICE MARKET DRIVERS
  • 8.2 REAL-TIME ANALYTICS
    DEMAND FOR SOLUTIONS THAT INSTANTANEOUSLY DETECT ANOMALIES TO BOOST SEGMENT
  • 8.3 BATCH PROCESSING
    EXTENSIVE ADOPTION IN CONSOLIDATING AND ANALYZING DATA FROM MULTIPLE SOURCES TO DRIVE SEGMENT
ANALYTICS AS A SERVICE MARKET, BY ANALYTICS TYPE
132
  • 9.1 INTRODUCTION
    ANALYTICS TYPE: ANALYTICS AS A SERVICE MARKET DRIVERS
  • 9.2 HR ANALYTICS
    FOCUS ON OPTIMIZING ASPECTS OF HUMAN RESOURCES MANAGEMENT FOR ENHANCED ORGANIZATIONAL PERFORMANCE TO DRIVE SEGMENT
    - Workforce planning & optimization
    - Talent acquisition & recruitment
    - Employee engagement & retention
    - Training & development
    - Performance management
    - Others
  • 9.3 MARKETING ANALYTICS
    EXTENSIVE USE IN IDENTIFYING EMERGING TRENDS TO FUEL SEGMENT GROWTH
    - Customer segmentation & targeting
    - Campaign performance analysis
    - Social media analytics
    - Customer lifetime value prediction
    - Market basket analysis
    - Others
  • 9.4 SALES ANALYTICS
    RISING NEED FOR INCREASED SALES EFFICIENCY FOR LONG-TERM BUSINESS GROWTH TO PROPEL SEGMENT
    - Sales forecasting
    - Pipeline management
    - Customer churn prediction
    - Sales performance optimization
    - Territory & quota planning
    - Others
  • 9.5 FINANCE ANALYTICS
    INCREASING VOLUME AND COMPLEXITY OF FINANCIAL DATA TO SUPPORT SEGMENT GROWTH
    - Financial planning & budgeting
    - Risk management
    - Fraud detection
    - Financial performance analysis
    - Cash flow analysis
    - Others
  • 9.6 OPERATIONS ANALYTICS
    FOCUS ON IMPROVING KEY OPERATIONAL METRICS TO FUEL SEGMENT GROWTH
    - Supply chain optimization
    - Inventory management
    - Production planning & scheduling
    - Quality control & defect analysis
    - Maintenance & asset management
    - Others
ANALYTICS AS A SERVICE MARKET, BY VERTICAL
149
  • 10.1 INTRODUCTION
    VERTICAL: ANALYTICS AS A SERVICE MARKET DRIVERS
  • 10.2 BFSI
    RISE IN USE OF ANALYTICAL ALGORITHMS TO MAKE INFORMED INVESTMENT DECISIONS TO DRIVE SEGMENT
    - Algorithmic trading & investment analysis
    - Loan portfolio management
    - Credit scoring & risk assessment
    - Financial fraud detection & prevention
    - Personalized financial planning
    - Others
  • 10.3 TELECOMMUNICATIONS
    FOCUS ON DELIVERING DEPENDABLE AND CUSTOMER-CENTRIC SERVICES TO DRIVE SEGMENT
    - Network performance monitoring
    - Subscriber management
    - Network infrastructure predictive maintenance
    - Telecom revenue assurance
    - Network capacity planning
    - Others
  • 10.4 RETAIL & CONSUMER GOODS
    INCREASING NEED FOR OPERATIONAL EFFICIENCY AND ENHANCED CUSTOMER EXPERIENCE TO PROPEL SEGMENT
    - Customer segmentation & personalization
    - Retail inventory management
    - E-commerce management
    - Price optimization
    - Point-of-sale management
    - Others
  • 10.5 HEALTHCARE & LIFE SCIENCES
    IMPROVED HEALTHCARE OUTCOMES TO DRIVE DEMAND
    - Clinical data management
    - Personalized treatment
    - Population health management
    - Drug discovery & development
    - Patient outcome prediction
    - Others
  • 10.6 GOVERNMENT & DEFENSE
    FOCUS ON ENHANCING VARIOUS ASPECTS OF GOVERNANCE AND SECURITY TO BOOST SEGMENT GROWTH
    - Predictive policing & crime pattern analysis
    - Cybersecurity & threat intelligence
    - Tax & welfare management
    - Emergency response optimization
    - Resource allocation & planning
    - Others
  • 10.7 AUTOMOTIVE
    INTEGRATION OF CONNECTED VEHICLES AND TELEMATICS SYSTEMS TO FUEL SEGMENT GROWTH
    - Autonomous vehicle development
    - Connected car services
    - Vehicle predictive maintenance
    - Telematics & usage-based insurance
    - Vehicle production optimization
    - Others
  • 10.8 EDUCATION
    IMPROVED STUDENT ENGAGEMENT AND ACADEMIC OUTCOMES TO PROPEL SEGMENT
    - Student performance management
    - Customized courses & personalized learning
    - Conflict anticipation & behavior detection
    - Adaptive testing & grading
    - Academic research
    - Others
  • 10.9 MANUFACTURING
    GROWING NEED TO FORECAST EQUIPMENT FAILURES AND OPTIMIZE MAINTENANCE SCHEDULES TO BOOST SEGMENT
    - Equipment & machinery predictive maintenance
    - Quality control & defect analysis
    - Smart manufacturing
    - Energy management & efficiency
    - Production process optimization
    - Others
  • 10.10 TRANSPORTATION & LOGISTICS
    REAL-TIME ROUTE OPTIMIZATION AND REDUCED FUEL CONSUMPTION TO DRIVE MARKET
    - Route optimization & traffic management
    - Fleet management
    - Vehicles & equipment maintenance
    - Supply chain visibility
    - Logistics & inventory management
    - Others
  • 10.11 OTHER VERTICALS
ANALYTICS AS A SERVICE MARKET, BY REGION
183
  • 11.1 INTRODUCTION
  • 11.2 NORTH AMERICA
    NORTH AMERICA: ANALYTICS AS A SERVICE MARKET DRIVERS
    NORTH AMERICA: RECESSION IMPACT
    US
    - Increasing demand for solutions that enable data-driven decision-making to drive market
    CANADA
    - Demand for cloud-based solutions to boost market growth
  • 11.3 EUROPE
    EUROPE: ANALYTICS AS A SERVICE MARKET DRIVERS
    EUROPE: RECESSION IMPACT
    UK
    - Need to achieve operational efficiency to boost market growth
    GERMANY
    - Enhancing operational performance through adoption of advanced analytics solutions to propel market
    FRANCE
    - Need for scalable and cost-effective platforms to drive market
    ITALY
    - Efforts to digitize operations and enhance strategic decision-making to drive market growth
    SPAIN
    - Growing use of analytics to enhance customer experiences and drive sales to boost market growth
    REST OF EUROPE
  • 11.4 ASIA PACIFIC
    ASIA PACIFIC: ANALYTICS AS A SERVICE MARKET DRIVERS
    ASIA PACIFIC: RECESSION IMPACT
    CHINA
    - Rapid digitalization and proliferation of big data to boost market growth
    JAPAN
    - Digital transformation initiatives by government to fuel market growth
    INDIA
    - Rising demand for sophisticated analytics solutions to boost market growth
    SOUTH KOREA
    - Government initiatives to support development of AI and analytics to drive market
    AUSTRALIA & NEW ZEALAND
    - Increasing adoption across sectors to drive demand
    ASEAN
    - Increasing penetration of smartphones to propel market
    REST OF ASIA PACIFIC
  • 11.5 MIDDLE EAST & AFRICA
    MIDDLE EAST & AFRICA: ANALYTICS AS A SERVICE MARKET DRIVERS
    MIDDLE EAST & AFRICA: RECESSION IMPACT
    UAE
    - Rising smart city initiatives to drive market
    KSA
    - Favorable government policies and investments in digital infrastructure to support market growth
    QATAR
    - Efforts by government for sustainable development and economic diversification to propel market
    TURKEY
    - Increasing presence of multinational companies to support market growth
    SOUTH AFRICA
    - Increasing adoption of advanced analytics to drive strategic decision-making to drive market
    REST OF MIDDLE EAST & AFRICA
  • 11.6 LATIN AMERICA
    LATIN AMERICA: ANALYTICS AS A SERVICE MARKET DRIVERS
    LATIN AMERICA: RECESSION IMPACT
    BRAZIL
    - Increasing efforts by vendors to develop sophisticated analytics solutions to propel market
    MEXICO
    - Need for advanced analytics tools without heavy investment in infrastructure or expertise to boost market growth
    ARGENTINA
    - Increasing demand for data-driven analytics solutions across industries to drive market
    REST OF LATIN AMERICA
COMPETITIVE LANDSCAPE
232
  • 12.1 OVERVIEW
  • 12.2 KEY PLAYER STRATEGIES/RIGHT TO WIN
  • 12.3 REVENUE ANALYSIS
  • 12.4 MARKET SHARE ANALYSIS
    MARKET RANKING ANALYSIS
  • 12.5 BRAND COMPARATIVE ANALYSIS
  • 12.6 COMPANY VALUATION AND FINANCIAL METRICS OF KEY VENDORS
  • 12.7 COMPANY EVALUATION MATRIX: KEY PLAYERS, 2023
    STARS
    EMERGING LEADERS
    PERVASIVE PLAYERS
    PARTICIPANTS
    COMPANY FOOTPRINT: KEY PLAYERS, 2023
    - Company footprint
    - Region footprint
    - Data processing footprint
    - Vertical footprint
    - Offering footprint
  • 12.8 COMPANY EVALUATION MATRIX: STARTUPS/SMES, 2023
    PROGRESSIVE COMPANIES
    RESPONSIVE COMPANIES
    DYNAMIC COMPANIES
    STARTING BLOCKS
    COMPETITIVE BENCHMARKING: STARTUPS/SMES, 2023
    - Detailed list of key startups/SMEs
    - Competitive benchmarking of key startups/SMEs
  • 12.9 COMPETITIVE SCENARIO AND TRENDS
    PRODUCT LAUNCHES & ENHANCEMENTS
    DEALS
COMPANY PROFILES
251
  • 13.1 INTRODUCTION
  • 13.2 KEY PLAYERS
    MICROSOFT
    - Business overview
    - Products/Solutions/Services offered
    - Recent developments
    - MnM view
    IBM
    - Business overview
    - Products/Solutions/Services offered
    - Recent developments
    - MnM view
    GOOGLE
    - Business overview
    - Products/Solutions/Services offered
    - Recent developments
    - MnM view
    ORACLE
    - Business overview
    - Products/Solutions/Services offered
    - Recent developments
    - MnM view
    SAP
    - Business overview
    - Products/Solutions/Services offered
    - Recent developments
    - MnM view
    AWS
    - Business overview
    - Products/Solutions/Services offered
    - Recent developments
    SAS INSTITUTE
    - Business overview
    - Products/Solutions/Services offered
    - Recent developments
    TERADATA
    - Business overview
    - Products/Solutions/Services offered
    - Recent developments
    QLIK
    - Business overview
    - Products/Solutions/Services offered
    - Recent developments
    SALESFORCE
    - Business overview
    - Products/Solutions/Services offered
    - Recent developments
  • 13.3 OTHER PLAYERS
    MICROSTRATEGY
    CLOUDERA
    ALTAIR
    TIBCO SOFTWARE
    KELLTON
    INNOWISE
    ALTERYX
    JASPERSOFT
    MSYS TECHNOLOGIES
    SYNOPTEK
    FLATWORLD SOLUTIONS
    PROTIVITI
    UNISYS
  • 13.4 STARTUPS/SMES
    POLESTAR SOLUTIONS
    RAPYDER
    SCIENCESOFT
    GOODDATA
    KYVOS INSIGHTS
    DATATOBIZ
    THOUGHTSPOT
    SISENSE
    ECLOUDCHAIN
ADJACENT AND RELATED MARKETS
296
  • 14.1 INTRODUCTION
  • 14.2 RISK ANALYTICS MARKET – GLOBAL FORECAST TO 2029
    MARKET DEFINITION
    MARKET OVERVIEW
    - Risk analytics market, by offering
    - Risk analytics market, by risk type
    - Risk analytics market, by risk stage
    - Risk analytics market, by vertical
    - Risk analytics market, by region
  • 14.3 ADVANCED ANALYTICS MARKET – GLOBAL FORECAST TO 2028
    MARKET DEFINITION
    MARKET OVERVIEW
    - Advanced analytics market, by offering
    - Advanced analytics market, by type
    - Advanced analytics market, by business function
    - Advanced analytics market, by vertical
    - Advanced analytics market, by region
APPENDIX
306
  • 15.1 DISCUSSION GUIDE
  • 15.2 KNOWLEDGESTORE: MARKETSANDMARKETS’ SUBSCRIPTION PORTAL
  • 15.3 CUSTOMIZATION OPTIONS
  • 15.4 RELATED REPORTS
  • 15.5 AUTHOR DETAILS
LIST OF TABLES
 
  • TABLE 1 ANALYTICS AS A SERVICE MARKET: DETAILED SEGMENTATION
  • TABLE 2 USD EXCHANGE RATES, 2019–2023
  • TABLE 3 PRIMARY INTERVIEWS
  • TABLE 4 FACTOR ANALYSIS
  • TABLE 5 IMPACT OF RECESSION ON GLOBAL MARKET
  • TABLE 6 GLOBAL MARKET SIZE AND GROWTH RATE, 2019–2023 (USD MILLION, Y-O-Y %)
  • TABLE 7 GLOBAL MARKET SIZE AND GROWTH RATE, 2024–2029 (USD MILLION, Y-O-Y %)
  • TABLE 8 MARKET: ECOSYSTEM
  • TABLE 9 NORTH AMERICA: LIST OF REGULATORY BODIES, GOVERNMENT AGENCIES, AND OTHER ORGANIZATIONS
  • TABLE 10 EUROPE: LIST OF REGULATORY BODIES, GOVERNMENT AGENCIES, AND OTHER ORGANIZATIONS
  • TABLE 11 ASIA PACIFIC: LIST OF REGULATORY BODIES, GOVERNMENT AGENCIES, AND OTHER ORGANIZATIONS
  • TABLE 12 MIDDLE EAST & AFRICA: LIST OF REGULATORY BODIES, GOVERNMENT AGENCIES, AND OTHER ORGANIZATIONS
  • TABLE 13 LATIN AMERICA: LIST OF REGULATORY BODIES, GOVERNMENT AGENCIES, AND OTHER ORGANIZATIONS
  • TABLE 14 PATENTS FILED, 2013–2023
  • TABLE 15 TOP 20 PATENT OWNERS IN MARKET, 2013–2023
  • TABLE 16 MARKET: LIST OF PATENTS GRANTED, 2022–2023
  • TABLE 17 AVERAGE SELLING PRICES OF KEY PLAYERS FOR TOP 3 SOFTWARE TYPE
  • TABLE 18 INDICATIVE PRICING OF ANALYTICS AS A SERVICE OFFERINGS
  • TABLE 19 MARKET: DETAILED LIST OF CONFERENCES AND EVENTS, 2024–2025
  • TABLE 20 MARKET: IMPACT OF PORTER’S FIVE FORCES
  • TABLE 21 INFLUENCE OF STAKEHOLDERS ON BUYING PROCESS FOR TOP THREE VERTICALS
  • TABLE 22 KEY BUYING CRITERIA FOR TOP THREE VERTICALS
  • TABLE 23 MARKET, BY OFFERING, 2019–2023 (USD MILLION)
  • TABLE 24 MARKET, BY OFFERING, 2024–2029 (USD MILLION)
  • TABLE 25 MARKET, BY SOFTWARE TYPE, 2019–2023 (USD MILLION)
  • TABLE 26 MARKET, BY SOFTWARE TYPE, 2024–2029 (USD MILLION)
  • TABLE 27 SOFTWARE: MARKET, BY REGION, 2019–2023 (USD MILLION)
  • TABLE 28 SOFTWARE: MARKET, BY REGION, 2024–2029 (USD MILLION)
  • TABLE 29 DATA MINING: MARKET, BY REGION, 2019–2023 (USD MILLION)
  • TABLE 30 DATA MINING: MARKET, BY REGION, 2024–2029 (USD MILLION)
  • TABLE 31 DATA WAREHOUSING & DATA LAKES: MARKET, BY REGION, 2019–2023 (USD MILLION)
  • TABLE 32 DATA WAREHOUSING & DATA LAKES: MARKET, BY REGION, 2024–2029 (USD MILLION)
  • TABLE 33 DATA INTEGRATION: MARKET, BY REGION, 2019–2023 (USD MILLION)
  • TABLE 34 DATA INTEGRATION: MARKET, BY REGION, 2024–2029 (USD MILLION)
  • TABLE 35 PREDICTIVE MODELLING: MARKET, BY REGION, 2019–2023 (USD MILLION)
  • TABLE 36 PREDICTIVE MODELLING: MARKET, BY REGION, 2024–2029 (USD MILLION)
  • TABLE 37 BI & VISUALIZATION: MARKET, BY REGION, 2019–2023 (USD MILLION)
  • TABLE 38 BI & VISUALIZATION: MARKET, BY REGION, 2024–2029 (USD MILLION)
  • TABLE 39 ADVANCED ANALYTICS: ANALYTICS AS A SERVICE MARKET, BY REGION, 2019–2023 (USD MILLION)
  • TABLE 40 ADVANCED ANALYTICS: MARKET, BY REGION, 2024–2029 (USD MILLION)
  • TABLE 41 MARKET, BY SOFTWARE INTEGRATION, 2019–2023 (USD MILLION)
  • TABLE 42 MARKET, BY SOFTWARE INTEGRATION, 2024–2029 (USD MILLION)
  • TABLE 43 STANDALONE: MARKET, BY REGION, 2019–2023 (USD MILLION)
  • TABLE 44 STANDALONE: MARKET, BY REGION, 2024–2029 (USD MILLION)
  • TABLE 45 EMBEDDED: MARKET, BY REGION, 2019–2023 (USD MILLION)
  • TABLE 46 EMBEDDED: MARKET, BY REGION, 2024–2029 (USD MILLION)
  • TABLE 47 MARKET, BY CLOUD TYPE, 2019–2023 (USD MILLION)
  • TABLE 48 MARKET, BY CLOUD TYPE, 2024–2029 (USD MILLION)
  • TABLE 49 PUBLIC: MARKET, BY REGION, 2019–2023 (USD MILLION)
  • TABLE 50 PUBLIC: MARKET, BY REGION, 2024–2029 (USD MILLION)
  • TABLE 51 PRIVATE: MARKET, BY REGION, 2019–2023 (USD MILLION)
  • TABLE 52 PRIVATE: MARKET, BY REGION, 2024–2029 (USD MILLION)
  • TABLE 53 HYBRID: MARKET, BY REGION, 2019–2023 (USD MILLION)
  • TABLE 54 HYBRID: MARKET, BY REGION, 2024–2029 (USD MILLION)
  • TABLE 55 MARKET, BY SERVICE, 2019–2023 (USD MILLION)
  • TABLE 56 MARKET, BY SERVICE, 2024–2029 (USD MILLION)
  • TABLE 57 SERVICES: MARKET, BY REGION, 2019–2023 (USD MILLION)
  • TABLE 58 SERVICES: MARKET, BY REGION, 2024–2029 (USD MILLION)
  • TABLE 59 CONSULTING & ENGINEERING SERVICES: MARKET, BY REGION, 2019–2023 (USD MILLION)
  • TABLE 60 CONSULTING & ENGINEERING SERVICES: MARKET, BY REGION, 2024–2029 (USD MILLION)
  • TABLE 61 DATA GOVERNANCE SERVICES: MARKET, BY REGION, 2019–2023 (USD MILLION)
  • TABLE 62 DATA GOVERNANCE SERVICES: MARKET, BY REGION, 2024–2029 (USD MILLION)
  • TABLE 63 DATA STORAGE SERVICES: MARKET, BY REGION, 2019–2023 (USD MILLION)
  • TABLE 64 DATA STORAGE SERVICES: MARKET, BY REGION, 2024–2029 (USD MILLION)
  • TABLE 65 BUSINESS INTELLIGENCE SERVICES: MARKET, BY REGION, 2019–2023 (USD MILLION)
  • TABLE 66 BUSINESS INTELLIGENCE SERVICES: MARKET, BY REGION, 2024–2029 (USD MILLION)
  • TABLE 67 DATA WAREHOUSING SERVICES: MARKET, BY REGION, 2019–2023 (USD MILLION)
  • TABLE 68 DATA WAREHOUSING SERVICES: MARKET, BY REGION, 2024–2029 (USD MILLION)
  • TABLE 69 MARKET, BY DATA TYPE, 2019–2023 (USD MILLION)
  • TABLE 70 MARKET, BY DATA TYPE, 2024–2029 (USD MILLION)
  • TABLE 71 STRUCTURED: MARKET, BY REGION, 2019–2023 (USD MILLION)
  • TABLE 72 STRUCTURED: MARKET, BY REGION, 2024–2029 (USD MILLION)
  • TABLE 73 UNSTRUCTURED: ANALYTICS AS A SERVICE MARKET, BY REGION, 2019–2023 (USD MILLION)
  • TABLE 74 UNSTRUCTURED: MARKET, BY REGION, 2024–2029 (USD MILLION)
  • TABLE 75 MARKET, BY DATA PROCESSING, 2019–2023 (USD MILLION)
  • TABLE 76 MARKET, BY DATA PROCESSING, 2024–2029 (USD MILLION)
  • TABLE 77 REAL-TIME ANALYTICS: MARKET, BY REGION, 2019–2023 (USD MILLION)
  • TABLE 78 REAL-TIME ANALYTICS: MARKET, BY REGION, 2024–2029 (USD MILLION)
  • TABLE 79 BATCH PROCESSING: MARKET, BY REGION, 2019–2023 (USD MILLION)
  • TABLE 80 BATCH PROCESSING: MARKET, BY REGION, 2024–2029 (USD MILLION)
  • TABLE 81 MARKET, BY ANALYTICS TYPE, 2019–2023 (USD MILLION)
  • TABLE 82 MARKET, BY ANALYTICS TYPE, 2024–2029 (USD MILLION)
  • TABLE 83 HR ANALYTICS: MARKET, BY REGION, 2019–2023 (USD MILLION)
  • TABLE 84 HR ANALYTICS: MARKET BY REGION, 2024–2029 (USD MILLION)
  • TABLE 85 MARKETING ANALYTICS: MARKET, BY REGION, 2019–2023 (USD MILLION)
  • TABLE 86 MARKETING ANALYTICS: MARKET, BY REGION, 2024–2029 (USD MILLION)
  • TABLE 87 SALES ANALYTICS: MARKET, BY REGION, 2019–2023 (USD MILLION)
  • TABLE 88 SALES ANALYTICS: MARKET, BY REGION, 2024–2029 (USD MILLION)
  • TABLE 89 FINANCE ANALYTICS: MARKET, BY REGION, 2019–2023 (USD MILLION)
  • TABLE 90 FINANCE ANALYTICS: MARKET, BY REGION, 2024–2029 (USD MILLION)
  • TABLE 91 OPERATIONS ANALYTICS: MARKET, BY REGION, 2019–2023 (USD MILLION)
  • TABLE 92 OPERATIONS ANALYTICS: MARKET, BY REGION, 2024–2029 (USD MILLION)
  • TABLE 93 MARKET, BY VERTICAL, 2019–2023 (USD MILLION)
  • TABLE 94 MARKET, BY VERTICAL, 2024–2029 (USD MILLION)
  • TABLE 95 BFSI: MARKET, BY REGION, 2019–2023 (USD MILLION)
  • TABLE 96 BFSI: MARKET, BY REGION, 2024–2029 (USD MILLION)
  • TABLE 97 TELECOMMUNICATIONS: MARKET, BY REGION, 2019–2023 (USD MILLION)
  • TABLE 98 TELECOMMUNICATIONS: MARKET, BY REGION, 2024–2029 (USD MILLION)
  • TABLE 99 RETAIL & CONSUMER GOODS: MARKET, BY REGION, 2019–2023 (USD MILLION)
  • TABLE 100 RETAIL & CONSUMER GOODS: MARKET, BY REGION, 2024–2029 (USD MILLION)
  • TABLE 101 HEALTHCARE & LIFE SCIENCES: MARKET, BY REGION, 2019–2023 (USD MILLION)
  • TABLE 102 HEALTHCARE & LIFE SCIENCES: MARKET, BY REGION, 2024–2029 (USD MILLION)
  • TABLE 103 GOVERNMENT & DEFENSE: MARKET, BY REGION, 2019–2023 (USD MILLION)
  • TABLE 104 GOVERNMENT & DEFENSE: MARKET, BY REGION, 2024–2029 (USD MILLION)
  • TABLE 105 AUTOMOTIVE: MARKET, BY REGION, 2019–2023 (USD MILLION)
  • TABLE 106 AUTOMOTIVE: MARKET, BY REGION, 2024–2029 (USD MILLION)
  • TABLE 107 EDUCATION: MARKET, BY REGION, 2019–2023 (USD MILLION)
  • TABLE 108 EDUCATION: MARKET, BY REGION, 2024–2029 (USD MILLION)
  • TABLE 109 MANUFACTURING: MARKET, BY REGION, 2019–2023 (USD MILLION)
  • TABLE 110 MANUFACTURING: MARKET, BY REGION, 2024–2029 (USD MILLION)
  • TABLE 111 TRANSPORTATION & LOGISTICS: ANALYTICS AS A SERVICE MARKET, BY REGION, 2019–2023 (USD MILLION)
  • TABLE 112 TRANSPORTATION & LOGISTICS: ANALYTICS AS A SERVICE MARKET, BY REGION, 2024–2029 (USD MILLION)
  • TABLE 113 OTHER VERTICALS: MARKET, BY REGION, 2019–2023 (USD MILLION)
  • TABLE 114 OTHER VERTICALS: MARKET, BY REGION, 2024–2029 (USD MILLION)
  • TABLE 115 MARKET, BY REGION, 2019–2023 (USD MILLION)
  • TABLE 116 MARKET, BY REGION, 2024–2029 (USD MILLION)
  • TABLE 117 NORTH AMERICA: MARKET, BY OFFERING, 2019–2023 (USD MILLION)
  • TABLE 118 NORTH AMERICA: MARKET, BY OFFERING, 2024–2029 (USD MILLION)
  • TABLE 119 NORTH AMERICA: MARKET, BY SOFTWARE TYPE, 2019–2023 (USD MILLION)
  • TABLE 120 NORTH AMERICA: MARKET, BY SOFTWARE TYPE, 2024–2029 (USD MILLION)
  • TABLE 121 NORTH AMERICA: MARKET, BY SOFTWARE INTEGRATION, 2019–2023 (USD MILLION)
  • TABLE 122 NORTH AMERICA: MARKET, BY SOFTWARE INTEGRATION, 2024–2029 (USD MILLION)
  • TABLE 123 NORTH AMERICA: MARKET, BY CLOUD TYPE, 2019–2023 (USD MILLION)
  • TABLE 124 NORTH AMERICA: MARKET, BY CLOUD TYPE, 2024–2029 (USD MILLION)
  • TABLE 125 NORTH AMERICA: MARKET, BY SERVICE, 2019–2023 (USD MILLION)
  • TABLE 126 NORTH AMERICA: MARKET, BY SERVICE, 2024–2029 (USD MILLION)
  • TABLE 127 NORTH AMERICA: MARKET, BY DATA TYPE, 2019–2023 (USD MILLION)
  • TABLE 128 NORTH AMERICA: MARKET, BY DATA TYPE, 2024–2029 (USD MILLION)
  • TABLE 129 NORTH AMERICA: MARKET, BY DATA PROCESSING, 2019–2023 (USD MILLION)
  • TABLE 130 NORTH AMERICA: MARKET, BY DATA PROCESSING, 2024–2029 (USD MILLION)
  • TABLE 131 NORTH AMERICA: MARKET, BY ANALYTICS TYPE, 2019–2023 (USD MILLION)
  • TABLE 132 NORTH AMERICA: MARKET, BY ANALYTICS TYPE, 2024–2029 (USD MILLION)
  • TABLE 133 NORTH AMERICA: MARKET, BY VERTICAL, 2019–2023 (USD MILLION)
  • TABLE 134 NORTH AMERICA: MARKET, BY VERTICAL, 2024–2029 (USD MILLION)
  • TABLE 135 NORTH AMERICA: MARKET, BY COUNTRY, 2019–2023 (USD MILLION)
  • TABLE 136 NORTH AMERICA: MARKET, BY COUNTRY, 2024–2029 (USD MILLION)
  • TABLE 137 EUROPE: MARKET, BY OFFERING, 2019–2023 (USD MILLION)
  • TABLE 138 EUROPE: MARKET, BY OFFERING, 2024–2029 (USD MILLION)
  • TABLE 139 EUROPE: MARKET, BY SOFTWARE TYPE, 2019–2023 (USD MILLION)
  • TABLE 140 EUROPE: MARKET, BY SOFTWARE TYPE, 2024–2029 (USD MILLION)
  • TABLE 141 EUROPE: MARKET, BY SOFTWARE INTEGRATION, 2019–2023 (USD MILLION)
  • TABLE 142 EUROPE: ANALYTICS AS A SERVICE MARKET, BY SOFTWARE INTEGRATION, 2024–2029 (USD MILLION)
  • TABLE 143 EUROPE: MARKET, BY CLOUD TYPE, 2019–2023 (USD MILLION)
  • TABLE 144 EUROPE: MARKET, BY CLOUD TYPE, 2024–2029 (USD MILLION)
  • TABLE 145 EUROPE: ANALYTICS AS A SERVICE AAS MARKET, BY SERVICE, 2019–2023 (USD MILLION)
  • TABLE 146 EUROPE: MARKET, BY SERVICE, 2024–2029 (USD MILLION)
  • TABLE 147 EUROPE: MARKET, BY DATA TYPE, 2019–2023 (USD MILLION)
  • TABLE 148 EUROPE: MARKET, BY DATA TYPE, 2024–2029 (USD MILLION)
  • TABLE 149 EUROPE: MARKET, BY DATA PROCESSING, 2019–2023 (USD MILLION)
  • TABLE 150 EUROPE: MARKET, BY DATA PROCESSING, 2024–2029 (USD MILLION)
  • TABLE 151 EUROPE: MARKET, BY ANALYTICS TYPE, 2019–2023 (USD MILLION)
  • TABLE 152 EUROPE: MARKET, BY ANALYTICS TYPE, 2024–2029 (USD MILLION)
  • TABLE 153 EUROPE: MARKET, BY VERTICAL, 2019–2023 (USD MILLION)
  • TABLE 154 EUROPE: MARKET, BY VERTICAL, 2024–2029 (USD MILLION)
  • TABLE 155 EUROPE: MARKET, BY COUNTRY, 2019–2023 (USD MILLION)
  • TABLE 156 EUROPE: MARKET, BY COUNTRY, 2024–2029 (USD MILLION)
  • TABLE 157 ASIA PACIFIC: MARKET, BY OFFERING, 2019–2023 (USD MILLION)
  • TABLE 158 ASIA PACIFIC: MARKET, BY OFFERING, 2024–2029 (USD MILLION)
  • TABLE 159 ASIA PACIFIC: MARKET, BY SOFTWARE TYPE, 2019–2023 (USD MILLION)
  • TABLE 160 ASIA PACIFIC: MARKET, BY SOFTWARE TYPE, 2024–2029 (USD MILLION)
  • TABLE 161 ASIA PACIFIC: MARKET, BY SOFTWARE INTEGRATION, 2019–2023 (USD MILLION)
  • TABLE 162 ASIA PACIFIC: MARKET, BY SOFTWARE INTEGRATION, 2024–2029 (USD MILLION)
  • TABLE 163 ASIA PACIFIC: MARKET, BY CLOUD TYPE, 2019–2023 (USD MILLION)
  • TABLE 164 ASIA PACIFIC: MARKET, BY CLOUD TYPE, 2024–2029 (USD MILLION)
  • TABLE 165 ASIA PACIFIC: MARKET, BY SERVICE, 2019–2023 (USD MILLION)
  • TABLE 166 ASIA PACIFIC: MARKET, BY SERVICE, 2024–2029 (USD MILLION)
  • TABLE 167 ASIA PACIFIC: MARKET, BY DATA TYPE, 2019–2023 (USD MILLION)
  • TABLE 168 ASIA PACIFIC: MARKET, BY DATA TYPE, 2024–2029 (USD MILLION)
  • TABLE 169 ASIA PACIFIC: MARKET, BY DATA PROCESSING, 2019–2023 (USD MILLION)
  • TABLE 170 ASIA PACIFIC: MARKET, BY DATA PROCESSING, 2024–2029 (USD MILLION)
  • TABLE 171 ASIA PACIFIC: MARKET, BY ANALYTICS TYPE, 2019–2023 (USD MILLION)
  • TABLE 172 ASIA PACIFIC: MARKET, BY ANALYTICS TYPE, 2024–2029 (USD MILLION)
  • TABLE 173 ASIA PACIFIC: MARKET, BY VERTICAL, 2019–2023 (USD MILLION)
  • TABLE 174 ASIA PACIFIC: MARKET, BY VERTICAL, 2024–2029 (USD MILLION)
  • TABLE 175 ASIA PACIFIC: MARKET, BY COUNTRY, 2019–2023 (USD MILLION)
  • TABLE 176 ASIA PACIFIC: MARKET, BY COUNTRY, 2024–2029 (USD MILLION)
  • TABLE 177 MIDDLE EAST & AFRICA: MARKET, BY OFFERING, 2019–2023 (USD MILLION)
  • TABLE 178 MIDDLE EAST & AFRICA: MARKET, BY OFFERING, 2024–2029 (USD MILLION)
  • TABLE 179 MIDDLE EAST & AFRICA: MARKET, BY SOFTWARE TYPE, 2019–2023 (USD MILLION)
  • TABLE 180 MIDDLE EAST & AFRICA: MARKET, BY SOFTWARE TYPE, 2024–2029 (USD MILLION)
  • TABLE 181 MIDDLE EAST & AFRICA: MARKET, BY SOFTWARE INTEGRATION, 2019–2023 (USD MILLION)
  • TABLE 182 MIDDLE EAST & AFRICA: MARKET, BY SOFTWARE INTEGRATION, 2024–2029 (USD MILLION)
  • TABLE 183 MIDDLE EAST & AFRICA: MARKET, BY CLOUD TYPE, 2019–2023 (USD MILLION)
  • TABLE 184 MIDDLE EAST & AFRICA: MARKET, BY CLOUD TYPE, 2024–2029 (USD MILLION)
  • TABLE 185 MIDDLE EAST & AFRICA: MARKET, BY SERVICE, 2019–2023 (USD MILLION)
  • TABLE 186 MIDDLE EAST & AFRICA: MARKET, BY SERVICE, 2024–2029 (USD MILLION)
  • TABLE 187 MIDDLE EAST & AFRICA: ANALYTICS AS A SERVICE MARKET, BY DATA TYPE, 2019–2023 (USD MILLION)
  • TABLE 188 MIDDLE EAST & AFRICA: MARKET, BY DATA TYPE, 2024–2029 (USD MILLION)
  • TABLE 189 MIDDLE EAST & AFRICA: MARKET, BY DATA PROCESSING, 2019–2023 (USD MILLION)
  • TABLE 190 MIDDLE EAST & AFRICA: MARKET, BY DATA PROCESSING, 2024–2029 (USD MILLION)
  • TABLE 191 MIDDLE EAST & AFRICA: MARKET, BY ANALYTICS TYPE, 2019–2023 (USD MILLION)
  • TABLE 192 MIDDLE EAST & AFRICA: MARKET, BY ANALYTICS TYPE, 2024–2029 (USD MILLION)
  • TABLE 193 MIDDLE EAST & AFRICA: MARKET, BY VERTICAL, 2019–2023 (USD MILLION)
  • TABLE 194 MIDDLE EAST & AFRICA: MARKET, BY VERTICAL, 2024–2029 (USD MILLION)
  • TABLE 195 MIDDLE EAST & AFRICA: MARKET, BY COUNTRY, 2019–2023 (USD MILLION)
  • TABLE 196 MIDDLE EAST & AFRICA: MARKET, BY COUNTRY, 2024–2029 (USD MILLION)
  • TABLE 197 LATIN AMERICA: MARKET, BY OFFERING, 2019–2023 (USD MILLION)
  • TABLE 198 LATIN AMERICA: MARKET, BY OFFERING, 2024–2029 (USD MILLION)
  • TABLE 199 LATIN AMERICA: MARKET, BY SOFTWARE TYPE, 2019–2023 (USD MILLION)
  • TABLE 200 LATIN AMERICA: MARKET, BY SOFTWARE TYPE, 2024–2029 (USD MILLION)
  • TABLE 201 LATIN AMERICA: MARKET, BY SOFTWARE INTEGRATION, 2019–2023 (USD MILLION)
  • TABLE 202 LATIN AMERICA: MARKET, BY SOFTWARE INTEGRATION, 2024–2029 (USD MILLION)
  • TABLE 203 LATIN AMERICA: MARKET, BY CLOUD TYPE, 2019–2023 (USD MILLION)
  • TABLE 204 LATIN AMERICA: MARKET, BY CLOUD TYPE, 2024–2029 (USD MILLION)
  • TABLE 205 LATIN AMERICA: MARKET, BY SERVICE, 2019–2023 (USD MILLION)
  • TABLE 206 LATIN AMERICA: MARKET, BY SERVICE, 2024–2029 (USD MILLION)
  • TABLE 207 LATIN AMERICA: MARKET, BY DATA TYPE, 2019–2023 (USD MILLION)
  • TABLE 208 LATIN AMERICA: MARKET, BY DATA TYPE, 2024–2029 (USD MILLION)
  • TABLE 209 LATIN AMERICA: MARKET, BY DATA PROCESSING, 2019–2023 (USD MILLION)
  • TABLE 210 LATIN AMERICA: MARKET, BY DATA PROCESSING, 2024–2029 (USD MILLION)
  • TABLE 211 LATIN AMERICA: MARKET, BY ANALYTICS TYPE, 2019–2023 (USD MILLION)
  • TABLE 212 LATIN AMERICA: MARKET, BY ANALYTICS TYPE, 2024–2029 (USD MILLION)
  • TABLE 213 LATIN AMERICA: MARKET, BY VERTICAL, 2019–2023 (USD MILLION)
  • TABLE 214 LATIN AMERICA: MARKET, BY VERTICAL, 2024–2029 (USD MILLION)
  • TABLE 215 LATIN AMERICA: MARKET, BY COUNTRY, 2019–2023 (USD MILLION)
  • TABLE 216 LATIN AMERICA: MARKET, BY COUNTRY, 2024–2029 (USD MILLION)
  • TABLE 217 OVERVIEW OF STRATEGIES ADOPTED BY KEY ANALYTICS AS A SERVICE VENDORS
  • TABLE 218 MARKET: DEGREE OF COMPETITION
  • TABLE 219 REGION FOOTPRINT (23 COMPANIES)
  • TABLE 220 DATA PROCESSING FOOTPRINT (23 COMPANIES)
  • TABLE 221 VERTICAL FOOTPRINT (23 COMPANIES)
  • TABLE 222 OFFERING FOOTPRINT (23 COMPANIES)
  • TABLE 223 MARKET: DETAILED LIST OF KEY STARTUPS/SMES
  • TABLE 224 MARKET: COMPETITIVE BENCHMARKING OF STARTUPS/SMES
  • TABLE 225 MARKET: PRODUCT LAUNCHES & ENHANCEMENTS, JANUARY 2021–APRIL 2024
  • TABLE 226 MARKET: DEALS, JANUARY 2021–APRIL 2024
  • TABLE 227 MICROSOFT: COMPANY OVERVIEW
  • TABLE 228 MICROSOFT: PRODUCTS/SOLUTIONS/SERVICES OFFERED
  • TABLE 229 MICROSOFT: PRODUCT LAUNCHES AND ENHANCEMENTS
  • TABLE 230 MICROSOFT: DEALS
  • TABLE 231 IBM: COMPANY OVERVIEW
  • TABLE 232 IBM: PRODUCTS/SOLUTIONS/SERVICES OFFERED
  • TABLE 233 IBM: PRODUCT LAUNCHES AND ENHANCEMENTS
  • TABLE 234 IBM: DEALS
  • TABLE 235 GOOGLE: COMPANY OVERVIEW
  • TABLE 236 GOOGLE: PRODUCTS/SOLUTIONS/SERVICES OFFERED
  • TABLE 237 GOOGLE: PRODUCT LAUNCHES AND ENHANCEMENTS
  • TABLE 238 GOOGLE: DEALS
  • TABLE 239 ORACLE: COMPANY OVERVIEW
  • TABLE 240 ORACLE: PRODUCTS/SOLUTIONS/SERVICES OFFERED
  • TABLE 241 ORACLE: PRODUCT LAUNCHES AND ENHANCEMENTS
  • TABLE 242 ORACLE: DEALS
  • TABLE 243 SAP: COMPANY OVERVIEW
  • TABLE 244 SAP: PRODUCTS/SOLUTIONS/SERVICES OFFERED
  • TABLE 245 SAP: PRODUCT LAUNCHES AND ENHANCEMENTS
  • TABLE 246 SAP: DEALS
  • TABLE 247 AWS: COMPANY OVERVIEW
  • TABLE 248 AWS: PRODUCTS/SOLUTIONS/SERVICES OFFERED
  • TABLE 249 AWS: PRODUCT LAUNCHES AND ENHANCEMENTS
  • TABLE 250 AWS: DEALS
  • TABLE 251 SAS INSTITUTE: COMPANY OVERVIEW
  • TABLE 252 SAS INSTITUTE: PRODUCTS/SOLUTIONS/SERVICES OFFERED
  • TABLE 253 SAS INSTITUTE: PRODUCT LAUNCHES AND ENHANCEMENTS
  • TABLE 254 SAS INSTITUTE: DEALS
  • TABLE 255 TERADATA: COMPANY OVERVIEW
  • TABLE 256 TERADATA: PRODUCTS/SOLUTIONS/SERVICES OFFERED
  • TABLE 257 TERADATA: PRODUCT LAUNCHES AND ENHANCEMENTS
  • TABLE 258 TERADATA: DEALS
  • TABLE 259 QLIK: COMPANY OVERVIEW
  • TABLE 260 QLIK: PRODUCTS/SOLUTIONS/SERVICES OFFERED
  • TABLE 261 QLIK: PRODUCT LAUNCHES AND ENHANCEMENTS
  • TABLE 262 QLIK: DEALS
  • TABLE 263 SALESFORCE: COMPANY OVERVIEW
  • TABLE 264 SALESFORCE: PRODUCTS/SOLUTIONS/SERVICES OFFERED
  • TABLE 265 SALESFORCE: PRODUCT LAUNCHES AND ENHANCEMENTS
  • TABLE 266 RISK ANALYTICS MARKET, BY OFFERING, 2019–2023 (USD MILLION)
  • TABLE 267 RISK ANALYTICS MARKET, BY OFFERING, 2024–2029 (USD MILLION)
  • TABLE 268 RISK ANALYTICS MARKET, BY RISK TYPE, 2019–2023 (USD MILLION)
  • TABLE 269 RISK ANALYTICS MARKET, BY RISK TYPE, 2024–2029 (USD MILLION)
  • TABLE 270 RISK ANALYTICS MARKET, BY RISK STAGE, 2019–2023 (USD MILLION)
  • TABLE 271 RISK ANALYTICS MARKET, BY RISK STAGE, 2024–2029 (USD MILLION)
  • TABLE 272 RISK ANALYTICS MARKET, BY VERTICAL, 2019–2023 (USD MILLION)
  • TABLE 273 RISK ANALYTICS MARKET, BY VERTICAL, 2024–2029 (USD MILLION)
  • TABLE 274 RISK ANALYTICS MARKET, BY REGION, 2019–2023 (USD MILLION)
  • TABLE 275 RISK ANALYTICS MARKET, BY REGION, 2024–2029 (USD MILLION)
  • TABLE 276 ADVANCED ANALYTICS MARKET, BY OFFERING, 2017–2022 (USD BILLION)
  • TABLE 277 ADVANCED ANALYTICS MARKET, BY OFFERING, 2023–2028 (USD BILLION)
  • TABLE 278 ADVANCED ANALYTICS MARKET, BY TYPE, 2017–2022 (USD BILLION)
  • TABLE 279 ADVANCED ANALYTICS MARKET, BY TYPE, 2023–2028 (USD BILLION)
  • TABLE 280 ADVANCED ANALYTICS MARKET, BY BUSINESS FUNCTION, 2017–2022 (USD BILLION)
  • TABLE 281 ADVANCED ANALYTICS MARKET, BY BUSINESS FUNCTION, 2023–2028 (USD BILLION)
  • TABLE 282 ADVANCED ANALYTICS MARKET, BY VERTICAL, 2017–2022 (USD BILLION)
  • TABLE 283 ADVANCED ANALYTICS MARKET, BY VERTICAL, 2023–2028 (USD BILLION)
  • TABLE 284 ADVANCED ANALYTICS MARKET, BY REGION, 2017–2022 (USD BILLION)
  • TABLE 285 ADVANCED ANALYTICS MARKET, BY REGION, 2023–2028 (USD BILLION)
LIST OF FIGURES
 
  • FIGURE 1 MARKET SEGMENTATION
  • FIGURE 2 REGIONAL SEGMENTATION
  • FIGURE 3 MARKET: RESEARCH DESIGN
  • FIGURE 4 DATA TRIANGULATION
  • FIGURE 5 ANALYTICS AS A SERVICE MARKET: TOP-DOWN AND BOTTOM-UP APPROACHES
  • FIGURE 6 MARKET SIZE ESTIMATION METHODOLOGY: APPROACH 1, BOTTOM-UP (SUPPLY-SIDE) – COLLECTIVE REVENUE GENERATED FROM SALES OF ANALYTICS AS A SERVICE SOFTWARE/SERVICES
  • FIGURE 7 MARKET SIZE ESTIMATION METHODOLOGY: APPROACH 2, BOTTOM-UP (SUPPLY-SIDE)
  • FIGURE 8 MARKET SIZE ESTIMATION METHODOLOGY: APPROACH 3, BOTTOM-UP (SUPPLY-SIDE)
  • FIGURE 9 MARKET SIZE ESTIMATION METHODOLOGY: APPROACH 4, BOTTOM-UP (DEMAND-SIDE) – SHARE OF ANALYTICS AS A SERVICE THROUGH TOTAL SPENDING ON DIGITAL SOLUTIONS
  • FIGURE 10 SOFTWARE SEGMENT TO DOMINATE MARKET IN 2024
  • FIGURE 11 BI & VISUALIZATION SEGMENT TO HOLD LARGEST MARKET SHARE IN 2024
  • FIGURE 12 EMBEDDED INTEGRATION SEGMENT TO DOMINATE MARKET IN 2024
  • FIGURE 13 PUBLIC CLOUD SEGMENT TO HOLD LARGEST MARKET SHARE IN 2024
  • FIGURE 14 CONSULTING & ENGINEERING SERVICES SEGMENT TO DOMINATE MARKET IN 2024
  • FIGURE 15 UNSTRUCTURED DATA TYPE TO DOMINATE MARKET IN 2024
  • FIGURE 16 REAL-TIME ANALYTICS TO DOMINATE MARKET IN 2024
  • FIGURE 17 MARKETING ANALYTICS SEGMENT TO HOLD LARGEST SHARE IN 2024
  • FIGURE 18 HEALTHCARE & LIFE SCIENCES SEGMENT TO GROW AT HIGHEST CAGR AND BFSI TO ACCOUNT FOR LARGEST MARKET SIZE DURING FORECAST PERIOD
  • FIGURE 19 ASIA PACIFIC TO GROW AT HIGHEST CAGR DURING FORECAST PERIOD
  • FIGURE 20 GROWING TRANSITION TO CLOUD-BASED ANALYTICS TO DRIVE MARKET GROWTH
  • FIGURE 21 HR ANALYTICS TO GROW AT HIGHEST CAGR DURING FORECAST PERIOD
  • FIGURE 22 SOFTWARE AND STRUCTURED SEGMENTS TO HOLD LARGER MARKET SHARES IN 2024
  • FIGURE 23 NORTH AMERICA TO HOLD LARGEST MARKET SHARE IN 2024
  • FIGURE 24 ANALYTICS AS A SERVICE MARKET: DRIVERS, RESTRAINTS, OPPORTUNITIES, AND CHALLENGES
  • FIGURE 25 EVOLUTION OF ANALYTICS AS A SERVICE MARKET
  • FIGURE 26 ANALYTICS AS A SERVICE MARKET: SUPPLY CHAIN ANALYSIS
  • FIGURE 27 KEY PLAYERS IN ANALYTICS AS A SERVICE MARKET ECOSYSTEM
  • FIGURE 28 ANALYTICS AS A SERVICE MARKET: INVESTMENT LANDSCAPE AND FUNDING SCENARIO (USD MILLION AND NUMBER OF FUNDING ROUNDS)
  • FIGURE 29 NUMBER OF PATENTS GRANTED TO VENDORS IN LAST 10 YEARS
  • FIGURE 30 TOP 10 PATENT APPLICANTS IN LAST 10 YEARS
  • FIGURE 31 REGIONAL ANALYSIS OF PATENTS GRANTED, 2013–2023
  • FIGURE 32 AVERAGE SELLING PRICES OF KEY PLAYERS FOR TOP 3 SOFTWARE TYPES
  • FIGURE 33 PORTER’S FIVE FORCES ANALYSIS
  • FIGURE 34 TRENDS/DISRUPTIONS IMPACTING CUSTOMERS’ BUSINESSES
  • FIGURE 35 INFLUENCE OF STAKEHOLDERS ON BUYING PROCESS FOR TOP THREE VERTICALS
  • FIGURE 36 KEY BUYING CRITERIA FOR TOP THREE VERTICALS
  • FIGURE 37 SERVICES SEGMENT TO GROW AT HIGHER CAGR DURING FORECAST PERIOD
  • FIGURE 38 BI & VISUALIZATION SEGMENT TO GROW AT HIGHEST CAGR DURING FORECAST PERIOD
  • FIGURE 39 EMBEDDED SEGMENT TO GROW AT HIGHEST CAGR DURING FORECAST PERIOD
  • FIGURE 40 HYBRID SEGMENT TO GROW AT HIGHEST CAGR DURING FORECAST PERIOD
  • FIGURE 41 BUSINESS INTELLIGENCE SERVICES SEGMENT TO GROW AT HIGHER CAGR DURING FORECAST PERIOD
  • FIGURE 42 UNSTRUCTURED SEGMENT TO GROW AT HIGHEST CAGR DURING FORECAST PERIOD
  • FIGURE 43 BATCH PROCESSING SEGMENT TO GROW AT HIGHEST CAGR DURING FORECAST PERIOD
  • FIGURE 44 HR ANALYTICS SEGMENT TO GROW AT HIGHER CAGR DURING FORECAST PERIOD
  • FIGURE 45 HEALTHCARE & LIFE SCIENCES TO GROW AT HIGHEST CAGR DURING FORECAST PERIOD
  • FIGURE 46 NORTH AMERICA TO ACCOUNT FOR LARGEST MARKET SHARE DURING FORECAST PERIOD
  • FIGURE 47 INDIA TO WITNESS FASTEST GROWTH DURING FORECAST PERIOD
  • FIGURE 48 NORTH AMERICA: ANALYTICS AS A SERVICE MARKET SNAPSHOT
  • FIGURE 49 ASIA PACIFIC: ANALYTICS AS A SERVICE MARKET SNAPSHOT
  • FIGURE 50 TOP FIVE PLAYERS DOMINATING MARKET FROM 2019 TO 2023 (USD MILLION)
  • FIGURE 51 SHARE OF LEADING COMPANIES IN ANALYTICS AS A SERVICE MARKET, 2023
  • FIGURE 52 BRAND COMPARATIVE ANALYSIS
  • FIGURE 53 COMPANY VALUATION AND FINANCIAL METRICS OF KEY VENDORS
  • FIGURE 54 YEAR-TO-DATE (YTD) PRICE TOTAL RETURN AND 5-YEAR STOCK BETA OF KEY VENDORS
  • FIGURE 55 ANALYTICS AS A SERVICE MARKET: COMPANY EVALUATION MATRIX (KEY PLAYERS), 2023
  • FIGURE 56 COMPANY FOOTPRINT (23 COMPANIES)
  • FIGURE 57 ANALYTICS AS A SERVICE MARKET: COMPANY EVALUATION MATRIX (STARTUPS/SMES), 2023
  • FIGURE 58 MICROSOFT: COMPANY SNAPSHOT
  • FIGURE 59 IBM: COMPANY SNAPSHOT
  • FIGURE 60 GOOGLE: COMPANY SNAPSHOT
  • FIGURE 61 ORACLE: COMPANY SNAPSHOT
  • FIGURE 62 SAP: COMPANY SNAPSHOT
  • FIGURE 63 AWS: COMPANY SNAPSHOT
  • FIGURE 64 TERADATA: COMPANY SNAPSHOT
  • FIGURE 65 SALESFORCE: COMPANY SNAPSHOT


The Analytics as a Service market research study involved extensive secondary sources, directories, journals, and paid databases. Primary sources were mainly industry experts from the core and related industries, preferred AaaS providers, third-party service providers, consulting service providers, end users, and other commercial enterprises. In-depth interviews were conducted with various primary respondents, including key industry participants and subject matter experts, to obtain and verify critical qualitative and quantitative information, and assess the market’s prospects.

Secondary Research

In the secondary research process, various sources were referred to, for identifying and collecting information for this study. Secondary sources included annual reports, press releases, and investor presentations of companies; white papers, journals, and certified publications; and articles from recognized authors, directories, and databases. The data was also collected from other secondary sources, such as journals, government websites, blogs, and vendors' websites. Additionally, AaaS spending of various countries was extracted from the respective sources. Secondary research was mainly used to obtain key information related to the industry’s value chain and supply chain to identify key players based on software, services, market classification, and segmentation according to offerings of major players, industry trends related to software, services, cloud type, data type, data processing, analytics type, vertical and regions, and key developments from both market- and technology-oriented perspectives.

Primary Research

In the primary research process, various primary sources from both the supply and demand sides were interviewed to obtain qualitative and quantitative information on the market. The primary sources from the supply side included various industry experts, including Chief Experience Officers (CXOs); Vice Presidents (VPs); directors from business development, marketing, and AaaS expertise; related key executives from AaaS software vendors, SIs, professional service providers, and industry associations; and key opinion leaders.

Primary interviews were conducted to gather insights, such as market statistics, revenue data collected from software and services, market breakups, market size estimations, market forecasts, and data triangulation. Primary research also helped understand various trends related to technologies, applications, deployments, and regions. Stakeholders from the demand side, such as Chief Information Officers (CIOs), Chief Technology Officers (CTOs), Chief Strategy Officers (CSOs), and end users using AaaS software, were interviewed to understand the buyer’s perspective on suppliers, products, service providers, and their current usage of AaaS software and services, which would impact the overall Analytics as a Service market.

The Breakup of Primary Research:
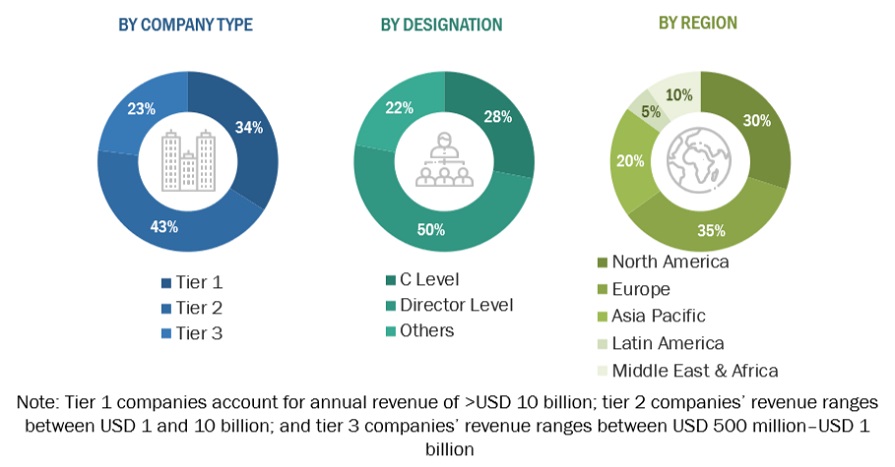
Analytics as a Service Market Size, and Share

To know about the assumptions considered for the study, download the pdf brochure

Market Size Estimation

In the bottom-up approach, the adoption rate of AaaS among different end users in key countries concerning their regions contributing the most to the market share was identified. For cross-validation, the adoption of AaaS software and services among industries and different use cases concerning their regions was identified and extrapolated. Weightage was given to use cases identified in different regions for the market size calculation.

Based on the market numbers, the regional split was determined by primary and secondary sources. The procedure included the analysis of the AaaS market’s regional penetration. Based on secondary research, the regional spending on Information and Communications Technology (ICT), socio-economic analysis of each country, strategic vendor analysis of major AaaS providers, and organic and inorganic business development activities of regional and global players were estimated. With the data triangulation procedure and data validation through primaries, the exact values of the overall AaaS market size and segments’ size were determined and confirmed using the study.

Global Analytics as a Service Market Size: Bottom-Up and Top-Down Approach:
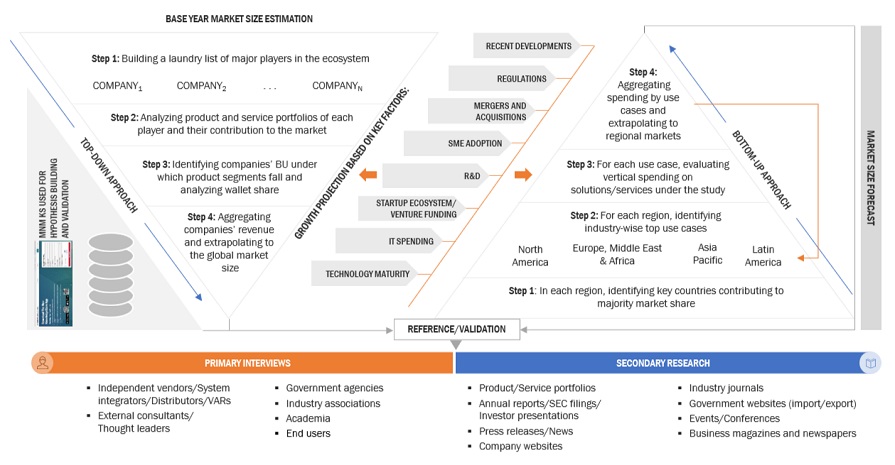
Analytics as a Service Market Bottom Up and Top Down Approach

To know about the assumptions considered for the study, Request for Free Sample Report

Data Triangulation

Based on the market numbers, the regional split was determined by primary and secondary sources. The procedure included the analysis of the Analytics as a Service market’s regional penetration. Based on secondary research, the regional spending on Information and Communications Technology (ICT), socio-economic analysis of each country, strategic vendor analysis of major AaaS providers, and organic and inorganic business development activities of regional and global players were estimated. With the data triangulation procedure and data validation through primaries, the exact values of the overall Analytics as a Service market size and segments’ size were determined and confirmed using the study.

Market Definition

Analytics as a Service (AaaS) is a type of Cloud service. It provides access to data analysis software and tools through the Cloud, rather than having to invest in on-premise software. AaaS services are complete and customizable solutions for organizing, analyzing and visualizing data. The objectives are the same as for on-premise solutions, namely, to provide information that can be used to make better decisions. These tools offer different data analysis methods and technologies such as Data Mining, Predictive Analysis, Dataviz or even advanced techniques such as Artificial Intelligence and Machine Learning. One of the main advantages of AaaS solutions is that these services are based on a subscription model. As with other types of Cloud services, the user pays only for the resources he or she consumes. This typically saves money compared to purchasing on-premise software and the accompanying license.

Stakeholders

  • Application design and software developers
  • Business owners/executives
  • Service managers
  • Cloud service providers
  • Consulting service providers
  • Data scientists
  • Quality assurance analysts
  • Distributors and Value-added Resellers (VARs)
  • Government agencies
  • Independent Software Vendors (ISVs)
  • Market research and consulting firms
  • Support and maintenance service providers
  • System Integrators (SIs)/Migration service providers
  • Technology providers
  • Analytics Service Providers
  • Chief Data Officers (CDOs)
  • Academic and Research Institutions

Report Objectives

  • To define, describe, and predict the Analytics as a Service market by offering (software (type, integration) and services), data type, data processing, analytics type, vertical, and region
  • To provide detailed information related to major factors (drivers, restraints, opportunities, and industry-specific challenges) influencing the market growth
  • To analyze the micro markets with respect to individual growth trends, prospects, and their contribution to the total market
  • To analyze the opportunities in the market for stakeholders by identifying the high-growth segments of the Analytics as a Service market
  • To analyze the opportunities in the market and provide details of the competitive landscape for stakeholders and market leaders
  • To forecast the market size of segments for five main regions: North America, Europe, Asia Pacific, Middle East & Africa, and Latin America
  • To profile key players and comprehensively analyze their market rankings and core competencies.
  • To analyze the competitive developments, such as partnerships, product launches, and mergers & acquisitions, in the Analytics as a Service market
  • To analyze the impact of recession across all regions in the Analytics as a Service market

Available Customizations

With the given market data, MarketsandMarkets offers customizations as per your company’s specific needs. The following customization options are available for the report:

Product Analysis

  • Product quadrant, which gives a detailed comparison of the product portfolio of each company.

Geographic Analysis

  • Further breakup of the North American Analytics as a Service market
  • Further breakup of the European Analytics as a Service market
  • Further breakup of the Asia Pacific Analytics as a Service market
  • Further breakup of the Middle Eastern & African Analytics as a Service market
  • Further breakup of the Latin America Analytics as a Service market

Company Information

  • Detailed analysis and profiling of additional market players (up to five)

Previous Versions of this Report

Analytics as a Service Market by Component, Deployment Mode, Organization Size, Industry Vertical (BFSI, Telecommunications and IT, Healthcare and Life Sciences, and Retail and eCommerce), and Region - Global Forecast to 2024

Report Code TC 3568
Published in Feb, 2020, By MarketsandMarkets™

Analytics as a Service Market by Solution (Financial Analytics, Risk Analytics, Customer Analytics), Services, Analytics Type (Prescriptive, Predictive), Deployment Model, Organization Size, Verticals, and Regions - Global Forecast to 2021

Report Code TC 3568
Published in Jun, 2016, By MarketsandMarkets™

Analytics as a Service Market by Solutions (Financial Analytics, Risk Analytics, Customer Analytics, Marketing Analytics, Sales Analytics, Web & Social Media Analytics, Supply Chain Analytics, Network Analytics, & Others) - Global Forecast to 2020

Report Code TC 3568
Published in Jul, 2015, By MarketsandMarkets™
"Our USP is "providing game-changing business opportunities reports with free customization" - so please feel free to provide us with your specific areas of interest / business challenges in much greater detail !!"

We appreciate your interest in this report. Once you fill out the form, you'll be immediately directed to an exclusive solution tailored to your needs. This high-value offering can help boost your revenue by 30% - a must-see opportunity for anyone looking to maximize growth.


By clicking the "Submit" button, you are agreeing to the Terms of Use and Privacy Policy.

Custom Market Research Services

We Will Customise The Research For You, In Case The Report Listed Above Does Not Meet With Your Requirements

Get 10% Free Customisation

Growth opportunities and latent adjacency in Analytics as a Service Market

DMCA.com Protection Status