Wind Blade Recycling Market

Report Code CH 9219
Published in Nov, 2024, By MarketsandMarkets™
Download PDF

Choose License Type

Buy Report Now Inquire Before Buying

Wind Blade Recycling Market By Recycling Method (Mechanical Recycling, Thermal Recycling, Chemical Recycling), Blade Material (Glass Fiber, Carbon Fiber), End-Use Industry, and Region - Forecast to 2029

Overview

The global wind blade recycling market is valued at USD 68,235 thousand in 2024 and is projected to reach USD 370,935 thousand by 2029, growing at 40.3% cagr from 2024 to 2029. Innovations in recycling technologies, collaboration among various recycling companies, and the adoption of circular economy practices to recycle wind turbine blades are driving the growth of this market.

Wind blade recycling refers to an industry focused on recycling older wind turbine blades. These decommissioned wind turbine blades are recycled using either mechanical, chemical, or thermal recycling methods. Valuable materials such as glass fiber and carbon fiber extracted from wind blades can be used in end-use industries such as construction, automotive, electronics, energy, sports, and textile. The number of older wind turbines reaching the end of their operational life has increased. Recycling companies have converted the waste created by wind turbines into valuable resources for many industries.

Attractive Opportunities in the Wind Blade Recycling Market

Asia Pacific

Growth in the Asia Pacific wind blade recycling market can be attributed to the significant investments in renewable energy, rapid urbanization, and the need to recycle the rising number of decommissioned wind turbine blades.

The increasing application of wind blade recycled materials in the construction, automotive, electronic, and consumer goods industries is contributing to the growth of the global wind blade recycling market.

Ongoing research and developmental efforts are improving recycling technologies.

The wind blade recycling market is expected to be worth USD 370,935 thousand by 2029, growing at a CAGR of 40.3% during the forecast period.

The increasing demand for glass fiber and carbon fiber blade materials is offering growth opportunities for players in the wind blade recycling market.

Global Wind Blade Recycling Market Dynamics

DRIVER: Rising number of decommissioned blades

The wind blade recycling market is experiencing growth due to the increasing number of decommissioned wind turbine blades. With an increase in the demand for clean energy initiatives, the number of decommissioned wind turbine blades is expected to increase drastically. Recycling companies can decommission the wind turbine blades and extract valuable resources such as glass fiber and carbon fiber from them. As governments are adopting circular economy solutions, it is becoming important for companies to address waste-related issues. With advancements in wind blade technologies, manufacturers and recycling companies find it easy to recycle decommissioned wind turbine blades. According to a study by the American Recycler, the waste generated from wind blade recycling accumulates to around 50,000 tons each year, and this figure is expected to increase to 500,000 tons by 2030, boosting the demand for wind blade recycling. Ongoing research and development in the wind blade recycling market for advancing recycling technologies is making the process economically friendly. Factors such as increasing awareness of environmental regulations regarding landfill disposal, regulatory pressures, and circular economy principles, which result in the increasing number of decommissioned wind turbine blades, will drive the growth of this market during the forecast period.

RESTRAINT: High recycling cost compared to landfilling

Wind turbine blades are made of composite materials such as glass fiber and carbon fiber, which are difficult to recycle. The complexity of separating the materials leads to higher costs than landfilling. The transportation of wind blades further adds to the overall cost of recycling wind turbine blades. Certain technologies, such as pyrolysis and solvolysis, are being developed to break down the composite materials from wind blade recycling, but these technologies are still under development, leading to high recycling costs. In many countries, landfilling is economically less cheap and attractive than recycling wind turbine blades. Various technologies such as thermal recycling, mechanical recycling, and chemical recycling exist but are still in the development stage and are not yet commercially cost-competitive. The wind blade recycling process is still under development, leading to changes in technology. Until these advancements are widely adopted by governments and recycling companies, the cost of recycling wind turbine blades will be higher than landfilling. The wind blade market is still under development, as there is limited demand for wind blade recycling. Unless the demand for recycled carbon fiber and glass fiber increases from end-use industries such as construction and automobile, the cost of recycling will be higher than landfilling.


OPPORTUNITY: Growing installation of wind turbines globally

The global wind energy sector is changing due to the increasing number of wind turbine blades. The older wind turbine blades would be replaced with new efficient blades. Many regions are experiencing regulations that encourage the recycling of wind turbine blades. For instance, European policies aim to ban the landfilling of decommissioned blades by 2025, pushing the industry toward recycling solutions. As the number of decommissioned blades increases, the waste generated will increase, leading to recycling companies playing a major role in the recycling of wind turbine blades. Governments are increasingly focusing on sustainability and environmental protection, which is why countries are implementing stricter regulations regarding the recycling of wind turbine blades. Rather than dumping the decommissioned wind blades, companies can recycle the wind turbine blades and decommission them, which can lead to the extraction of carbon fibers and glass fibers. As per the Global Wind report of 2024, 77.6W of wind power capacity was added globally in 2022, bringing the number to 906GW. From 2023 to 2027, more than 680W of wind power capacity is expected to be added, which would lead to older blades getting decommissioned for wind blade recycling.

CHALLENGES: Challenges in recycling wind blades due to low TRL of recycling methods

Technology readiness level (TRL) assesses the maturity of the technology across various sectors. As the technologies for wind blade recycling are still in the early stage of development, the TRL level for many companies is often close to 6. TRLs ranging from 1 to 4 are at primary levels, where basic research is conducted on the process. TRLs between 5 and 7 are in the testing phase, where technology is tested against all parameters. TRLs between 8 and 9 are fully operational and commercially available. Lower TRL leads to high investments and running costs, which leads to significant investments in the research and development of recycling methods for wind blade recycling. As wind turbine blades are composed of composite materials, they are difficult to recycle, leading to an increase in cost due to the complexity of the recycling process. Traditional recycling methods, such as mechanical recycling, consist of higher TRLs, which leads to degraded material quality. On the other hand, advanced recycling methods have TRLs of about 5 to 6, which is less and requires significant research and development before they can be used commercially.

Global Wind Blade Recycling Market Ecosystem Analysis

The ecosystem of this market comprises wind blade manufacturers/wind farm owners like LM Wind Power, Vestas, Ørsted, and Siemens Gamesa Renewable Energy, which provide decommissioned wind turbine blades to recycling companies. Notable companies in the wind blade recycling market, such as Stena Recycling, Veolia, Holcim Group, and Continuum, process these decommissioned wind turbine blades and extract glass fiber and carbon fiber, which is further sent to the end users such as Hyundai, EL Ganso, and Cemex.


Based on the end-use industry, the automotive segment is projected to register the highest CAGR during the forecast period

There is a growing demand for lightweight and durable materials in the automotive sector. As wind turbine blades are made up of composite materials such as glass and carbon fiber, they can be used to reduce vehicle weight and improve structural integrity. The carbon fiber and glass fiber extracted from recycling wind turbine blades can be used as structural components in interior and exterior parts, helping automotive car manufacturers enhance the performance and efficiency of their vehicles. As companies would be less reliant on virgin materials, by using recycled glass fiber and carbon fiber from wind blade recycling, automotive manufacturers can also lower their production costs. Recycled materials from wind turbine blades can be used in various automotive applications, such as interior panels, dashboards, and structural components. As environmental regulations are becoming stricter, companies need to adhere to the use of recycled materials in automotive vehicles. Companies can avoid penalties and even market themselves better by using recycled materials such as glass fiber and carbon fiber in automotive vehicles.

Based on blade material, the glass fiber segment is anticipated to register the highest CAGR during the forecast period

The glass fiber segment is gaining an advantage as applications of wind blade recycling are inextricably linked to several factors. First of all, the recycling of wind turbine blades enables the extraction of high-grade glass fibers, which are suitable for a range of applications, such as automotive and construction materials. Advanced recycling technologies, solvolysis, in particular, ensure that glass fibers are separated from the polymer resin matrix and remain intact in terms of mechanical properties during such processes, thus allowing the fibers to be reused. Furthermore, the increased emphasis on sustainable practices causes the demand for recycled materials to rise. Manufacturers can cut their operational expenses by utilizing recycled glass fibers and depend less on pure sources. Moreover, besides the market imperatives, legal requirements aimed at preventing the landfilling of waste and encouraging the practices of the circular economy are also helpful in seeking recycling options.

As technologies improve and become more cost-effective, the glass fiber segment is likely to benefit from the introduction of materials from retired wind blades. This not only helps with resource efficiency but also encourages new ideas in how materials are used, thus improving the sustainability of both industries.

Asia Pacific to be the fastest-growing region in the wind blade recycling market during the forecast period

The Asia Pacific is the fastest-growing region in the wind blade recycling market due to the increasing number of wind energy installations in countries such as China and India, which results in a higher volume of blades being taken out of service. This will increase the demand for blade recycling. In 2022, the Asia Pacific was responsible for 56% of new wind energy capacity, which reinforces the fact that the Asia Pacific is a major market for renewable energy. It is also assisted by government strategies; certain countries in the Asia Pacific are enforcing laws and paving the way for environmentally sustainable practices by providing financial support for technologies that recycle. This encourages investment in recycling facilities and research and development. Consumers and industries also increasingly focus on the sustainability of the ecosystem, thus forcing manufacturers to consider the principles of a circular economy where waste and materials are kept to a minimum. In addition, new recycling technologies are improving processes and reducing costs, which is also beneficial to market development. A combination of these factors indicates that the Asia Pacific region is expected to make large strides in wind blade recycling while also achieving environmental and economic growth within the renewable energy industry. While China remains a dominant player in the global market, other Asian countries like India, Japan, and Australia attract foreign investments in the regional wind blade recycling market.

HIGHEST CAGR MARKET IN 2023

Recent Developments of Wind Blade Recycling Market

  • In May 2024, Acciona collaborated with RenerCycle in Spain to introduce a new facility for wind blade recycling named Waste2Fiber, which is expected to be operational in 2025. This facility will use the thermal recycling method to avoid combustion and has received USD 5.7 million in funding from the Spanish government’s Proyectos Estratégicos para la Recuperación y Transformación Económica (PERTE) program, along with support from the Navarra government.
  • In April 2023, MAKEEN Energy collaborated with glass fiber composite manufacturer 3B Fiberglass to provide solutions on wind blade recycling for the extraction of glass fiber.
  • In February 2023, Stena Recycling partnered with Vestas and Olin for the recycling of wind turbine blades. This partnership is a part of the CETEC Initiative. Vestas is a global manufacturer of wind turbine blades. Stena Recycling works in the recycling business, and Olin contributes to the chemical process. Together, these companies will work to improve the sustainable recycling process.
  • In January 2023, Iberdrola signed an agreement with SURUS to provide solutions regarding wind blade recycling through its joint initiative subsidiary, EnergyLOOP, which works on recycling renewable installation components, including wind blades.

Key Market Players

Want to explore hidden markets that can drive new revenue in Wind Blade Recycling Market?

Scope of the Report

Report Metric Details
Market size available for years 2022-2029
Base Year Considered 2023
Forecast period 2024-2029
Forecast units Value (USD Thousand), Volume (Ton)
Segments covered By Blade Material, By Recycling Method, By End-Use Industry, and Region
Geographies covered Europe, North America, Asia Pacific, Latin America, Middle East, and Africa


Key Questions Addressed by the Report

Who are the major companies in the wind blade recycling market? What are the key strategies adopted by market players to strengthen their market presence?
Some of the key players in the wind blade recycling market are Veolia (France), Acciona (Spain), Stena Metal AB (Sweden), Vestas (Denmark), Iberdrola, S.A. (Spain), MAKEEN Energy (Denmark), Kuusakoski OY (Finland), Renercycle (Spain), Continuum (Denmark), Holcim Group (Switzerland), Alliant Energy Corporation (US), Plaswire Ltd. (Ireland), Goldwind (China), CHN Energy Investment Group (China), and Enel SpA (Italy). Contracts and deals were the key strategies adopted by these companies to strengthen their position in the wind blade recycling market.
What are the drivers and opportunities for the wind blade recycling market?
The rising number of decommissioned wind turbine blades and the ban on landfilling of wind blades by governments of various regions can be stated as drivers for wind blade recycling. The wind blade recycling market has an opportunity due to the growing number of wind blade turbine installations.
Which region is expected to hold the largest market share?
The European region holds the largest market share for wind blade recycling due to wind energy infrastructure, technological innovations, and stringent government regulations.
What is the projected growth rate of the wind blade recycling market over the next five years?
The wind blade recycling market is projected to grow at a CAGR of 40.3% over the next five years.
How is the wind blade recycling market aligned for future growth?
The market is growing at a considerable pace. Wind blade recycling is a competitive market, as many recycling companies are planning business strategies to expand their existing production capacities of wind blade recycling.


Personalize This Research

  • Triangulate with your Own Data
  • Get Data as per your Format and Definition
  • Gain a Deeper Dive on a Specific Application, Geography, Customer or Competitor
  • Any level of Personalization
Request A Free Customisation

Let Us Help You

  • What are the Known and Unknown Adjacencies Impacting the Wind Blade Recycling Market
  • What will your New Revenue Sources be?
  • Who will be your Top Customer; what will make them switch?
  • Defend your Market Share or Win Competitors
  • Get a Scorecard for Target Partners
Customized Workshop Request

Table of Contents

Exclusive indicates content/data unique to MarketsandMarkets and not available with any competitors.

TITLE
PAGE NO
INTRODUCTION
23
RESEARCH METHODOLOGY
27
EXECUTIVE SUMMARY
37
PREMIUM INSIGHTS
40
MARKET OVERVIEW
43
  • 5.1 INTRODUCTION
  • 5.2 MARKET DYNAMICS
    DRIVERS
    - Rising number of decommissioned blades
    - Ban on landfilling of wind blades by governments
    - Rising number of collaboration projects
    RESTRAINTS
    - High recycling cost compared to landfilling
    - Degradation of fiber properties during recycling
    OPPORTUNITIES
    - Growing installation of wind turbines globally
    - Development of recyclable resins
    - China’s wind industry to mature in coming years
    CHALLENGES
    - Challenges in recycling wind blades due to low TRL of recycling methods
    - Continued reliance on cement incineration and landfilling
  • 5.3 PORTER’S FIVE FORCES ANALYSIS
    THREAT OF NEW ENTRANTS
    THREAT OF SUBSTITUTES
    BARGAINING POWER OF SUPPLIERS
    BARGAINING POWER OF BUYERS
    INTENSITY OF COMPETITIVE RIVALRY
  • 5.4 KEY STAKEHOLDERS AND BUYING CRITERIA
    KEY STAKEHOLDERS IN BUYING PROCESS
    BUYING CRITERIA
  • 5.5 MACROECONOMIC OUTLOOK
    INTRODUCTION
    GDP TRENDS AND FORECAST
    TRENDS IN GLOBAL CONSTRUCTION INDUSTRY
    TRENDS IN GLOBAL AUTOMOTIVE INDUSTRY
    TRENDS IN GLOBAL APPLIANCES INDUSTRY
  • 5.6 SUPPLY CHAIN ANALYSIS
    RAW MATERIAL ANALYSIS
    RECYCLING METHOD ANALYSIS
    - Mechanical Recycling
    - Thermal Recycling
    - Chemical Recycling
    FINAL PRODUCT ANALYSIS
  • 5.7 VALUE CHAIN ANALYSIS
  • 5.8 ECOSYSTEM
  • 5.9 PRICING ANALYSIS
    AVERAGE SELLING PRICE TREND OF BLADE MATERIALS, BY KEY PLAYER
    AVERAGE SELLING PRICE TREND, BY BLADE MATERIAL
    AVERAGE SELLING PRICE TREND, BY RECYCLING METHOD
    AVERAGE SELLING PRICE TREND, BY END-USE INDUSTRY
    AVERAGE SELLING PRICE TREND, BY REGION
  • 5.10 TRADE ANALYSIS
    EXPORT SCENARIO FOR HS CODE 7019
    IMPORT SCENARIO FOR HS CODE 7019
    EXPORT SCENARIO FOR HS CODE 681511
    IMPORT SCENARIO FOR HS CODE 681511
  • 5.11 TECHNOLOGY ANALYSIS
    KEY TECHNOLOGIES
    - Grinding
    - Coprocessing
    - Pyrolysis
    - Solvolysis
    COMPLEMENTARY TECHNOLOGIES
    - Fluidized bed pyrolysis
  • 5.12 PATENT ANALYSIS
    INTRODUCTION
    METHODOLOGY
    DOCUMENT TYPES
    INSIGHTS
    LEGAL STATUS
    JURISDICTION ANALYSIS
    TOP APPLICANTS
  • 5.13 REGULATORY LANDSCAPE
    REGULATORY BODIES, GOVERNMENT AGENCIES, AND OTHER ORGANIZATIONS
  • 5.14 KEY CONFERENCES & EVENTS
  • 5.15 CASE STUDY ANALYSIS
    CASE STUDY 1: DECOMBLADES–CONSORTIUM FOR WIND BLADE RECYCLING
    CASE STUDY 2: CETEC INITIATIVE
    CASE STUDY 3: REWIND INITIATIVE
  • 5.16 TRENDS/DISRUPTIONS IMPACTING CUSTOMER BUSINESS
  • 5.17 INVESTMENT AND FUNDING SCENARIO
  • 5.18 IMPACT OF AI/GEN AI ON WIND BLADE RECYCLING MARKET
    TOP USE CASES AND MARKET POTENTIAL
    CASE STUDIES OF AI IMPLEMENTATION IN WIND BLADE RECYCLING MARKET
WIND BLADE RECYCLING MARKET, BY RECYCLING METHOD
83
  • 6.1 INTRODUCTION
  • 6.2 MECHANICAL RECYCLING
    COST-EFFECTIVENESS TO SUPPORT MARKET GROWTH
  • 6.3 CHEMICAL RECYCLING
    ABILITY TO RECOVER HIGH-QUALITY GLASS FROM DECOMMISSIONED WIND TURBINE BLADES TO PROPEL MARKET
  • 6.4 THERMAL RECYCLING
    HELPS IN RECOVERY OF HIGH-QUALITY GLASS AND CARBON FIBERS
WIND BLADE RECYCLING MARKET, BY BLADE MATERIAL
89
  • 7.1 INTRODUCTION
  • 7.2 GLASS FIBER
    PROVIDES NECESSARY STRENGTH AND STIFFNESS REQUIRED FOR BLADES
  • 7.3 CARBON FIBER
    RECYCLING CARBON FIBERS FROM DECOMMISSIONED WIND BLADES CAN REDUCE MATERIAL COSTS
WIND BLADE RECYCLING MARKET, BY END-USE INDUSTRY
94
  • 8.1 INTRODUCTION
  • 8.2 CONSTRUCTION
    TECHNOLOGICAL ADVANCEMENTS TO PROPEL MARKET GROWTH
  • 8.3 AUTOMOTIVE
    RISING DEMAND FOR LIGHTWEIGHT MATERIALS TO BOOST MARKET
  • 8.4 ELECTRONICS & CONSUMER GOODS
    INNOVATION IN ELECTRONICS & CONSUMER GOODS TO DRIVE MARKET
  • 8.5 OTHER END-USE INDUSTRIES
WIND BLADE RECYCLING MARKET, BY REGION
101
  • 9.1 INTRODUCTION
  • 9.2 NORTH AMERICA
    US
    - Government collaborations with recycling startups to boost market
    CANADA
    - Increasing adoption of circular economy principles to drive market
  • 9.3 EUROPE
    GERMANY
    - Ban on wind blade landfilling to drive market
    FRANCE
    - Aging wind turbine fleet to drive market
    UK
    - Growing initiatives for wind blade recycling to support market growth
    ITALY
    - Increasing number of decommissioned turbines to drive market
    SPAIN
    - Expanding research activities to fuel market growth
    DENMARK
    - Presence of key wind blade recycling companies to propel market
    REST OF EUROPE
  • 9.4 ASIA PACIFIC
    CHINA
    - Implementation of recycling standards by government to drive market
    JAPAN
    - Environmental regulations and technological advancements to propel market
    INDIA
    - Growing emphasis on clean energy and environmental sustainability to drive market
    SOUTH KOREA
    - Implementation of stringent environmental regulations to drive market
    AUSTRALIA
    - Rising demand for sustainable waste management to propel market
    REST OF ASIA PACIFIC
  • 9.5 MIDDLE EAST & AFRICA
    GCC COUNTRIES
    - UAE
    - Saudi Arabia
    - Rest of GCC Countries
    SOUTH AFRICA
    - Automotive industry to generate demand for recycled wind blade materials
    REST OF MIDDLE EAST & AFRICA
  • 9.6 LATIN AMERICA
    MEXICO
    - Expanding use of decommissioned wind blades to drive market
    BRAZIL
    - Growing demand for renewable energy sources to drive market
    REST OF LATIN AMERICA
COMPETITIVE LANDSCAPE
146
  • 10.1 OVERVIEW
  • 10.2 KEY PLAYER STRATEGIES/RIGHT TO WIN
    STRATEGIES ADOPTED BY WIND BLADE RECYCLING SERVICE PROVIDERS
  • 10.3 REVENUE ANALYSIS
  • 10.4 MARKET SHARE ANALYSIS
  • 10.5 BRAND/SERVICE COMPARISON
    BRAND/SERVICE COMPARISON, BY WIND BLADE RECYCLING PRODUCT
    STENA RECYCLING
    REGEN FIBER
    GEOCYCLE
    ENERGYLOOP
  • 10.6 COMPANY EVALUATION MATRIX: KEY PLAYERS, 2023
    STARS
    EMERGING LEADERS
    PERVASIVE PLAYERS
    PARTICIPANTS
    COMPANY FOOTPRINT: KEY PLAYERS, 2023
    - Company footprint
    - Recycling method footprint
    - Blade material footprint
    - End-use industry footprint
    - Region footprint
  • 10.7 COMPANY EVALUATION MATRIX: STARTUPS/SMES, 2023
    PROGRESSIVE COMPANIES
    RESPONSIVE COMPANIES
    DYNAMIC COMPANIES
    STARTING BLOCKS
    COMPETITIVE BENCHMARKING OF KEY STARTUPS/SMES, 2023
    - Detailed list of key startups/SMEs
    - Competitive benchmarking of key startups/SMEs
  • 10.8 COMPANY VALUATION AND FINANCIAL METRICS OF WIND BLADE RECYCLING SERVICE PROVIDERS
  • 10.9 COMPETITIVE SCENARIO
    DEALS
    EXPANSIONS
    OTHER DEVELOPMENTS
COMPANY PROFILES
166
  • 11.1 KEY PLAYERS
    VEOLIA
    - Business overview
    - Services offered
    - Recent developments
    - MnM view
    ACCIONA
    - Business overview
    - Services offered
    - Recent developments
    - MnM view
    STENA METALL AB
    - Business overview
    - Services offered
    - Recent developments
    - MnM view
    VESTAS
    - Business overview
    - Services offered
    - Recent developments
    - MnM view
    IBERDROLA, S.A.
    - Business overview
    - Services offered
    - Recent developments
    - MnM view
    MAKEEN ENERGY
    - Business overview
    - Services offered
    - Recent developments
    - MnM view
    KUUSAKOSKI OY
    - Business overview
    - Services offered
    - Recent developments
    - MnM view
    RENERCYCLE
    - Business overview
    - Services offered
    - Recent developments
    - MnM view
    CONTINUUM
    - Business overview
    - Services offered
    - Recent developments
    - MnM view
    HOLCIM GROUP
    - Business overview
    - Services offered
    - Recent developments
    - MnM view
    ALLIANT ENERGY CORPORATION
    - Business overview
    - Services offered
    - Recent developments
    - MnM view
    PLASWIRE LTD
    - Business overview
    - Services offered
    - Recent developments
    - MnM view
    GOLDWIND
    - Business overview
    - Services offered
    - MnM view
    CHN ENERGY INVESTMENT GROUP CO., LTD
    - Business overview
    - Services offered
    - MnM view
    ENEL SPA
    - Business overview
    - Services offered
    - MnM view
  • 11.2 OTHER PLAYERS
    GJENKRAFT AS
    GLOBAL FIBERGLASS SOLUTIONS
    WIND POWER SOLUTIONS, LLC
    REFIBER APS
    KINGO WIND
    CARBON RIVERS
    EURECUM GMBH & CO. KG
    REVIABLENERGY
    EDF GROUP
    NEOWA GMBH
APPENDIX
212
  • 12.1 DISCUSSION GUIDE
  • 12.2 KNOWLEDGESTORE: MARKETSANDMARKETS’ SUBSCRIPTION PORTAL
  • 12.3 CUSTOMIZATION OPTIONS
  • 12.4 RELATED REPORTS
  • 12.5 AUTHOR DETAILS
LIST OF TABLES
 
  • TABLE 1 ONSHORE WIND OUTLOOK FOR NEW INSTALLATIONS (GW)
  • TABLE 2 WIND BLADE RECYCLING MARKET: PORTER’S FIVE FORCES ANALYSIS
  • TABLE 3 INFLUENCE OF STAKEHOLDERS ON BUYING PROCESS FOR TOP THREE END-USE INDUSTRIES
  • TABLE 4 KEY BUYING CRITERIA FOR TOP THREE END-USE INDUSTRIES
  • TABLE 5 GDP PERCENTAGE (%) CHANGE, BY KEY COUNTRY, 2021–2029
  • TABLE 6 TRENDS OF GLOBAL AUTOMOTIVE INDUSTRY
  • TABLE 7 WIND BLADE RECYCLING MARKET: ROLE OF COMPANIES IN ECOSYSTEM
  • TABLE 8 AVERAGE SELLING PRICE TREND OF WIND BLADE RECYCLED MATERIALS, BY REGION
  • TABLE 9 TOP 10 EXPORTING COUNTRIES OF GLASS FIBERS IN 2023
  • TABLE 10 TOP 10 IMPORTING COUNTRIES OF GLASS FIBERS IN 2023
  • TABLE 11 TOP 10 EXPORTING COUNTRIES OF CARBON FIBERS IN 2023
  • TABLE 12 TOP 10 IMPORTING COUNTRIES OF CARBON FIBERS IN 2023
  • TABLE 13 WIND BLADE RECYCLING MARKET: TOTAL NUMBER OF PATENTS
  • TABLE 14 LIST OF PATENTS BY XI’AN THERMAL POWER RESEARCH INSTITUTE CO., LTD.
  • TABLE 15 LIST OF PATENTS BY JILIN CHONGTONG CHENGFEI NEW MATERIAL CO., LTD.
  • TABLE 16 LIST OF PATENTS BY HUANENG FUXIN WIND POWER GENERATION CO., LTD.
  • TABLE 17 NORTH AMERICA: REGULATORY BODIES, GOVERNMENT AGENCIES, AND OTHER ORGANIZATIONS
  • TABLE 18 EUROPE: REGULATORY BODIES, GOVERNMENT AGENCIES, AND OTHER ORGANIZATIONS
  • TABLE 19 ASIA PACIFIC: REGULATORY BODIES, GOVERNMENT AGENCIES, AND OTHER ORGANIZATIONS
  • TABLE 20 REST OF THE WORLD: REGULATORY BODIES, GOVERNMENT AGENCIES, AND OTHER ORGANIZATIONS
  • TABLE 21 WIND BLADE RECYCLING MARKET: DETAILED LIST OF CONFERENCES & EVENTS, 2024–2025
  • TABLE 22 TOP USE CASES AND MARKET POTENTIAL
  • TABLE 23 CASE STUDIES OF GEN AI IMPLEMENTATION IN WIND BLADE RECYCLING MARKET
  • TABLE 24 WIND BLADE RECYCLING MARKET, BY RECYCLING METHOD, 2022–2029 (USD THOUSAND)
  • TABLE 25 WIND BLADE RECYCLING MARKET, BY RECYCLING METHOD, 2022–2029 (TON)
  • TABLE 26 MECHANICAL RECYCLING: WIND BLADE RECYCLING MARKET, BY REGION, 2022–2029 (USD THOUSAND)
  • TABLE 27 MECHANICAL RECYCLING: WIND BLADE RECYCLING MARKET, BY REGION, 2022–2029 (TON)
  • TABLE 28 CHEMICAL RECYCLING: WIND BLADE RECYCLING MARKET, BY REGION, 2022–2029 (USD THOUSAND)
  • TABLE 29 CHEMICAL RECYCLING: WIND BLADE RECYCLING MARKET, BY REGION, 2022–2029 (TON)
  • TABLE 30 THERMAL RECYCLING: WIND BLADE RECYCLING MARKET, BY REGION, 2022–2029 (USD THOUSAND)
  • TABLE 31 THERMAL RECYCLING: WIND BLADE RECYCLING MARKET, BY REGION, 2022–2029 (TON)
  • TABLE 32 WIND BLADE RECYCLING MARKET, BY BLADE MATERIAL, 2022–2029 (USD THOUSAND)
  • TABLE 33 WIND BLADE RECYCLING MARKET, BY BLADE MATERIAL, 2022–2029 (TON)
  • TABLE 34 GLASS FIBER: WIND BLADE RECYCLING MARKET, BY REGION, 2022–2029 (USD THOUSAND)
  • TABLE 35 GLASS FIBER: WIND BLADE RECYCLING MARKET, BY REGION, 2022–2029 (TON)
  • TABLE 36 CARBON FIBER: WIND BLADE RECYCLING MARKET, BY REGION, 2022–2029 (USD THOUSAND)
  • TABLE 37 CARBON FIBER: WIND BLADE RECYCLING MARKET, BY REGION, 2022–2029 (TON)
  • TABLE 38 WIND BLADE RECYCLING MARKET, BY END-USE-INDUSTRY, 2022–2029 (USD THOUSAND)
  • TABLE 39 WIND BLADE RECYCLING MARKET, BY END-USE-INDUSTRY, 2022–2029 (TON)
  • TABLE 40 CONSTRUCTION: WIND BLADE RECYCLING MARKET, BY REGION, 2022–2029 (USD THOUSAND)
  • TABLE 41 CONSTRUCTION: WIND BLADE RECYCLING MARKET, BY REGION, 2022–2029 (TON)
  • TABLE 42 AUTOMOTIVE: WIND BLADE RECYCLING MARKET, BY REGION, 2022–2029 (USD THOUSAND)
  • TABLE 43 AUTOMOTIVE: WIND BLADE RECYCLING MARKET, BY REGION, 2022–2029 (TON)
  • TABLE 44 ELECTRONICS & CONSUMER GOODS: WIND BLADE RECYCLING MARKET, BY REGION, 2022–2029 (USD THOUSAND)
  • TABLE 45 ELECTRONICS & CONSUMER GOODS: WIND BLADE RECYCLING MARKET, BY REGION, 2022–2029 (TON)
  • TABLE 46 OTHER END-USE INDUSTRIES: WIND BLADE RECYCLING MARKET, BY REGION, 2022–2029 (USD THOUSAND)
  • TABLE 47 OTHER END-USE INDUSTRIES: WIND BLADE RECYCLING MARKET, BY REGION, 2022–2029 (TON)
  • TABLE 48 WIND BLADE RECYCLING MARKET, BY REGION, 2022–2029 (USD THOUSAND)
  • TABLE 49 WIND BLADE RECYCLING MARKET, BY REGION, 2022–2029 (TON)
  • TABLE 50 NORTH AMERICA: WIND BLADE RECYCLING MARKET, BY COUNTRY, 2022–2029 (USD THOUSAND)
  • TABLE 51 NORTH AMERICA: WIND BLADE RECYCLING MARKET, BY COUNTRY, 2022–2029 (TON)
  • TABLE 52 NORTH AMERICA: WIND BLADE RECYCLING MARKET, BY BLADE MATERIAL, 2022–2029 (USD THOUSAND)
  • TABLE 53 NORTH AMERICA: WIND BLADE RECYCLING MARKET, BY BLADE MATERIAL, 2022–2029 (TON)
  • TABLE 54 NORTH AMERICA: WIND BLADE RECYCLING MARKET, BY RECYCLING METHOD, 2022–2029 (USD THOUSAND)
  • TABLE 55 NORTH AMERICA: WIND BLADE RECYCLING MARKET, BY RECYCLING METHOD, 2022–2029 (TON)
  • TABLE 56 NORTH AMERICA: WIND BLADE RECYCLING MARKET, BY END-USE INDUSTRY, 2022–2029 (USD THOUSAND)
  • TABLE 57 NORTH AMERICA: WIND BLADE RECYCLING MARKET, BY END-USE INDUSTRY, 2022–2029 (TON)
  • TABLE 58 US: WIND BLADE RECYCLING MARKET, BY END-USE INDUSTRY, 2022–2029 (USD THOUSAND)
  • TABLE 59 US: WIND BLADE RECYCLING MARKET, BY END-USE INDUSTRY, 2022–2029 (TON)
  • TABLE 60 CANADA: WIND BLADE RECYCLING MARKET, BY END-USE INDUSTRY, 2022–2029 (USD THOUSAND)
  • TABLE 61 CANADA: WIND BLADE RECYCLING MARKET, BY END-USE INDUSTRY, 2022–2029 (TON)
  • TABLE 62 EUROPE: WIND BLADE RECYCLING MARKET, BY COUNTRY, 2022–2029 (USD THOUSAND)
  • TABLE 63 EUROPE: WIND BLADE RECYCLING MARKET, BY COUNTRY, 2022–2029 (TON)
  • TABLE 64 EUROPE: WIND BLADE RECYCLING MARKET, BY BLADE MATERIAL, 2022–2029 (USD THOUSAND)
  • TABLE 65 EUROPE: WIND BLADE RECYCLING MARKET, BY BLADE MATERIAL, 2022–2029 (TON)
  • TABLE 66 EUROPE: WIND BLADE RECYCLING MARKET, BY RECYCLING METHOD, 2022–2029 (USD THOUSAND)
  • TABLE 67 EUROPE: WIND BLADE RECYCLING MARKET, BY RECYCLING METHOD, 2022–2029 (TON)
  • TABLE 68 EUROPE: WIND BLADE RECYCLING MARKET, BY END-USE INDUSTRY, 2022–2029 (USD THOUSAND)
  • TABLE 69 EUROPE: WIND BLADE RECYCLING MARKET, BY END-USE INDUSTRY, 2022–2029 (TON)
  • TABLE 70 GERMANY: WIND BLADE RECYCLING MARKET, BY END-USE INDUSTRY, 2022–2029 (USD THOUSAND)
  • TABLE 71 GERMANY: WIND BLADE RECYCLING MARKET, BY END-USE INDUSTRY, 2022–2029 (TON)
  • TABLE 72 FRANCE: WIND BLADE RECYCLING MARKET, BY END-USE INDUSTRY, 2022–2029 (USD THOUSAND)
  • TABLE 73 FRANCE: WIND BLADE RECYCLING MARKET, BY END-USE INDUSTRY, 2022–2029 (TON)
  • TABLE 74 UK: WIND BLADE RECYCLING MARKET, BY END-USE INDUSTRY, 2022–2029 (USD THOUSAND)
  • TABLE 75 UK: WIND BLADE RECYCLING MARKET, BY END-USE INDUSTRY, 2022–2029 (TON)
  • TABLE 76 ITALY: WIND BLADE RECYCLING MARKET, BY END-USE INDUSTRY, 2022–2029 (USD THOUSAND)
  • TABLE 77 ITALY: WIND BLADE RECYCLING MARKET, BY END-USE INDUSTRY, 2022–2029 (TON)
  • TABLE 78 SPAIN: WIND BLADE RECYCLING MARKET, BY END-USE INDUSTRY, 2022–2029 (USD THOUSAND)
  • TABLE 79 SPAIN: WIND BLADE RECYCLING MARKET, BY END-USE INDUSTRY, 2022–2029 (TON)
  • TABLE 80 DENMARK: WIND BLADE RECYCLING MARKET, BY END-USE INDUSTRY, 2022–2029 (USD THOUSAND)
  • TABLE 81 DENMARK: WIND BLADE RECYCLING MARKET, BY END-USE INDUSTRY, 2022–2029 (TON)
  • TABLE 82 REST OF EUROPE: WIND BLADE RECYCLING MARKET, BY END-USE INDUSTRY, 2022–2029 (USD THOUSAND)
  • TABLE 83 REST OF EUROPE: WIND BLADE RECYCLING MARKET, BY END-USE INDUSTRY, 2022–2029 (TON)
  • TABLE 84 ASIA PACIFIC: WIND BLADE RECYCLING MARKET, BY COUNTRY, 2022–2029 (USD THOUSAND)
  • TABLE 85 ASIA PACIFIC: WIND BLADE RECYCLING MARKET, BY COUNTRY, 2022–2029 (TON)
  • TABLE 86 ASIA PACIFIC: WIND BLADE RECYCLING MARKET, BY BLADE MATERIAL, 2022–2029 (USD THOUSAND)
  • TABLE 87 ASIA PACIFIC: WIND BLADE RECYCLING MARKET, BY BLADE MATERIAL, 2022–2029 (TON)
  • TABLE 88 ASIA PACIFIC: WIND BLADE RECYCLING MARKET, BY RECYCLING METHOD, 2022–2029 (USD THOUSAND)
  • TABLE 89 ASIA PACIFIC: WIND BLADE RECYCLING MARKET, BY RECYCLING METHOD, 2022–2029 (TON)
  • TABLE 90 ASIA PACIFIC: WIND BLADE RECYCLING MARKET, BY END-USE INDUSTRY, 2022–2029 (USD THOUSAND)
  • TABLE 91 ASIA PACIFIC: WIND BLADE RECYCLING MARKET, BY END-USE INDUSTRY, 2022–2029 (TON)
  • TABLE 92 CHINA: WIND BLADE RECYCLING MARKET, BY END-USE INDUSTRY, 2022–2029 (USD THOUSAND)
  • TABLE 93 CHINA: WIND BLADE RECYCLING MARKET, BY END-USE INDUSTRY, 2022–2029 (TON)
  • TABLE 94 JAPAN: WIND BLADE RECYCLING MARKET, BY END-USE INDUSTRY, 2022–2029 (USD THOUSAND)
  • TABLE 95 JAPAN: WIND BLADE RECYCLING MARKET, BY END-USE INDUSTRY, 2022–2029 (TON)
  • TABLE 96 INDIA: WIND BLADE RECYCLING MARKET, BY END-USE INDUSTRY, 2022–2029 (USD THOUSAND)
  • TABLE 97 INDIA: WIND BLADE RECYCLING MARKET, BY END-USE INDUSTRY, 2022–2029 (TON)
  • TABLE 98 SOUTH KOREA: WIND BLADE RECYCLING MARKET, BY END-USE INDUSTRY, 2022–2029 (USD THOUSAND)
  • TABLE 99 SOUTH KOREA: WIND BLADE RECYCLING MARKET, BY END-USE INDUSTRY, 2022–2029 (TON)
  • TABLE 100 AUSTRALIA: WIND BLADE RECYCLING MARKET, BY END-USE INDUSTRY, 2022–2029 (USD THOUSAND)
  • TABLE 101 AUSTRALIA: WIND BLADE RECYCLING MARKET, BY END-USE INDUSTRY, 2022–2029 (TON)
  • TABLE 102 REST OF ASIA PACIFIC: WIND BLADE RECYCLING MARKET, BY END-USE INDUSTRY, 2022–2029 (USD THOUSAND)
  • TABLE 103 REST OF ASIA PACIFIC: WIND BLADE RECYCLING MARKET, BY END-USE INDUSTRY, 2022–2029 (TON)
  • TABLE 104 MIDDLE EAST & AFRICA: WIND BLADE RECYCLING MARKET, BY COUNTRY, 2022–2029 (USD THOUSAND)
  • TABLE 105 MIDDLE EAST & AFRICA: WIND BLADE RECYCLING MARKET, BY COUNTRY, 2022–2029 (TON)
  • TABLE 106 MIDDLE EAST & AFRICA: WIND BLADE RECYCLING MARKET, BY BLADE MATERIAL, 2022–2029 (USD THOUSAND)
  • TABLE 107 MIDDLE EAST & AFRICA: WIND BLADE RECYCLING MARKET, BY BLADE MATERIAL, 2022–2029 (TON)
  • TABLE 108 MIDDLE EAST & AFRICA: WIND BLADE RECYCLING MARKET, BY RECYCLING METHOD, 2022–2029 (USD THOUSAND)
  • TABLE 109 MIDDLE EAST & AFRICA: WIND BLADE RECYCLING MARKET, BY RECYCLING METHOD, 2022–2029 (TON)
  • TABLE 110 MIDDLE EAST & AFRICA: WIND BLADE RECYCLING MARKET, BY END-USE INDUSTRY, 2022–2029 (USD THOUSAND)
  • TABLE 111 MIDDLE EAST & AFRICA: WIND BLADE RECYCLING MARKET, BY END-USE INDUSTRY, 2022–2029 (TON)
  • TABLE 112 UAE: WIND BLADE RECYCLING MARKET, BY END-USE INDUSTRY, 2022–2029 (USD THOUSAND)
  • TABLE 113 UAE: WIND BLADE RECYCLING MARKET, BY END-USE INDUSTRY, 2022–2029 (TON)
  • TABLE 114 SAUDI ARABIA: WIND BLADE RECYCLING MARKET, BY END-USE INDUSTRY, 2022–2029 (USD THOUSAND)
  • TABLE 115 SAUDI ARABIA: WIND BLADE RECYCLING MARKET, BY END-USE INDUSTRY, 2022–2029 (TON)
  • TABLE 116 REST OF GCC COUNTRIES: WIND BLADE RECYCLING MARKET, BY END-USE INDUSTRY, 2022–2029 (USD THOUSAND)
  • TABLE 117 REST OF GCC COUNTRIES: WIND BLADE RECYCLING MARKET, BY END-USE INDUSTRY, 2022–2029 (TON)
  • TABLE 118 SOUTH AFRICA: WIND BLADE RECYCLING MARKET, BY END-USE INDUSTRY, 2022–2029 (USD THOUSAND)
  • TABLE 119 SOUTH AFRICA: WIND BLADE RECYCLING MARKET, BY END-USE INDUSTRY, 2022–2029 (TON)
  • TABLE 120 REST OF MIDDLE EAST & AFRICA: WIND BLADE RECYCLING MARKET, BY END-USE INDUSTRY, 2022–2029 (USD THOUSAND)
  • TABLE 121 REST OF MIDDLE EAST & AFRICA: WIND BLADE RECYCLING MARKET, BY END-USE INDUSTRY, 2022–2029 (TON)
  • TABLE 122 LATIN AMERICA: WIND BLADE RECYCLING MARKET, BY COUNTRY, 2022–2029 (USD THOUSAND)
  • TABLE 123 LATIN AMERICA: WIND BLADE RECYCLING MARKET, BY COUNTRY, 2022–2029 (TON)
  • TABLE 124 LATIN AMERICA: WIND BLADE RECYCLING MARKET, BY BLADE MATERIAL, 2022–2029 (USD THOUSAND)
  • TABLE 125 LATIN AMERICA: WIND BLADE RECYCLING MARKET, BY BLADE MATERIAL, 2022–2029 (TON)
  • TABLE 126 LATIN AMERICA: WIND BLADE RECYCLING MARKET, BY RECYCLING METHOD, 2022–2029 (USD THOUSAND)
  • TABLE 127 LATIN AMERICA: WIND BLADE RECYCLING MARKET, BY RECYCLING METHOD, 2022–2029 (TON)
  • TABLE 128 LATIN AMERICA: WIND BLADE RECYCLING MARKET, BY END-USE INDUSTRY, 2022–2029 (USD THOUSAND)
  • TABLE 129 LATIN AMERICA: WIND BLADE RECYCLING MARKET, BY END-USE INDUSTRY, 2022–2029 (TONS)
  • TABLE 130 MEXICO: WIND BLADE RECYCLING MARKET, BY END-USE INDUSTRY, 2022–2029 (USD THOUSAND)
  • TABLE 131 MEXICO: WIND BLADE RECYCLING MARKET, BY END-USE INDUSTRY, 2022–2029 (TON)
  • TABLE 132 BRAZIL: WIND BLADE RECYCLING MARKET, BY END-USE INDUSTRY, 2022–2029 (USD THOUSAND)
  • TABLE 133 BRAZIL: WIND BLADE RECYCLING MARKET, BY END-USE INDUSTRY, 2022–2029 (TON)
  • TABLE 134 REST OF LATIN AMERICA: WIND BLADE RECYCLING MARKET, BY END-USE INDUSTRY, 2022–2029 (USD THOUSAND)
  • TABLE 135 REST OF LATIN AMERICA: WIND BLADE RECYCLING MARKET, BY END-USE INDUSTRY, 2022–2029 (TON)
  • TABLE 136 WIND BLADE RECYCLING MARKET: DEGREE OF COMPETITION, 2023
  • TABLE 137 WIND BLADE RECYCLING MARKET: RECYCLING METHOD FOOTPRINT
  • TABLE 138 WIND BLADE RECYCLING MARKET: BLADE MATERIAL FOOTPRINT
  • TABLE 139 WIND BLADE RECYCLING MARKET: END-USE INDUSTRY FOOTPRINT
  • TABLE 140 WIND BLADE RECYCLING MARKET: REGION FOOTPRINT
  • TABLE 141 WIND BLADE RECYCLING MARKET: DETAILED LIST OF KEY STARTUPS/SMES
  • TABLE 142 WIND BLADE RECYCLING MARKET: COMPETITIVE BENCHMARKING OF KEY STARTUPS/SMES
  • TABLE 143 WIND BLADE RECYCLING MARKET: DEALS, JANUARY 2019−SEPTEMBER 2024
  • TABLE 144 WIND BLADE RECYCLING MARKET: EXPANSIONS, JANUARY 2019−SEPTEMBER 2024
  • TABLE 145 WIND BLADE RECYCLING MARKET: OTHER DEVELOPMENTS, JANUARY 2019−SEPTEMBER 2024
  • TABLE 146 VEOLIA: COMPANY OVERVIEW
  • TABLE 147 VEOLIA: SERVICES OFFERED
  • TABLE 148 VEOLIA: DEALS, JANUARY 2019−SEPTEMBER 2024
  • TABLE 149 ACCIONA: COMPANY OVERVIEW
  • TABLE 150 ACCIONA: SERVICES OFFERED
  • TABLE 151 ACCIONA: EXPANSIONS, JANUARY 2019–SEPTEMBER 2024
  • TABLE 152 STENA METALL AB: COMPANY OVERVIEW
  • TABLE 153 STENA METALL AB: SERVICES OFFERED
  • TABLE 154 STENA METALL AB: DEALS, JANUARY 2019−SEPTEMBER 2024
  • TABLE 155 VESTAS: COMPANY OVERVIEW
  • TABLE 156 VESTAS: SERVICES OFFERED
  • TABLE 157 VESTAS: DEALS, JANUARY 2019−SEPTEMBER 2024
  • TABLE 158 VESTAS: OTHER DEVELOPMENTS, JANUARY 2019–SEPTEMBER 2024
  • TABLE 159 IBERDROLA, S.A.: COMPANY OVERVIEW
  • TABLE 160 IBERDROLA, S.A.: SERVICES OFFERED
  • TABLE 161 IBERDROLA, S.A.: DEALS, JANUARY 2019−SEPTEMBER 2024
  • TABLE 162 MAKEEN ENERGY: COMPANY OVERVIEW
  • TABLE 163 MAKEEN ENERGY: SERVICES OFFERED
  • TABLE 164 MAKEEN ENERGY: DEALS, JANUARY 2019−SEPTEMBER 2024
  • TABLE 165 KUUSAKOSKI OY: COMPANY OVERVIEW
  • TABLE 166 KUUSAKOSKI OY: SERVICES OFFERED
  • TABLE 167 KUUSAKOSKI OY: DEALS, JANUARY 2019−SEPTEMBER 2024
  • TABLE 168 RENERCYCLE: COMPANY OVERVIEW
  • TABLE 169 RENERCYCLE: SERVICES OFFERED
  • TABLE 170 RENERCYCLE: EXPANSIONS, JANUARY 2019−SEPTEMBER 2024
  • TABLE 171 CONTINUUM: COMPANY OVERVIEW
  • TABLE 172 CONTINUUM: SERVICES OFFERED
  • TABLE 173 CONTINUUM: EXPANSIONS, JANUARY 2019−SEPTEMBER 2024
  • TABLE 174 HOLCIM GROUP: COMPANY OVERVIEW
  • TABLE 175 HOLCIM GROUP: SERVICES OFFERED
  • TABLE 176 HOLCIM GROUP: DEALS, JANUARY 2019−SEPTEMBER 2024
  • TABLE 177 ALLIANT ENERGY CORPORATION: COMPANY OVERVIEW
  • TABLE 178 ALLIANT ENERGY CORPORATION: SERVICES OFFERED
  • TABLE 179 ALLIANT ENERGY CORPORATION: OTHER DEVELOPMENTS, JANUARY 2019–SEPTEMBER 2024
  • TABLE 180 PLASWIRE LTD: COMPANY OVERVIEW
  • TABLE 181 PLASWIRE LTD: SERVICES OFFERED
  • TABLE 182 PLASWIRE LTD: DEALS, JANUARY 2019−SEPTEMBER 2024
  • TABLE 183 GOLDWIND: COMPANY OVERVIEW
  • TABLE 184 GOLDWIND: SERVICES OFFERED
  • TABLE 185 CHN ENERGY INVESTMENT GROUP CO., LTD: COMPANY OVERVIEW
  • TABLE 186 CHN ENERGY INVESTMENT GROUP CO., LTD: SERVICES OFFERED
  • TABLE 187 ENEL SPA: COMPANY OVERVIEW
  • TABLE 188 ENEL SPA: SERVICES OFFERED
  • TABLE 189 GJENKRAFT AS: COMPANY OVERVIEW
  • TABLE 190 GLOBAL FIBERGLASS SOLUTIONS: COMPANY OVERVIEW
  • TABLE 191 WIND POWER SOLUTIONS, LLC: COMPANY OVERVIEW
  • TABLE 192 REFIBER APS: COMPANY OVERVIEW
  • TABLE 193 KINGO WIND: COMPANY OVERVIEW
  • TABLE 194 CARBON RIVERS: COMPANY OVERVIEW
  • TABLE 195 EURECUM GMBH & CO. KG: COMPANY OVERVIEW
  • TABLE 196 REVIABLENERGY: COMPANY OVERVIEW
  • TABLE 197 EDF GROUP: COMPANY OVERVIEW
  • TABLE 198 NEOWA GMBH: COMPANY OVERVIEW
LIST OF FIGURES
 
  • FIGURE 1 WIND BLADE RECYCLING MARKET SEGMENTATION
  • FIGURE 2 WIND BLADE RECYCLING MARKET: RESEARCH DESIGN
  • FIGURE 3 WIND BLADE RECYCLING MARKET: BOTTOM-UP APPROACH
  • FIGURE 4 WIND BLADE RECYCLING MARKET: TOP-DOWN APPROACH
  • FIGURE 5 WIND BLADE RECYCLING MARKET: DATA TRIANGULATION
  • FIGURE 6 CARBON FIBER SEGMENT ACCOUNTED FOR LARGEST MARKET SHARE IN 2023
  • FIGURE 7 MECHANICAL RECYCLING SEGMENT ACCOUNTED FOR LARGEST MARKET SHARE IN 2023
  • FIGURE 8 CONSTRUCTION INDUSTRY SEGMENT TO DOMINATE MARKET DURING FORECAST PERIOD
  • FIGURE 9 ASIA PACIFIC TO REGISTER HIGHEST GROWTH DURING FORECAST PERIOD
  • FIGURE 10 GROWING NUMBER OF DECOMMISSIONED WIND TURBINES TO DRIVE MARKET
  • FIGURE 11 CONSTRUCTION SEGMENT ACCOUNTED FOR LARGEST MARKET SHARE IN 2023
  • FIGURE 12 GLASS FIBER SEGMENT DOMINATED MARKET IN 2023
  • FIGURE 13 MECHANICAL RECYCLING SEGMENT DOMINATED MARKET IN 2023
  • FIGURE 14 CHINA TO REGISTER HIGHEST GROWTH DURING FORECAST PERIOD
  • FIGURE 15 WIND BLADE RECYCLING MARKET: DRIVES, RESTRAINTS, OPPORTUNITIES, AND CHALLENGES
  • FIGURE 16 WIND BLADE RECYCLING MARKET: PORTER’S FIVE FORCES ANALYSIS
  • FIGURE 17 INFLUENCE OF STAKEHOLDERS ON BUYING PROCESS FOR TOP THREE END-USE INDUSTRIES
  • FIGURE 18 KEY BUYING CRITERIA FOR TOP THREE END-USE INDUSTRIES
  • FIGURE 19 WIND BLADE RECYCLING MARKET: SUPPLY CHAIN ANALYSIS
  • FIGURE 20 WIND BLADE RECYCLING MARKET: VALUE CHAIN ANALYSIS
  • FIGURE 21 WIND BLADE RECYCLING MARKET: KEY STAKEHOLDERS IN ECOSYSTEM
  • FIGURE 22 WIND BLADE RECYCLING MARKET: ECOSYSTEM
  • FIGURE 23 AVERAGE SELLING PRICE TREND OF BLADE MATERIALS, BY KEY PLAYER, 2023
  • FIGURE 24 AVERAGE SELLING PRICE OF WIND BLADE RECYCLING MATERIALS (USD/KG), 2023
  • FIGURE 25 AVERAGE SELLING PRICE OF WIND BLADE RECYCLING METHODS (USD/KG), 2023
  • FIGURE 26 AVERAGE SELLING PRICE OF WIND BLADE RECYCLING, BY END-USE INDUSTRY (USD/KG), 2023
  • FIGURE 27 EXPORT OF GLASS FIBERS, BY KEY COUNTRY, 2020–2023 (USD THOUSAND)
  • FIGURE 28 IMPORT OF GLASS FIBERS, BY KEY COUNTRY, 2020–2023 (USD THOUSAND)
  • FIGURE 29 PATENT ANALYSIS, BY DOCUMENT TYPE
  • FIGURE 30 PATENT PUBLICATION TRENDS, 2014−2024
  • FIGURE 31 WIND BLADE RECYCLING MARKET: LEGAL STATUS OF PATENTS
  • FIGURE 32 CHINESE JURISDICTION REGISTERED HIGHEST NUMBER OF PATENTS BETWEEN 2014 AND 2024
  • FIGURE 33 XI’AN THERMAL POWER RESEARCH INSTITUTE CO., LTD. REGISTERED HIGHEST NUMBER OF PATENTS
  • FIGURE 34 WIND BLADE RECYCLING MARKET: TRENDS/DISRUPTIONS IMPACTING CUSTOMER BUSINESS
  • FIGURE 35 INVESTMENT AND FUNDING SCENARIO IN WIND BLADE RECYCLING MARKET, 2020–2024
  • FIGURE 36 PROMINENT WIND BLADE RECYCLING MANUFACTURING FIRMS IN 2024 (USD BILLION)
  • FIGURE 37 THERMAL RECYCLING SEGMENT TO REGISTER HIGHEST GROWTH DURING FORECAST PERIOD
  • FIGURE 38 CARBON FIBER TO DOMINATE WIND BLADE RECYCLING MARKET DURING FORECAST PERIOD
  • FIGURE 39 EUROPE TO DOMINATE GLASS FIBER MATERIAL MARKET DURING FORECAST PERIOD
  • FIGURE 40 CONSTRUCTION INDUSTRY TO DOMINATE WIND BLADE RECYCLING MARKET DURING FORECAST PERIOD
  • FIGURE 41 GERMANY TO REGISTER HIGHEST GROWTH DURING FORECAST PERIOD
  • FIGURE 42 NORTH AMERICA: WIND BLADE RECYCLING MARKET SNAPSHOT
  • FIGURE 43 EUROPE: WIND BLADE RECYCLING MARKET SNAPSHOT
  • FIGURE 44 ASIA PACIFIC: WIND BLADE RECYCLING MARKET SNAPSHOT
  • FIGURE 45 WIND BLADE RECYCLING MARKET: REVENUE ANALYSIS OF TOP FIVE MARKET PLAYERS, 2019–2023 (USD MILLION)
  • FIGURE 46 SHARES OF TOP COMPANIES IN WIND BLADE RECYCLING MARKET, 2023
  • FIGURE 47 WIND BLADE RECYCLING MARKET: TOP TRENDING BRAND/SERVICE
  • FIGURE 48 WIND BLADE RECYCLING MARKET: BRAND/SERVICE COMPARISON
  • FIGURE 49 WIND BLADE RECYCLING MARKET: COMPANY EVALUATION MATRIX (KEY PLAYERS), 2023
  • FIGURE 50 WIND BLADE RECYCLING MARKET: COMPANY FOOTPRINT
  • FIGURE 51 WIND BLADE RECYCLING MARKET: COMPANY EVALUATION MATRIX (STARTUPS/SMES), 2023
  • FIGURE 52 ENTERPRISE VALUE/EBITDA OF KEY WIND BLADE RECYCLING SERVICE PROVIDERS
  • FIGURE 53 YEAR-TO-DATE (YTD) PRICE TOTAL RETURN AND FIVE-YEAR STOCK BETA OF KEY SERVICE PROVIDERS
  • FIGURE 54 VEOLIA: COMPANY SNAPSHOT
  • FIGURE 55 ACCIONA: COMPANY SNAPSHOT
  • FIGURE 56 STENA METALL AB: COMPANY SNAPSHOT
  • FIGURE 57 VESTAS: COMPANY SNAPSHOT
  • FIGURE 58 IBERDROLA, S.A.: COMPANY SNAPSHOT
  • FIGURE 59 KUUSAKOSKI OY: COMPANY SNAPSHOT
  • FIGURE 60 HOLCIM GROUP: COMPANY SNAPSHOT
  • FIGURE 61 ALLIANT ENERGY CORPORATION: COMPANY SNAPSHOT
  • FIGURE 62 GOLDWIND: COMPANY SNAPSHOT
  • FIGURE 63 CHN ENERGY INVESTMENT GROUP CO., LTD: COMPANY SNAPSHOT
  • FIGURE 64 ENEL SPA: COMPANY SNAPSHOT

The study involves two major activities in estimating the current market size for the Wind Blade Recycling market. Exhaustive secondary research was done to collect information on the market, peer market, and parent market. The next step was to validate these findings, assumptions, and sizing with industry experts across the value chain through primary research. Both top-down and bottom-up approaches were employed to estimate the complete market size. After that, market breakdown and data triangulation were used to estimate the market size of segments and subsegments.

Secondary Research

Secondary sources referred to for this research study include financial statements of companies offering wind blade recycling and information from various trade, business, and professional associations. Secondary research has been used to obtain critical information about the industry’s value chain, the total pool of key players, market classification, and segmentation according to industry trends to the bottom-most level and regional markets. The secondary data was collected and analyzed to arrive at the overall size of the wind blade recycling market, which was validated by primary respondents.

Primary Research

Extensive primary research was conducted after obtaining information regarding the wind blade recycling market scenario through secondary research. Several primary interviews were conducted with market experts from both the demand and supply sides across major countries of North America, Europe, Asia Pacific, the Middle East & Africa, and Latin America. Primary data was collected through questionnaires, emails, and telephonic interviews. The primary sources from the supply side included various industry experts, such as Chief X Officers (CXOs), Vice Presidents (VPs), Directors from business development, marketing, product development/innovation teams, and related key executives from Wind Blade Recycling industry vendors; system integrators; component providers; distributors; and key opinion leaders. Primary interviews were conducted to gather insights such as market statistics, data on revenue collected from the products and services, market breakdowns, market size estimations, market forecasting, and data triangulation. Primary research also helped in understanding the various trends related to type, storage & distribution and transportation, manufacturing process, function, end-use industry, and region. Stakeholders from the demand side, such as CIOs, CTOs, CSOs, and installation teams of the customer/end users who are seeking wind blade recycling services, were interviewed to understand the buyer’s perspective on the suppliers, products, component providers, and their current usage of high purity gases and future outlook of their business which will affect the overall market.

The Breakup of Primary Research:
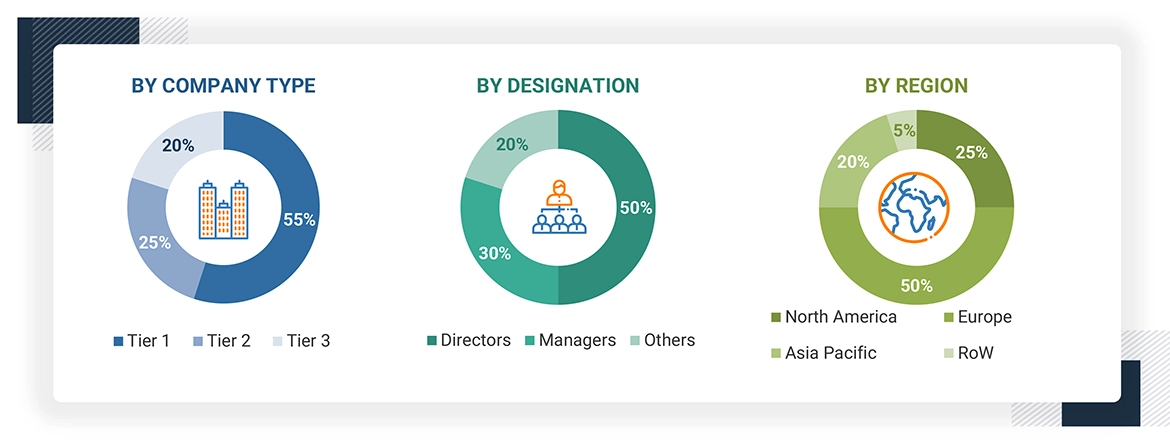
To know about the assumptions considered for the study, download the pdf brochure

Market Size Estimation

The research methodology used to estimate the size of the wind blade recycling market includes the following details. The market sizing of the market was undertaken from the demand side. The market was upsized based on the demand for recycled wind blade material in different end-use industries at a regional level. Such procurements provide information on the demand aspects of the wind blade recycling industry for each application. For each end-use, all possible segments of the wind blade recycling market were integrated and mapped.

Data Triangulation

After arriving at the overall size from the market size estimation process explained above, the total market was split into several segments and subsegments. The data triangulation and market breakdown procedures explained below were implemented, wherever applicable, to complete the overall market engineering process and arrive at the exact statistics for various market segments and subsegments. The data was triangulated by studying various factors and trends from the demand and supply sides. Along with this, the market size was validated using both the top-down and bottom-up approaches.

Market Definition

Wind blade recycling is defined as the process of recovering the materials from the wind blades in their original form. Wind blades are mainly composed of composites which include glass fiber, carbon fiber, and resins. Traditionally, wind blades are made from thermosets, thus they are hard to recycle. As wind energy industry grows, the disposal of decommissioned wind blades poses an environmental challenge, as landfilling is not a permanent solution. Players in the wind industry ecosystem are trying to tackle this problem by developing innovative and cost effective recycling technologies like mechanical, thermal, and chemical recycling. This recycled material have demand from construction, automotive, electronic & consumer goods, and other industries.

Stakeholders

  • Wind blade recycling providers
  • Government and Research Organizations
  • National and Local Government Organizations
  • Institutional Investors
  • European Wind Energy Association
  • US Energy Department
  • Global Wind Energy Council

Report Objectives

  • To define, describe, and forecast the wind blade recycling market size in terms of volume and value
  • To provide detailed information regarding the key factors, such as drivers, restraints, opportunities, and challenges influencing market growth
  • To analyze and project the global Wind Blade Recycling market by blade material, by recycling process, end-use industry, and region
  • To forecast the market size concerning five main regions (along with country-level data), namely, North America, Europe, Asia Pacific, Latin America, and the Middle East & Africa, and analyze the significant region-specific trends
  • To strategically analyze micromarkets with respect to individual growth trends, prospects, and contributions of the submarkets to the overall market
  • To analyze the market opportunities and the competitive landscape for stakeholders and market leaders
  • To assess recent market developments and competitive strategies, such as agreements, contracts, acquisitions, and new product developments/new product launches, to draw the competitive landscape
  • To strategically profile the key market players and comprehensively analyze their core competencies

Previous Versions of this Report

Custom Market Research Services

We Will Customise The Research For You, In Case The Report Listed Above Does Not Meet With Your Requirements

Get 10% Free Customisation

Growth opportunities and latent adjacency in Wind Blade Recycling Market

DMCA.com Protection Status