Vitamin K2 Market

Vitamin K2 Market by Product Type (MK-4, MK-7), Form (Capsules & Tablets, Powder & Crystalline, Oils & Liquid), Application (Pharmaceutical, Functional Food & Beverages, Health Supplements), by Function (Bone & Cardiovascular Health, Blood Health & Clotting, Anti-Inflammatory & Immune Support, Other Functions) - Global Forecast to 2029

Report Code: FB 9049 Jun, 2024, by marketsandmarkets.com

Vitamin K2 Market Overview (2024-2029)

The global vitamin K2 market is on a trajectory of significant expansion, with an estimated value projected to reach USD 265 million by 2029 from the 2024 valuation of USD 140 million, displaying a promising Compound Annual Growth Rate (CAGR) of 13.7%. As scientific research continues to highlight the benefits of Vitamin K2, particularly in calcium metabolism and the prevention of arterial calcification, more individuals are incorporating this nutrient into their diets. This heightened awareness is especially prevalent among aging populations, who are at greater risk for osteoporosis and cardiovascular diseases, thereby fueling demand for Vitamin K2 supplements.

Another significant contributor to market expansion is the rise of the health and wellness trend. Consumers worldwide are becoming more proactive about their health, seeking preventive measures to avoid chronic diseases. This shift is evident in the growing popularity of dietary supplements and functional foods fortified with essential nutrients like Vitamin K2. Moreover, advancements in the production and formulation of Vitamin K2 supplements are also playing a crucial role in the market’s upward trajectory. Innovations such as microencapsulation and improved delivery systems have enhanced the bioavailability and efficacy of Vitamin K2, making supplements more effective and appealing to consumers. These advancements not only improve the absorption of Vitamin K2 in the body but also extend the shelf life of products, ensuring that consumers receive the maximum benefits from their supplements.

Vitamin K2 Market

To know about the assumptions considered for the study, Request for Free Sample Report

Vitamin K2 Market Opportunities

To know about the assumptions considered for the study, download the pdf brochure

Market Dynamics

Drivers: Growth in health consciousness among consumers and increasing health expenditure

The Vitamin K2 market is experiencing robust growth, primarily driven by the increasing health consciousness among consumers and the rise in health expenditure globally. As more individuals become aware of the importance of preventive healthcare, they are seeking out dietary supplements that can support their long-term well-being. This trend is evident across various demographics, from young adults focused on maintaining their health to older populations looking to manage age-related health issues. The growing emphasis on holistic health and wellness is leading consumers to invest in products that offer specific health benefits, such as improved bone density and cardiovascular health, which are directly linked to Vitamin K2. Additionally, higher disposable incomes and greater health expenditure are enabling consumers to spend more on premium health products, further boosting the demand for Vitamin K2 supplements.

Restraints: Inconsistency in regulatory norms governing vitamin K2

Despite the promising growth prospects, the Vitamin K2 market faces significant challenges due to the inconsistency in regulatory norms across different regions. These regulatory disparities can create barriers for manufacturers and marketers, complicating the process of bringing new Vitamin K2 products to market. Different countries have varying guidelines and standards for the production, labeling, and marketing of dietary supplements, including Vitamin K2. This lack of uniformity can lead to increased costs for compliance and potential delays in product launches. Moreover, stringent regulations in certain regions can limit market entry for new players, hindering the overall growth of the Vitamin K2 market. Navigating these regulatory complexities requires substantial investment in legal and regulatory expertise, which can be a restraint for smaller companies.

Opportunities: Growing demand for natural and functional foods

The growing demand for natural and functional foods presents a significant opportunity for the Vitamin K2 market. Consumers are increasingly seeking out food products that not only provide essential nutrients but also offer additional health benefits. This trend towards functional foods is driven by a desire for more natural and holistic approaches to health and nutrition. Vitamin K2, known for its role in supporting bone and cardiovascular health, is a valuable ingredient in this market. Manufacturers are capitalizing on this opportunity by incorporating Vitamin K2 into a variety of food products, including dairy products, fermented foods, and nutritional bars. The preference for natural ingredients further enhances the appeal of Vitamin K2, as it can be sourced from natural origins such as fermented soybeans (natto) and certain cheeses. This growing demand for functional and natural foods is set to drive the expansion of the Vitamin K2 market.

Challenges: Lack of consumer awareness regarding benefits specific to vitamin K2

One of the key challenges facing the Vitamin K2 market is the lack of consumer awareness regarding its specific benefits. While there is a general understanding of the importance of vitamins for health, the unique benefits of Vitamin K2, such as its role in calcium metabolism and preventing arterial calcification, are not widely known. This lack of awareness can limit consumer demand and slow market growth. Many consumers may not differentiate between Vitamin K1 and Vitamin K2, leading to confusion and underutilization of Vitamin K2 supplements. Addressing this challenge requires concerted efforts in education and marketing to inform consumers about the specific advantages of Vitamin K2. Effective communication strategies, including clear labeling, informative campaigns, and endorsements by health professionals, are essential to bridge this knowledge gap and drive greater adoption of Vitamin K2 products.

Market Ecosystem

Top Companies in Vitamin K2 Market

Mk-7 Product Type is Witnessing Higher Growth During the Forecast Period. 

Menaquinone-7 or MK-7 is the most studied menaquinone due to its high bioavailability, longer half-life, and more than three decades of clinical research. Furthermore,  Vitamin K2 MK-7, specifically MenaQ7 and vitaMK7, represents a pivotal advancement in nutritional science, renowned for its dual benefits in bone and cardiovascular health. Distinct from its K1 counterpart, K2 MK-7's superior bioavailability and extended half-life in the body make it optimal for promoting calcium utilization towards bone strength while preventing arterial calcification.

As consumer awareness grows and dietary deficiencies persist, the market potential for K2 MK-7 continues to expand, driven by increasing demand for scientifically validated supplements that address fundamental health challenges across diverse demographic segments.

Pharmaceuticals Emerge As the Second Dominant Application Segment in the Vitamin K2 Market.

The pharmaceutical sector is driven by its extensive therapeutic benefits and increasing incorporation into medical treatments. Vitamin K2’s importance in the pharmaceutical sector is underscored by its application in the prevention and treatment of osteoporosis, cardiovascular diseases, and certain types of cancer. As research continues to unveil the extensive health benefits of vitamin K2, its integration into pharmaceutical products is becoming increasingly prevalent.

Moreover, the potential anticancer properties of vitamin K2 are garnering attention within the pharmaceutical industry. Studies have suggested that vitamin K2 can induce apoptosis in cancer cells and inhibit their proliferation. According to an NCBI study, vitamin K2 induces differentiation and apoptosis in a wide array of human cancer cell lines. However, it is noteworthy that vitamin K2-mediated apoptosis proceeds much more slowly than the apoptosis induced by conventional anticancer agents. The inclusion of vitamin K2 in pharmaceutical products could, therefore, open new avenues for therapeutic interventions, providing patients with innovative treatment options.

Asia Pacific Is The Fastest-Growing Market For Vitamin K2 Among The Regions.

The Asia Pacific region is emerging as the fastest-growing market for Vitamin K2, driven by a combination of demographic, economic, and lifestyle factors. One of the primary drivers of this growth is the region’s rapidly aging population. Countries such as Japan, China, and South Korea are experiencing significant increases in their elderly populations, who are more prone to bone-related ailments like osteoporosis and cardiovascular issues. This demographic shift is creating a substantial demand for nutritional supplements that support bone health and prevent arterial calcification, making Vitamin K2 a sought-after nutrient.

Additionally, The robust growth of the e-commerce sector in the Asia Pacific (APAC) region has significantly facilitated easy access to a wide range of Vitamin K2 products, contributing to the market's expansion. One of the main advantages is the proliferation of online retail platforms, such as Amazon, Alibaba, and other regional e-commerce giants. These platforms have not only increased the visibility of Vitamin K2 supplements but have also allowed for a broader distribution network, reaching consumers in even the most remote areas.

Consumers now have the convenience of shopping from their homes or workplaces, offering a seamless purchasing experience. This accessibility has become even more appealing due to the variety of choices and competitive pricing available on e-commerce platforms. Additionally, online platforms often provide comprehensive product information, customer reviews, and expert advice, empowering consumers to make informed decisions about their health and wellness purchases.

Asia Pacific Vitamin K2 Market

Key Market Players

The key players in this market include Gnosis by Lesaffre (NattoPharma) (France), Kappa Bioscience AS (Balchem Corp.) (US), J-OIL MILLS INC. (Japan), Novozymes A/S (Denmark), BASF SE (Germany), Sungen Bioscience Co.,Ltd. (China), Vesta Nutra (US), Richen Nutritional Technology Co., Ltd. (China), Menadiona (Spain), and GENOFOCUS (Korea)

Want to explore hidden markets that can drive new revenue in Vitamin K2 Market?

Scope of the Report
:

Report Metric

Details

Market size value in 2024

USD 140 million

Revenue forecast in 2029

USD 265 million

Growth Rate

CAGR of 13.7% from 2024 to 2029

Market size estimation

2024–2029

Base year considered

2023

Forecast period considered

2024–2029

Units considered

Value (USD Million), Volume (Tons)

Segments Covered

By Product Type, Form, Source, Application, Function, and Region

Regions covered

North America, Europe, Asia Pacific, and RoW

Companies studied

  • Gnosis By Lesaffre (Nattopharma) (Norway)
  • Kappa Bioscience As (Balchem Corp.) (US)
  • J-OIL MILLS, INC. (Japan)
  • Novozymes A/S (Denmark)
  • BASF SE (Germany)
  • Sungen Bioscience Co.,Ltd (China)
  • Vesta Nutra (US)
  • Richen (China)
  • Menadiona (Spain)
  • Genofocus (South Korea)
  • Angelyeast Co., Ltd. (China)
  • Geneferm Biotechnology Co., Ltd. (Taiwan)
  • Nakoda Chemical Ltd. (India)
  • Haihang Industry (China)
  • Chemicea Limited (India)
  • Kyowa Hakko U.S.A., Inc. (US)


Vitamin K2 Market Segmentation:

This research report categorizes the vitamin k2 market, based on product type, form, source, application, function, and region.

By Product type
  • MK-4
  • MK-7
By Form
  • Capsules & Tablets
  • Powder & Crystalline
  • Oils & Liquid   
By Source
  • Natural
  • Synthetic
By Application
  • Pharmaceuticals
  • Functional Food & Beverages
  • Health Supplements
By Function (Qualitative)
  • Bone & Cardiovascular Health
  • Blood Health & Clotting
  • Anti-inflammatory & Immune Support
  • Other Functions
By Region
  • North America
  • Europe
  • Asia Pacific
  • Rest of the World (RoW)

Target Audience

  • Vitamin k2 Manufacturers
  • Food & Beverage Producers
  • Pharmaceutical companies
  • Food Processing Manufacturers
  • Government Agencies (related to food safety and regulations such as FDA, EFSA, and FSSAI)

Recent Developments

  • In April 2022, GF Fermentech, a subsidiary of Genofocus, introduced a higher-purity variant of its MediQ7 range of vitamin K2 ingredients, named MediQ7 Pure. Derived from Bacillus subtilis natto sourced from traditional Korean fermented food Cheonggukjang, this product boasts over 96% concentration and 99.9% trans-type Menaquinone 7, aligning with USP standards. The ingredients are vegan, kosher, halal, GMP, ISO 9001, and ISO 22000 certified.
  • In January 2021, Menadiona launched its Vitamin K2 MK-7 grade. Menadiona has been a consistent supplier of Vitamin K2 MK-4 (Menatetrenone) for the medical treatment of osteoporosis. With the COVID-19 pandemic highlighting a potential link between Vitamin K2 deficiency and the risk of developing the disease, MENADIONA has expanded its product line to include the new MK-7 grade, suitable for nutraceutical formulations in various forms, such as gel, oil, or capsules.

Frequently Asked Questions (FAQ):

To speak to our analyst for a discussion on the above findings, click Speak to Analyst

Exclusive indicates content/data unique to MarketsandMarkets and not available with any competitors.

INTRODUCTION
23
RESEARCH METHODOLOGY
28
EXECUTIVE SUMMARY
42
PREMIUM INSIGHTS
47
MARKET OVERVIEW
51
  • 5.1 INTRODUCTION
  • 5.2 MACROECONOMIC INDICATORS
    RISING GDP AND POPULATION
    RISE IN HEALTH CONCERNS AND DISEASE INCIDENCES
    INCREASE IN CONSUMPTION OF DIETARY FIBERS
  • 5.3 MARKET DYNAMICS
    DRIVERS
    - Rising health consciousness among consumers
    - Growing research and development activities
    RESTRAINTS
    - Inconsistency in regulatory norms
    - Price volatility of raw materials
    OPPORTUNITIES
    - Growing demand for natural and plant-based ingredients
    - Rising need for personalized nutrition and customized products
    - Untapped applications
    CHALLENGES
    - Lack of consumer awareness regarding specific health benefits
    - High research and development costs
INDUSTRY TRENDS
61
  • 6.1 INTRODUCTION
  • 6.2 SUPPLY CHAIN ANALYSIS
  • 6.3 VALUE CHAIN ANALYSIS
    RAW MATERIAL SOURCING
    MANUFACTURING AND PROCESSING
    - Product formulation and development
    QUALITY ASSURANCE AND CERTIFICATION
    MARKETING AND DISTRIBUTION
  • 6.4 TRADE ANALYSIS
    EXPORT SCENARIO
    IMPORT SCENARIO
  • 6.5 TECHNOLOGY ANALYSIS
    KEY TECHNOLOGY
    - Fermentation technology
    COMPLEMENTARY TECHNOLOGY
    - Encapsulation technology
    ADJACENT TECHNOLOGY
    - Biotechnology
  • 6.6 PRICING ANALYSIS
    AVERAGE SELLING PRICE TREND OF KEY PLAYERS, BY PRODUCT TYPE
    AVERAGE SELLING PRICE TREND OF KEY PLAYERS, BY REGION
  • 6.7 ECOSYSTEM ANALYSIS
    DEMAND SIDE
    SUPPLY SIDE
  • 6.8 TRENDS/DISRUPTIONS IMPACTING CUSTOMERS’ BUSINESSES
  • 6.9 PATENT ANALYSIS
    LIST OF MAJOR PATENTS
  • 6.10 KEY CONFERENCES AND EVENTS, 2024–2025
  • 6.11 REGULATORY LANDSCAPE
    REGULATORY BODIES, GOVERNMENT AGENCIES, AND OTHER ORGANIZATIONS
    - Regulations in North America
    - Regulations in Europe
    - Regulations in Asia Pacific
  • 6.12 PORTER’S FIVE FORCES ANALYSIS
    INTENSITY OF COMPETITIVE RIVALRY
    BARGAINING POWER OF SUPPLIERS
    BARGAINING POWER OF BUYERS
    THREAT OF NEW ENTRANTS
    THREAT OF SUBSTITUTES
  • 6.13 KEY STAKEHOLDERS AND BUYING CRITERIA
    KEY STAKEHOLDERS IN BUYING PROCESS
    BUYING CRITERIA
  • 6.14 CASE STUDY ANALYSIS
    ESTABLISHING DISTINCT RECOMMENDED DIETARY INTAKE TO PROMOTE HEALTHIER DIETARY CHOICES
    ENHANCING ABILITY IN NUTRACEUTICAL FORMULATIONS FOR IMPROVED QUALITY AND EFFICACY
  • 6.15 INVESTMENT AND FUNDING SCENARIO
VITAMIN K2 MARKET, BY FUNCTION
88
  • 7.1 INTRODUCTION
  • 7.2 BONE AND CARDIOVASCULAR HEALTH
    COMPREHENSIVE HEALTH BENEFITS TO DRIVE MARKET
  • 7.3 BLOOD HEALTH AND CLOTTING
    EFFICACY IN MANAGING CLOTTING DISORDERS TO BOOST MARKET GROWTH
  • 7.4 ANTI-INFLAMMATORY AND IMMUNITY
    THERAPEUTIC POTENTIAL AND IMMUNITY-SUPPORTING PROPERTIES TO SUPPORT MARKET GROWTH
  • 7.5 OTHER FUNCTIONS
VITAMIN K2 MARKET, BY PRODUCT TYPE
92
  • 8.1 INTRODUCTION
  • 8.2 MK-4
    POTENTIAL BENEFITS IN BONE AND CARDIOVASCULAR HEALTH TO DRIVE MARKET GROWTH
  • 8.3 MK-7
    HIGH BIOAVAILABILITY TO PROPEL MARKET GROWTH
VITAMIN K2 MARKET, BY APPLICATION FORM
99
  • 9.1 INTRODUCTION
  • 9.2 CAPSULES AND TABLETS
    ABILITY TO CATER TO DIVERSE CONSUMER NEEDS AND PREFERENCES TO DRIVE MARKET
  • 9.3 POWDER AND CRYSTALLINE
    SURGING DEMAND FOR CUSTOMIZABLE DOSAGES AND HIGH PURITY TO PROPEL MARKET GROWTH
  • 9.4 LIQUIDS
    GROWING NEED FOR SUPPLEMENTS WITH ENHANCED BIOAVAILABILITY TO BOOST SEGMENT GROWTH
VITAMIN K2 MARKET, BY SOURCE
104
  • 10.1 INTRODUCTION
  • 10.2 NATURAL
    INCREASING CONSUMER PREFERENCE FOR NON-GMO SUPPLEMENTS TO BOOST MARKET GROWTH
  • 10.3 SYNTHETIC
    LOW PRODUCTION COST TO DRIVE MARKET
VITAMIN K2 MARKET, BY APPLICATION
108
  • 11.1 INTRODUCTION
  • 11.2 PHARMACEUTICALS
    RISING GOVERNMENT INVESTMENTS IN DEVELOPMENT OF NEW FORMULATIONS TO DRIVE MARKET
  • 11.3 FUNCTIONAL FOODS AND BEVERAGES
    GROWING DEMAND FOR FORTIFIED FUNCTIONAL FOODS TO PROPEL MARKET GROWTH
  • 11.4 HEALTH SUPPLEMENTS
    INCREASED AWARENESS REGARDING ASSOCIATED HEALTH BENEFITS TO DRIVE MARKET
VITAMIN K2 MARKET, BY REGION
115
  • 12.1 INTRODUCTION
  • 12.2 NORTH AMERICA
    NORTH AMERICA: RECESSION IMPACT ANALYSIS
    US
    - Growing awareness regarding importance of preventive health measures to drive market
    CANADA
    - Increasing focus on preventive healthcare and natural products to propel market
    MEXICO
    - High prevalence of chronic lifestyle diseases to drive market
  • 12.3 EUROPE
    EUROPE: RECESSION IMPACT ANALYSIS
    GERMANY
    - Rising focus on proactive healthcare to drive market
    FRANCE
    - Innovative products and investments in research and development to boost market growth
    UK
    - Rapidly aging population to propel market growth
    ITALY
    - Evolving dietary preferences to boost market growth
    SPAIN
    - Growing consumer interest in health supplements to propel drive demand
    REST OF EUROPE
  • 12.4 ASIA PACIFIC
    ASIA PACIFIC: RECESSION IMPACT ANALYSIS
    CHINA
    - Surging use of digital media to disseminate healthcare information to propel market
    JAPAN
    - Consumer preferences for natural healthcare solutions to boost market growth
    INDIA
    - Strategic market penetration initiatives by various companies to drive market
    AUSTRALIA AND NEW ZEALAND
    - Changing consumer preferences and increasing health consciousness to drive demand
    REST OF ASIA PACIFIC
  • 12.5 ROW
    ROW: RECESSION IMPACT ANALYSIS
    SOUTH AMERICA
    - Collaboration among key market players to drive market growth
    MIDDLE EAST AND AFRICA
    - Developing regulatory landscape to propel market growth
COMPETITIVE LANDSCAPE
153
  • 13.1 OVERVIEW
  • 13.2 KEY PLAYER STRATEGIES/RIGHT TO WIN
  • 13.3 REVENUE ANALYSIS
  • 13.4 MARKET SHARE ANALYSIS
  • 13.5 COMPANY VALUATION AND FINANCIAL METRICS
    COMPANY VALUATION
    EV/EBITDA
  • 13.6 BRAND/PRODUCT COMPARISON ANALYSIS
    MENAQUINGOLD
    MENAQ7
    K2VITAL
    VITAMK7
    MENATTO
  • 13.7 COMPANY EVALUATION MATRIX: KEY PLAYERS, 2023
    STARS
    EMERGING LEADERS
    PERVASIVE PLAYERS
    PARTICIPANTS
    COMPANY FOOTPRINT: KEY PLAYERS, 2023
    - Company footprint
    - Regional footprint
    - Product type footprint
    - Application footprint
    - Source footprint
  • 13.8 COMPANY EVALUATION MATRIX: STARTUPS/SMES, 2023
    PROGRESSIVE COMPANIES
    RESPONSIVE COMPANIES
    DYNAMIC COMPANIES
    STARTING BLOCKS
    COMPETITIVE BENCHMARKING
    - Detailed list of key startups/SMEs
    - Competitive benchmarking of key startup/SMEs
  • 13.9 COMPETITIVE SCENARIO AND TRENDS
    PRODUCT LAUNCHES AND DEVELOPMENTS
    DEALS
    EXPANSIONS
    OTHERS
COMPANY PROFILES
174
  • 14.1 KEY PLAYERS
    GNOSIS BY LESAFFRE (NATTOPHARMA)
    - Business overview
    - Products/Solutions/Services offered
    - Recent developments
    - MnM view
    KAPPA BIOSCIENCE AS (BALCHEM CORP.)
    - Business overview
    - Products/Solutions/Services offered
    - Recent developments
    - MnM view
    J-OIL MILLS, INC.
    - Business overview
    - Products/Solutions/Services offered
    - Recent developments
    - MnM view
    NOVOZYMES A/S
    - Business overview
    - Products/Solutions/Services offered
    - Recent developments
    - MnM view
    BASF SE
    - Business overview
    - Products/Solutions/Services offered
    - Recent developments
    - MnM view
    SUNGEN BIOSCIENCE CO.,LTD
    - Business overview
    - Products/Solutions/Services offered
    - Recent developments
    - MnM view
    VESTA NUTRA
    - Business overview
    - Products/Solutions/Services offered
    - Recent developments
    - MnM view
    RICHEN NUTRITIONAL TECHNOLOGY CO., LTD.
    - Business overview
    - Products/Solutions/Services offered
    - Recent developments
    - MnM view
    MENADIONA
    - Business overview
    - Products/Solutions/Services offered
    - Recent developments
    - MnM view
    GENOFOCUS
    - Business overview
    - Products/Solutions/Services offered
    - Recent developments
    - MnM view
    ANGELYEAST CO., LTD.
    - Business overview
    - Products/Solutions/Services offered
    - Recent developments
    - MnM view
    GENEFERM BIOTECHNOLOGY CO., LTD.
    - Business overview
    - Products/Solutions/Services offered
    - Recent developments
    - MnM view
    NAKODA CHEMICALS LTD.
    - Business overview
    - Products/Solutions/Services offered
    - Recent developments
    - MnM view
    HAIHANG INDUSTRY
    - Business overview
    - Products/Solutions/Services offered
    - Recent developments
    - MnM view
    CHEMICEA LIMITED
    - Business overview
    - Products/Solutions/Services offered
    - Recent developments
    - MnM view
    KYOWA HAKKO U.S.A., INC.
    - Business overview
    - Products/Solutions/Services offered
    - Recent developments
    - MnM view
  • 14.2 STARTUPS/SMES
    SEEBIO BIOTECH (SHANGHAI) CO.,LTD.
    MAGNESIA GMBH
    FALCON TRADING INTERNATIONAL
    ABCO INDIA
    ACT
ADJACENT AND RELATED MARKETS
214
  • 15.1 INTRODUCTION
  • 15.2 LIMITATIONS
  • 15.3 DIETARY SUPPLEMENTS MARKET
    MARKET DEFINITION
    MARKET OVERVIEW
  • 15.4 VITAMINS MARKET
    MARKET DEFINITION
    MARKET OVERVIEW
APPENDIX
218
  • 16.1 DISCUSSION GUIDE
  • 16.2 KNOWLEDGESTORE: MARKETSANDMARKETS’ SUBSCRIPTION PORTAL
  • 16.3 CUSTOMIZATION OPTIONS
  • 16.4 RELATED REPORTS
  • 16.5 AUTHOR DETAILS
LIST OF TABLES
 
  • TABLE 1 INCLUSIONS AND EXCLUSIONS
  • TABLE 2 USD EXCHANGE RATES, 2020–2023
  • TABLE 3 VITAMIN K2 MARKET SNAPSHOT, 2024 VS. 2029
  • TABLE 4 TOP 10 EXPORTERS OF VITAMINS AND THEIR DERIVATIVES (HS CODE 293629), 2019–2023 (USD THOUSAND)
  • TABLE 5 TOP 10 EXPORTERS OF VITAMINS AND THEIR DERIVATIVES (HS CODE 293629), 2019–2023 (TON)
  • TABLE 6 TOP 10 IMPORTERS OF VITAMINS AND THEIR DERIVATIVES (HS CODE 293629), 2019–2023 (USD THOUSAND)
  • TABLE 7 TOP 10 IMPORTERS OF VITAMINS AND THEIR DERIVATIVES (HS CODE 293629), 2019–2023 (TON)
  • TABLE 8 AVERAGE SELLING PRICE (ASP), BY PRODUCT TYPE, 2020–2023 (USD/TON)
  • TABLE 9 AVERAGE SELLING PRICE (ASP), BY REGION, 2020–2023 (USD/TON)
  • TABLE 10 VITAMIN K2 MARKET ECOSYSTEM
  • TABLE 11 LIST OF MAJOR PATENTS PERTAINING TO VITAMIN K2, 2020–2023
  • TABLE 12 VITAMIN K2 MARKET: KEY DETAILED LIST OF CONFERENCES AND EVENTS, 2024–2025
  • TABLE 13 NORTH AMERICA: LIST OF REGULATORY BODIES, GOVERNMENT AGENCIES, AND OTHER ORGANIZATIONS
  • TABLE 14 EUROPE: LIST OF REGULATORY BODIES, GOVERNMENT AGENCIES, AND OTHER ORGANIZATIONS
  • TABLE 15 ASIA PACIFIC: LIST OF REGULATORY BODIES, GOVERNMENT AGENCIES, AND OTHER ORGANIZATIONS
  • TABLE 16 IMPACT OF PORTER’S FIVE FORCES ON VITAMIN K2 MARKET
  • TABLE 17 INFLUENCE OF STAKEHOLDERS ON BUYING PROCESS FOR VITAMIN K2 PRODUCT TYPES
  • TABLE 18 KEY BUYING CRITERIA FOR VITAMIN K2 PRODUCT TYPES
  • TABLE 19 PRODUCT TYPE: OVERVIEW
  • TABLE 20 VITAMIN K2 MARKET, BY PRODUCT TYPE, 2020–2023 (USD MILLION)
  • TABLE 21 VITAMIN K2 MARKET, BY PRODUCT TYPE, 2024–2029 (USD MILLION)
  • TABLE 22 VITAMIN K2 MARKET, BY PRODUCT TYPE, 2020–2023 (TON)
  • TABLE 23 VITAMIN K2 MARKET, BY PRODUCT TYPE, 2024–2029 (TON)
  • TABLE 24 MK-4: VITAMIN K2 MARKET, BY REGION, 2020–2023 (USD MILLION)
  • TABLE 25 MK-4: VITAMIN K2 MARKET, BY REGION, 2024–2029 (USD MILLION)
  • TABLE 26 MK-4: VITAMIN K2 MARKET, BY REGION, 2020–2023 (TON)
  • TABLE 27 MK-4: VITAMIN K2 MARKET, BY REGION, 2024–2029 (TON)
  • TABLE 28 MK-7: VITAMIN K2 MARKET, BY REGION, 2020–2023 (USD MILLION)
  • TABLE 29 MK-7: VITAMIN K2 MARKET, BY REGION, 2024–2029 (USD MILLION)
  • TABLE 30 MK-7: VITAMIN K2 MARKET, BY REGION, 2020–2023 (TON)
  • TABLE 31 MK-7: VITAMIN K2 MARKET, BY REGION, 2024–2029 (TON)
  • TABLE 32 VITAMIN K2 MARKET, BY APPLICATION FORM, 2020–2023 (USD MILLION)
  • TABLE 33 VITAMIN K2 MARKET, BY APPLICATION FORM, 2024–2029 (USD MILLION)
  • TABLE 34 CAPSULES AND TABLETS: VITAMIN K2 MARKET, BY REGION, 2020–2023 (USD MILLION)
  • TABLE 35 CAPSULES AND TABLETS: VITAMIN K2 MARKET, BY REGION, 2024–2029 (USD MILLION)
  • TABLE 36 POWDER AND CRYSTALLINE: VITAMIN K2 MARKET, BY REGION, 2020–2023 (USD MILLION)
  • TABLE 37 POWDER AND CRYSTALLINE: VITAMIN K2 MARKET, BY REGION, 2024–2029 (USD MILLION)
  • TABLE 38 LIQUIDS: VITAMIN K2 MARKET, BY REGION, 2020–2023 (USD MILLION)
  • TABLE 39 LIQUIDS: VITAMIN K2 MARKET, BY REGION, 2024–2029 (USD MILLION)
  • TABLE 40 VITAMIN K2 MARKET: BY SOURCE, 2020–2023 (USD MILLION)
  • TABLE 41 VITAMIN K2 MARKET, BY SOURCE, 2024–2029 (USD MILLION)
  • TABLE 42 NATURAL: VITAMIN K2 MARKET, BY REGION, 2020–2023 (USD MILLION)
  • TABLE 43 NATURAL: VITAMIN K2 MARKET, BY REGION, 2024–2029 (USD MILLION)
  • TABLE 44 SYNTHETIC: VITAMIN K2 MARKET, BY REGION, 2020–2023 (USD MILLION)
  • TABLE 45 SYNTHETIC: VITAMIN K2 MARKET, BY REGION, 2024–2029 (USD MILLION)
  • TABLE 46 APPLICATION: OVERVIEW
  • TABLE 47 VITAMIN K2 MARKET: BY APPLICATION, 2020–2023 (USD MILLION)
  • TABLE 48 VITAMIN K2 MARKET, BY APPLICATION, 2024–2029 (USD MILLION)
  • TABLE 49 PHARMACEUTICALS: VITAMIN K2 MARKET, BY REGION, 2020–2023 (USD MILLION)
  • TABLE 50 PHARMACEUTICALS: VITAMIN K2 MARKET, BY REGION, 2024–2029 (USD MILLION)
  • TABLE 51 FUNCTIONAL FOODS AND BEVERAGES: VITAMIN K2 MARKET, BY REGION, 2020–2023 (USD MILLION)
  • TABLE 52 FUNCTIONAL FOODS AND BEVERAGES: VITAMIN K2 MARKET, BY REGION, 2024–2029 (USD MILLION)
  • TABLE 53 HEALTH SUPPLEMENTS: VITAMIN K2 MARKET, BY REGION, 2020–2023 (USD MILLION)
  • TABLE 54 HEALTH SUPPLEMENTS: VITAMIN K2 MARKET, BY REGION, 2024–2029 (USD MILLION)
  • TABLE 55 VITAMIN K2 MARKET, BY REGION, 2020–2023 (USD MILLION)
  • TABLE 56 VITAMIN K2 MARKET, BY REGION, 2024–2029 (USD MILLION)
  • TABLE 57 VITAMIN K2 MARKET, BY REGION, 2020–2023 (TON)
  • TABLE 58 VITAMIN K2 MARKET, BY REGION, 2024–2029 (TON)
  • TABLE 59 NORTH AMERICA: VITAMIN K2 MARKET, BY COUNTRY, 2020–2023 (USD MILLION)
  • TABLE 60 NORTH AMERICA: VITAMIN K2 MARKET, BY COUNTRY, 2024–2029 (USD MILLION)
  • TABLE 61 NORTH AMERICA: VITAMIN K2 MARKET, BY COUNTRY, 2020–2023 (TON)
  • TABLE 62 NORTH AMERICA: VITAMIN K2 MARKET, BY COUNTRY, 2024–2029 (TON)
  • TABLE 63 NORTH AMERICA: VITAMIN K2 MARKET, BY PRODUCT TYPE, 2020–2023 (USD MILLION)
  • TABLE 64 NORTH AMERICA: VITAMIN K2 MARKET, BY PRODUCT TYPE, 2024–2029 (USD MILLION)
  • TABLE 65 NORTH AMERICA: VITAMIN K2 MARKET, BY PRODUCT TYPE, 2020–2023 (TON)
  • TABLE 66 NORTH AMERICA: VITAMIN K2 MARKET, BY PRODUCT TYPE, 2024–2029 (TON)
  • TABLE 67 NORTH AMERICA: VITAMIN K2 MARKET, BY APPLICATION FORM, 2020–2023 (USD MILLION)
  • TABLE 68 NORTH AMERICA: VITAMIN K2 MARKET, BY APPLICATION FORM, 2024–2029 (USD MILLION)
  • TABLE 69 NORTH AMERICA: VITAMIN K2 MARKET, BY SOURCE, 2020–2023 (USD MILLION)
  • TABLE 70 NORTH AMERICA: VITAMIN K2 MARKET, BY SOURCE, 2024–2029 (USD MILLION)
  • TABLE 71 NORTH AMERICA: VITAMIN K2 MARKET, BY APPLICATION, 2020–2023 (USD MILLION)
  • TABLE 72 NORTH AMERICA: VITAMIN K2 MARKET, BY APPLICATION, 2024–2029 (USD MILLION)
  • TABLE 73 US: VITAMIN K2 MARKET, BY PRODUCT TYPE, 2020–2023 (USD MILLION)
  • TABLE 74 US: VITAMIN K2 MARKET, BY PRODUCT TYPE, 2024–2029 (USD MILLION)
  • TABLE 75 CANADA: VITAMIN K2 MARKET, BY PRODUCT TYPE, 2020–2023 (USD MILLION)
  • TABLE 76 CANADA: VITAMIN K2 MARKET, BY PRODUCT TYPE, 2024–2029 (USD MILLION)
  • TABLE 77 MEXICO: VITAMIN K2 MARKET, BY PRODUCT TYPE, 2020–2023 (USD MILLION)
  • TABLE 78 MEXICO: VITAMIN K2 MARKET, BY PRODUCT TYPE, 2024–2029 (USD MILLION)
  • TABLE 79 EUROPE: VITAMIN K2 MARKET, BY COUNTRY, 2020–2023 (USD MILLION)
  • TABLE 80 EUROPE: VITAMIN K2 MARKET, BY COUNTRY, 2024–2029 (USD MILLION)
  • TABLE 81 EUROPE: VITAMIN K2 MARKET, BY COUNTRY, 2020–2023 (TON)
  • TABLE 82 EUROPE: VITAMIN K2 MARKET, BY COUNTRY, 2024–2029 (TON)
  • TABLE 83 EUROPE: VITAMIN K2 MARKET, BY PRODUCT TYPE, 2020–2023 (USD MILLION)
  • TABLE 84 EUROPE: VITAMIN K2 MARKET, BY PRODUCT TYPE, 2024–2029 (USD MILLION)
  • TABLE 85 EUROPE: VITAMIN K2 MARKET, BY PRODUCT TYPE, 2020–2023 (TON)
  • TABLE 86 EUROPE: VITAMIN K2 MARKET, BY PRODUCT TYPE, 2024–2029 (TON)
  • TABLE 87 EUROPE: VITAMIN K2 MARKET, BY APPLICATION FORM, 2020–2023 (USD MILLION)
  • TABLE 88 EUROPE: VITAMIN K2 MARKET, BY APPLICATION FORM, 2024–2029 (USD MILLION)
  • TABLE 89 EUROPE: VITAMIN K2 MARKET, BY SOURCE, 2020–2023 (USD MILLION)
  • TABLE 90 EUROPE: VITAMIN K2 MARKET, BY SOURCE, 2024–2029 (USD MILLION)
  • TABLE 91 EUROPE: VITAMIN K2 MARKET, BY APPLICATION, 2020–2023 (USD MILLION)
  • TABLE 92 EUROPE: VITAMIN K2 MARKET, BY APPLICATION, 2024–2029 (USD MILLION)
  • TABLE 93 GERMANY: VITAMIN K2 MARKET, BY PRODUCT TYPE, 2020–2023 (USD MILLION)
  • TABLE 94 GERMANY: VITAMIN K2 MARKET, BY PRODUCT TYPE, 2024–2029 (USD MILLION)
  • TABLE 95 FRANCE: VITAMIN K2 MARKET, BY PRODUCT TYPE, 2020–2023 (USD MILLION)
  • TABLE 96 FRANCE: VITAMIN K2 MARKET, BY PRODUCT TYPE, 2024–2029 (USD MILLION)
  • TABLE 97 UK: VITAMIN K2 MARKET, BY PRODUCT TYPE, 2020–2023 (USD MILLION)
  • TABLE 98 UK: VITAMIN K2 MARKET, BY PRODUCT TYPE, 2024–2029 (USD MILLION)
  • TABLE 99 ITALY: VITAMIN K2 MARKET, BY PRODUCT TYPE, 2020–2023 (USD MILLION)
  • TABLE 100 ITALY: VITAMIN K2 MARKET, BY PRODUCT TYPE, 2024–2029 (USD MILLION)
  • TABLE 101 SPAIN: VITAMIN K2 MARKET, BY PRODUCT TYPE, 2020–2023 (USD MILLION)
  • TABLE 102 SPAIN: VITAMIN K2 MARKET, BY PRODUCT TYPE, 2024–2029 (USD MILLION)
  • TABLE 103 REST OF EUROPE: VITAMIN K2 MARKET, BY PRODUCT TYPE, 2020–2023 (USD MILLION)
  • TABLE 104 REST OF EUROPE: VITAMIN K2 MARKET, BY PRODUCT TYPE, 2024–2029 (USD MILLION)
  • TABLE 105 ASIA PACIFIC: VITAMIN K2 MARKET, BY COUNTRY, 2020–2023 (USD MILLION)
  • TABLE 106 ASIA PACIFIC: VITAMIN K2 MARKET, BY COUNTRY, 2024–2029 (USD MILLION)
  • TABLE 107 ASIA PACIFIC: VITAMIN K2 MARKET, BY COUNTRY, 2020–2023 (TON)
  • TABLE 108 ASIA PACIFIC: VITAMIN K2 MARKET, BY COUNTRY, 2024–2029 (TON)
  • TABLE 109 ASIA PACIFIC: VITAMIN K2 MARKET, BY PRODUCT TYPE, 2020–2023 (USD MILLION)
  • TABLE 110 ASIA PACIFIC: VITAMIN K2 MARKET, BY PRODUCT TYPE, 2024–2029 (USD MILLION)
  • TABLE 111 ASIA PACIFIC: VITAMIN K2 MARKET, BY PRODUCT TYPE, 2020–2023 (TON)
  • TABLE 112 ASIA PACIFIC: VITAMIN K2 MARKET, BY PRODUCT TYPE, 2024–2029 (TON)
  • TABLE 113 ASIA PACIFIC: VITAMIN K2 MARKET, BY APPLICATION FORM, 2020–2023 (USD MILLION)
  • TABLE 114 ASIA PACIFIC: VITAMIN K2 MARKET, BY APPLICATION FORM, 2024–2029 (USD MILLION)
  • TABLE 115 ASIA PACIFIC: VITAMIN K2 MARKET, BY SOURCE, 2020–2023 (USD MILLION)
  • TABLE 116 ASIA PACIFIC: VITAMIN K2 MARKET, BY SOURCE, 2024–2029 (USD MILLION)
  • TABLE 117 ASIA PACIFIC: VITAMIN K2 MARKET, BY APPLICATION, 2020–2023 (USD MILLION)
  • TABLE 118 ASIA PACIFIC: VITAMIN K2 MARKET, BY APPLICATION, 2024–2029 (USD MILLION)
  • TABLE 119 CHINA: VITAMIN K2 MARKET, BY PRODUCT TYPE, 2020–2023 (USD MILLION)
  • TABLE 120 CHINA: VITAMIN K2 MARKET, BY PRODUCT TYPE, 2024–2029 (USD MILLION)
  • TABLE 121 JAPAN: VITAMIN K2 MARKET, BY PRODUCT TYPE, 2020–2023 (USD MILLION)
  • TABLE 122 JAPAN: VITAMIN K2 MARKET, BY PRODUCT TYPE, 2024–2029 (USD MILLION)
  • TABLE 123 INDIA: VITAMIN K2 MARKET, BY PRODUCT TYPE, 2020–2023 (USD MILLION)
  • TABLE 124 INDIA: VITAMIN K2 MARKET, BY PRODUCT TYPE, 2024–2029 (USD MILLION)
  • TABLE 125 AUSTRALIA AND NEW ZEALAND: VITAMIN K2 MARKET, BY PRODUCT TYPE, 2020–2023 (USD MILLION)
  • TABLE 126 AUSTRALIA AND NEW ZEALAND: VITAMIN K2 MARKET, BY PRODUCT TYPE, 2024–2029 (USD MILLION)
  • TABLE 127 REST OF ASIA PACIFIC: VITAMIN K2 MARKET, BY PRODUCT TYPE, 2020–2023 (USD MILLION)
  • TABLE 128 REST OF ASIA PACIFIC: VITAMIN K2 MARKET, BY PRODUCT TYPE, 2024–2029 (USD MILLION)
  • TABLE 129 ROW: VITAMIN K2 MARKET, BY REGION, 2020–2023 (USD MILLION)
  • TABLE 130 ROW: VITAMIN K2 MARKET, BY REGION, 2024–2029 (USD MILLION)
  • TABLE 131 ROW: VITAMIN K2 MARKET, BY REGION, 2020–2023 (TON)
  • TABLE 132 ROW: VITAMIN K2 MARKET, BY REGION, 2024–2029 (TON)
  • TABLE 133 ROW: VITAMIN K2 MARKET, BY PRODUCT TYPE, 2020–2023 (USD MILLION)
  • TABLE 134 ROW: VITAMIN K2 MARKET, BY PRODUCT TYPE, 2024–2029 (USD MILLION)
  • TABLE 135 ROW: VITAMIN K2 MARKET, BY PRODUCT TYPE, 2020–2023 (TON)
  • TABLE 136 ROW: VITAMIN K2 MARKET, BY PRODUCT TYPE, 2024–2029 (TON)
  • TABLE 137 ROW: VITAMIN K2 MARKET, BY APPLICATION FORM, 2020–2023 (USD MILLION)
  • TABLE 138 ROW: VITAMIN K2 MARKET, BY APPLICATION FORM, 2024–2029 (USD MILLION)
  • TABLE 139 ROW: VITAMIN K2 MARKET, BY SOURCE, 2020–2023 (USD MILLION)
  • TABLE 140 ROW: VITAMIN K2 MARKET, BY SOURCE, 2024–2029 (USD MILLION)
  • TABLE 141 ROW: VITAMIN K2 MARKET, BY APPLICATION, 2020–2023 (USD MILLION)
  • TABLE 142 ROW: VITAMIN K2 MARKET, BY APPLICATION, 2024–2029 (USD MILLION)
  • TABLE 143 SOUTH AMERICA: VITAMIN K2 MARKET, BY PRODUCT TYPE, 2020–2023 (USD MILLION)
  • TABLE 144 SOUTH AMERICA: VITAMIN K2 MARKET, BY PRODUCT TYPE, 2024–2029 (USD MILLION)
  • TABLE 145 MIDDLE EAST AND AFRICA: VITAMIN K2 MARKET, BY PRODUCT TYPE, 2020–2023 (USD MILLION)
  • TABLE 146 MIDDLE EAST AND AFRICA: VITAMIN K2 MARKET, BY PRODUCT TYPE, 2024–2029 (USD MILLION)
  • TABLE 147 OVERVIEW OF STRATEGIES ADOPTED BY KEY VITAMIN K2 VENDORS
  • TABLE 148 VITAMIN K2 MARKET: DEGREE OF COMPETITION
  • TABLE 149 VITAMIN K2 MARKET: REGIONAL FOOTPRINT
  • TABLE 150 VITAMIN K2 MARKET: PRODUCT TYPE FOOTPRINT
  • TABLE 151 VITAMIN K2 MARKET: APPLICATION FOOTPRINT
  • TABLE 152 VITAMIN K2 MARKET: SOURCE FOOTPRINT
  • TABLE 153 VITAMIN K2 MARKET: DETAILED LIST OF KEY STARTUPS/SMES, 2023
  • TABLE 154 VITAMIN K2 MARKET: COMPETITIVE BENCHMARKING OF KEY STARTUP/SMES
  • TABLE 155 VITAMIN K2 MARKET: PRODUCT LAUNCHES AND DEVELOPMENTS, JANUARY 2020–JUNE 2024
  • TABLE 156 VITAMIN K2 MARKET: DEALS, JANUARY 2020–JUNE 2024
  • TABLE 157 VITAMIN K2 MARKET: EXPANSIONS, JANUARY 2020–JUNE 2024
  • TABLE 158 VITAMIN K2 MARKET: OTHER DEVELOPMENTS, JANUARY 2020 - JUNE 2024
  • TABLE 159 GNOSIS BY LESAFFRE (NATTOPHARMA): COMPANY OVERVIEW
  • TABLE 160 GNOSIS BY LESAFFRE (NATTOPHARMA): PRODUCTS/SOLUTIONS/SERVICES OFFERED
  • TABLE 161 GNOSIS BY LESAFFRE (NATTOPHARMA): PRODUCT LAUNCHES AND DEVELOPMENTS
  • TABLE 162 GNOSIS BY LESAFFRE (NATTOPHARMA): DEALS
  • TABLE 163 GNOSIS BY LESAFFRE (NATTOPHARMA): OTHER DEALS/DEVELOPMENTS
  • TABLE 164 KAPPA BIOSCIENCE AS (BALCHEM CORP.): COMPANY OVERVIEW
  • TABLE 165 KAPPA BIOSCIENCE AS (BALCHEM CORP.): PRODUCTS/SOLUTIONS/SERVICES OFFERED
  • TABLE 166 KAPPA BIOSCIENCE AS (BALCHEM CORP.): PRODUCT LAUNCHES AND DEVELOPMENTS
  • TABLE 167 KAPPA BIOSCIENCE AS (BALCHEM CORP.): DEALS
  • TABLE 168 KAPPA BIOSCIENCE AS (BALCHEM CORP.): EXPANSIONS
  • TABLE 169 KAPPA BIOSCIENCE AS (BALCHEM CORP.): OTHER DEALS/DEVELOPMENTS
  • TABLE 170 J-OIL MILLS, INC.: COMPANY OVERVIEW
  • TABLE 171 J-OIL MILLS, INC.: PRODUCTS/SOLUTIONS/SERVICES OFFERED
  • TABLE 172 J-OIL MILLS, INC.: PRODUCT LAUNCHES AND DEVELOPMENTS
  • TABLE 173 J-OIL MILLS, INC.: DEALS
  • TABLE 174 NOVOZYMES A/S: COMPANY OVERVIEW
  • TABLE 175 NOVOZYMES A/S: PRODUCTS/SOLUTIONS/SERVICES OFFERED
  • TABLE 176 NOVOZYMES A/S: DEALS
  • TABLE 177 BASF SE: COMPANY OVERVIEW
  • TABLE 178 BASF SE: PRODUCTS/SOLUTIONS/SERVICES OFFERED
  • TABLE 179 SUNGEN BIOSCIENCE CO.,LTD: COMPANY OVERVIEW
  • TABLE 180 SUNGEN BIOSCIENCE CO.,LTD: PRODUCTS/SOLUTIONS/SERVICES OFFERED
  • TABLE 181 VESTA NUTRA: COMPANY OVERVIEW
  • TABLE 182 VESTA NUTRA: PRODUCTS/SOLUTIONS/SERVICES OFFERED
  • TABLE 183 RICHEN NUTRITIONAL TECHNOLOGY CO., LTD.: COMPANY OVERVIEW
  • TABLE 184 RICHEN NUTRITIONAL TECHNOLOGY CO., LTD.: PRODUCTS/SOLUTIONS/SERVICES OFFERED
  • TABLE 185 RICHEN NUTRITIONAL TECHNOLOGY CO., LTD.: OTHER DEVELOPMENTS
  • TABLE 186 MENADIONA: COMPANY OVERVIEW
  • TABLE 187 MENADIONA: PRODUCTS/SOLUTIONS/SERVICES OFFERED
  • TABLE 188 MENADIONA: PRODUCT LAUNCHES AND DEVELOPMENTS
  • TABLE 189 GENOFOCUS: COMPANY OVERVIEW
  • TABLE 190 GENOFOCUS: PRODUCTS/SOLUTIONS/SERVICES OFFERED
  • TABLE 191 GENOFOCUS: PRODUCT LAUNCHES AND DEVELOPMENTS
  • TABLE 192 ANGELYEAST CO., LTD.: COMPANY OVERVIEW
  • TABLE 193 ANGELYEAST CO., LTD.: PRODUCTS/SOLUTIONS/SERVICES OFFERED
  • TABLE 194 GENEFERM BIOTECHNOLOGY CO., LTD.: COMPANY OVERVIEW
  • TABLE 195 GENEFERM BIOTECHNOLOGY CO., LTD.: PRODUCTS/SOLUTIONS/SERVICES OFFERED
  • TABLE 196 NAKODA CHEMICALS LTD.: COMPANY OVERVIEW
  • TABLE 197 NAKODA CHEMICALS LTD.: PRODUCTS/SOLUTIONS/SERVICES OFFERED
  • TABLE 198 HAIHANG INDUSTRY: COMPANY OVERVIEW
  • TABLE 199 HAIHANG INDUSTRY: PRODUCTS/SOLUTIONS/SERVICES OFFERED
  • TABLE 200 CHEMICEA LIMITED: COMPANY OVERVIEW
  • TABLE 201 CHEMICEA LIMITED: PRODUCTS/SOLUTIONS/SERVICES OFFERED
  • TABLE 202 KYOWA HAKKO U.S.A., INC.: BUSINESS OVERVIEW
  • TABLE 203 KYOWA HAKKO U.S.A., INC.: PRODUCTS/SOLUTIONS/SERVICES OFFERED
  • TABLE 204 SEEBIO BIOTECH (SHANGHAI) CO., LTD.: COMPANY OVERVIEW
  • TABLE 205 MAGNESIA GMBH: COMPANY OVERVIEW
  • TABLE 206 FALCON TRADING INTERNATIONAL: COMPANY OVERVIEW
  • TABLE 207 ABCO INDIA: COMPANY OVERVIEW
  • TABLE 208 ACT: COMPANY OVERVIEW
  • TABLE 209 ADJACENT MARKETS TO VITAMIN K2 MARKET
  • TABLE 210 DIETARY SUPPLEMENTS MARKET, BY REGION, 2018–2022 (USD MILLION)
  • TABLE 211 DIETARY SUPPLEMENTS MARKET, BY REGION, 2023–2028 (USD MILLION)
  • TABLE 212 VITAMINS MARKET, BY REGION, 2017–2022 (USD MILLION)
  • TABLE 213 VITAMINS MARKET, BY REGION, 2023–2028 (USD MILLION)
LIST OF FIGURES
 
  • FIGURE 1 VITAMIN K2 MARKET: RESEARCH DESIGN
  • FIGURE 2 VITAMIN K2 MARKET SIZE ESTIMATION: TOP-DOWN APPROACH
  • FIGURE 3 VITAMIN K2 MARKET SIZE CALCULATION: SUPPLY-SIDE ANALYSIS
  • FIGURE 4 VITAMIN K2 MARKET SIZE ESTIMATION: BOTTOM-UP APPROACH
  • FIGURE 5 DATA TRIANGULATION
  • FIGURE 6 INDICATORS OF RECESSION
  • FIGURE 7 GLOBAL INFLATION RATE, 2012–2022
  • FIGURE 8 GLOBAL GROSS DOMESTIC PRODUCT, 2012–2022 (USD TRILLION)
  • FIGURE 9 RECESSION INDICATORS AND THEIR IMPACT ON VITAMIN K2 MARKET
  • FIGURE 10 GLOBAL VITAMIN K2 MARKET: CURRENT FORECAST VS. RECESSION FORECAST
  • FIGURE 11 MK-7 SEGMENT TO HOLD LARGER MARKET SIZE IN 2024
  • FIGURE 12 POWDER AND CRYSTALLINE TO BE LARGEST APPLICATION FORM SEGMENT IN 2024
  • FIGURE 13 NATURAL SOURCE SEGMENT TO DOMINATE MARKET IN 2024
  • FIGURE 14 PHARMACEUTICALS APPLICATION SEGMENT TO EXHIBIT HIGHEST CAGR DURING FORECAST PERIOD
  • FIGURE 15 ASIA PACIFIC HELD LARGEST MARKET SHARE IN 2023
  • FIGURE 16 GROWING CONSUMER PREFERENCES FOR NATURAL AND ORGANIC PRODUCTS TO DRIVE DEMAND FOR VITAMIN K2
  • FIGURE 17 MK-7 SEGMENT AND CHINA TO ACCOUNT FOR SIGNIFICANT MARKET SHARES IN 2024
  • FIGURE 18 US ACCOUNTED FOR LARGEST SHARE IN 2023
  • FIGURE 19 MK-7 SEGMENT TO DOMINATE MARKET DURING FORECAST PERIOD
  • FIGURE 20 POWDER AND CRYSTALLINE SEGMENT TO LEAD MARKET DURING FORECAST PERIOD
  • FIGURE 21 NATURAL SEGMENT TO ACCOUNT FOR LARGER MARKET SIZE DURING FORECAST PERIOD
  • FIGURE 22 HEALTH SUPPLEMENTS SEGMENT TO DOMINATE MARKET DURING FORECAST PERIOD
  • FIGURE 23 GLOBAL POPULATION GROWTH, 1950–2050 (BILLION)
  • FIGURE 24 GDP GROWTH, 2016–2023 (USD TRILLION)
  • FIGURE 25 GLOBAL TRENDS IN DEATHS DUE TO CVD, 1990-2030
  • FIGURE 26 VITAMIN K2 MARKET: MARKET DYNAMICS
  • FIGURE 27 OECD HEALTH SPENDING AS SHARE OF GDP, 2017–2021
  • FIGURE 28 GLOBAL EXPANSION OF VITAMIN K2 RESEARCH OVER THREE DECADES (1990-2020)
  • FIGURE 29 VITAMIN K2 MARKET: SUPPLY CHAIN ANALYSIS
  • FIGURE 30 VALUE CHAIN ANALYSIS: VITAMIN K2 MARKET
  • FIGURE 31 EXPORT VALUE OF VITAMINS AND THEIR DERIVATIVES (HS CODE 293629) FOR KEY COUNTRIES, 2019–2023 (USD THOUSAND)
  • FIGURE 32 IMPORT VALUE OF VITAMINS AND THEIR DERIVATIVES (HS CODE 293629) FOR KEY COUNTRIES, 2019–2023 (USD THOUSAND)
  • FIGURE 33 AVERAGE SELLING PRICE TREND, BY PRODUCT TYPE, 2020–2023 (USD/TON)
  • FIGURE 34 KEY PLAYERS IN VITAMIN K2 ECOSYSTEM
  • FIGURE 35 TRENDS/DISRUPTIONS IMPACTING CUSTOMERS’ BUSINESSES
  • FIGURE 36 NUMBER OF PATENTS GRANTED FOR VITAMIN K2 MARKET, 2013–2023
  • FIGURE 37 REGIONAL ANALYSIS OF PATENTS GRANTED FOR VITAMIN K2 MARKET, 2013–2023
  • FIGURE 38 PORTER’S FIVE FORCES ANALYSIS: VITAMIN K2 MARKET
  • FIGURE 39 INFLUENCE OF STAKEHOLDERS ON BUYING PROCESS FOR VITAMIN K2 PRODUCT TYPES
  • FIGURE 40 KEY BUYING CRITERIA FOR VITAMIN K2 PRODUCT TYPES
  • FIGURE 41 INVESTMENT AND FUNDING SCENARIO, 2019–2024 (USD MILLION)
  • FIGURE 42 MK-7 SEGMENT TO ACCOUNT FOR LARGEST MARKET SIZE DURING FORECAST PERIOD
  • FIGURE 43 POWDER AND CRYSTALLINE SEGMENT TO DOMINATE MARKET DURING FORECAST PERIOD
  • FIGURE 44 NATURAL SEGMENT TO ACCOUNT FOR LARGEST MARKET SIZE DURING FORECAST PERIOD
  • FIGURE 45 HEALTH SUPPLEMENTS SEGMENT TO ACCOUNT FOR LARGEST MARKET SIZE DURING FORECAST PERIOD
  • FIGURE 46 ITALY TO GROW AT HIGHEST CAGR DURING FORECAST PERIOD
  • FIGURE 47 INFLATION IN NORTH AMERICA: COUNTRY-LEVEL DATA, 2017–2022
  • FIGURE 48 NORTH AMERICA: VITAMIN K2 MARKET, RECESSION IMPACT ANALYSIS
  • FIGURE 49 EUROPE: VITAMIN K2 MARKET SNAPSHOT
  • FIGURE 50 INFLATION IN EUROPE: COUNTRY-LEVEL DATA, 2017-2022
  • FIGURE 51 EUROPE: VITAMIN K2 MARKET, RECESSION IMPACT ANALYSIS
  • FIGURE 52 ASIA PACIFIC VITAMIN K2 MARKET SNAPSHOT
  • FIGURE 53 INFLATION IN ASIA PACIFIC: COUNTRY-LEVEL DATA, 2017-2022
  • FIGURE 54 ASIA PACIFIC: VITAMIN K2 MARKET, RECESSION IMPACT ANALYSIS
  • FIGURE 55 INFLATION IN ROW, COUNTRY-LEVEL DATA, 2017-2022
  • FIGURE 56 ROW: VITAMIN K2 MARKET, RECESSION IMPACT ANALYSIS
  • FIGURE 57 REVENUE ANALYSIS FOR KEY COMPANIES IN LAST THREE YEARS, 2021–2023 (USD MILLION)
  • FIGURE 58 SHARE OF LEADING COMPANIES IN VITAMIN K2 MARKET, 2023
  • FIGURE 59 COMPANY VALUATION OF KEY VITAMIN K2 VENDORS, 2023 (USD BILLION)
  • FIGURE 60 EV/EBITDA OF KEY COMPANIES, 2023
  • FIGURE 61 BRAND/PRODUCT COMPARISON ANALYSIS, BY PRODUCT TYPE
  • FIGURE 62 VITAMIN K2 MARKET: COMPANY EVALUATION MATRIX (KEY PLAYERS), 2023
  • FIGURE 63 VITAMIN K2 MARKET: COMPANY FOOTPRINT
  • FIGURE 64 VITAMIN K2 MARKET: COMPANY EVALUATION MATRIX (STARTUPS/SMES), 2023
  • FIGURE 65 KAPPA BIOSCIENCE AS (BALCHEM CORP.): COMPANY SNAPSHOT
  • FIGURE 66 J-OIL MILLS, INC.: COMPANY SNAPSHOT
  • FIGURE 67 NOVOZYMES A/S: COMPANY SNAPSHOT
  • FIGURE 68 BASF SE: COMPANY SNAPSHOT


The study involved in estimating the current size of the vitamin k2 market. Exhaustive secondary research was done to collect information on the market, peer, and parent markets. The next step was to validate these findings, assumptions, and sizing with industry experts across the value chain through primary research. Both top-down and bottom-up approaches were employed to estimate the complete market size. After that, market breakdown and data triangulation were used to estimate the market size of segments and subsegments.

Secondary Research

This research study involved the extensive use of secondary sources—directories and databases such as Bloomberg Businessweek and Factiva—to identify and collect information useful for a technical, market-oriented, and commercial study of the vitamin k2 market.

In the secondary research process, various sources such as annual reports, press releases & investor presentations of companies, white papers, food journals, certified publications, articles from recognized authors, directories, and databases, were referred to identify and collect information.

Secondary research was mainly used to obtain key information about the industry’s supply chain, the total pool of key players, and market classification and segmentation as per the industry trends to the bottom-most level, regional markets, and key developments from both market- and technology-oriented perspectives.

Primary Research

Extensive primary research was conducted after obtaining information regarding the vitamin k2 market scenario through secondary research. Several primary interviews were conducted with market experts from both the demand and supply sides across major countries of North America, Europe, Asia Pacific, and the Rest of the World. Primary data was collected through questionnaires, emails, and telephonic interviews. The primary sources from the supply side included various industry experts, such as Chief X Officers (CXOs), Vice Presidents (VPs), Directors from business development, marketing, research, and development teams, and related key executives from distributors, and key opinion leaders. Primary interviews were conducted to gather insights such as market statistics, data on revenue collected from the products, market breakdowns, market size estimations, market forecasting, and data triangulation. Primary research also helped in understanding the various trends related to vitamin k2 product type, form, source, application, function, and region. Stakeholders from the demand side, such as pharmaceutical and food  & beverage manufacturers who use vitamin K2, were interviewed to understand the buyer’s perspective on the suppliers, products, and their current usage of vitamin k2 and the outlook of their business, which will affect the overall market.
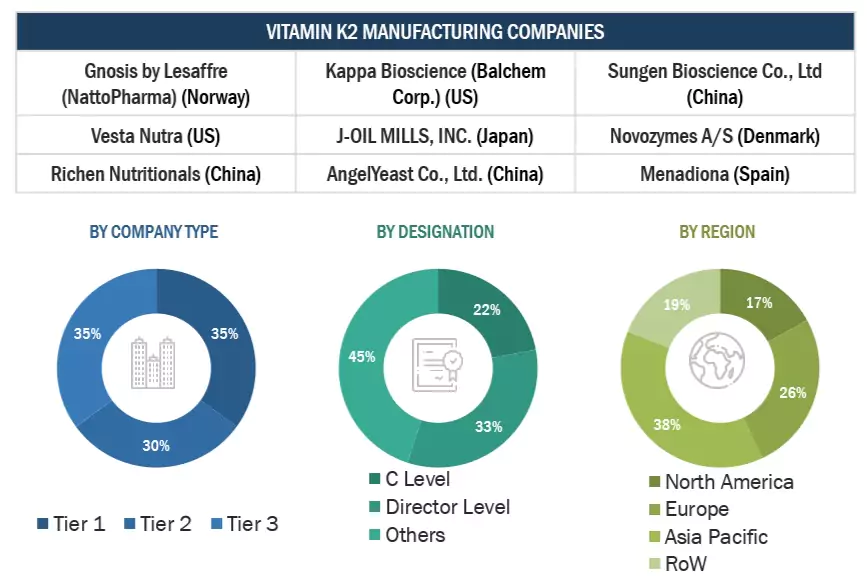
Vitamin K2 Market Size, and Share

To know about the assumptions considered for the study, download the pdf brochure

COMPANY NAME

designation

Gnosis by Lesaffre (NattoPharma) (Norway)

Regional Sales Manager

Kappa Bioscience (Balchem Corp.) (US)

Marketing Manager

Sungen Bioscience Co., Ltd (China)

General Manager

Vesta Nutra (US)

Sales Manager

J-OIL MILLS, INC. (Japan)

Sales Manager

Novozymes A/S (Denmark)

Sales Executive

Vitamin K2 Market Size Estimation

Both the top-down and bottom-up approaches were used to estimate and validate the total market size. These approaches were also used to estimate the size of various dependent submarkets. The research methodology used to estimate the market size includes the following:

  • The key players in the industry and markets were identified through extensive secondary research.
  • All shares, splits, and breakdowns were determined using secondary sources and verified through primary sources.
  • All possible parameters that affect the markets covered in this research study were accounted for, viewed in extensive detail, verified through primary research, and analyzed to obtain the final quantitative and qualitative data.
  • The research included the study of reports, reviews, and newsletters of top market players, along with extensive interviews for opinions from leaders, such as CEOs, directors, and marketing executives.

Global Vitamin K2 Market: Bottom-Up Approach.
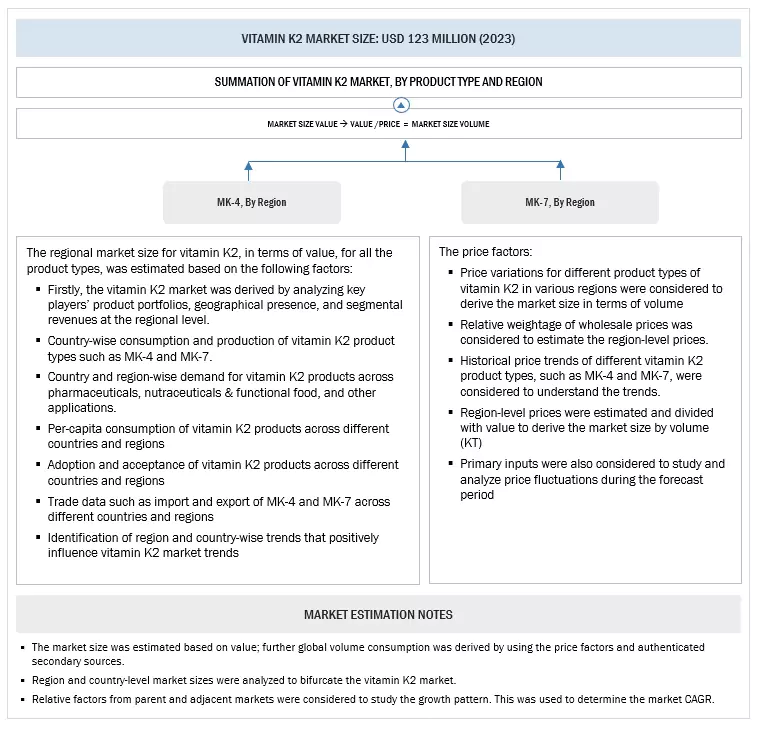
Vitamin K2 Market Bottom Up Approach

To know about the assumptions considered for the study, Request for Free Sample Report

Global Vitamin K2 Market: Top-Down Approach.
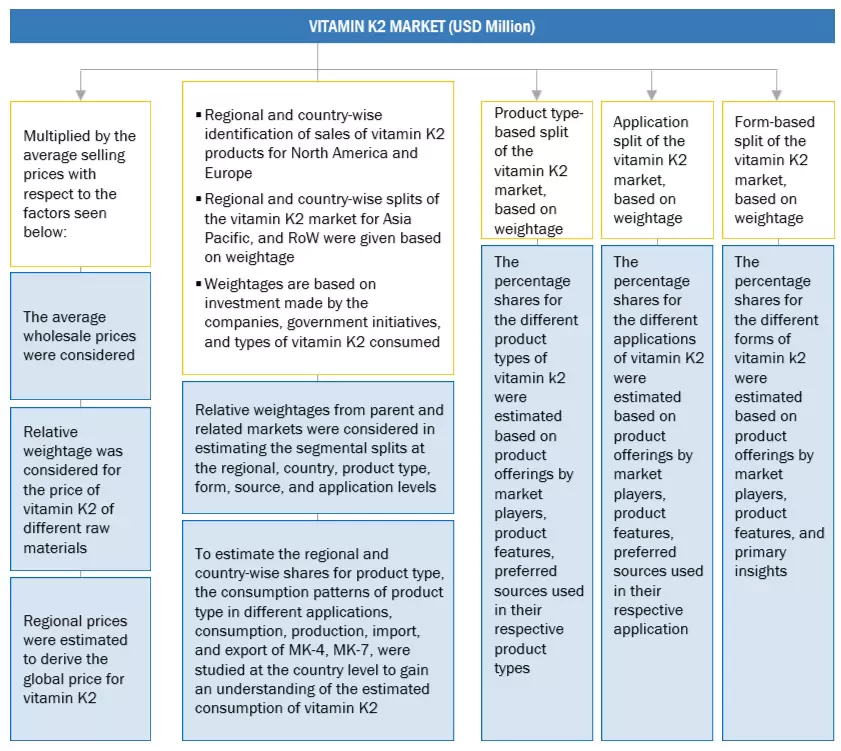
Vitamin K2 Market Top Down Approach

Data Triangulation

After arriving at the overall market size from the estimation process explained above, the total market was split into several segments and subsegments. To estimate the overall vitamin k2 market and arrive at the exact statistics for all segments and subsegments, data triangulation and market breakdown procedures were employed, wherever applicable. The data was triangulated by studying various factors and trends from the demand and supply sides. Along with this, the market size was validated using both the top-down and bottom-up approaches.

Market Definition

According to the National Institutes of Health (NIH) Office of Dietary Supplements (ODS), Vitamin K2, also called menaquinone (MK), is one of a group of fat-soluble vitamins that play a role in blood clotting and bone health. MK-4 and MK-7 are two specific subtypes of vitamin K2, also known as menaquinone. Both MK-4 and MK-7 are found naturally in some foods and can be taken as supplements. They both play a role in blood clotting and bone health by activating proteins like osteocalcin and matrix Gla protein (MGP).

Key Stakeholders

  • Raw material suppliers
  • Traders, distributors, and manufacturers & suppliers of vitamin k2
  • Food processors & food manufacturers
  • Government and research organizations
  • Trade associations and industry bodies
  • Regulatory bodies:
    • Food and Drug Administration (FDA)
    • European Commission
    • European Food Safety Authority (EFSA)
    • Food Standards Australia New Zealand (FSANZ)
    • European Communities
  • Associations, and commercial research & development (R&D) institutions:
  • Importers and exporters of vitamins
  • Global Alliance for Improved Nutrition (GAIN)
  • Food Fortification Initiative (FFI)
  • Food and Agriculture Organization (FAO)
  • United Nations International Children's Emergency Fund (UNICEF)
  • World Health Organization (WHO)
  • World Organization for Animal Health (WOAH)

Report Objectives

  • To define, segment, and forecast the global vitamin K2 market based on product types, forms, sources, function (qualitative), applications, and regions over a historical period from 2020 to 2023 and a forecast period from 2024 to 2029
  • To provide detailed information about the key factors influencing the market's growth (drivers, restraints, opportunities, and challenges).
  • To identify attractive opportunities in the market by determining the largest and fastest-growing segments across the regions.
  • To analyze the demand-side factors based on the following:
    • Impact of macro and microeconomic factors on the market
    • Shifts in demand patterns across different subsegments and regions
  • To strategically profile the key players and comprehensively analyze their core competencies.
  • To analyze competitive developments, such as partnerships, mergers & acquisitions, new product developments, and expansions & investments in the vitamin K2 market.

Available Customizations:

With the given market data, MarketsandMarkets offers customizations according to company-specific scientific needs.

The following customization options are available for the report:

Product Analysis

  • Product Matrix, which gives a detailed comparison of the product portfolio of each company.

Geographic Analysis

With the given market data, MarketsandMarkets offers customizations according to company-specific scientific needs.

  • Further breakdown of the Rest of the European vitamin k2 market into key countries
  • Further breakdown of the Rest of Asia Pacific vitamin k2 market into key countries

Company Information

  • Detailed analyses and profiling of additional market players (up to five)
Custom Market Research Services

We will customize the research for you, in case the report listed above does not meet with your exact requirements. Our custom research will comprehensively cover the business information you require to help you arrive at strategic and profitable business decisions.

Request Customization
Report Code
FB 9049
Published ON
Jun, 2024
Choose License Type
BUY NOW
  • SHARE
X
Request Customization
Speak to Analyst
Speak to Analyst
OR FACE-TO-FACE MEETING
PERSONALIZE THIS RESEARCH
  • Triangulate with your Own Data
  • Get Data as per your Format and Definition
  • Gain a Deeper Dive on a Specific Application, Geography, Customer or Competitor
  • Any level of Personalization
REQUEST A FREE CUSTOMIZATION
LET US HELP YOU!
  • What are the Known and Unknown Adjacencies Impacting the Vitamin K2 Market
  • What will your New Revenue Sources be?
  • Who will be your Top Customer; what will make them switch?
  • Defend your Market Share or Win Competitors
  • Get a Scorecard for Target Partners
CUSTOMIZED WORKSHOP REQUEST
knowledgestore logo

Want to explore hidden markets that can drive new revenue in Vitamin K2 Market?

Find Hidden Markets
  • Call Us
  • +1-888-600-6441 (Corporate office hours)
  • +1-888-600-6441 (US/Can toll free)
  • +44-800-368-9399 (UK office hours)
CONNECT WITH US
ABOUT TRUST ONLINE
©2024 MarketsandMarkets Research Private Ltd. All rights reserved
DMCA.com Protection Status
Website Feedback